Water Footprints of Vegetable Crop Wastage along the Supply Chain in Gauteng, South Africa
by
 , , and
Betsie Le Roux
1 ,
,
Michael Van der Laan
1,*,
Teunis Vahrmeijer
1,
John G. Annandale
1 and
Keith L. Bristow
2 1
Department of Plant and Soil Sciences, University of Pretoria, Private Bag X20, Hatfield 0028, South Africa
2
CSIRO Agriculture & Food, PMB Aitkenvale, Townsville, QLD 4814, Australia
*
Author to whom correspondence should be addressed.
Water 2018, 10(5), 539; https://doi.org/10.3390/w10050539
Submission received: 29 November 2017
/
Revised: 7 April 2018
/
Accepted: 10 April 2018
/
Published: 24 April 2018
(This article belongs to the Special Issue Progress in Water Footprint Assessment)
Abstract
:Food production in water-scarce countries like South Africa will become more challenging in the future because of the growing population and intensifying water shortages. Reducing food wastage is one way of addressing this challenge. The wastage of carrots, cabbage, beetroot, broccoli and lettuce, produced on the Steenkoppies Aquifer in Gauteng, South Africa, was estimated for each step along the supply chain from the farm to the consumer. Water footprints for these vegetables were used to determine the volume of water lost indirectly as a result of this wastage. Highest percentage wastage occurs at the packhouse level, which is consistent with published literature. Some crops like lettuce have higher average wastage percentages (38%) compared to other crops like broccoli (13%) and cabbage (14%), and wastage varied between seasons. Care should therefore be taken when applying general wastage values reported for vegetables. The classification of “waste” presented a challenge, because “wasted” vegetables are often used for other beneficial purposes, including livestock feed and composting. It was estimated that blue water lost on the Steenkoppies Aquifer due to vegetable crop wastage (4 Mm3 year−1) represented 25% of the estimated blue water volume that exceeded sustainable limits (17 Mm3 year−1).
1. Introduction
Ending hunger, achieving food security, improving nutrition and promoting sustainable agriculture is the second of the 17 Sustainable Development Goals (SDGs) [1]. South Africa has high levels of malnutrition, resulting in 27% of children under the age of five being stunted (low height for age); in addition, 12% are underweight (low weight for age), 5% are wasted (low weight for height), and 15% of infants are born with a low birth weight [2]. Food production is highly dependent on the availability of freshwater and is responsible for an estimated 86% of total freshwater used globally [3]. Freshwater is becoming an increasingly scarce resource, posing direct risks to food production, and already relies on the unsustainable use of groundwater. A study done by Wada, et al. [4] indicated that the global use of non-renewable groundwater abstractions increased by more than three times between the years 1960 and 2000. It was noted that for the year 2000, unsustainable use of groundwater supplied approximately 234 km3 year−1, which is 20% of the gross irrigation water demand. Climate change is expected to exacerbate the risks of water scarcity, while population growth puts further pressure on the agricultural sector to produce more food.
Water footprint (WF) assessments have been proposed as a way of improving water resource management. Allan (1998) introduced the term “virtual water”, indicating that economically and logistically it is more reasonable to import, for example, one tonne of grain instead of the 1000 tonnes of water required to produce the one tonne of grain. Hoekstra [5] further developed this concept of virtual water by saying that a nation’s WF, for example, does not only consist of locally sourced water used, but also includes the water used to produce the imported products that are consumed. In an agricultural context, a WF according to the Water Footprint Network (WFN) can be defined by the volume of water required to produce a certain mass of crop yield. Hoekstra, et al. [6] distinguish between blue, green and grey WFs. Surface and underground water resources, which are available to multiple users, are defined as blue water. In a crop production context, the blue WF therefore consists predominantly of the irrigation water applied. Green water is water originating from rainfall that is stored in the soil and is available for vegetation growth only. In order to account for water quality impacts, Hoekstra, Aldaya, Chapagain and Mekonnen [6] proposed the concept of a grey WF, which is the volume of water required to dilute emitted pollutants to ambient water quality levels. The WFs, according to the WFN, quantify water consumption along the entire production chain of products, processes, businesses and within nations or catchments [6].
Water management in South Africa is particularly challenging because of severe water shortages in most parts of the country and a highly variable climate [7]. In many catchments throughout South Africa, water supply no longer meets demand, and as surface water resources in South Africa are already almost fully developed, exploiting alternative sources will be done at significantly higher costs than previously [8]. Irrigated agriculture uses approximately 40% of South Africa’s exploitable runoff on around 1.7 million hectares of land [9]. Nieuwoudt, et al. [10] estimated that 90% of vegetable and fruit products are grown under irrigation in South Africa because of low and erratic rainfall and the high value of these crops. The vulnerability of food production in South Africa was emphasized by the drought of 2015 which was, according to the South African Weather Bureau, the driest calendar year since nationwide recordings started in 1904 [11].
There is therefore a need to find ways of producing more food with available water resources, and getting more of what is produced to consumers. Reducing food wastage is one way to increase food supplies without increasing the volume of freshwater required for production Lundqvist, et al. [12] reported that up to 50% of production can be lost between the field and consumer, or from “field to fork”. From a pilot study conducted by the World Wildlife Fund (WWF) and Woolworths in South Africa, it was estimated that only 26% of spinach that was produced was consumed. The remainder was wasted along the supply chain, mostly at the farm level (29%) and during packaging and processing (38%) [13].
There is very limited information published on wastage of specific vegetable crops. Nahman, et al. [14] studied the cost of household waste in South Africa, which arises from the actual value of the food that is wasted as well as from cost of disposing the food to landfill sites. They estimated the cost of food waste to be R32.5 billion, which represents 1.22% of South Africa’s annual GDP [14]. Oelofse and Nahman [15] estimated food wastage along the supply chain relative to production. Oelofse and Nahman [15] estimated that over 9 million tonnes of food waste are generated in South Africa per annum and that 177 kg of food was wasted per capita per year in 2007. Literature sources often report food wastage of different commodity groups, such as cereals, fruit and vegetables, and meat, and there is a lack of data on wastage of particular crops or crop types. Reasons for this may include a lack of record keeping by different stakeholders along the supply chain or an unwillingness to make these data easily available due to perceived sensitivities, for example, in terms of institutional reputation and competitiveness. In South Africa, food waste is regulated as part of waste management in general, and there is no legislation that obligates the recording of food wastage per se [13].
The aim of this study was to quantify indirect water losses through the wastage of crops produced in a major production region on the Steenkoppies Aquifer (Lat: 26.03° S to 26.19° S, Long: 27.65° E to 27.48° E; Altitude 1560 to 1650 m) located west of Tarlton in Gauteng, South Africa. Water footprints of the crops were used to determine the volumes of water associated with current food wastage. The Steenkoppies Aquifer is a dolomitic karst aquifer under stress due to increased competition from various stakeholders. As estimated by le Roux, et al. [16], current annual production on the aquifer requires 25 Mm3 of blue water, which exceeds sustainable limits of blue water abstractions by 17 Mm3. We determine whether reductions in food wastage, assuming this could lead to reductions in production, at the farm level, could provide a way to achieve sustainable water use on this aquifer. It is hypothesized that there will be an important difference between the wastage fractions for different vegetable crops due to differences in growth forms (above or below ground crops), harvesting, handling and processing techniques, marketable properties for each crop type, differences in shelf-life between crops, and exposure to various pests and diseases, which will translate into differences in indirect water losses through wastage.
2. Materials and Methods
2.1. Obtaining Data on Percentage Wastage along the Supply Chain
Measured or estimated data were obtained on the wastage of the main vegetable crops produced on the Steenkoppies Aquifer, namely, carrots (Daucus carota), beetroot (Beta vulgaris), cabbage and broccoli (Brassica oleracea) and lettuce (Lactuca sativa) at different stages along the supply chain. The stages along the supply chain included the packhouse level (which is on-farm), the market or distribution point, retail and consumer levels.
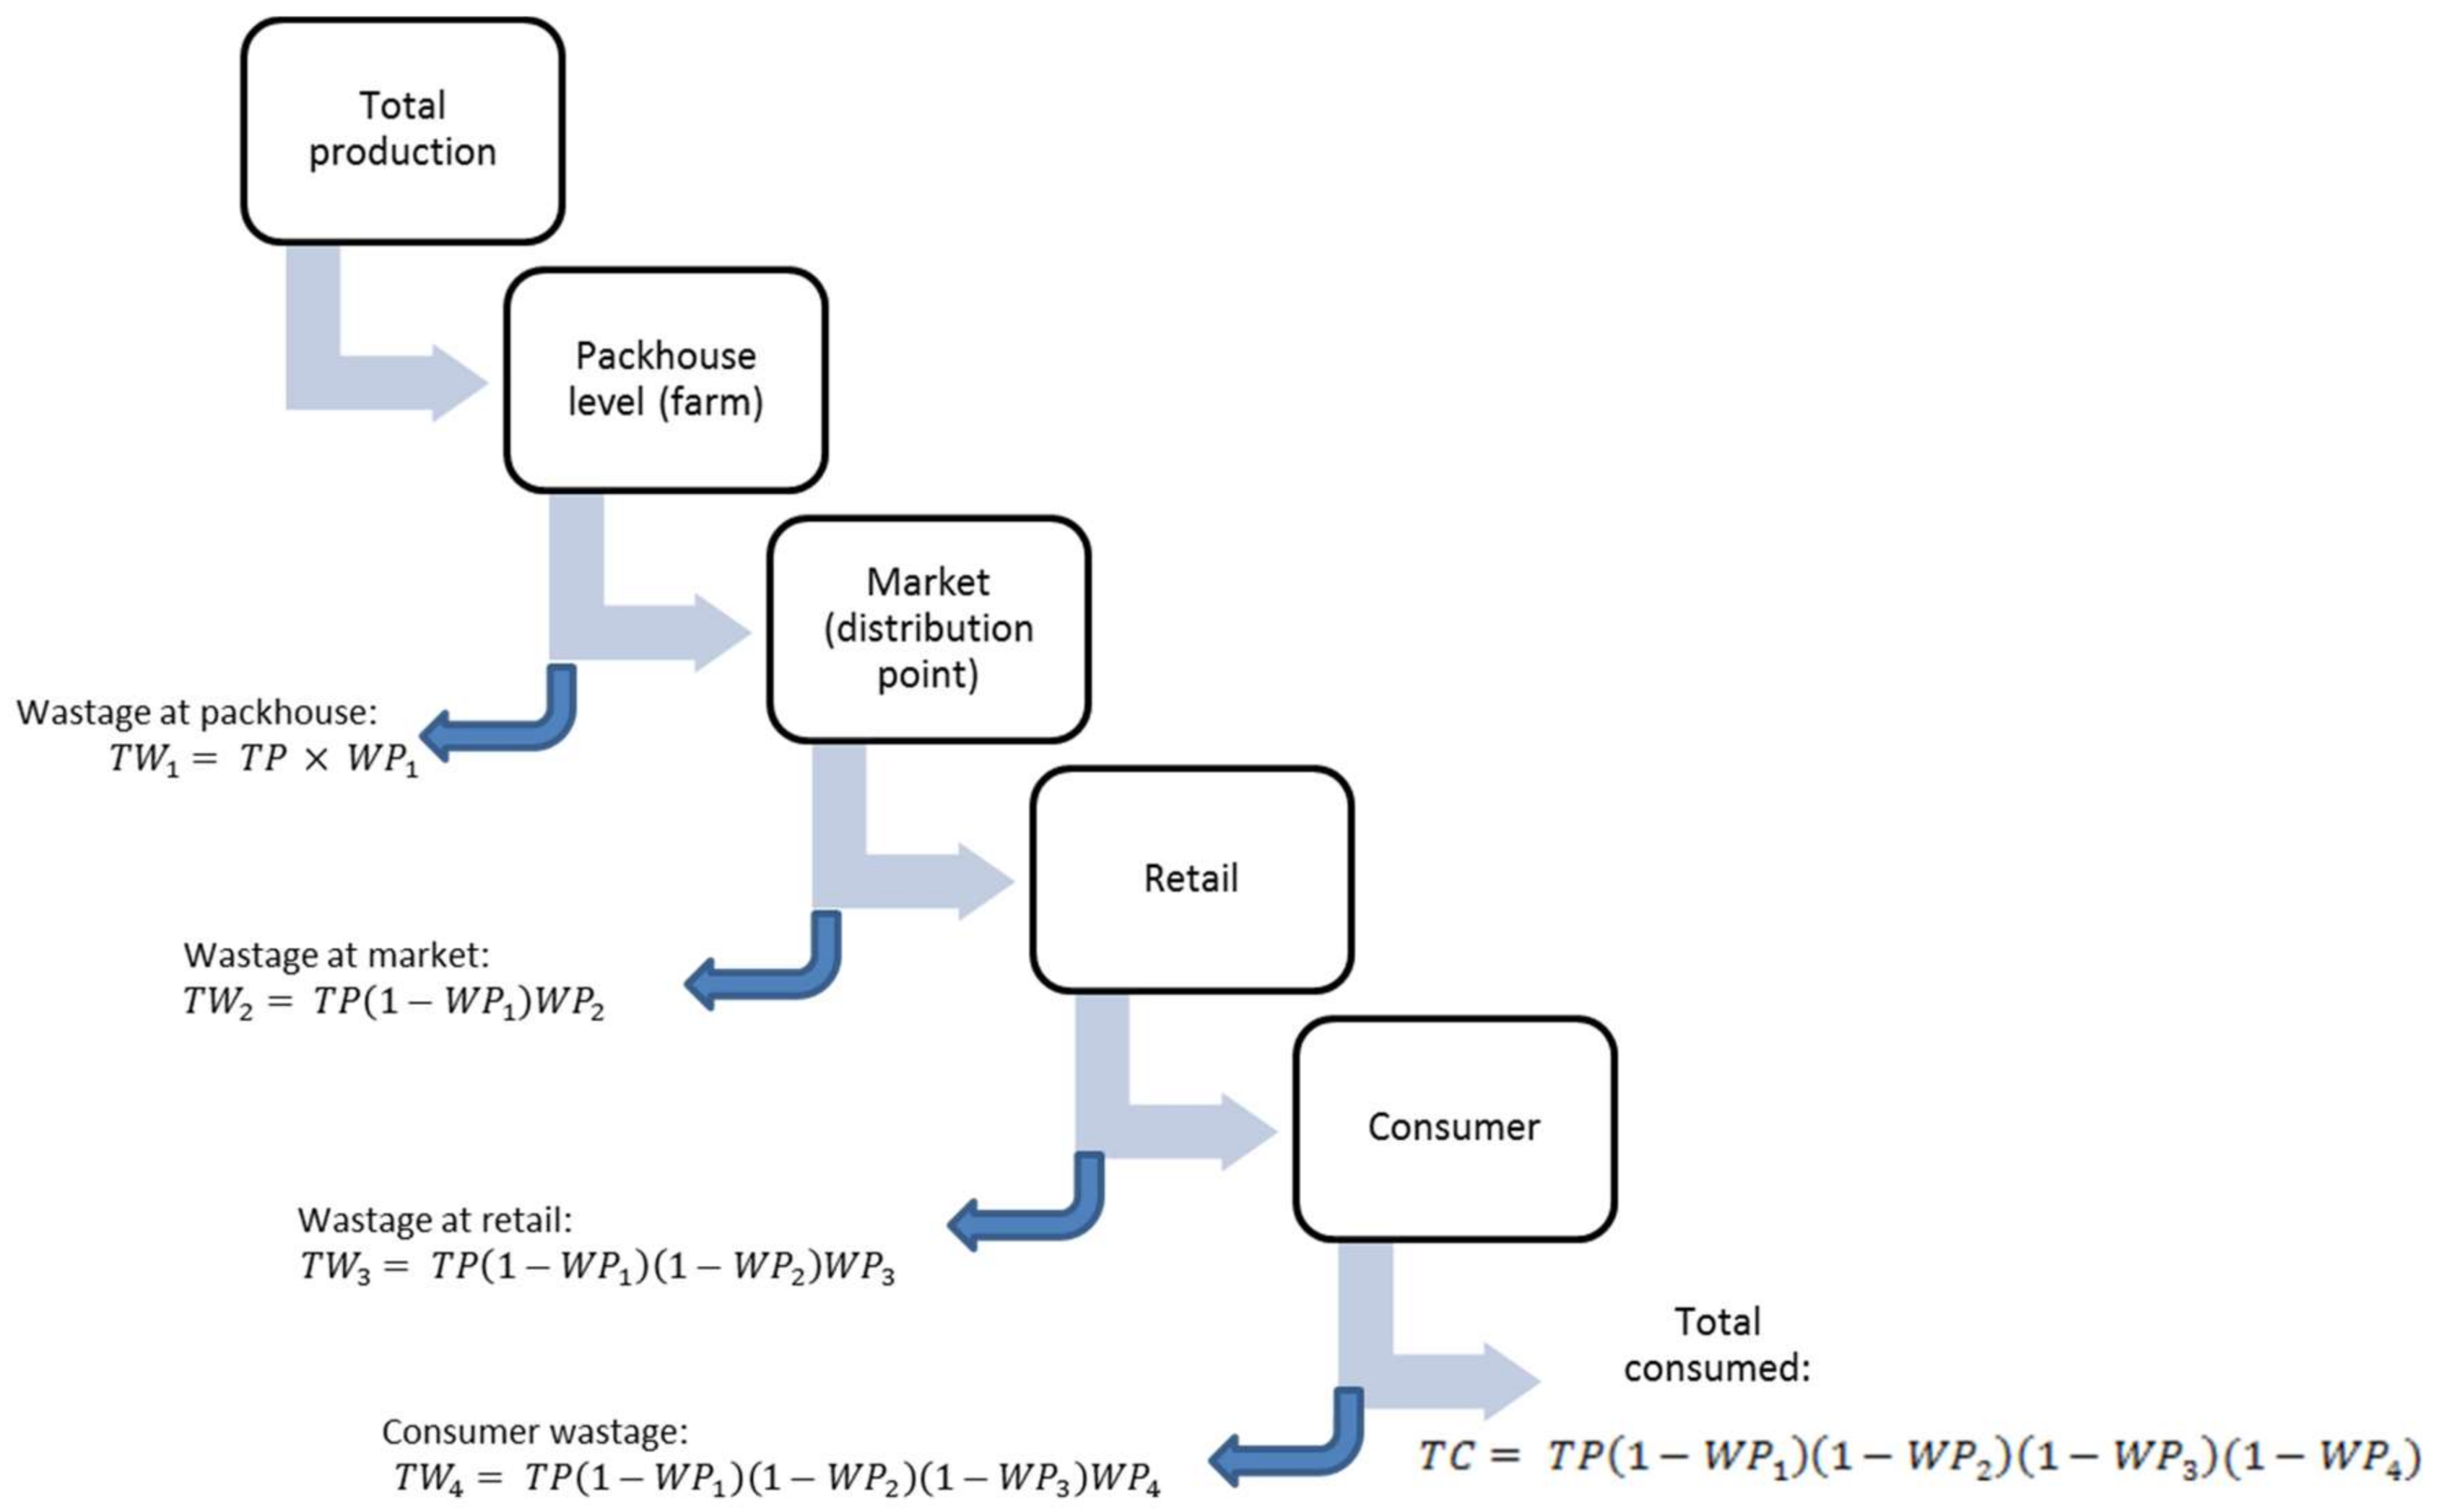
For each stage, the percentage wastage was normalised according to the volume of vegetables delivered to that particular stage. Therefore, the percentages did not represent total wastage along the supply chain, but for that stage only. Total production, which was derived from cropped areas on the Steenkoppies Aquifer [16,17], was then used to determine total wastage from field to fork. For each stage along the supply chain, wastage was determined by subtracting wastage at all preceding stages from total production and multiplying the remainder with the percentage wasted in that particular stage. These calculations are given in the equations below and are illustrated in Figure 1.
where TP is total production, TW is the total wastage (mass) and WP is the percentage wastage at a particular level along the supply chain. Subscripts 1, 2, 3 and 4 represent the packhouse, market, retail and consumer levels, respectively, and TC is the total amount (mass) consumed. Offcuts were not counted as wastage because they are not considered fit for human consumption and were not included in total production figures. Calculations were carried out for each crop separately in each of the four seasons (Summer: November to February; Autumn: March and April; Winter: May to August and Spring: September and October).
2.1.1. Wastage at the Packhouse Level
At the farm, there are three stages during which crop material can be discarded, namely:
- Discards at the planting stage, which represent seedlings that do not grow,
- Discards during growth stages, which represent crops that do not develop into a harvestable product,
- Discards at the packhouse, which represent vegetables that are not marketable.
Discards during planting and growing are not considered wastage for our purposes because these plants never develop into an edible product and are also not recorded as production. Seedlings use relatively little water and therefore do not have a significant impact on water resources [18]. Vegetables wasted at harvest represent an edible product and are therefore considered as food wastage.
Daily production reports for the year 2015 for a packhouse on a major farm on the Steenkoppies Aquifer provided the input and output volumes of carrots, cabbage and lettuce. The difference between input and output weights or volumes was assumed to equal wastage. Beetroot and broccoli are not packed on the Steenkoppies Aquifer, so data on wastage in the packhouse were not available for these two crops. Wastage of beetroot in the packhouse was assumed to be the same as that of carrots because both are root crops, and treatment in the packhouse will be similar. Wastage of broccoli in the packhouse was assumed to be the same as that of cabbage because these two crops are similar. Although cabbage and lettuce data were given as number of heads, they were used to calculate the percentage wastage at the packhouse, which was multiplied by total yield to provide total wastage in terms of weight. Therefore, all calculations on wastage for the remainder of the supply chain were performed in terms of weight.
2.1.2. Wastage at the Fresh Produce Market or Distribution Point
The Tshwane Fresh Produce Market (Lat: 25.74° S, Long: 28.17° E) provided data on all produce received daily from the Steenkoppies Aquifer as well as sold and discarded from July 2011 to July 2014 [19]. This market serves one of two key metropolitan centres in the region, namely, Pretoria, the capital city of South Africa and the Joburg Market, which services Johannesburg, South Africa’s economic capital. The data from the Tshwane Fresh Produce Market were highly detailed and reflected the specific masses of each vegetable received, sold and discarded for each farm on the Steenkoppies Aquifer.
2.1.3. Wastage at the Retailer Level
Despite efforts to obtain wastage data from multiple retailers in the region, quantitative data on wastage at the retail level were not available because retailers do not normally record produce losses, and those who do are unwilling to disclose the data. Theoretically, it can be assumed that the difference between products bought and sold by the retailer will be equal to the wastage. In reality it is more complicated because although the processing of vegetables into combined, “ready-to-use” packets reduces the percentage of food losses, it also complicates estimations of food losses. The quantities of specific vegetables in pre-packed products are not usually recorded. It was, therefore, not possible to record exactly how much of a particular vegetable was sold. Even if wasted products were weighed, there is the problem that the vegetables that are wasted often have much lower water contents than the fresh products as they begin to decompose, potentially underestimating the wastage in terms of the original mass of fresh product. Estimations of wastage at the retail level were therefore based on information obtained during several semi-structured interviews with experienced retailers.
2.1.4. Wastage by Consumers
2.2. Estimating the Water Footprints of the Wastage of Selected Vegetables
This study focusses on blue water footprints of wastage because it was determined that agriculture on the Steenkoppies Aquifer uses blue water unsustainably [16]. The volume of blue water lost due to the wastage of selected vegetables produced on the Steenkoppies Aquifer in a year was estimated using the WFs calculated by Le Roux, et al. [21]. These WFs followed the WFN methodology [6], represented the mean over ten years (2004–2013), and include only water used for production. The methods used to calculate these WFs are described by Le Roux, van der Laan, Vahrmeijer, Bristow and Annandale [21]. The WF aims to be a robust, simplified metric, and for that purpose it was assumed that the WFs are relevant for all years. Water footprints were determined for wastage, for each season specifically, at each step of the supply chain by multiplying the total wastage at each step with the blue crop WFs. Globally, according to Hoekstra and Chapagain [3], agriculture is responsible for 86% of water used. Therefore, additional water used at each stage along the supply chain, for example, water used for washing, was considered to be relatively low compared to water used for production and was excluded from this study. Potential savings in green water used through reductions in food wastage were assumed to be negligible because these crops replaced natural vegetation that would use green water anyway. Grey water was also excluded in this assessment.
3. Results
3.1. Estimation of Total Wastage
3.1.1. Wastage at the Packhouse Level
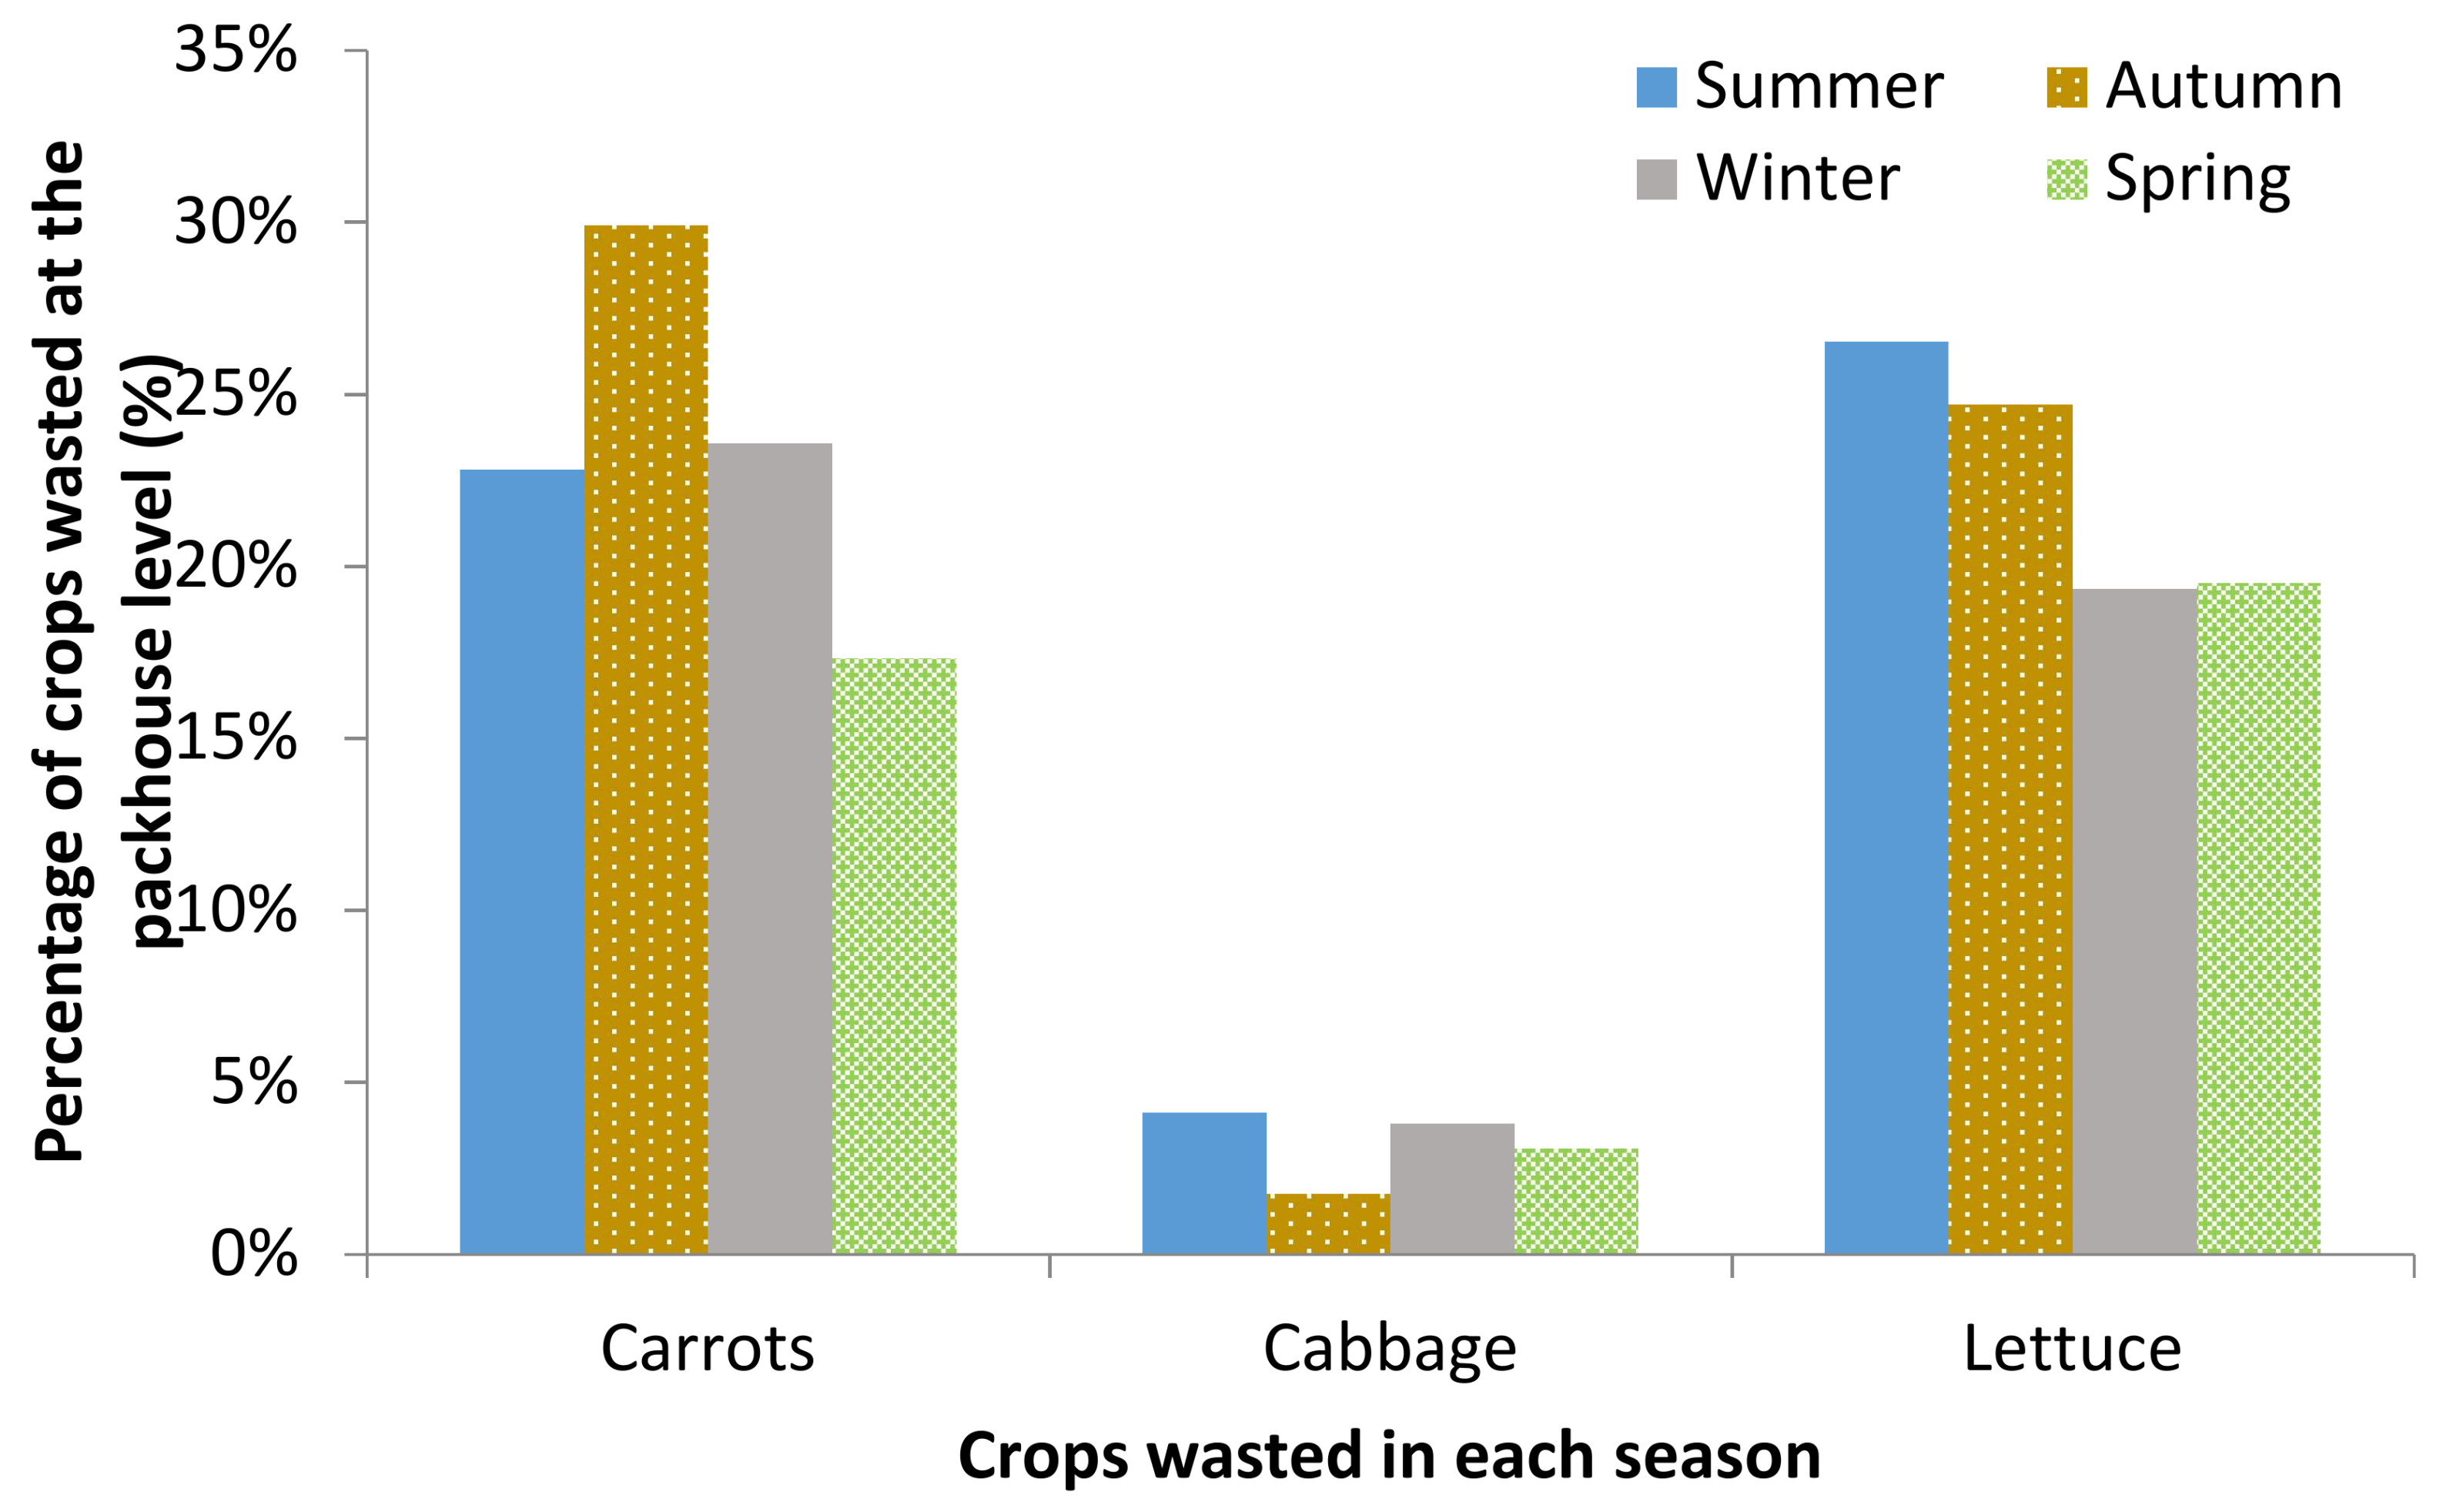
At the packhouse level, wastage is mostly due to pests and diseases or because crops have unmarketable characteristics. The farm that was assessed was the sole provider for a large supermarket group, and no cases have been reported where vegetables were wasted because of low demand or flooded markets. The percentages of carrots, cabbage and lettuce wasted at the packhouse level in each season are given in Figure 2. Compared to carrots and lettuce, the percentage wastage of cabbage in the packhouse is very low. Wastage during this stage is not closely correlated with seasons because the wastage is due more to unmarketable traits as opposed to rotting during this first stage.
The carrot production report was in kilograms of yield, while cabbage and lettuce were reported as “heads”. Carrots that are not marketable or sold include broken pieces that are too short to be marketed in a low value pack, as well as grossly malformed, cracked, extremely thick or thin carrots. In the case of cabbage and lettuce, most waste heads are edible except those with serious insect infestation and those that are rotten or decayed. Cabbage heads that are not marketable include those that have decay, worm damage, black rings, discolouration, dehydration, Anthropoda infestation and those with incorrect head sizes. Lettuce heads that are not marketable include those that have browning, decay, worms, sun scorch, deep cuts, incorrect sizes, malformation and bruising. The trimmed leaves and non-marketable vegetables are fed to the cattle on the farm.
3.1.2. Wastage at the Market/Distribution Point
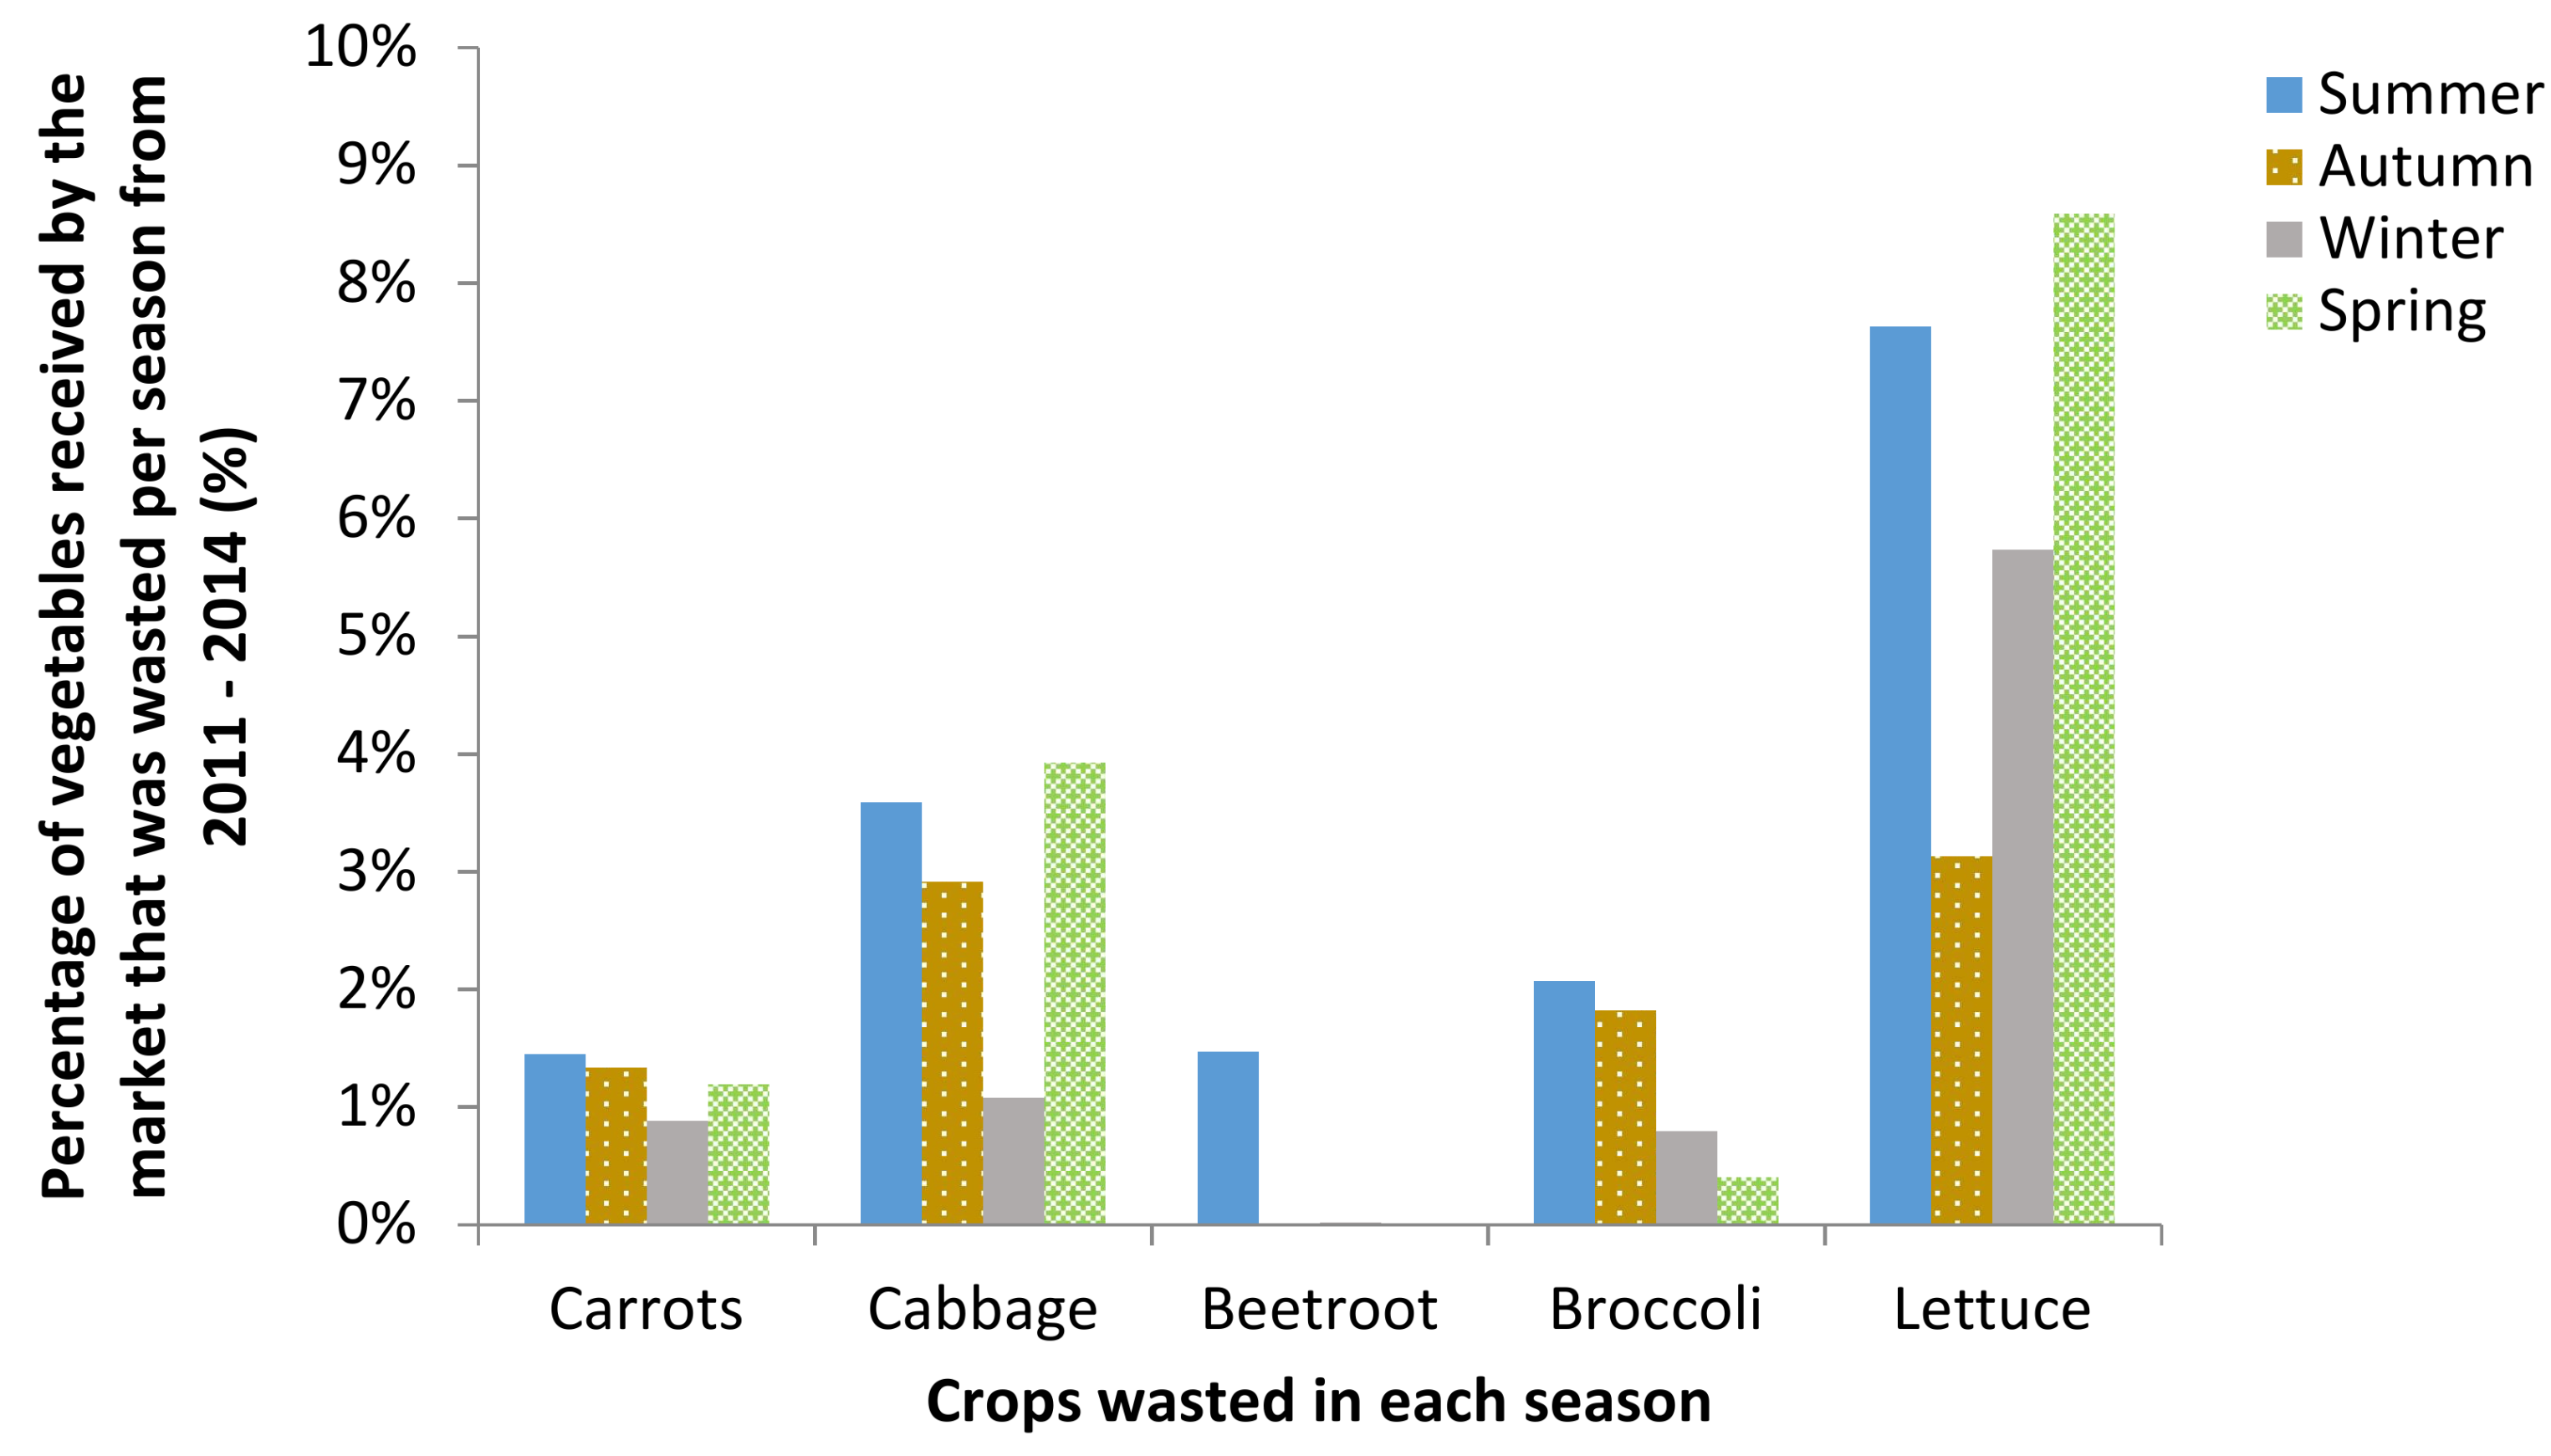
The percentage discarded in terms of what the market received from the Steenkoppies Aquifer for each crop in each season is presented in Figure 3. At this stage of the supply chain, wastage is due to rotting of the crops, which is why waste percentages are higher in summer and higher for more perishable crops, like lettuce. Wastage of beetroot is particularly low in all seasons, except for summer. Wasted products at the market are now used to make compost in a digester on site, which is a more recent development that was launched in 2014.
3.1.3. Wastage at the Retailer Level
Wastage at the retailers mostly occurs when vegetables reach the end of their sell-by date or shelf-life. Weather conditions impact food wastage at the retailer level, but management decisions also play an important role in terms of percentage food losses. Retailers that order too many vegetables once or twice a week generally have more losses than retailers who order fewer vegetables more often, even daily. Most green grocers cut and combine vegetables that approach the end of their shelf life into pre-packed products for salads, soups or stir-fry vegetables. In supermarkets, ageing vegetables are used to make salads and sandwiches in the supermarket delis. This greatly reduces food losses at the retail level, but in the case of lettuce, for example, there is a limit to how much salad or sandwiches can be sold in the deli, and wastage cannot be completely avoided. Wastage from the retailer is often given to soup kitchens, livestock farms or used for composting.
Carrots, cabbage, beetroot and broccoli have a relatively long shelf-life and wastage is generally low. According to experienced retailers [22,23,24], wastage of these vegetables at the retail level is between 1% and 5%. It was therefore assumed that wastage of these vegetables at the retailer is 5% in summer, 3% in autumn and spring and 1% in winter. Lettuce is more perishable and according to experienced retailers, average wastage of lettuce at the retail level is between 7% and 10%. It was therefore assumed that wastage of lettuce at the retailer is 10% in summer, 9% in autumn and spring and 7% in winter.
3.1.4. Wastage by Consumers
According to Gustavsson, Cederberg, Sonesson, Van Otterdijk and Meybeck [19], cited by Oelofse and Nahman [14], average wastage in South African households in terms of total production is 2% for roots and tubers and 5% for fruit and vegetables. Thus, the wastage of carrots and beetroot was assumed to be 2% of total production, and the wastage of cabbage, broccoli and lettuce was assumed to be 5% of total production at the household level. According to Nahman, De Lange, Oelofse and Godfrey [13], most wastage in South Africa occurs in low-income communities. This is because of the number of low-income households in South Africa, which is much higher than high-income households and does not reflect higher wastage per household in low income communities.
3.1.5. Total Wastage of Vegetables from the Steenkoppies Aquifer along the Supply Chain to the Consumer
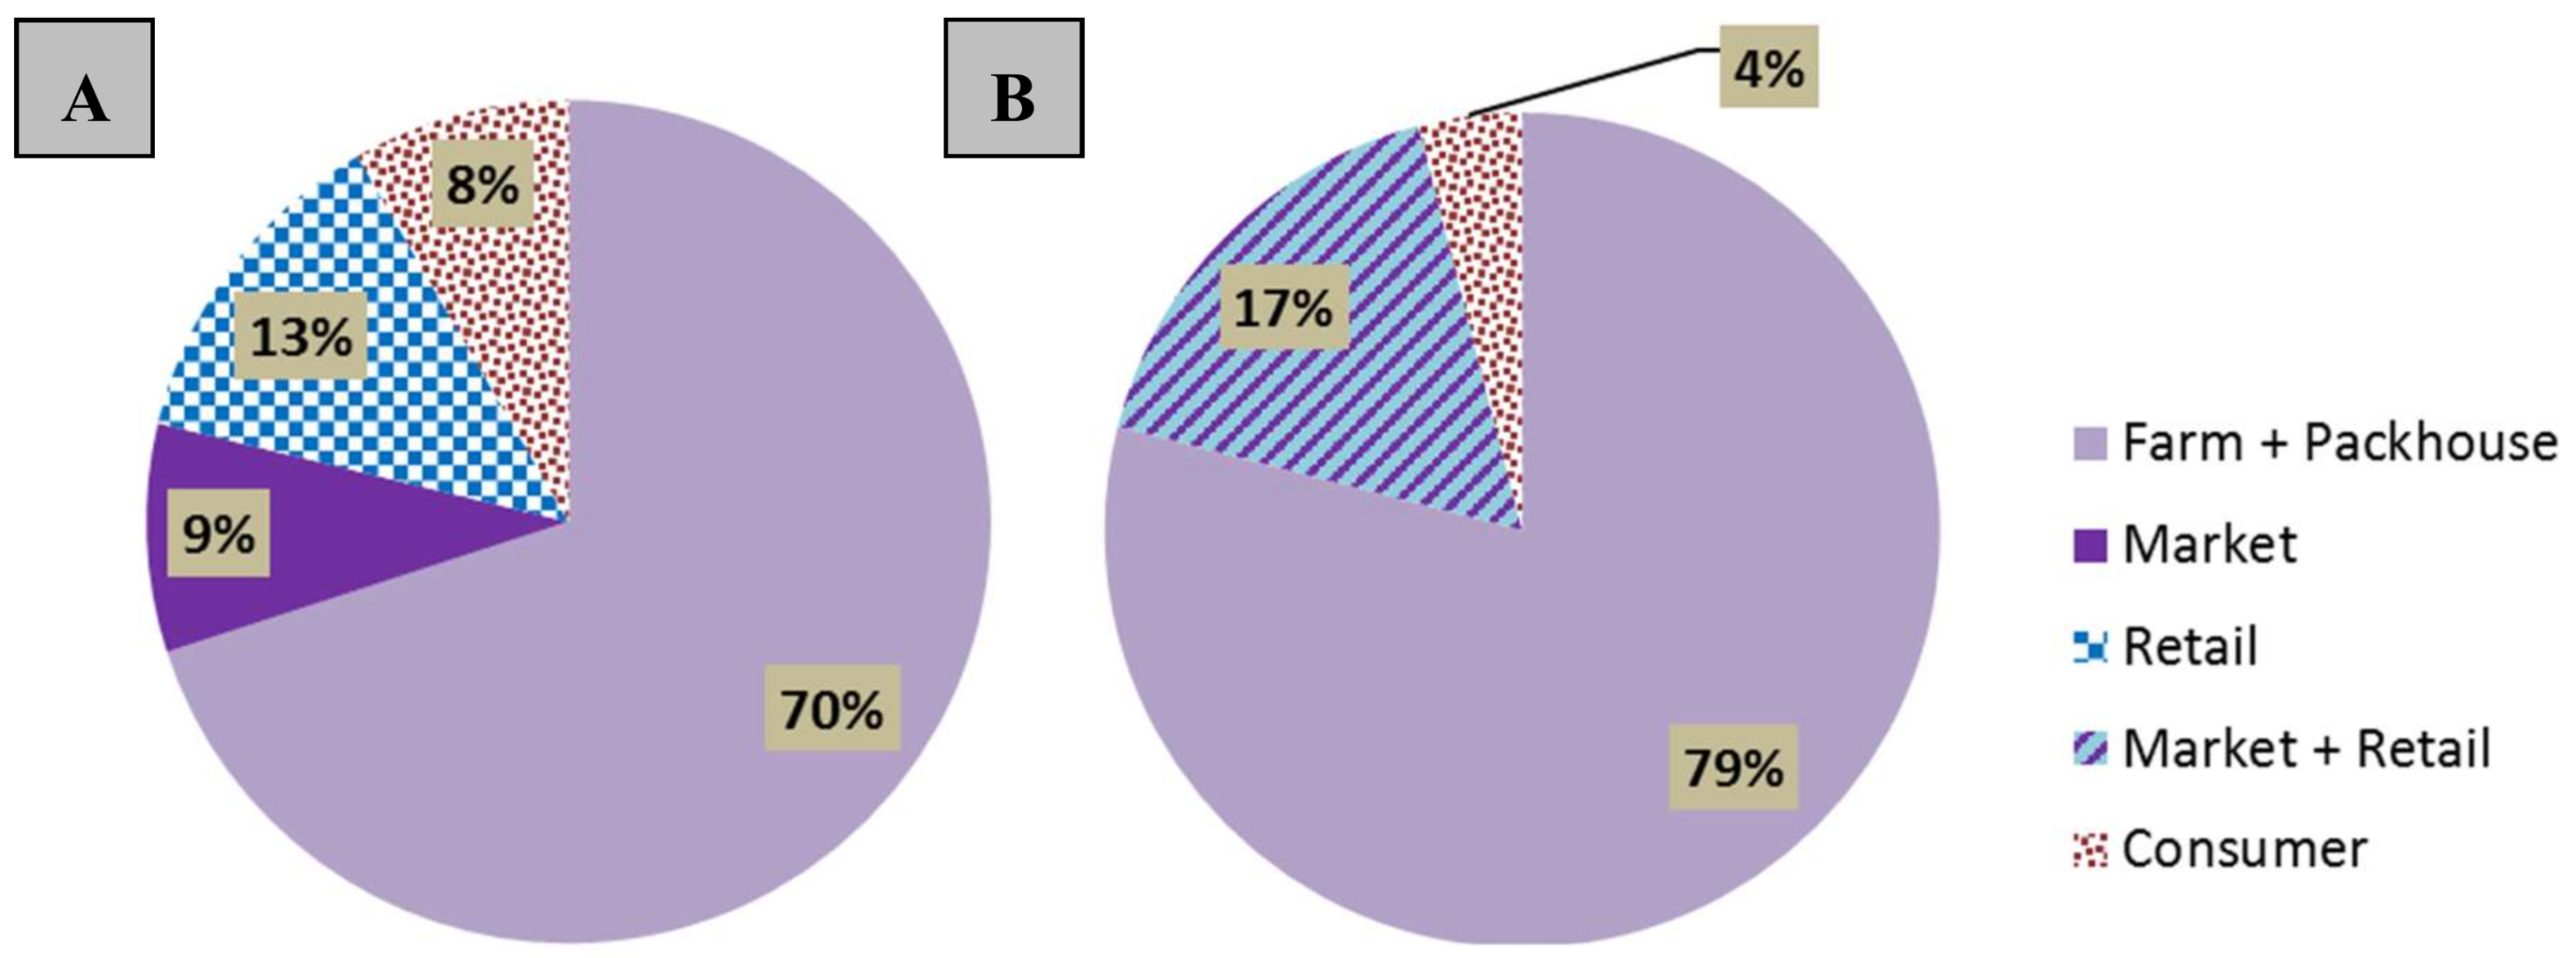
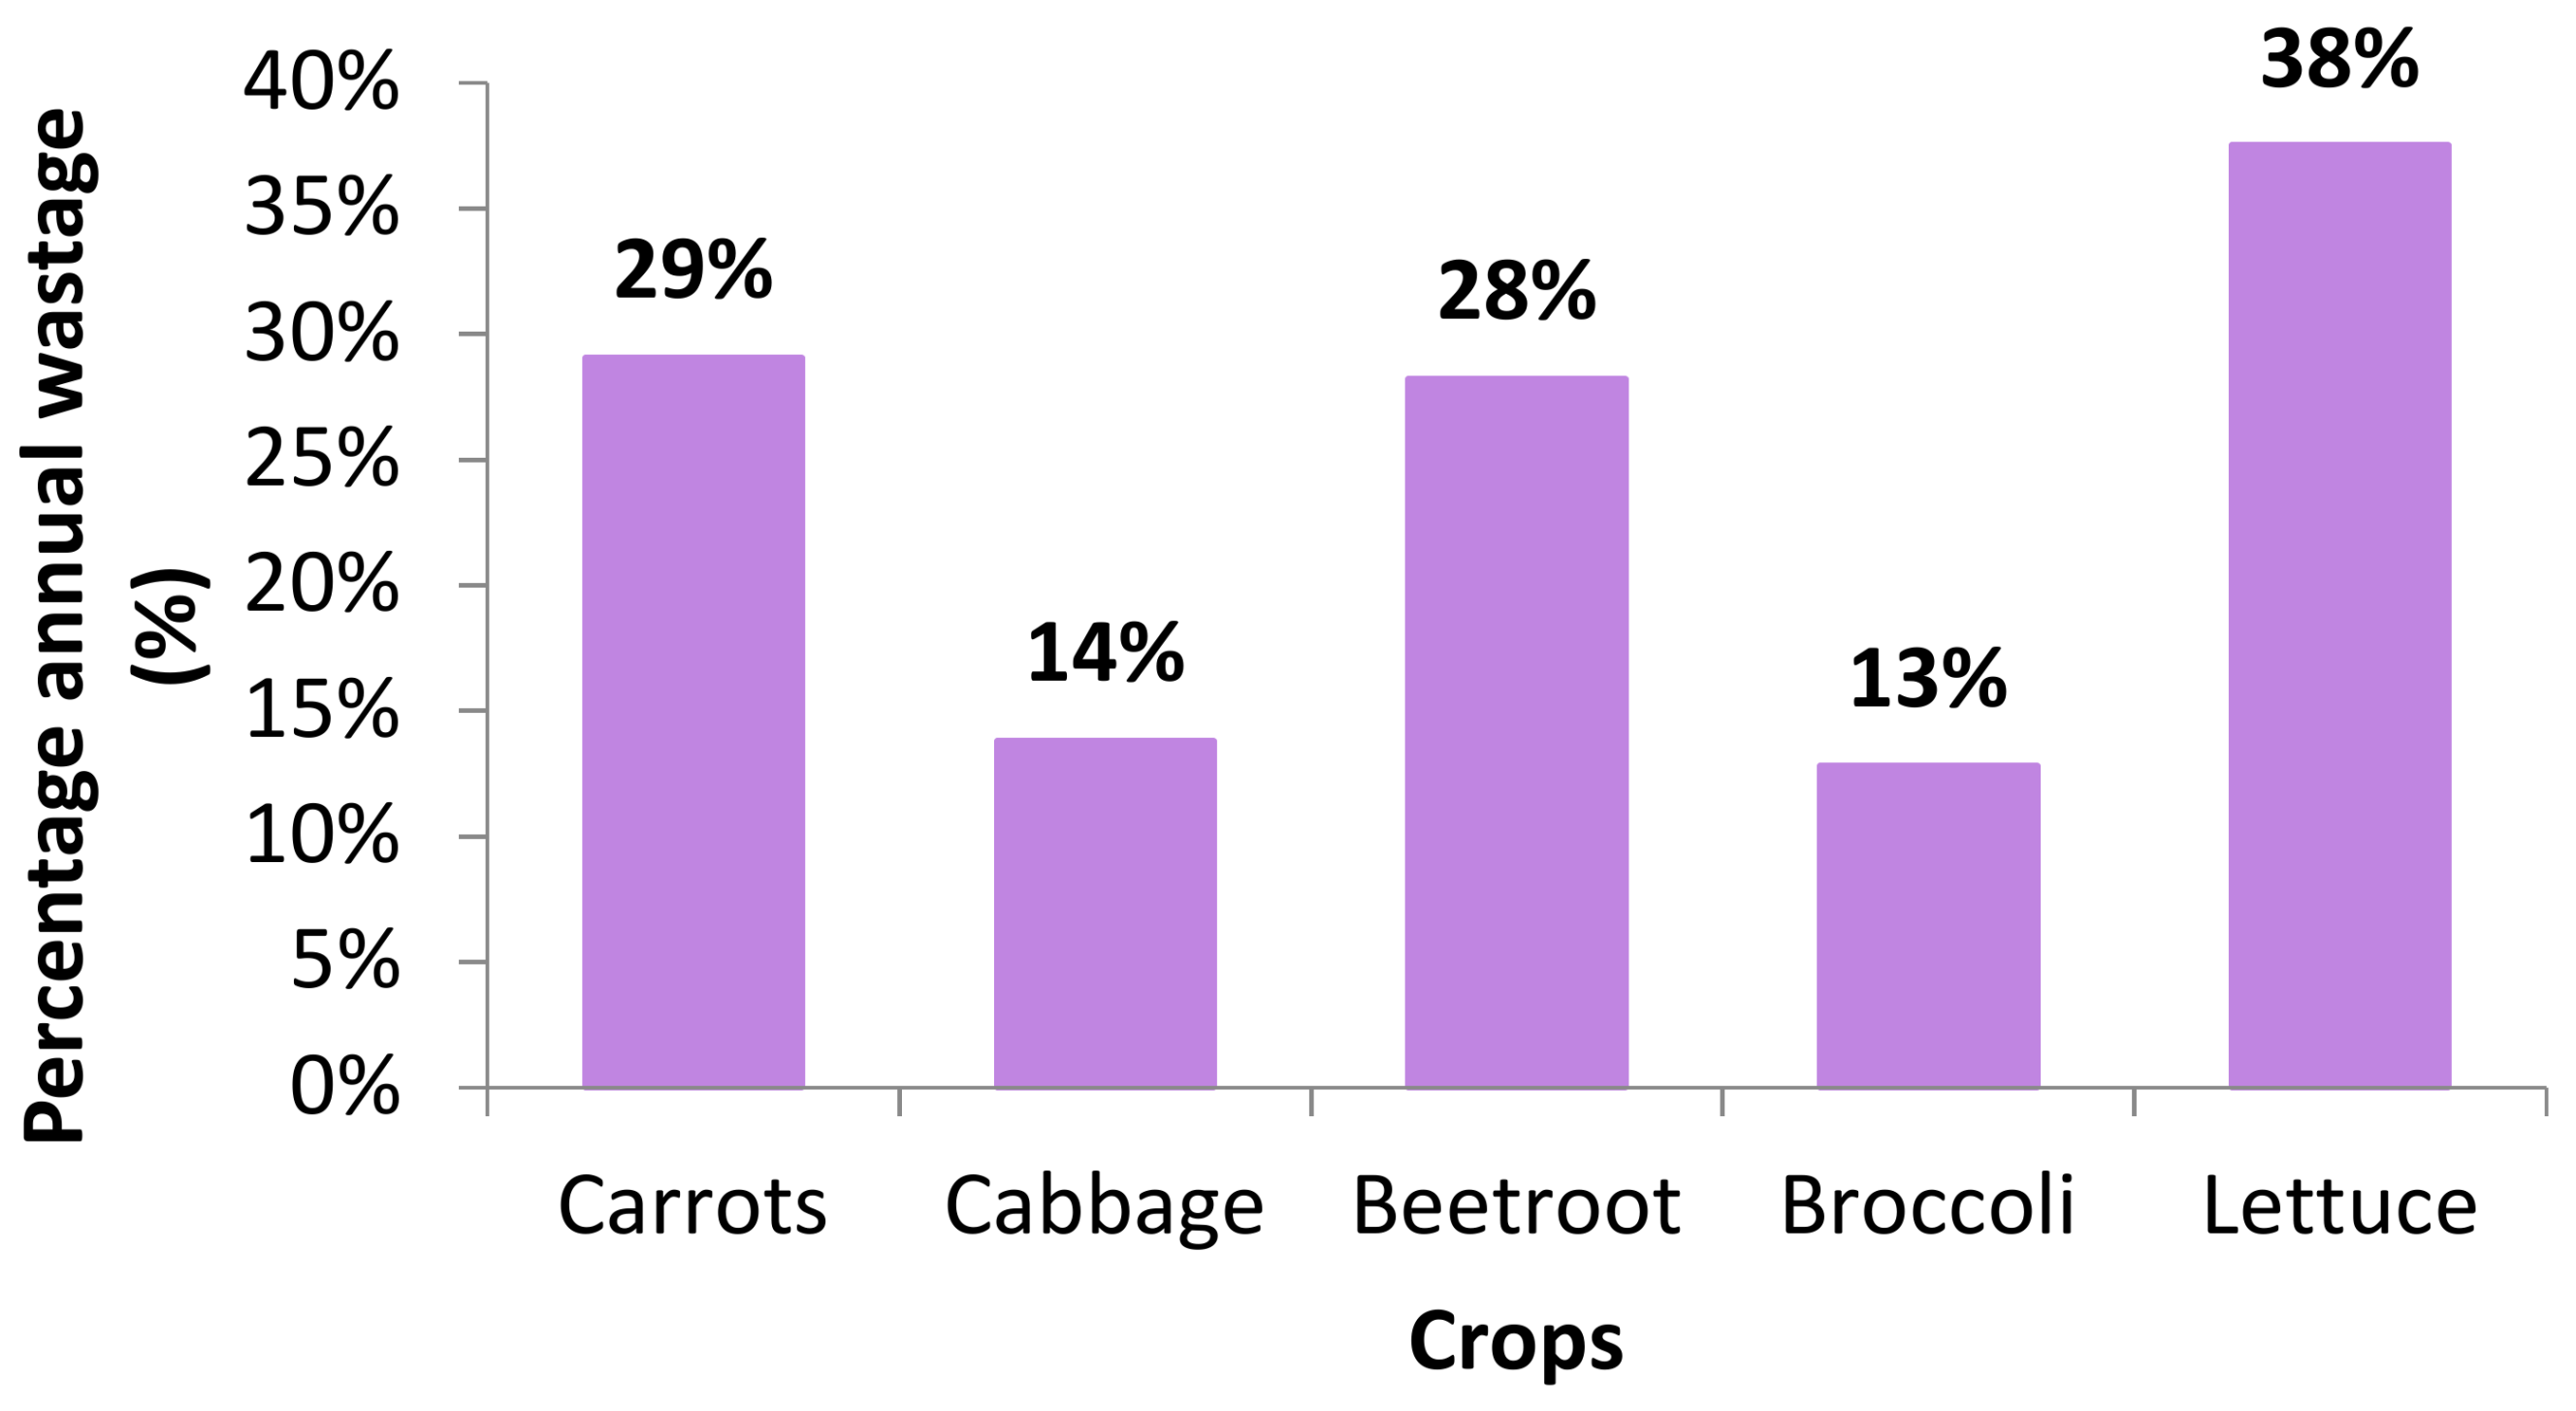
Table 1 summarises wastage at each stage of the supply chain in terms of the annual production of each vegetable on the Steenkoppies Aquifer. Wastage of cabbage and broccoli is relatively low because of the low percentage wastage in the packhouse and the generally longer shelf lives of these crops. Lettuce has the highest percentage wastage for all seasons (ranging from 33% in winter to 42% in summer) because of the high percentage wastage in the packhouse and the short shelf life of the crop. An estimated 29% of the annual production of carrots and beetroot (root vegetables) and 32% of the annual production of cabbage, broccoli and lettuce is lost due to wastage. This is much lower than that indicated by Oelofse and Nahman [15], who estimated annual wastage of 44% for roots and tubers and 51.5% for other vegetables in terms of average annual food production. The percentage wastage estimated by Oelofse and Nahman [15] was based on percentage wastage given by Gustavsson, Cederberg, Sonesson, Van Otterdijk and Meybeck [20] for sub-Saharan Africa. The percentage contribution to total wastage (including all five vegetables) at each step along the supply chain, as calculated in this study, is given in Figure 4A and is compared to the findings of food wastage along the supply chain in South Africa as published by Oelofse and Nahman [15] and given in Figure 4B. Oelofse and Nahman [15] estimated that 79% of total wastage occurs before distribution during agricultural production, post-harvest handling and storage, and processing and packaging. Our packhouse level data include all three of these losses combined. The average percentage wastage in the packhouse on the Steenkoppies Aquifer was 70% of total food wastage along the supply chain, which correlates well with estimates from Oelofse and Nahman [15]. Oelofse and Nahman [15] also reported wastage during distribution, which included our market and retail stages. Our percentage wastage for the market and retail stages was 9% and 12%, respectively, in terms of total wastage along the supply chain; the sum of these values correlates well with the 17% wastage during distribution reported by Oelofse and Nahman [15]. We estimate 8% wastage at the household level in terms of total wastage along the supply chain, compared to 4% estimated by Oelofse and Nahman [15]. There is, however, variation in average annual wastage between different crops, which varied from 13% for broccoli to 38% for lettuce, as illustrated in Figure 5.
High inter-seasonal variation in vegetable wastage was observed. For carrots and beetroot, there was a 12% difference between highest food wastage in autumn and lowest food wastage in spring. Maximum wastage of lettuce in summer was 10% more than the minimum wastage of lettuce in winter. Large differences in total production may affect the percentage wastage, where lower production levels may be easier to manage, resulting in less wastage. For all crops, percentage wastage was higher in summer compared to winter, partly because of shorter shelf lives when temperatures are higher.
3.2. Water Footprint of Wastage of Selected Vegetables
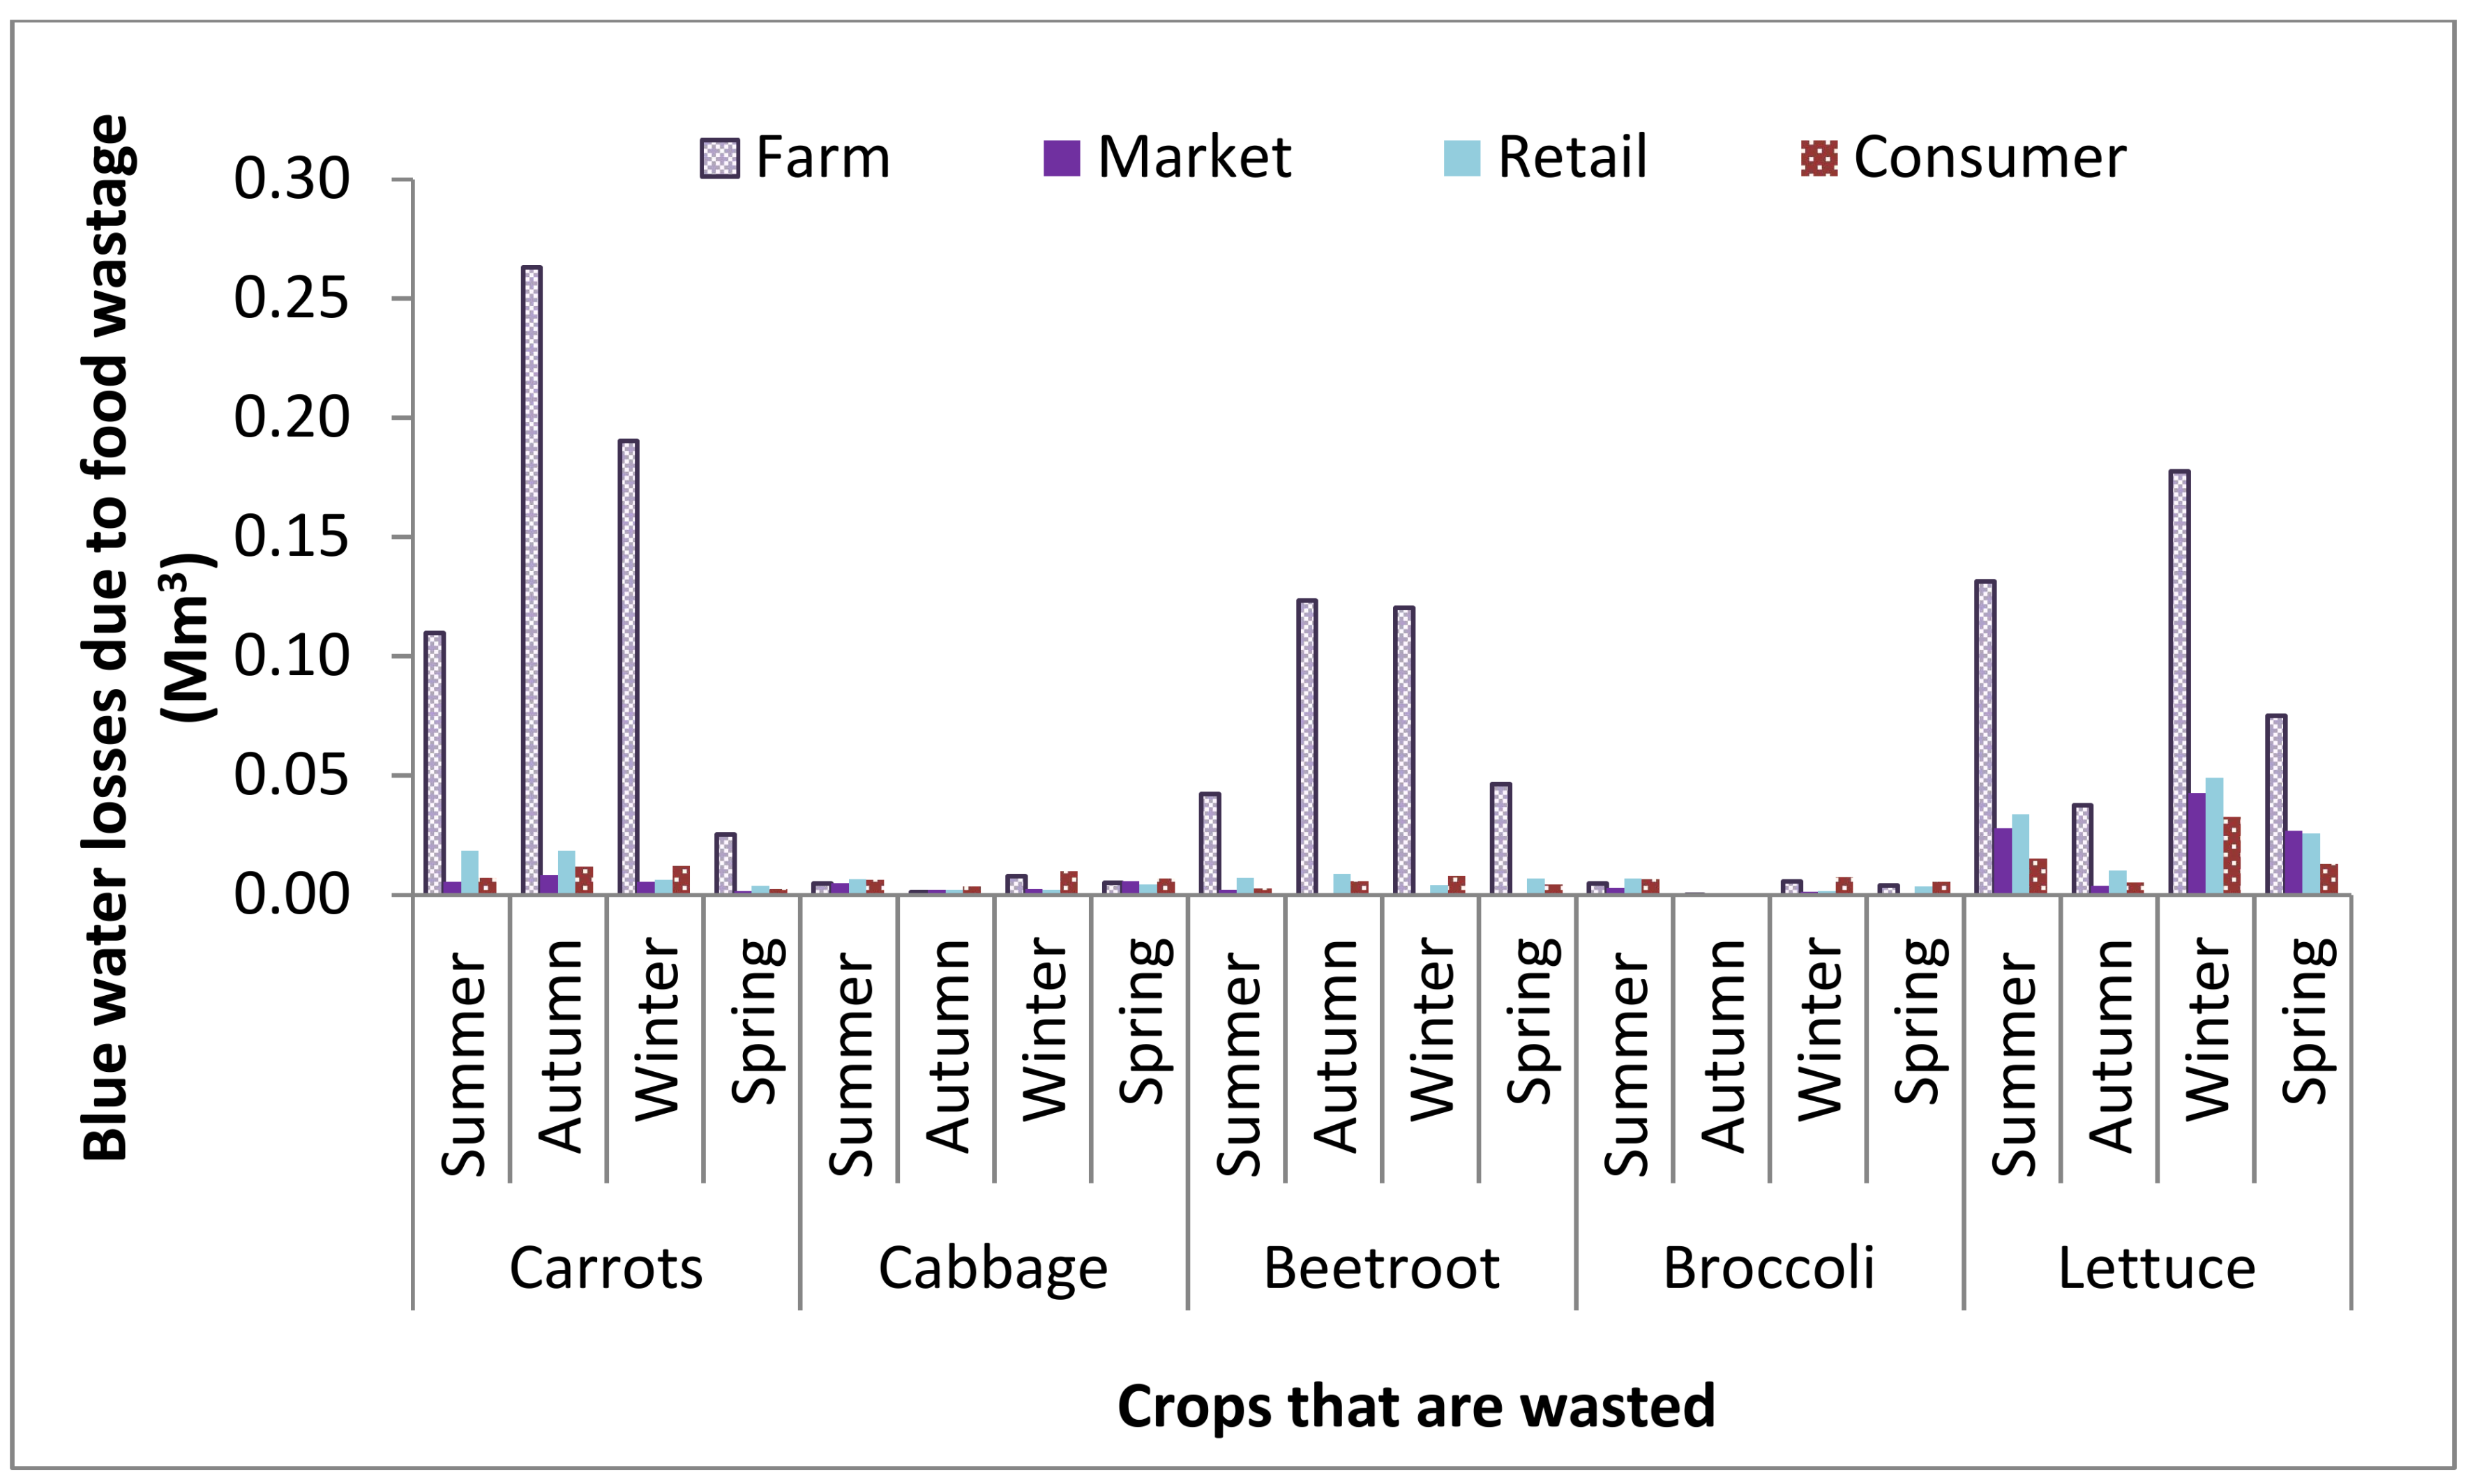
The blue WFs of seasonal discards along the supply chain to the consumer of the selected vegetable crops produced on the Steenkoppies Aquifer are given in Table 2 and Figure 6. As shown in Table 2, wastage of carrots in summer, autumn and winter, beetroot in autumn and winter and lettuce in summer, winter and spring used relatively high volumes of blue water during production on the aquifer, which can be considered as lost through food wastage. For carrots and lettuce, this is partly because of the high volumes produced (Table 1) and high percentages losses (29% and 38% for carrots and lettuce, respectively, Figure 5). This resulted in more wastage of the crops and translated into higher water losses. Higher volumes of wastage for lettuce were countered by low crop WFs during production. Beetroot production was lower, but percentage wastage was high (28%, Figure 5). Lower volumes of blue water lost indirectly through wastage of cabbages and broccoli was due to lower production (Table 1) and lower percentage losses (14% and 13% for cabbage and broccoli, respectively, Figure 5). Most of the total wastage of vegetables produced on the Steenkoppies Aquifer occurred in the packhouse and was due to the wastage of lettuce along the whole supply chain.
As shown in Table 2, an estimated 1.9 Mm3 blue water was lost due to wastage of the selected vegetable crops. It was estimated that 12 Mm3 blue water was used to grow maize and wheat on the Steenkoppies Aquifer [18]. The wastage of maize and wheat has not been determined, but Gustavsson, Cederberg, Sonesson, Van Otterdijk and Meybeck [19] reported 19% wastage of cereals in sub-Saharan Africa; therefore, it was estimated that wastage of maize and wheat used 2.3 Mm3 of blue water [18]. Total wastage on the Steenkoppies Aquifer would therefore use approximately 4.2 Mm3 of blue water, which is 24.5% of the estimated volume of the 17 Mm3 year−1 blue water that exceeded sustainable limits [16].
4. Discussion
4.1. Wastage of Vegetable Crops
Our results indicated that 70% of food wastage occurs on-farm at the packhouse level, and similar results were found in other studies [13,15,20]. The packhouse level is therefore the most important link in the supply chain where food wastage should be addressed. WWF [13] observed that different players along the food supply chain all believed that greater wastage occurred at other points along the chain and are therefore not motivated to make any improvements to reduce food wastage within their own operations. Farmers from the Steenkoppies Aquifer expressed similar concerns that high food wastage is occurring at the market and retail levels, so it is possible that potential reductions in food wastage at the packhouse level have not yet been fully explored. Research is required to understand the reasons for the high percentage wastage at the farm or packhouse level to determine if farmers are making the best use of existing technologies to prevent food losses and whether there are other simple ways of reducing current losses. For example, carrots fit for human consumption that are discarded during packaging because of unmarketable properties could instead be cut or grated and sold, rather than being used for animal feed. In this study, data were obtained from a large commercial farm that uses advanced technologies, and the results could be very different for smaller scale farms. Thus, future research should also be done to determine the impact of technology, farm size and farm infrastructure on crop wastage.
Average wastage for carrots, cabbage, beetroot, broccoli and lettuce along the supply chain as calculated in this study was lower than previous estimates for sub-Saharan Africa [15]. For example, literature sources indicate that 51.5% of fruits and vegetables are wasted along the supply chain [12]. This was an overestimate in the wastage of cabbage, which ranges between 10.4% in winter to 15.9% in summer, but was similar to the estimated 42% lettuce wastage in summer. The large variation in wastage between different crops also translates into significant differences in the wastage-related WFs of these crops.
A key challenge in quantifying food wastage is to classify waste. Most of the wastage reported here was not simply discarded. Wastage at the packhouse level is fed to livestock, wastage at the Tshwane Market is used for composting, and wastage at many of the green grocers that were contacted is given to charity organisations or livestock farmers. The beneficial use of these vegetables could disqualify them from being classified as waste, especially if they substitute other foods which would have been used for livestock feed. However, in the face of food insecurities and water scarcity, it is still worth considering these losses from the food supply chain and figuring out ways to minimize such wastage. Another challenge in quantifying vegetable wastage is the natural loss of the water content of the produce following harvest, which may result in lower measures of wastage weight relative to what was transferred from the previous step of the supply chain. If products are measured in terms of vegetable counts, like cabbage heads with more or less standard sizes, this problem could potentially be overcome.
A major challenge during this research was to obtain comprehensive data along the entire supply chain, especially at the retail level. WWF [13] also experienced a lack of data or unwillingness of companies to share their data during a survey that involved food retailers in South Africa. Policies are needed that require transparency on food wastage at all stages along the supply chain to improve data collection, as well as the active participation of agencies that take responsibility for collecting the necessary data and a central database where data can be recorded. The low wastage estimated for broccoli was mainly because of the assumption that wastage at the packhouse level will be similar to cabbage. This, however, could be an underestimation, and recording data for beetroot and broccoli at the packhouse level is recommended for future research. Recording losses of maize and wheat is more challenging compared to vegetable crops because these crops are processed into and sold as different products, which will have different wastage potential. Future research should also consider the losses of these grain crops in more detail.
It can be argued that reductions in food wastage may be one of the simpler ways to address food insecurities and water scarcities. In a global study on food losses, the minimum wastage recorded for fruits and vegetables was 37%, which was recorded in industrialised Asia, and a minimum of 33% wastage of root and tubers was recorded in northern Africa, and western and central Asia [20]. Losses recorded for some crops in this study are therefore below those minimum values reported previously, and further reductions may require fundamental changes to the current food supply chain system. The fraction of food wastage that cannot be prevented should always be diverted from landfill sites and used for other beneficial purposes such as composting, animal feed and biogas digesters, which is in line with the goals of the National Waste Management Strategy of South Africa [25].
Reducing wastage and the associated ecological impacts is not only difficult but can also be highly complex. For example, there may be a trade-off in reducing the blue WF due to less wastage as a result of increased pesticide use, which also leads to an increase in the grey WF as more of these pesticides are leached into groundwater. Reducing wastage through better refrigeration will most likely lead to a larger carbon footprint. Comprehensive assessments such as those used in Life Cycle Assessments (LCAs) will be valuable to improve understanding of the different impacts of potential mitigation measures.
4.2. Implication of Food Wastage on Water Resources
Under natural conditions, the only known outlet for the Steenkoppies Aquifer, Maloney’s Eye, discharges an average of 14.7 Mm3 per year [16]. This volume has decreased to an average 8.3 Mm3 per year since 2006, which was the time when irrigated agriculture started to increase [26]. This reduction in outflow together with measured declines in borehole levels emphasize the unsustainable water use of the aquifer by agriculture [16]. If an ecological flow requirement (EFR) of 46%, as stipulated by the Department of Water Affairs [27], is taken into account, the total water available for abstractions is 8 Mm3 per year. As current agricultural water use was estimated at 25 Mm3 per year, irrigation has pushed the aquifer 17 Mm3 per year beyond sustainable blue water use limits.
However, even eliminating food wastage completely will still not bring current blue water use to within sustainable limits, as blue water used to produce crop material that becomes wastage on the Steenkoppies Aquifer is estimated to be 25% of the blue water use that exceeds sustainable limits. Ridoutt, et al. [28] conducted a study on the blue, green and grey WFs of wastage of fresh mangoes in Australia and found that by reducing wastage, the impact of current production could be reduced to within sustainable limits. On the Steenkoppies Aquifer, however, where we only considered the sustainability of blue water, reducing wastage alone is simply not sufficient to achieve sustainable blue water use at current levels of production.
Blue water used to produce crop material that becomes wastage is also much higher than the total blue water used in packhouses to clean and pack these crops [17]. For example, in terms of total production on the Steenkoppies Aquifer for 2005, it was estimated that 0.04 Mm3 for carrots, 0.003 Mm3 for cabbage and 0.03 Mm3 for lettuce were used in the packhouse, compared to 0.7, 0.1 and 0.7 Mm3 of blue water linked to wastage, respectively. However, according to Le Roux [18], relatively high savings of blue water are possible through reductions of water use during cultivation. For example, by substituting the more common “Iceberg” lettuce, with “Cos” lettuce, which has a lower WF, and delaying harvest to achieve higher yields, blue water use in 2005 could have been reduced by 1 Mm3. Lettuce only represents 14% of production by area, so similar switching to more water efficient and higher yielding crops could further such savings.
Reductions in food wastage, with concomitant reductions in the need for vegetable production, should therefore be considered as only one of multiple measures to address unsustainable blue water use on the Steenkoppies Aquifer. Mitigation should undoubtedly focus on the production phase, as this is where the highest gains can be made. Other measures may include the reduction of total production to within sustainable blue water limits, selecting crops and cultivars with low water footprints and using water more efficiently, for example, switching from sprinkler to drip irrigation, and using soil water conservation practices such as mulching. Increased use of waste waters may also be part of the solution. These responses are focussed on blue water savings and do not take into account the water quality implications. Such changes in agricultural management practices may be difficult to enforce because the system is primarily driven by economic factors. For example, farmers select crops based on market prices and demands. Irrigation on the aquifer also plays an important role in economic development in South Africa. Change will need to be driven through incentives or changing consumer choices. Consumers should also be encouraged to cultivate crops that have high percentage wastage along the supply chain, such as lettuce, in their own homestead gardens to reduce the decay that happens along the supply chain. People are also more likely to eat crops with unmarketable properties that have been grown in their own gardens.
5. Conclusions
The main objectives of this study were to quantify indirect water losses through the wastage of crops produced on the Steenkoppies Aquifer and to determine whether reductions in food wastage, assuming that this would lead to lower production at the farm level, could provide a way to achieve more sustainable water use. The hypothesis that there will be an important difference between the wastage fractions for different vegetable crops was also tested.
The highest percentage of wastage occurred during the packhouse stage, for reasons including damage by pests and diseases and unmarketable properties, so efforts to reduce wastage should focus on this stage. Quantifying food wastage is complicated by the fact that produce classified as wastage is often used for other purposes such as animal feed and compost. The amount of wastage for different types of vegetables can be highly variable, with small fractions for less perishable crops like cabbage, and high fractions for other crops such as lettuce. Care should therefore be taken when doing calculations with average or generalised published data on the wastage of vegetables.
For the Steenkoppies Aquifer, eliminating wastage completely (which is probably impossible) will accomplish around a quarter of the savings needed to achieve sustainable blue water use. Reductions may also come with other unwanted ecological impacts, for example, through the increased use of pesticides and refrigeration. Increasing water use efficiency through practices such as mulching could be effective but may have cost implications for the producer. Household cultivation of perishable crops may be effective in reducing wastage too, but ultimately more drastic policy changes and system interventions, for example, limiting the extent of production, or restricting what can be produced when, may be the only ways to achieve ambitious sustainability targets. Ideally, such changes will be achieved through incentives or changing consumer choices, involving multiple stakeholders in a more harmonious way.
Author Contributions
The first author, B.l.R., conducted this research and wrote the paper as part of her PhD thesis. M.v.d.L. supervised the research. T.V. contributed to the research in gathering data and developing the crop parameters for modelling. J.G.A. and K.L.B. are specialists in the field and acted as reviewers and mentors.
Acknowledgments
This research originated from a project initiated, managed and funded by the Water Research Commission (WRC project No. K5/2273//4: Water footprint of selected vegetable and fruit crops produced in South Africa), that is now published as WRC Report No. TT 722/17 (see Van der Laan (2017)). The first author, Betsie le Roux, received financial support for research from the WRC and a bursary from the National Research Foundation (NRF) of South Africa (NRF Grant number: 88572).
Conflicts of Interest
The authors declare no conflict of interest.
References
- United Nations. Sustainable Development Goals. Seventeen Goals to Achieve Sustainable Development. Available online: http://www.un.org/sustainabledevelopment/sustainable-development-goals/ (accessed on 23 June 2017).
- World Bank. South Africa-Nutrition at a Glance; World Bank: Washington, DC, USA, 2011; Available online: http://documents.worldbank.org/curated/en/413801468334804797/South-Africa-Nutrition-at-a-glance (accessed on 7 August 2017).
- Hoekstra, A.Y.; Chapagain, A.K. Globalization of Water: SHARING the Planet’s Freshwater Resources; Blackwell Publishing: Oxford, UK, 2011. [Google Scholar]
- Wada, Y.; Beek, L.P.H.; Bierkens, M.F.P. Nonsustainable Groundwater Sustaining Irrigation: A Global Assessment. Water Resour. Res. 2012, 48. [Google Scholar] [CrossRef]
- Hoekstra, A.Y. Virtual Water Trade: Proceedings of the International Expert Meeting on Virtual Water Trade. Delft, The Netherlands, 12–13 December 2002; Value of Water Research Report Series No. 12; UNESCO—IHE: Delft, The Netherlands, 2003. [Google Scholar]
- Hoekstra, A.Y.; Aldaya, M.M.; Chapagain, A.K.; Mekonnen, M.M. The Water Footprint Assessment Manual: Setting the Global Standard; Routledge: London, UK, 2011. [Google Scholar]
- Smakhtin, V.; Ashton, P.; Batchelor, A.; Meyer, R.; Murray, E.; Barta, B.; Bauer, N.; Naidoo, D.; Olivier, J.; Terblanche, D. Unconventional water supply options in south africa. Water Int. 2001, 26, 314–334. [Google Scholar] [CrossRef]
- Department of Water Affairs. National Water Resource Strategy 2; Department of Water Affairs: Pretoria, South Africa, 2013.
- Backeberg, G.R.; Reinders, F.B. Institutional reform and modernisation of irrigation systems in South Africa. In Proceedings of the 5th Asian Regional Conference of ICID, New Delhi, India, 6–11 December 2009. [Google Scholar]
- Nieuwoudt, W.L.; Backeberg, G.R.; Du Plessis, H.M. The value of water in the South African economy: Some implications. Agrekon 2004, 43, 162–183. [Google Scholar] [CrossRef]
- De Jager, E. South Africa Annual Total Rainfall General Information; South African Weather Services: Pretoria, South Africa, 2016. [Google Scholar]
- Lundqvist, J.; de Fraiture, C.; Molden, D. Saving Water: From Field to Fork: Curbing Losses and Wastage in the Food Chain; SIWI Policy Brief; Stockholm International Water Institute (SIWI): Stockholm, Sweden, 2008. [Google Scholar]
- World Wide Fund for Nature (WWF). Food Loss and Waste: Facts and Futures; WWF: Cape Town, South Africa, 2017; Available online: http://awsassets.wwf.org.za/downloads/WWF_Food_Loss_and_Waste_WEB.pdf (accessed on 4 September 2017).
- Nahman, A.; De Lange, W.; Oelofse, S.; Godfrey, L. The costs of household food waste in South Africa. Waste Manag. 2012, 32, 2147–2153. [Google Scholar] [CrossRef] [PubMed]
- Oelofse, S.H.; Nahman, A. Estimating the magnitude of food waste generated in South Africa. Waste Manag. Res. 2013, 31, 80–86. [Google Scholar] [CrossRef] [PubMed]
- Le Roux, B.; van der Laan, M.; Vahrmeijer, T.; Bristow, K.L.; Annandale, J.G. Establishing and testing a catchment water footprint framework to inform sustainable irrigation water use for an aquifer under stress. Sci. Total Environ. 2017, 599–600, 1119–1129. [Google Scholar] [CrossRef] [PubMed]
- Vahrmeijer, J. Improved Management of Groundwater in Irrigated Catchments under Stress. Ph.D. Thesis, University of Pretoria, Pretoria, South Africa, 2016. Unpublished. [Google Scholar]
- Le Roux, B. A Framework to Apply Water Footprinting for Sustainable Agricultural Water Management: A Case Study on the Steenkoppies Aquifer. Ph.D. Thesis, University of Pretoria, Pretoria, South Africa, 2017. [Google Scholar]
- Tshwane Fresh Produce Market. Data on Vegetables from the Steenkoppies Aquifer; Tshwane Fresh Produce Market: Pretoria, South Africa, 2014. [Google Scholar]
- Gustavsson, J.; Cederberg, C.; Sonesson, U.; Van Otterdijk, R.; Meybeck, A. Global Food Losses and Food Waste; Food and Agriculture Organization of the United Nations: Rome, Italy, 2011. [Google Scholar]
- Le Roux, B.; van der Laan, M.; Vahrmeijer, J.; Bristow, K.; Annandale, J. Estimating water footprints of vegetable crops: Influence of growing season, solar radiation data and functional unit. Water 2016, 8, 473. [Google Scholar]
- Dos Santos, L.; Fruit and vegetable retailer, Pretoria, South Africa. Personal communication, 15 July 2014.
- Mentis, D.; Fruit and vegetable retailer, Pretoria, South Africa. Personal communication, 30 June 2016.
- Gathino, S.; Fruit and vegetable retailer, Pretoria, South Africa. Personal communication, 16 May 2016.
- Department of Environmental Affairs. National Waste Management Strategy; Department of Environmental Affairs: Pretoria, South Africa, 2011.
- Vahrmeijer, J.; Annandale, J.; Bristow, K.; Steyn, J.; Holland, M. Drought as a catalyst for change: A case study of the steenkoppies dolomitic aquifer. In Drought in Arid and Semi-Arid Regions; Schwabe, K., Albiac, J., Connor, J.D., Hassan, R.M., Gonzalez, L.M., Eds.; Springer: Dordrecht, The Netherlands, 2013; Chapter 14; pp. 251–268. [Google Scholar]
- Department of Water Affairs. Classification of Significant Water Resources in the Mokolo and Matlabas Catchment: Limpopo Water Management Area (WMA) and Crocodile (West) and Marico WMA: Ecological Water Requirements Report; Report no: Rdm/wma 1,3/00/con/cla/0312; Directorate Water Resource Classification: Pretoria, South Africa, 2011.
- Ridoutt, B.G.; Juliano, P.; Sanguansri, P.; Sellahewa, J. The water footprint of food waste: Case study of fresh mango in australia. J. Clean. Prod. 2010, 18, 1714–1721. [Google Scholar] [CrossRef]
Figure 1.
Calculating wastage for the stages along the supply chain of vegetables (carrots, cabbage, beetroot, broccoli and lettuce) from the farmer to consumer.
Figure 1.
Calculating wastage for the stages along the supply chain of vegetables (carrots, cabbage, beetroot, broccoli and lettuce) from the farmer to consumer.

Figure 2.
Wastage of carrots, cabbage and lettuce in each season in a packhouse on the Steenkoppies Aquifer. Carrot values are assumed to represent beetroot values, and cabbage values are assumed to represent broccoli values.
Figure 2.
Wastage of carrots, cabbage and lettuce in each season in a packhouse on the Steenkoppies Aquifer. Carrot values are assumed to represent beetroot values, and cabbage values are assumed to represent broccoli values.

Figure 3.
Percentage of crops received by the Tshwane Fresh Produce Market from 2011–2014 that was wasted.
Figure 3.
Percentage of crops received by the Tshwane Fresh Produce Market from 2011–2014 that was wasted.

Figure 4.
(A): Average percentages of total annual wastage of carrots, cabbage, beetroot, broccoli and lettuce produced on the Steenkoppies Aquifer at different stages along the supply chain from the field to the consumer; (B): Wastage of food along the supply chain in South Africa estimated by Oelofse and Nahman [15].

Figure 5.
Percentage annual wastage along the supply chain of the five selected vegetable crops in terms of total production on the Steenkoppies Aquifer in 2005.
Figure 5.
Percentage annual wastage along the supply chain of the five selected vegetable crops in terms of total production on the Steenkoppies Aquifer in 2005.

Figure 6.
Blue water losses through food wastage along the supply chain from the field to the consumer due to vegetables produced on the Steenkoppies Aquifer in 2005.
Figure 6.
Blue water losses through food wastage along the supply chain from the field to the consumer due to vegetables produced on the Steenkoppies Aquifer in 2005.


Table 1.
Summary of wastage of carrots, cabbage, beetroot, broccoli and lettuce along the supply chain from the farm to the consumer in terms of total production on the Steenkoppies Aquifer in 2005.
Table 1.
Summary of wastage of carrots, cabbage, beetroot, broccoli and lettuce along the supply chain from the farm to the consumer in terms of total production on the Steenkoppies Aquifer in 2005.
| Crop | Season | Total Annual Production (tonnes) | Percentage Wastage in Terms of Mass Received by Each Stage (%) | Total Wastage at Each Stage (tonnes) | Total Percentage Wastage (%) | Total Consumed | |||||||
|---|---|---|---|---|---|---|---|---|---|---|---|---|---|
| Farm | Market | Retail | Consumer | Farm | Market | Retail | Consumer | Total | |||||
| Carrots | Summer | 13,487.3 | 22.8% | 1.445% | 5.0% | 2.0% | 3075.5 | 150.4 | 513.1 | 195.0 | 3934.0 | 29.2% | 9553.1 |
| Autumn | 8454.6 | 29.9% | 1.331% | 3.0% | 2.0% | 2527.4 | 78.9 | 175.5 | 113.5 | 2895.3 | 34.2% | 5559.4 | |
| Winter | 9193.7 | 23.6% | 0.882% | 1.0% | 2.0% | 2167.3 | 61.9 | 69.6 | 137.9 | 2436.8 | 26.5% | 6756.9 | |
| Spring | 3221.7 | 17.3% | 1.192% | 3.0% | 2.0% | 557.7 | 31.8 | 79.0 | 51.1 | 719.5 | 22.3% | 2502.2 | |
| Beetroot | Summer | 3093.8 | 22.8% | 1.470% | 5.0% | 2.0% | 705.5 | 35.1 | 117.7 | 44.7 | 903.0 | 29.2% | 2190.8 |
| Autumn | 4768.3 | 29.9% | 0.000% | 3.0% | 2.0% | 1425.4 | 0.0 | 100.3 | 64.9 | 1590.6 | 33.4% | 3177.7 | |
| Winter | 4218.3 | 23.6% | 0.020% | 1.0% | 2.0% | 994.4 | 0.7 | 32.2 | 63.8 | 1091.1 | 25.9% | 3127.2 | |
| Spring | 2585.5 | 17.3% | 0.012% | 3.0% | 2.0% | 447.6 | 0.3 | 64.1 | 41.5 | 553.4 | 21.4% | 2032.1 | |
| Subtotal 1 * | 49,022.9 | 11,900.8 | 359.1 | 1151.4 | 712.2 | 14,123.5 | 28.8% | ||||||
| Cabbage | Summer | 3699.9 | 3.4% | 3.590% | 5.0% | 5.0% | 125.1 | 128.3 | 172.3 | 163.7 | 589.4 | 15.9% | 3110.5 |
| Autumn | 1369.1 | 1.6% | 2.915% | 3.0% | 5.0% | 22.2 | 39.3 | 39.2 | 63.4 | 164.1 | 12.0% | 1205.1 | |
| Winter | 2705.1 | 3.7% | 1.079% | 1.0% | 5.0% | 100.0 | 28.1 | 25.8 | 127.6 | 281.5 | 10.4% | 2423.6 | |
| Spring | 2373.1 | 3.4% | 3.925% | 3.0% | 5.0% | 81.2 | 90.0 | 66.1 | 106.8 | 344.0 | 14.5% | 2029.1 | |
| Broccoli | Summer | 1015.5 | 3.4% | 2.069% | 5.0% | 5.0% | 34.3 | 20.3 | 48.1 | 45.6 | 148.3 | 14.6% | 867.2 |
| Autumn | 62.2 | 1.6% | 1.818% | 3.0% | 5.0% | 1.0 | 1.1 | 1.8 | 2.9 | 6.8 | 11.0% | 55.4 | |
| Winter | 482.4 | 3.7% | 0.796% | 1.0% | 5.0% | 17.8 | 3.7 | 4.6 | 22.8 | 49.0 | 10.2% | 433.5 | |
| Spring | 672.4 | 3.4% | 0.399% | 3.0% | 5.0% | 23.0 | 2.6 | 19.4 | 31.4 | 76.4 | 11.4% | 596.0 | |
| Lettuce | Summer | 15,855.3 | 26.5% | 7.627% | 10.0% | 5.0% | 4205.1 | 888.6 | 1076.2 | 484.3 | 6654.1 | 42.0% | 9201.2 |
| Autumn | 2965.1 | 24.7% | 3.129% | 9.0% | 5.0% | 732.2 | 69.9 | 194.7 | 98.4 | 1095.2 | 36.9% | 1869.9 | |
| Winter | 9918.0 | 19.3% | 5.733% | 7.0% | 5.0% | 1917.5 | 458.6 | 527.9 | 350.7 | 3254.8 | 32.8% | 6663.2 | |
| Spring | 6858.5 | 19.5% | 8.589% | 9.0% | 5.0% | 1337.1 | 474.2 | 454.2 | 229.6 | 2495.2 | 36.4% | 4363.2 | |
| Subtotal 2 ** | 47,976.6 | 8596.6 | 2204.7 | 2630.3 | 1727.3 | 15,158.7 | 31.6% | ||||||
* Subtotal 1 for carrots and beetroot (root vegetables), ** Subtotal 2 for cabbage, broccoli and lettuce.
Table 2.
Blue water footprints [21] and blue water lost due to wastage of vegetables produced on the Steenkoppies Aquifer in 2005.
Table 2.
Blue water footprints [21] and blue water lost due to wastage of vegetables produced on the Steenkoppies Aquifer in 2005.
| Crop | Season | Blue Crop Water Footprint (m3 tonne−1) | Blue Water Lost Due to Wastage (Mm3) | Total (Mm3) | |||
|---|---|---|---|---|---|---|---|
| Farm | Market | Retail | Consumer | ||||
| Carrots | Summer | 35.70 | 0.110 | 0.005 | 0.018 | 0.007 | 0.14 |
| Autumn | 104.12 | 0.263 | 0.008 | 0.018 | 0.012 | 0.30 | |
| Winter | 87.84 | 0.190 | 0.005 | 0.006 | 0.012 | 0.21 | |
| Spring | 45.21 | 0.025 | 0.001 | 0.004 | 0.002 | 0.03 | |
| Cabbage | Summer | 37.76 | 0.005 | 0.005 | 0.007 | 0.006 | 0.02 |
| Autumn | 53.22 | 0.001 | 0.002 | 0.002 | 0.003 | 0.01 | |
| Winter | 77.46 | 0.008 | 0.002 | 0.002 | 0.010 | 0.02 | |
| Spring | 63.20 | 0.005 | 0.006 | 0.004 | 0.007 | 0.02 | |
| Beetroot | Summer | 59.83 | 0.042 | 0.002 | 0.007 | 0.003 | 0.05 |
| Autumn | 86.62 | 0.123 | 0.000 | 0.009 | 0.006 | 0.14 | |
| Winter | 121.12 | 0.120 | 0.000 | 0.004 | 0.008 | 0.13 | |
| Spring | 103.57 | 0.046 | 0.000 | 0.007 | 0.004 | 0.06 | |
| Broccoli | Summer | 142.38 | 0.005 | 0.003 | 0.007 | 0.006 | 0.02 |
| Autumn | 225.23 | 0.000 | 0.000 | 0.000 | 0.001 | 0.00 | |
| Winter | 321.98 | 0.006 | 0.001 | 0.001 | 0.007 | 0.02 | |
| Spring | 169.61 | 0.004 | 0.000 | 0.003 | 0.005 | 0.01 | |
| Lettuce | Summer | 31.26 | 0.131 | 0.028 | 0.034 | 0.015 | 0.21 |
| Autumn | 51.20 | 0.037 | 0.004 | 0.010 | 0.005 | 0.06 | |
| Winter | 92.63 | 0.178 | 0.042 | 0.049 | 0.032 | 0.30 | |
| Spring | 56.18 | 0.075 | 0.027 | 0.026 | 0.013 | 0.14 | |
| Total | 1.376 | 0.143 | 0.217 | 0.165 | 1.901 | ||
© 2018 by the authors. Licensee MDPI, Basel, Switzerland. This article is an open access article distributed under the terms and conditions of the Creative Commons Attribution (CC BY) license (http://creativecommons.org/licenses/by/4.0/).
Share and Cite
MDPI and ACS Style
Le Roux, B.; Van der Laan, M.; Vahrmeijer, T.; Annandale, J.G.; Bristow, K.L. Water Footprints of Vegetable Crop Wastage along the Supply Chain in Gauteng, South Africa. Water 2018, 10, 539. https://doi.org/10.3390/w10050539
AMA Style
Le Roux B, Van der Laan M, Vahrmeijer T, Annandale JG, Bristow KL. Water Footprints of Vegetable Crop Wastage along the Supply Chain in Gauteng, South Africa. Water. 2018; 10(5):539. https://doi.org/10.3390/w10050539
Chicago/Turabian StyleLe Roux, Betsie, Michael Van der Laan, Teunis Vahrmeijer, John G. Annandale, and Keith L. Bristow. 2018. "Water Footprints of Vegetable Crop Wastage along the Supply Chain in Gauteng, South Africa" Water 10, no. 5: 539. https://doi.org/10.3390/w10050539
Note that from the first issue of 2016, this journal uses article numbers instead of page numbers. See further details here.