Evaluation of the Spatiotemporal Variation of Sustainable Utilization of Water Resources: Case Study from Henan Province (China)


1
Business School, Hohai University, Nanjing 211100, China
2
School of Public Administration, Hohai University, Nanjing 211100, China
*
Author to whom correspondence should be addressed.
Water 2018, 10(5), 554; https://doi.org/10.3390/w10050554
Submission received: 12 April 2018
/
Revised: 20 April 2018
/
Accepted: 23 April 2018
/
Published: 25 April 2018
(This article belongs to the Section Water Resources Management, Policy and Governance)
Abstract
:The evaluation of the sustainable utilization of water resources is an important factor to measure whether the water resources can support the local coordinated development of population, economy and environment. Our study used Henan Province as the research area, which has a relative shortage of water resources (average water resources per capita, ≤400 m3). The Drivers, Pressures, State, Impact, Response (DPSIR) model was used to construct the evaluation index system, utilizing the entropy weight method and the Analytic Hierarchy Process (AHP) method to determine the index weight. The sustainable utilization of water resources in 18 cities of Henan Province from 2006 to 2015 was evaluated using the Technique for Order Preference by Similarity to an Ideal Solution (TOPSIS) model. The results show a steady upward trend, from worst to general, but there is a great difference between each city. The overall level was still on the low side, and the influence of each subsystem in the comprehensive index of the sustainable utilization of water resources varies. The evaluation results are basically in line with the actual situation of economic and social development in Henan Province, which has a guiding significance for improving the level of sustainable utilization of water resources in the region.
1. Introduction
Water resources are a basic element of the ecological environment and an indispensable natural resource for the development of a national economy [1]. Water resources security is not only an ecological and environmental problem, but also an economic, social and political issue related to national security [2,3]. With the rapid development of the economy and the substantial improvement of the living standards of urban and rural residents, the shortage of water resources is becoming increasingly severe. Water resources have become a crucial obstacle to the sustainable development of regional environments and the social economy [4,5]. The sustainable utilization of water resources is an important factor to measure whether areas with water shortages can support the coordinated development of population, economy and environment [6]. Therefore, it is of great practical significance to evaluate the sustainable utilization of regional water resources scientifically for the sustainable development of the region and the cycle of the ecosystem.
Scholars have conducted abundant research on the sustainable utilization of water resources [7]. The International Conference on Water and Environment, held in Dublin, Ireland, in 1992, elaborated for the first time on the status and role of water resources in the environment and development, and research on water resources system and their sustainability has aroused widespread concern from scholars [8]. Chaves and Alipaz [9] used comprehensive evaluation indices to evaluate water resources management in the basin in Brazil (SF Verdadeiro). Juwana [10] first proposed six elements of water resources sustainability assessment based on the review of the sustainable development process. Wada and Bierkens [11] introduced the blue water sustainability index (BLWSI) as new indicators to evaluate the sustainability of global water consumption during the period 1960–2010. While learning from foreign research, domestic scholars have carried out a large number of theoretical and empirical studies based on the actual situation in China. Taking the theory of sustainable development as the basis, Wang et al. [12] selected 30 indices from the aspects of water resources condition, water resources development and utilization level, ecological environment and social economy, and constructed an evaluation index system. Guang et al. [13] constructed an evaluation index system from four aspects of water resources, society, economy and ecological environment, and carried out a sustainable evaluation of water resources in the Manas River basin using the projection pursuit method. Zhou et al. [14] used the relevant methods from the water footprint theory to evaluate the sustainable utilization of water resources in Jimo City as an example. Xu et al. [15] used principal component analysis to study the carrying capacity of water resources in Jiangsu Province by dividing the main factors into economic development, population, and natural condition of water resources.
In summary, the existing studies provide reference for further research, and can effectively guide the construction of an index system for the sustainable utilization of water resources and the choice of evaluation methods. However, there are also several problems and shortcomings to take into account. First, most of the existing research directly uses the “economy-environment” model to construct index systems and they lack reflections on mechanisms and coupling between human activities and water resources in water resources systems. Second, most studies cannot objectively reflect the gap between the actual carrying capacity of resources and environment and the ideal value; and the influence of subjective factors cannot be avoided in the determination of index weight, which leads to the non-objective weight. Third, previous studies on the sustainable utilization of water resources focus on the analysis of the current situation year, ignoring the spatial-temporal dynamic analysis. Fourth, most of the existing research areas focus on arid and semiarid areas where water resources are scarce and there is a lack of research on areas with large populations, rapid economic development, and relative shortage of water resources. In view of this, Henan Province has been chosen as the research area, using the Drivers, Pressures, State, Impact, Response (DPSIR) model to construct the evaluation index system and utilizing the entropy weight method and the Analytic Hierarchy Process (AHP) method to determine the index weight. The sustainable utilization of water resources in 18 cities of Henan Province from 2006 to 2015 was evaluated using the Technique for Order Preference by Similarity to an Ideal Solution (TOPSIS) model in order to visualize the temporal and spatial evolution trends of the sustainable utilization of water resources, which can provide reference for local sustainable development.
2. Materials and Methods
2.1. Research Area
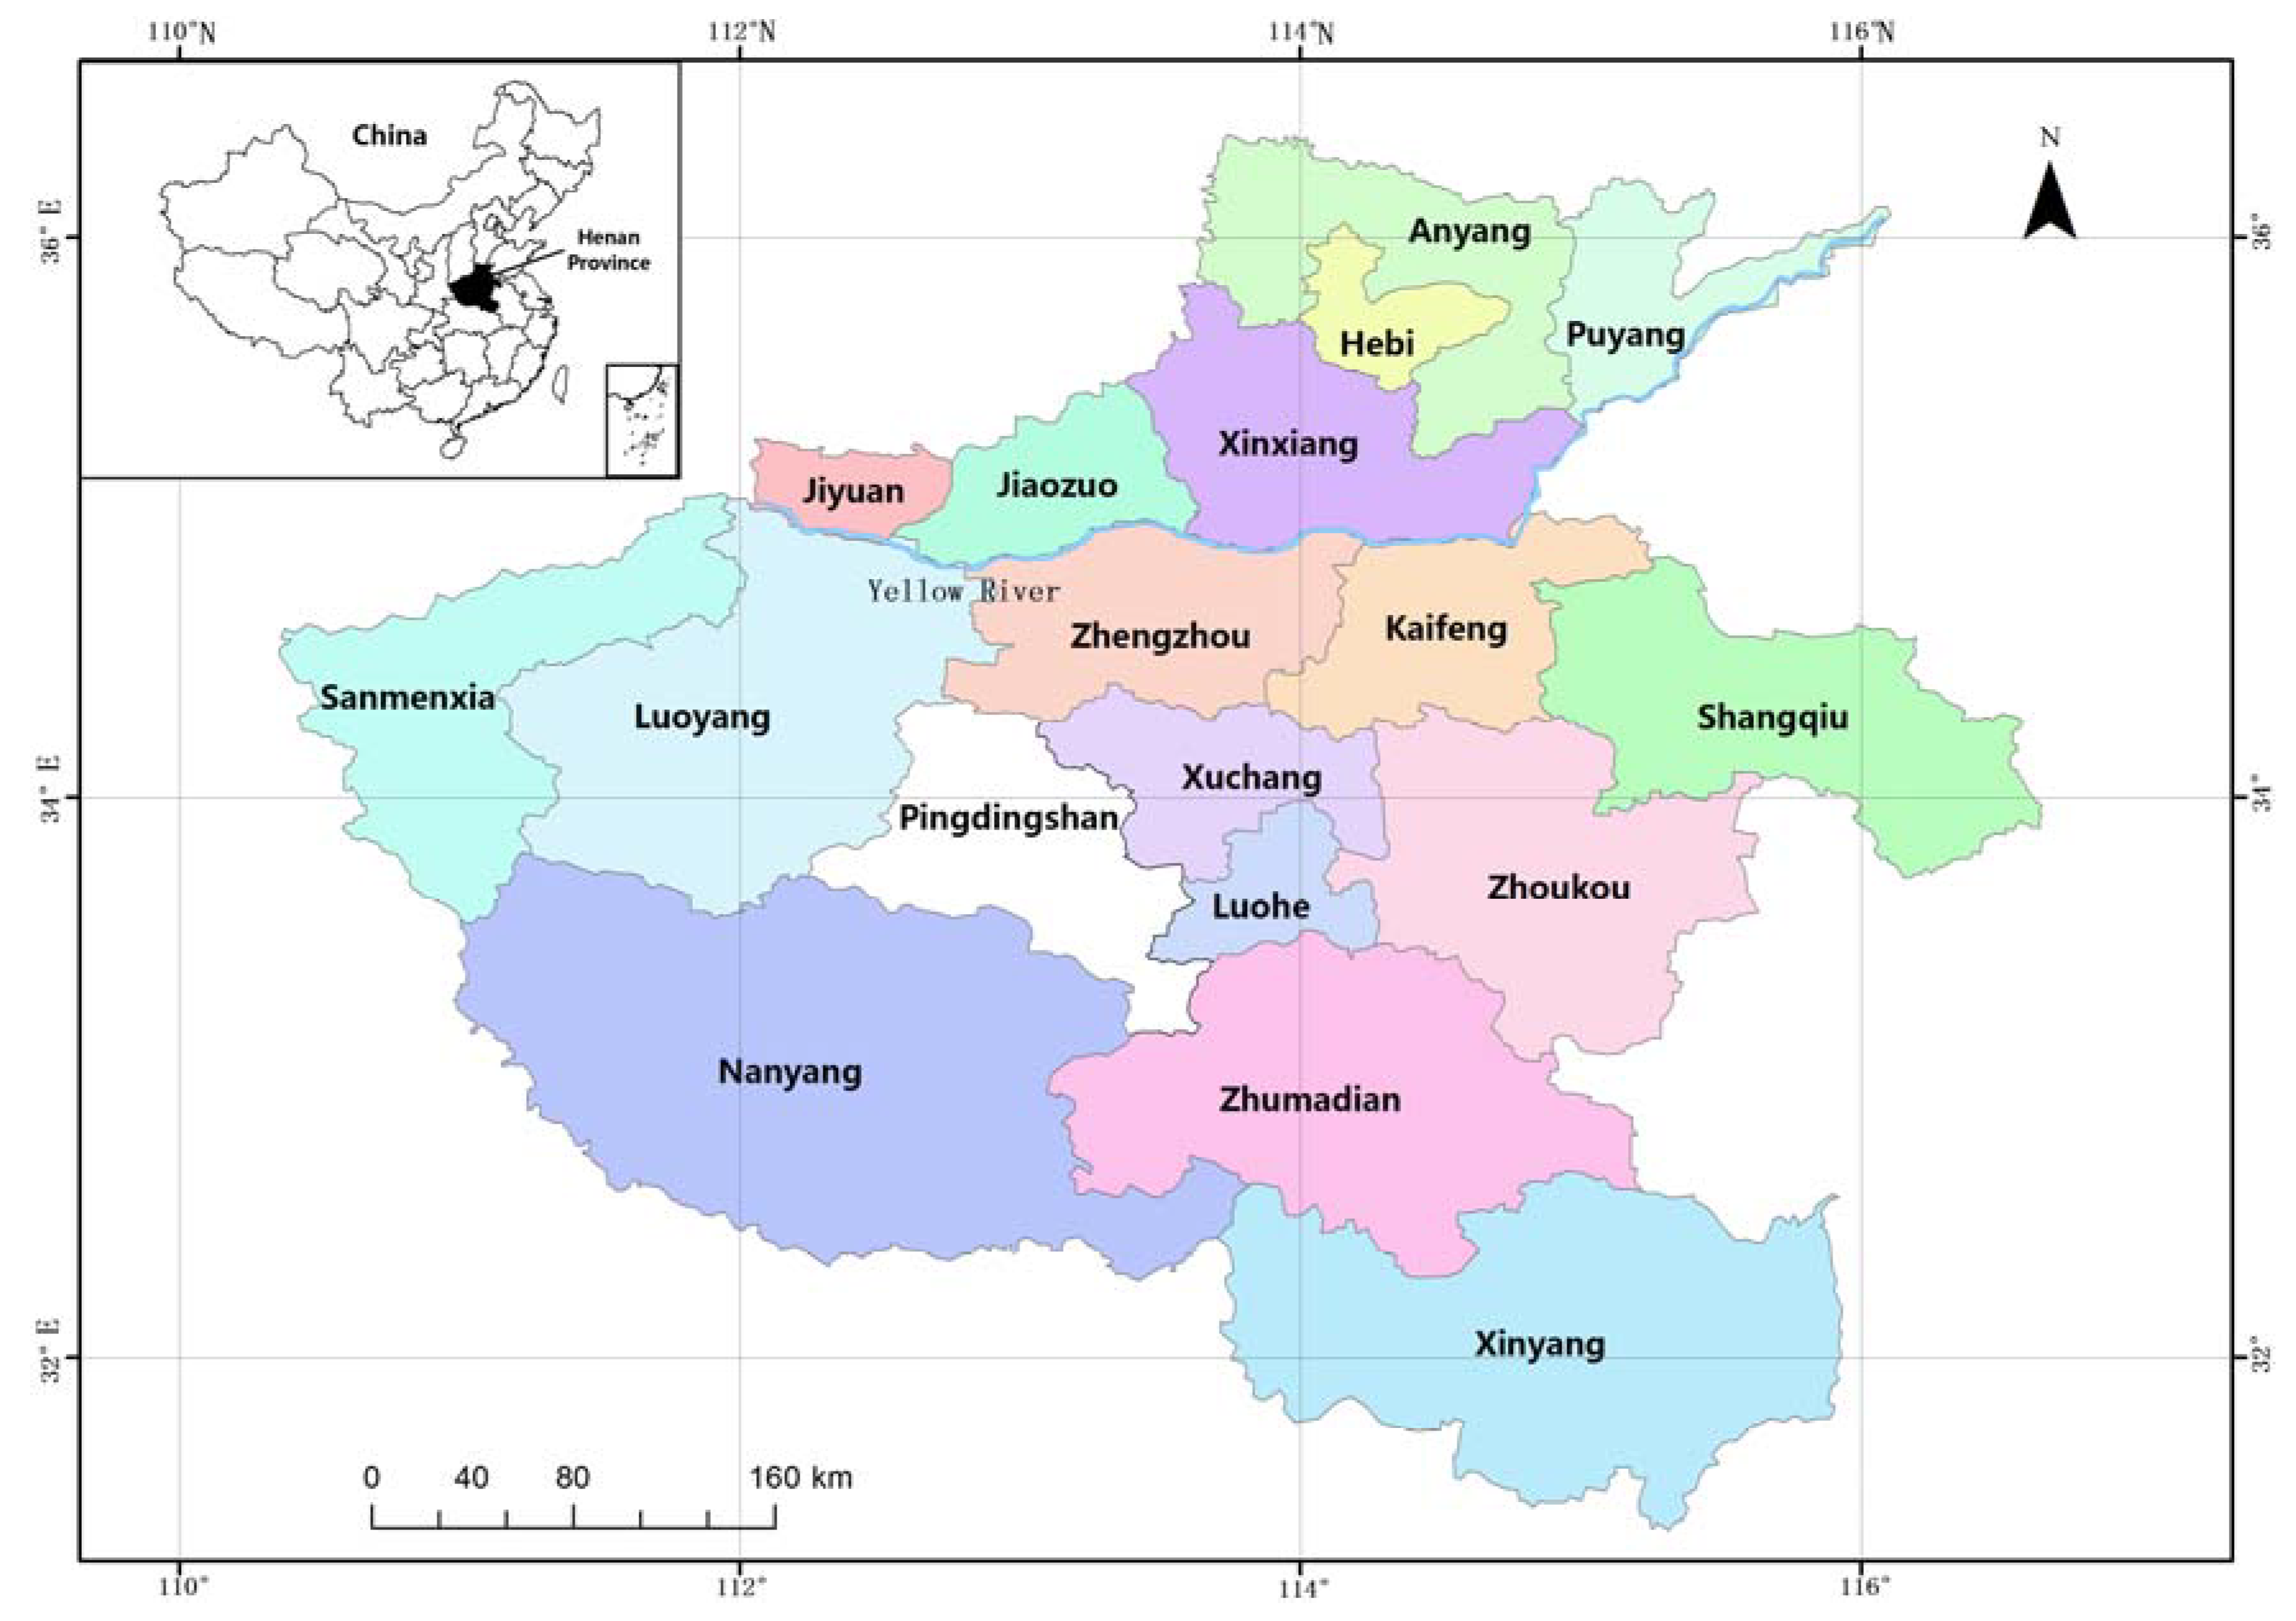
Henan Province is located in the middle and lower reaches of the Yellow River in China. It covers a total area of 167,000 square kilometers and lies between N31°23′–36°22′ and E110°21′–116°39′ (Figure 1). Henan Province is one of the most important economic provinces in China, with the fifth-highest gross domestic product (GDP) in China. It has 18 cities under its jurisdiction, with a resident population of 95.3242 million (2016) and the third-largest population in China. Henan is located in the transitional warm temperate zone and subtropical zone, which has a humid to semihumid monsoon climate. The annual average temperature is 14 °C, the annual average precipitation is 500–900 mm, water resources are in relatively short supply (average water resources per capita, ≤400 m3), and the spatial and temporal distribution is uneven.
2.2. Data Source
The data used in this paper are all from the Statistical Yearbook of Henan Province, the Bulletin on Water Resources, the Bulletin on National Economic and Social Development, and the Environmental Bulletin.
2.3. Methods
2.3.1. DPSIR Model
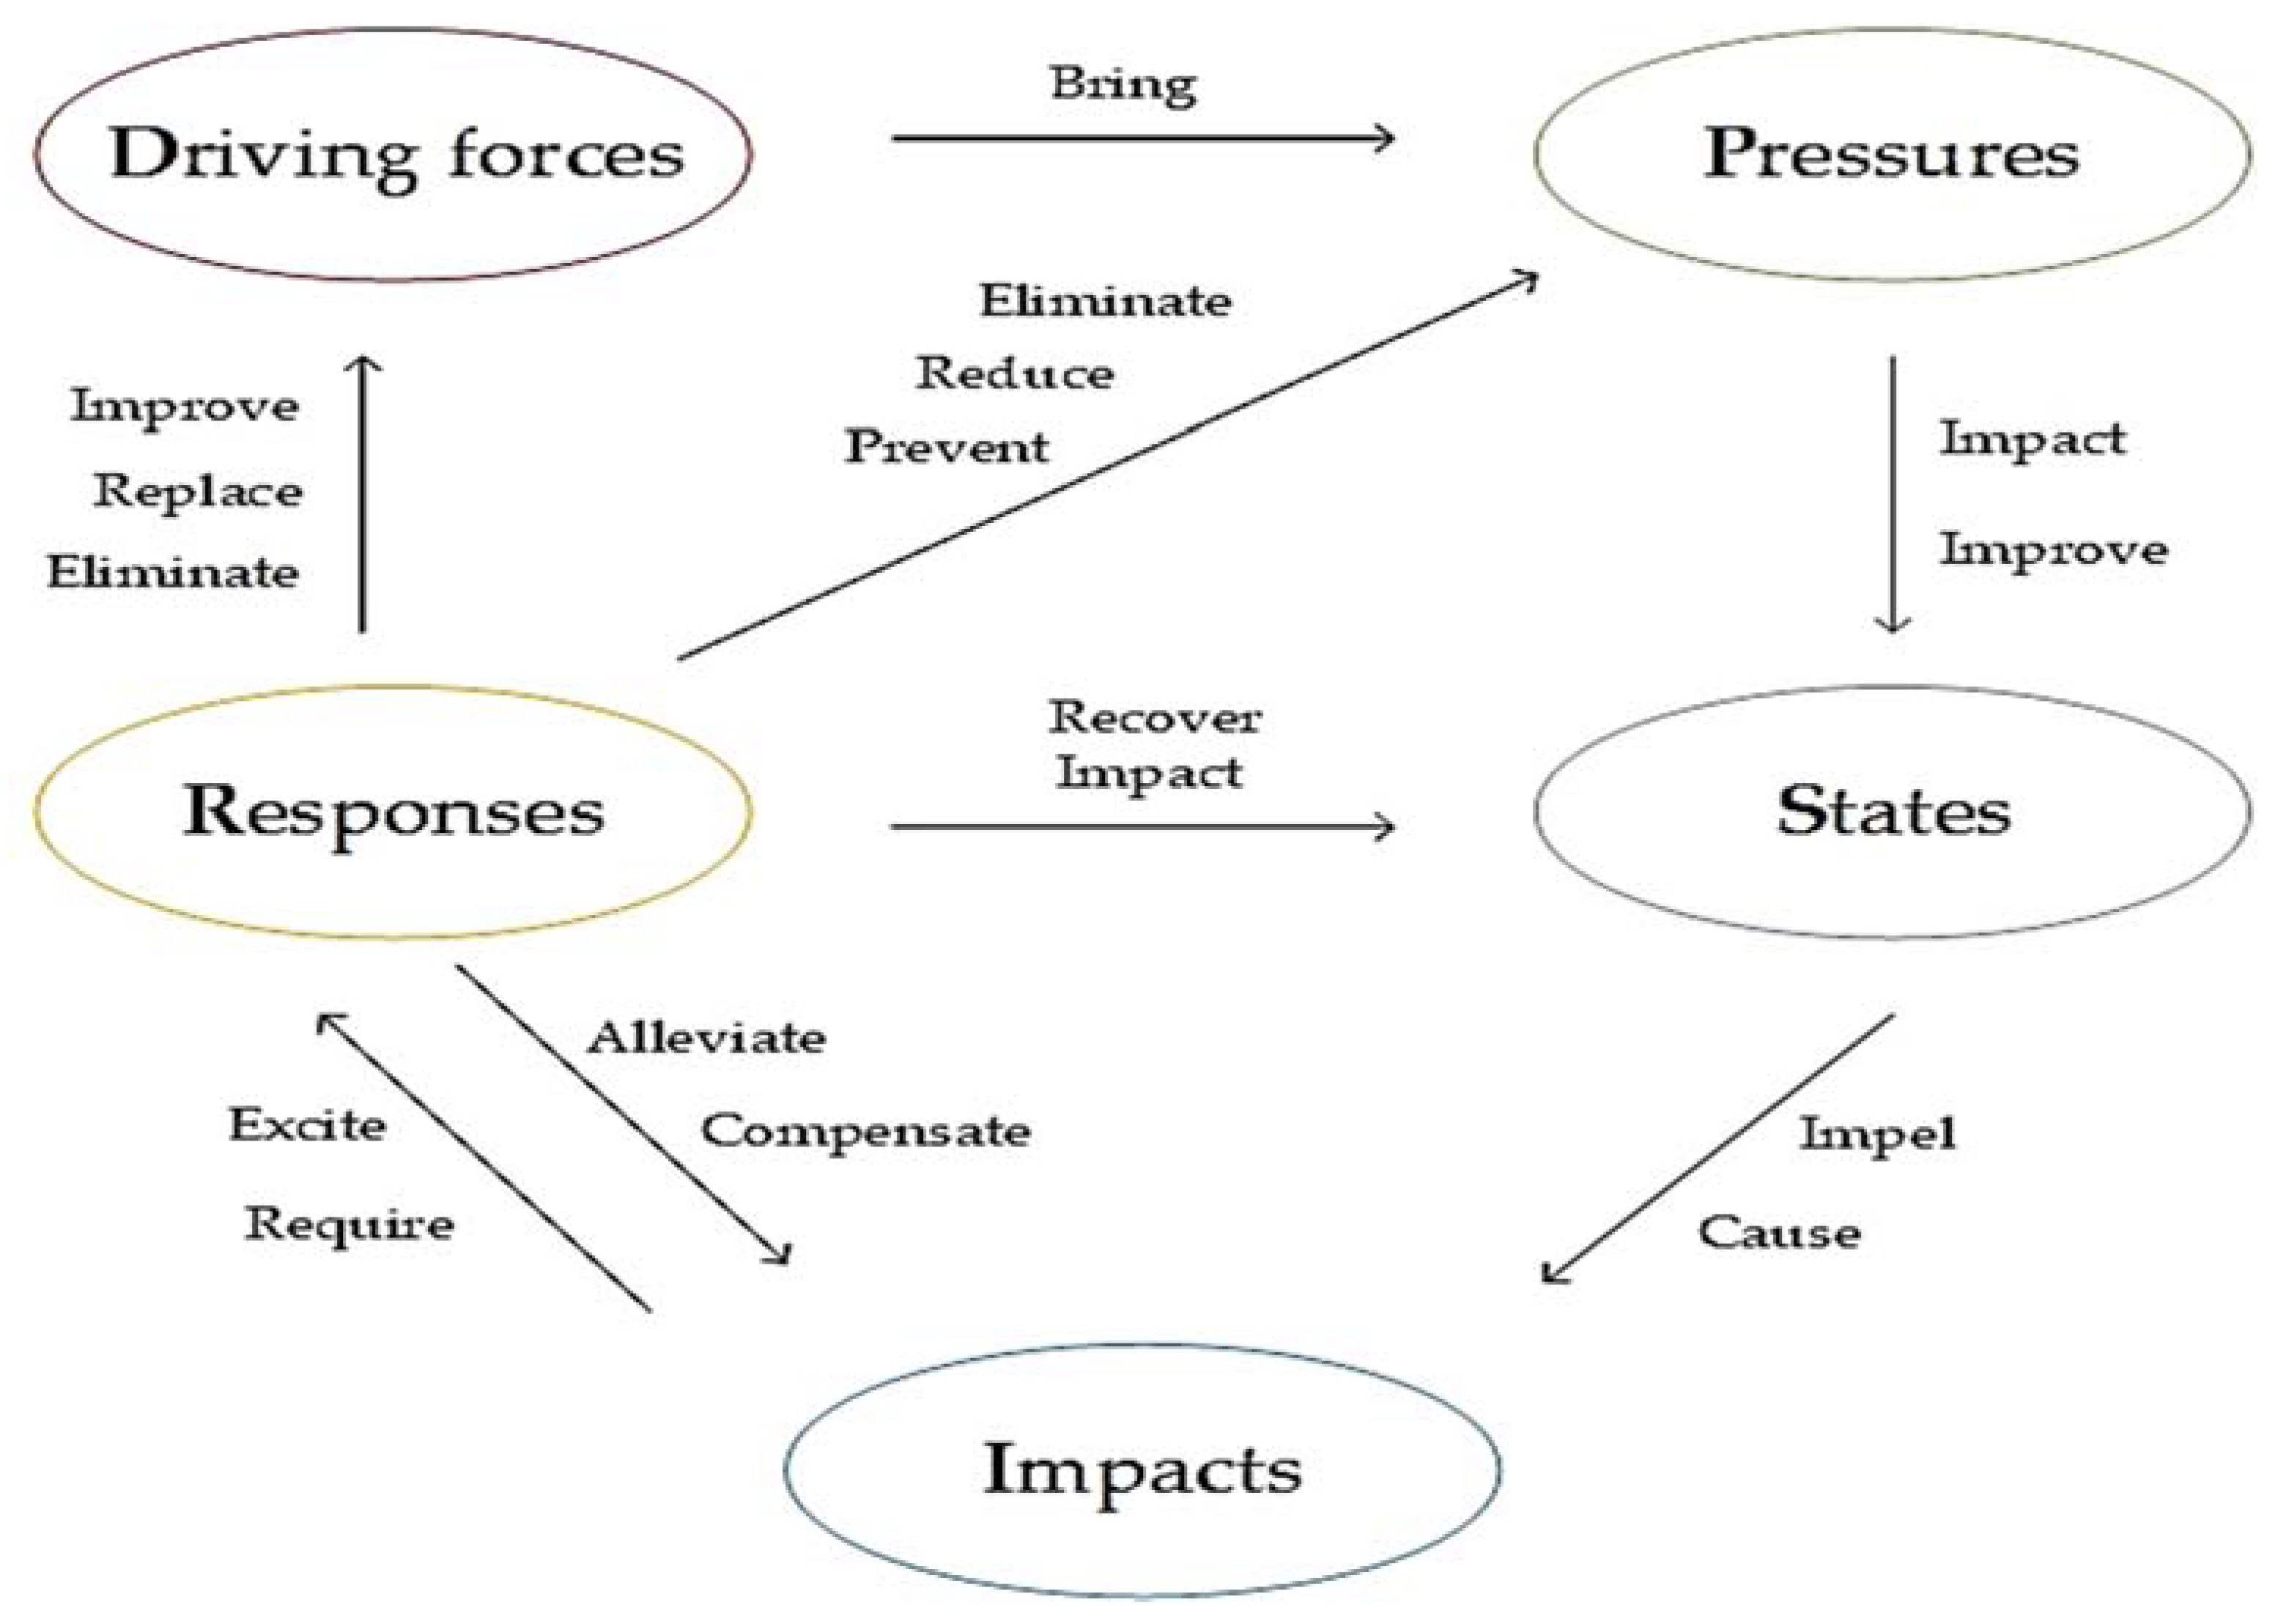
The DPSIR model is a conceptual model widely used in the evaluation index system for environmental systems and is established by the European Environment Agency (EEA). It combines the advantages of the pressure-state-response (PSR) model and driving force-state-response (DSR) model [16], and has the characteristics of comprehensiveness, systematization, integrity, and flexibility. It includes a causality of “what happened, why and how to deal with it.” The model is used to analyze the interaction between human and environment from the perspective of system theory, which not only reveals the impact of economic, social and human activities on the environment, but also reveals the feedback effect of human activities and their resulting environmental states on society. As the DPSIR model provides a systematic approach to analyze the causes [17], consequences, and responses of the changes in the sustainable use of water resources, it is an effective method to explore the relationship between water resources systems and socioeconomic systems.
In the conceptual DPSIR model [18], “D” represents “driving forces,” which can be regarded as the potential cause of the change of regional resources and environment, mainly referring to the internal motive force and development trend of regional social and economic activities. “P” represents “pressures,” and mainly refers to the influence of regional production activities and demand acquisition on the surrounding resources and environment, which is the direct cause of the ecological environment changes. “S” represents “states,” and mainly refers to the various conditions of the regional ecological environment under the driving forces and pressures. “I” represents “impacts,” and refers to the feedback result and influence of each ecosystem state to economy, society, resources, and environment. “R” represents “responses,” and refers to the positive and effective measures and countermeasures to realize the sustainable development of economy and society. The interrelationship between the various indicators is shown in Figure 2.
2.3.2. Combination Weights
The analytic hierarchy process (AHP) method is based on the evaluation of the importance of different factors using pairwise comparison, calculating the weight of the method through the construction of a judgment matrix [19,20]. The determination of its importance depends, to a large extent, on subjective judgment. Entropy weight is a more objective weighting method, which directly uses the obtained index data, calculates the entropy value of the index, and then obtains the weight value [21]. Adopting a combination of AHP method and entropy weight can improve the scientific and reasonableness of weight distribution.
As the AHP method is widely used in weight determination [22], the specific calculation formula is not listed here. The entropy weight method can effectively take into account the degree of variation of each index; to a certain extent, it can avoid the influence of human factors, and objectively reflect their importance level. The specific calculation steps are as follows.
- 1.
- Standardize the original data.where , is the evaluation index; , is the evaluation year, is the initial value of the index; is the normalized value; , is the initial maximum and minimum of the corresponding index.
- 2.
- Calculate the entropy of the indicator .where is the proportion of the ith evaluation index of the jth evaluation factor; is the entropy of the indicator, and .
- 3.
- Calculate the weight of evaluation index .
And it needs to be met ,.
Assuming that the weight of the “i” index obtained by the AHP method is and the weight of the “i” index obtained by the entropy weight method is , then the formula for calculating the combination weights of the “i” index is as follow.
2.3.3. TOPSIS Model
The technique for order of preference by similarity to ideal solution (TOPSIS) model is an “approximate ideal solution ranking” method, which is mainly used to solve the problem of multiobjective decision-making of finite schemes in system engineering [23,24]. It is a comprehensive evaluation method using distance as the evaluation criterion. An improved TOPSIS method based on entropy weight and AHP is helpful to systematically analyze the gap between the sustainable state and the ideal state of water resources. It can comprehensively and objectively reflect the dynamic and changing trends in the sustainable development levels of the regional water resources environment. The specific calculation steps are as follows.
- 1.
- Raw data preprocessing.
Perform the same trend processing for each indicator value, the formula is as follows:
where is the initial value of the index,
- 2.
- Calculate the normalized matrix Z.
- 3.
- Construct a weighted normalized matrix X.
- 4.
- Determine positive ideal solution and negative ideal solution.
Suppose is the maximum value of i index in j years, which is the most preferred solution, in the evaluation data, which is called the positive ideal solution. is the minimum value of i index in j years in the evaluation data, that is the least preferred solution, called the negative ideal solution. The calculation formula is as follows:
- 5.
- Calculate the distance from the evaluation object to the ideal solution and the negative solution.
- 6.
- Calculate the degree of closeness between the evaluation object and the ideal solution.
The larger indicates that the water resources sustainability in this year is closer to the optimal level. When = 1, the sustainable use of water resources is the highest; when = 0, the sustainable use of water resources is the lowest. In this paper, the degree of closeness is used to indicate the level of sustainable use of water resources in the region. According to the degree of closeness each year, the level of sustainable use of water resources can be judged and the advantages and disadvantages can be judged. With reference to the research of related scholars [25,26] and the actual situation in Henan Province, the state of sustainable utilization of water resources is divided into five levels in unequal intervals: Excellent (0.8–1]; Good (0.7–0.8]; General (0.5–0.7]; Poor (0.4–0.5] and Worse (0–0.4].
3. Results
3.1. The Construction of the Index System
According to the requirements of the DPSIR model, with reference to the existing scholars and according to the actual situation in Henan Province, taking the principle of representativeness, hierarchy and operability as the evaluation index, this paper constructs the evaluation of the sustainable utilization of water resources indicator system (Table 1). All indicators are divided into two categories: (1) positive indicators, the value of such indicators and evaluation results have positive correlations—the larger the indicator value, the better the evaluation results; (2) inverse indicators, the value of this type of indicator is inversely related to the evaluation result—the larger the indicator value, the worse the evaluation result.
3.2. The Construction of Combination Weights
Because of the different basic data from each city, the weight calculated according to the entropy weight method is also different. Due to restrictions on the length of this article, the weight calculation results of each city is not listed.
This paper takes the data from Zhengzhou as an example to calculate the index weight. According to the relative importance of each index, the judgment matrix is constructed, and the weight value of each index as determined by AHP is obtained. The result is shown in the W1 part of Table 2. In Formula (1)–(4), the weight of each index is calculated using the entropy weight method, and the results are shown in the W2 part of Table 2. The index weight value obtained by AHP and entropy weight method is added to Formula (5), and the final sustainable utilization of water resources evaluation index combination weight W is obtained.
3.3. Sustainable Utilization of Water Resources Analysis Based on Weighted TOPSIS Model
The raw data of 18 cities in Henan Province from 2006 to 2015 were taken into the weighted TOPSIS model according to Formula (6)–(13). The evaluation value of the comprehensive sustainable utilization of water resources and the specific evaluation index value of each subsystem were obtained. Due to article space limitations, specific numerical tables are listed in the Appendix Table A1 and Table A2.
4. Discussion
4.1. Comprehensive Analysis of the Sustainable Utilization of Water Resources in Henan Province
Through the analysis of the evaluation results (Figure 3, Figure 4 and Figure 5, Table 3), the main conclusions can be drawn as follows.
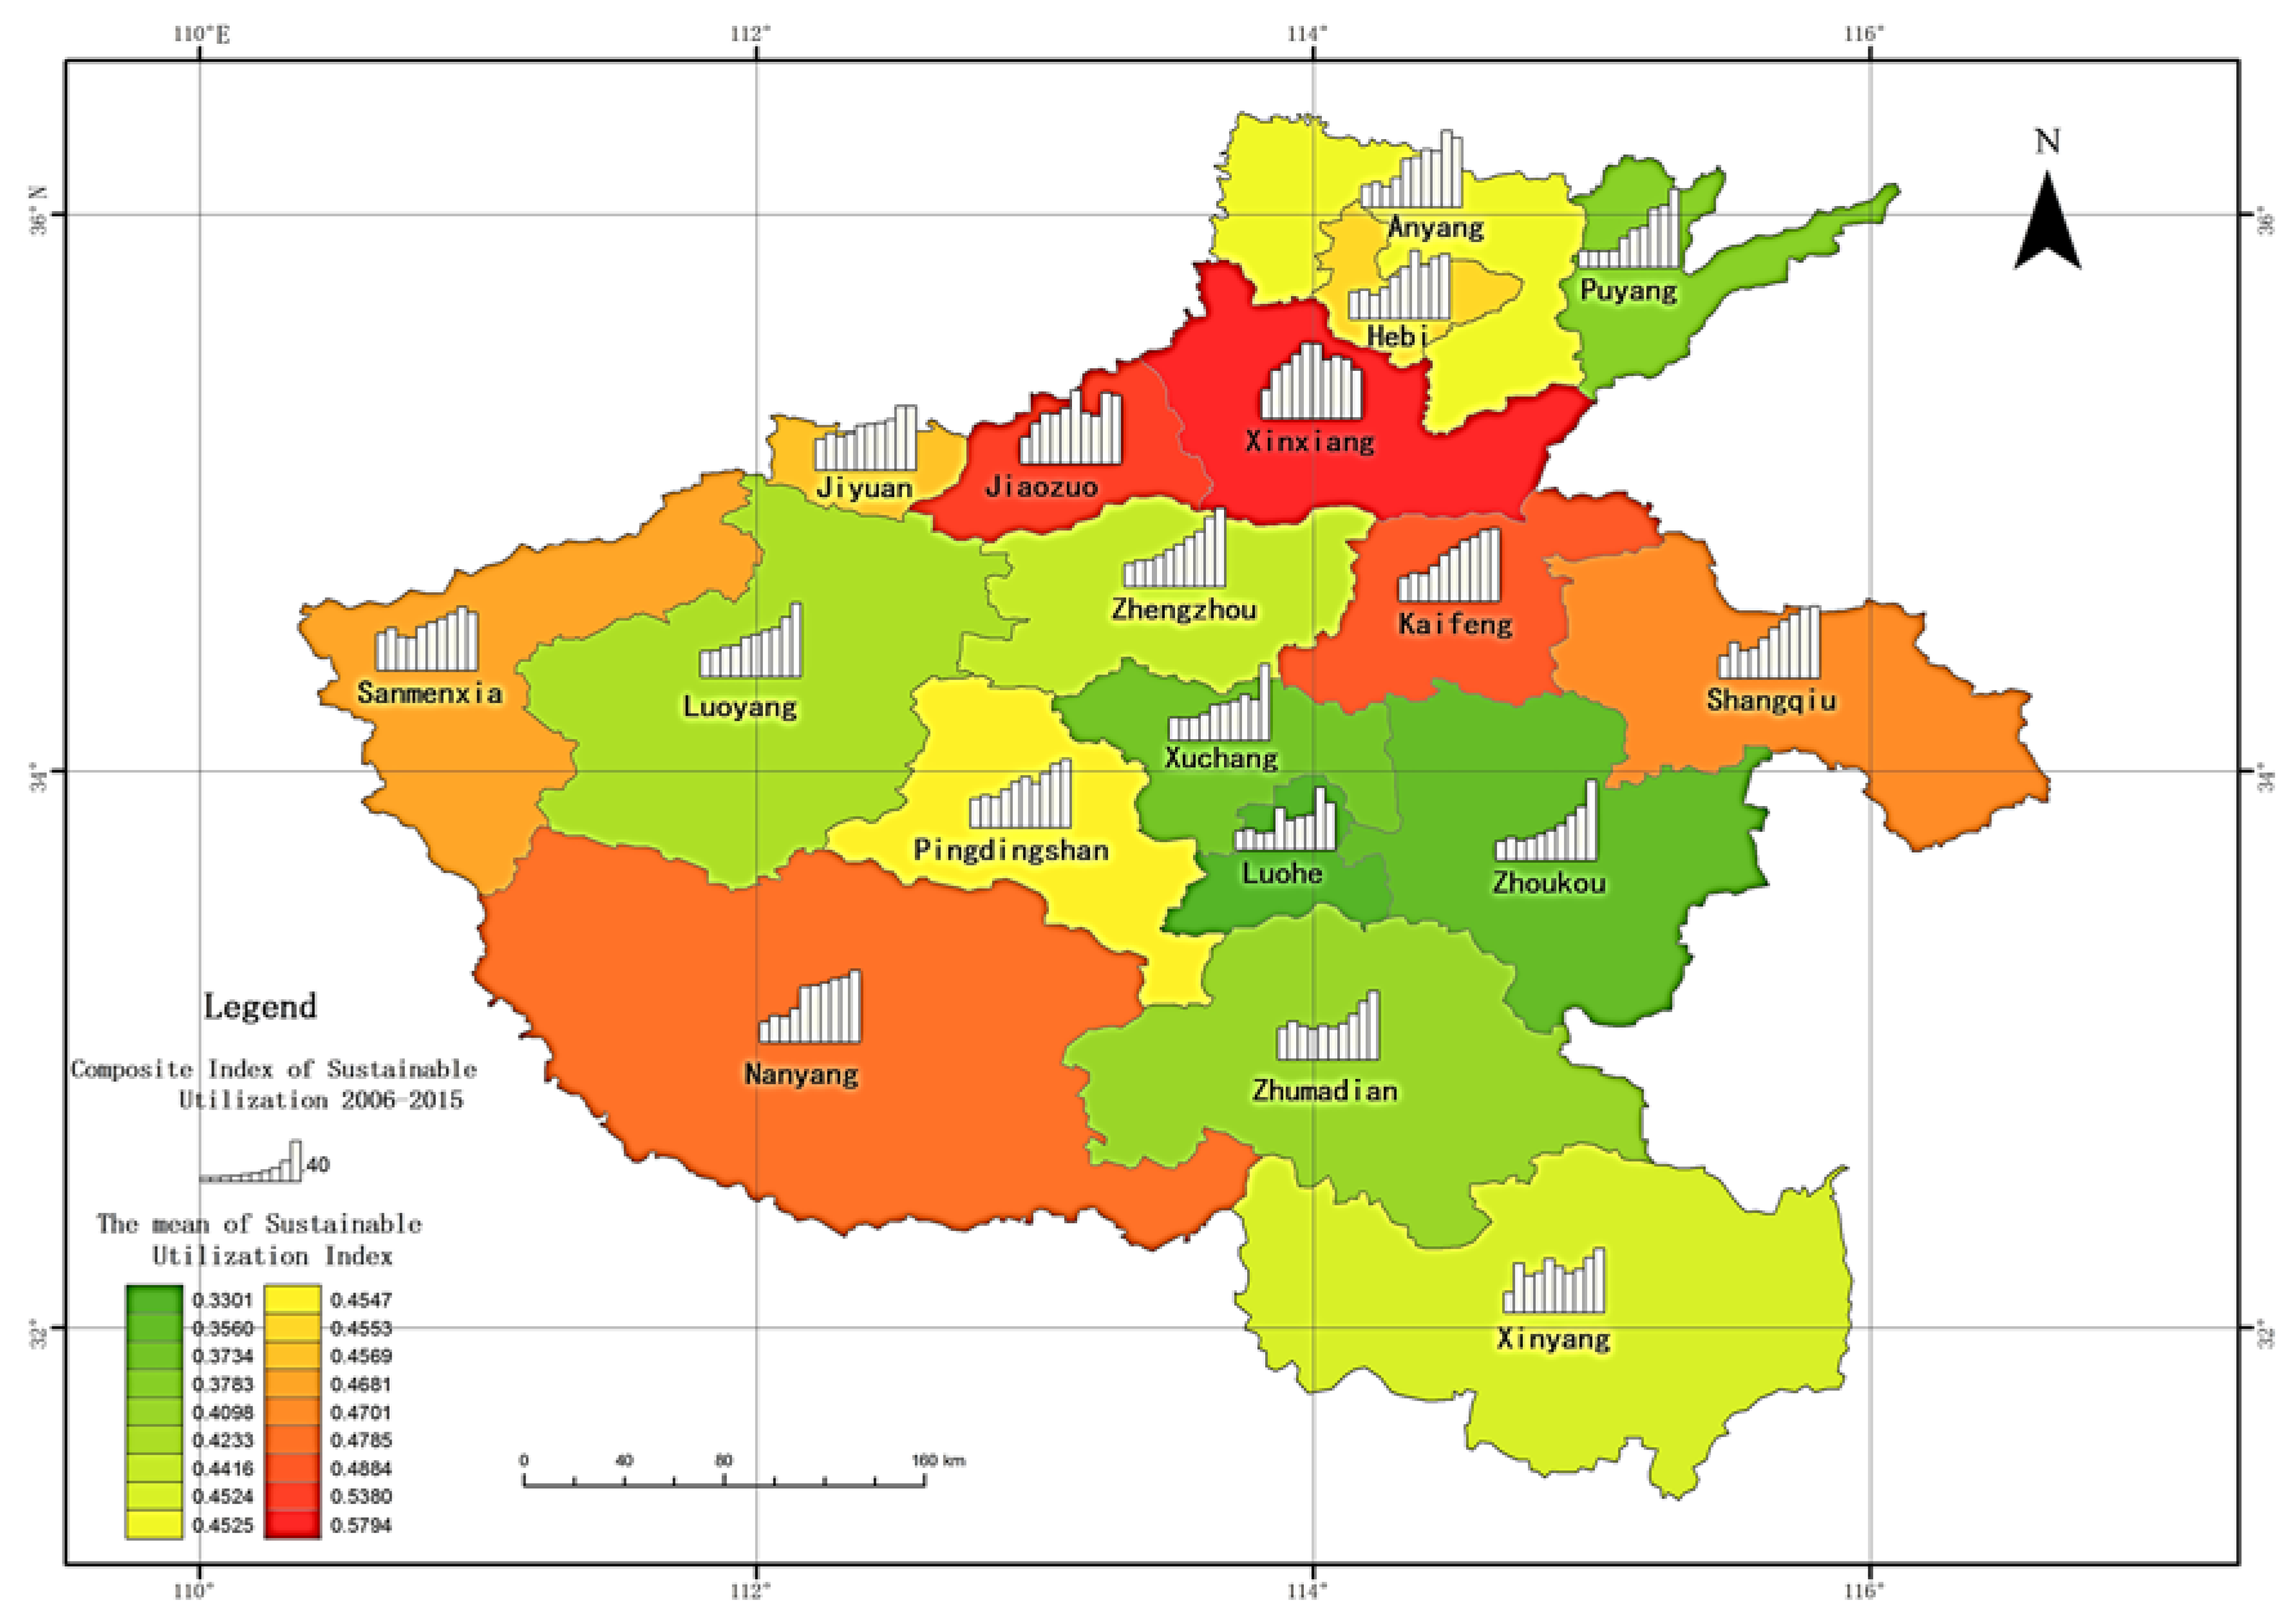
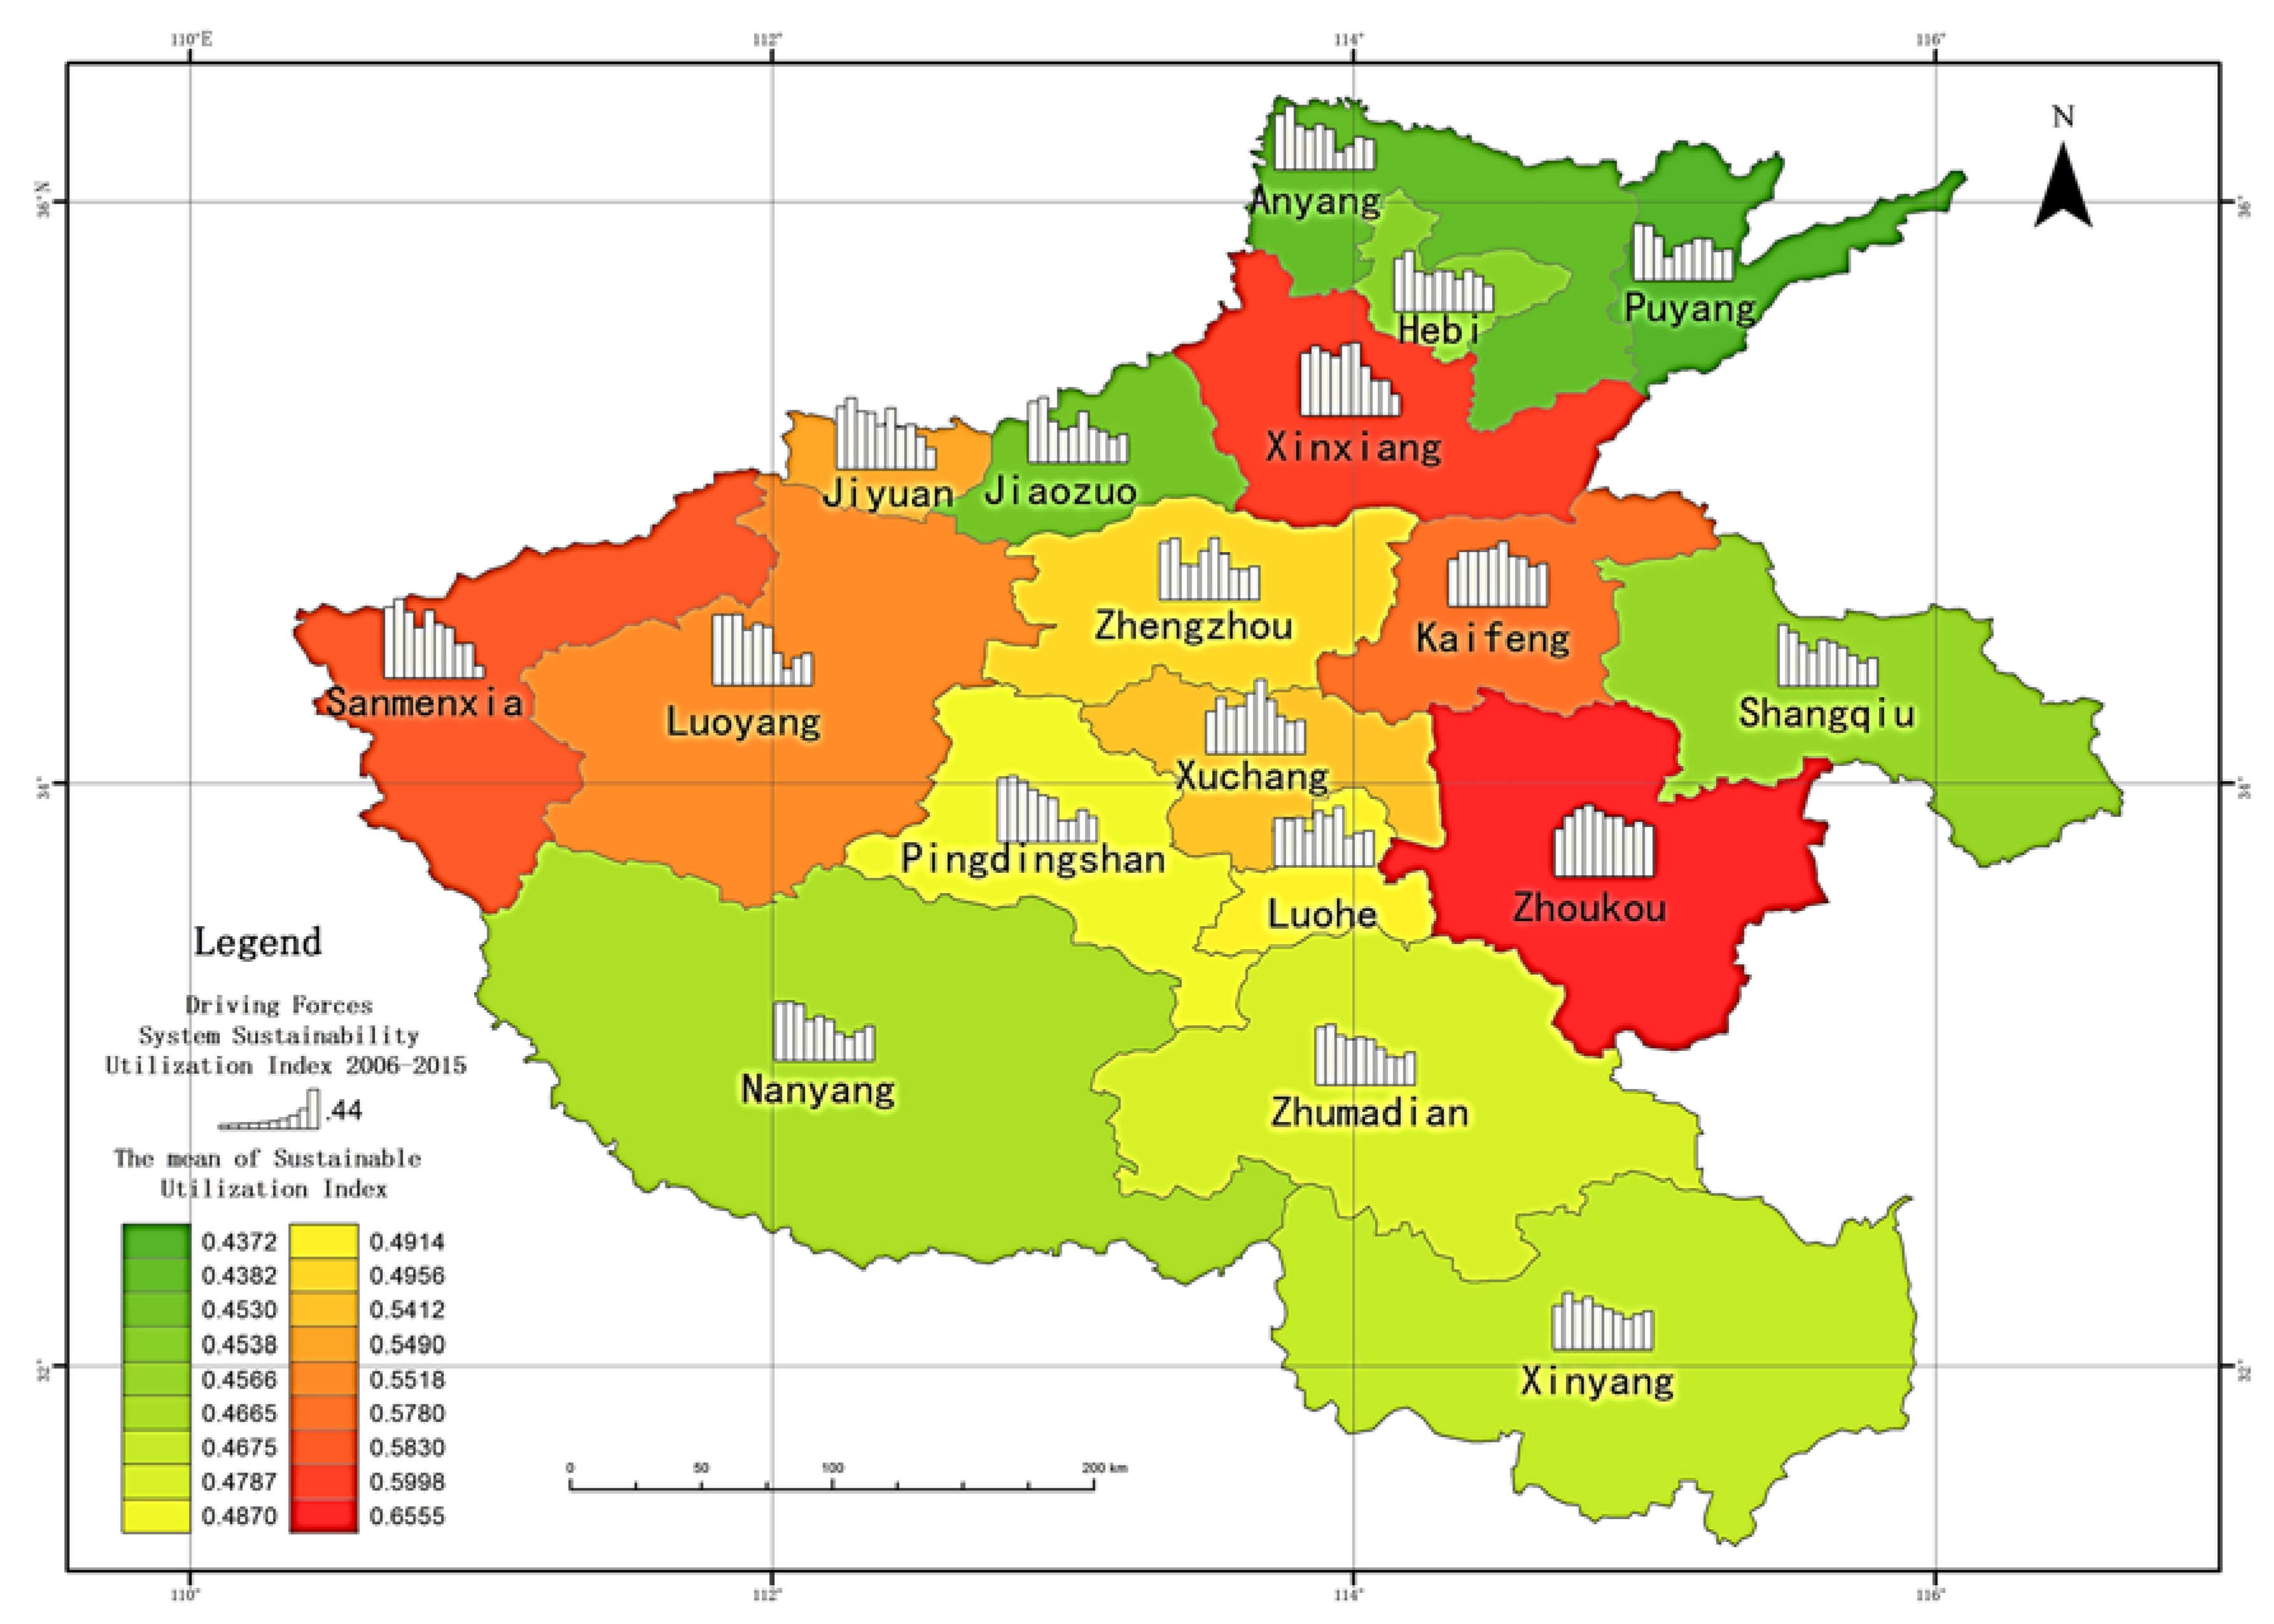
The sustainable utilization of water resources in Henan Province is consistent with the level of economic development, showing a spatial pattern of high in the north and southwest and low in the middle and southeast, with the rank order in an olive-shaped distribution.
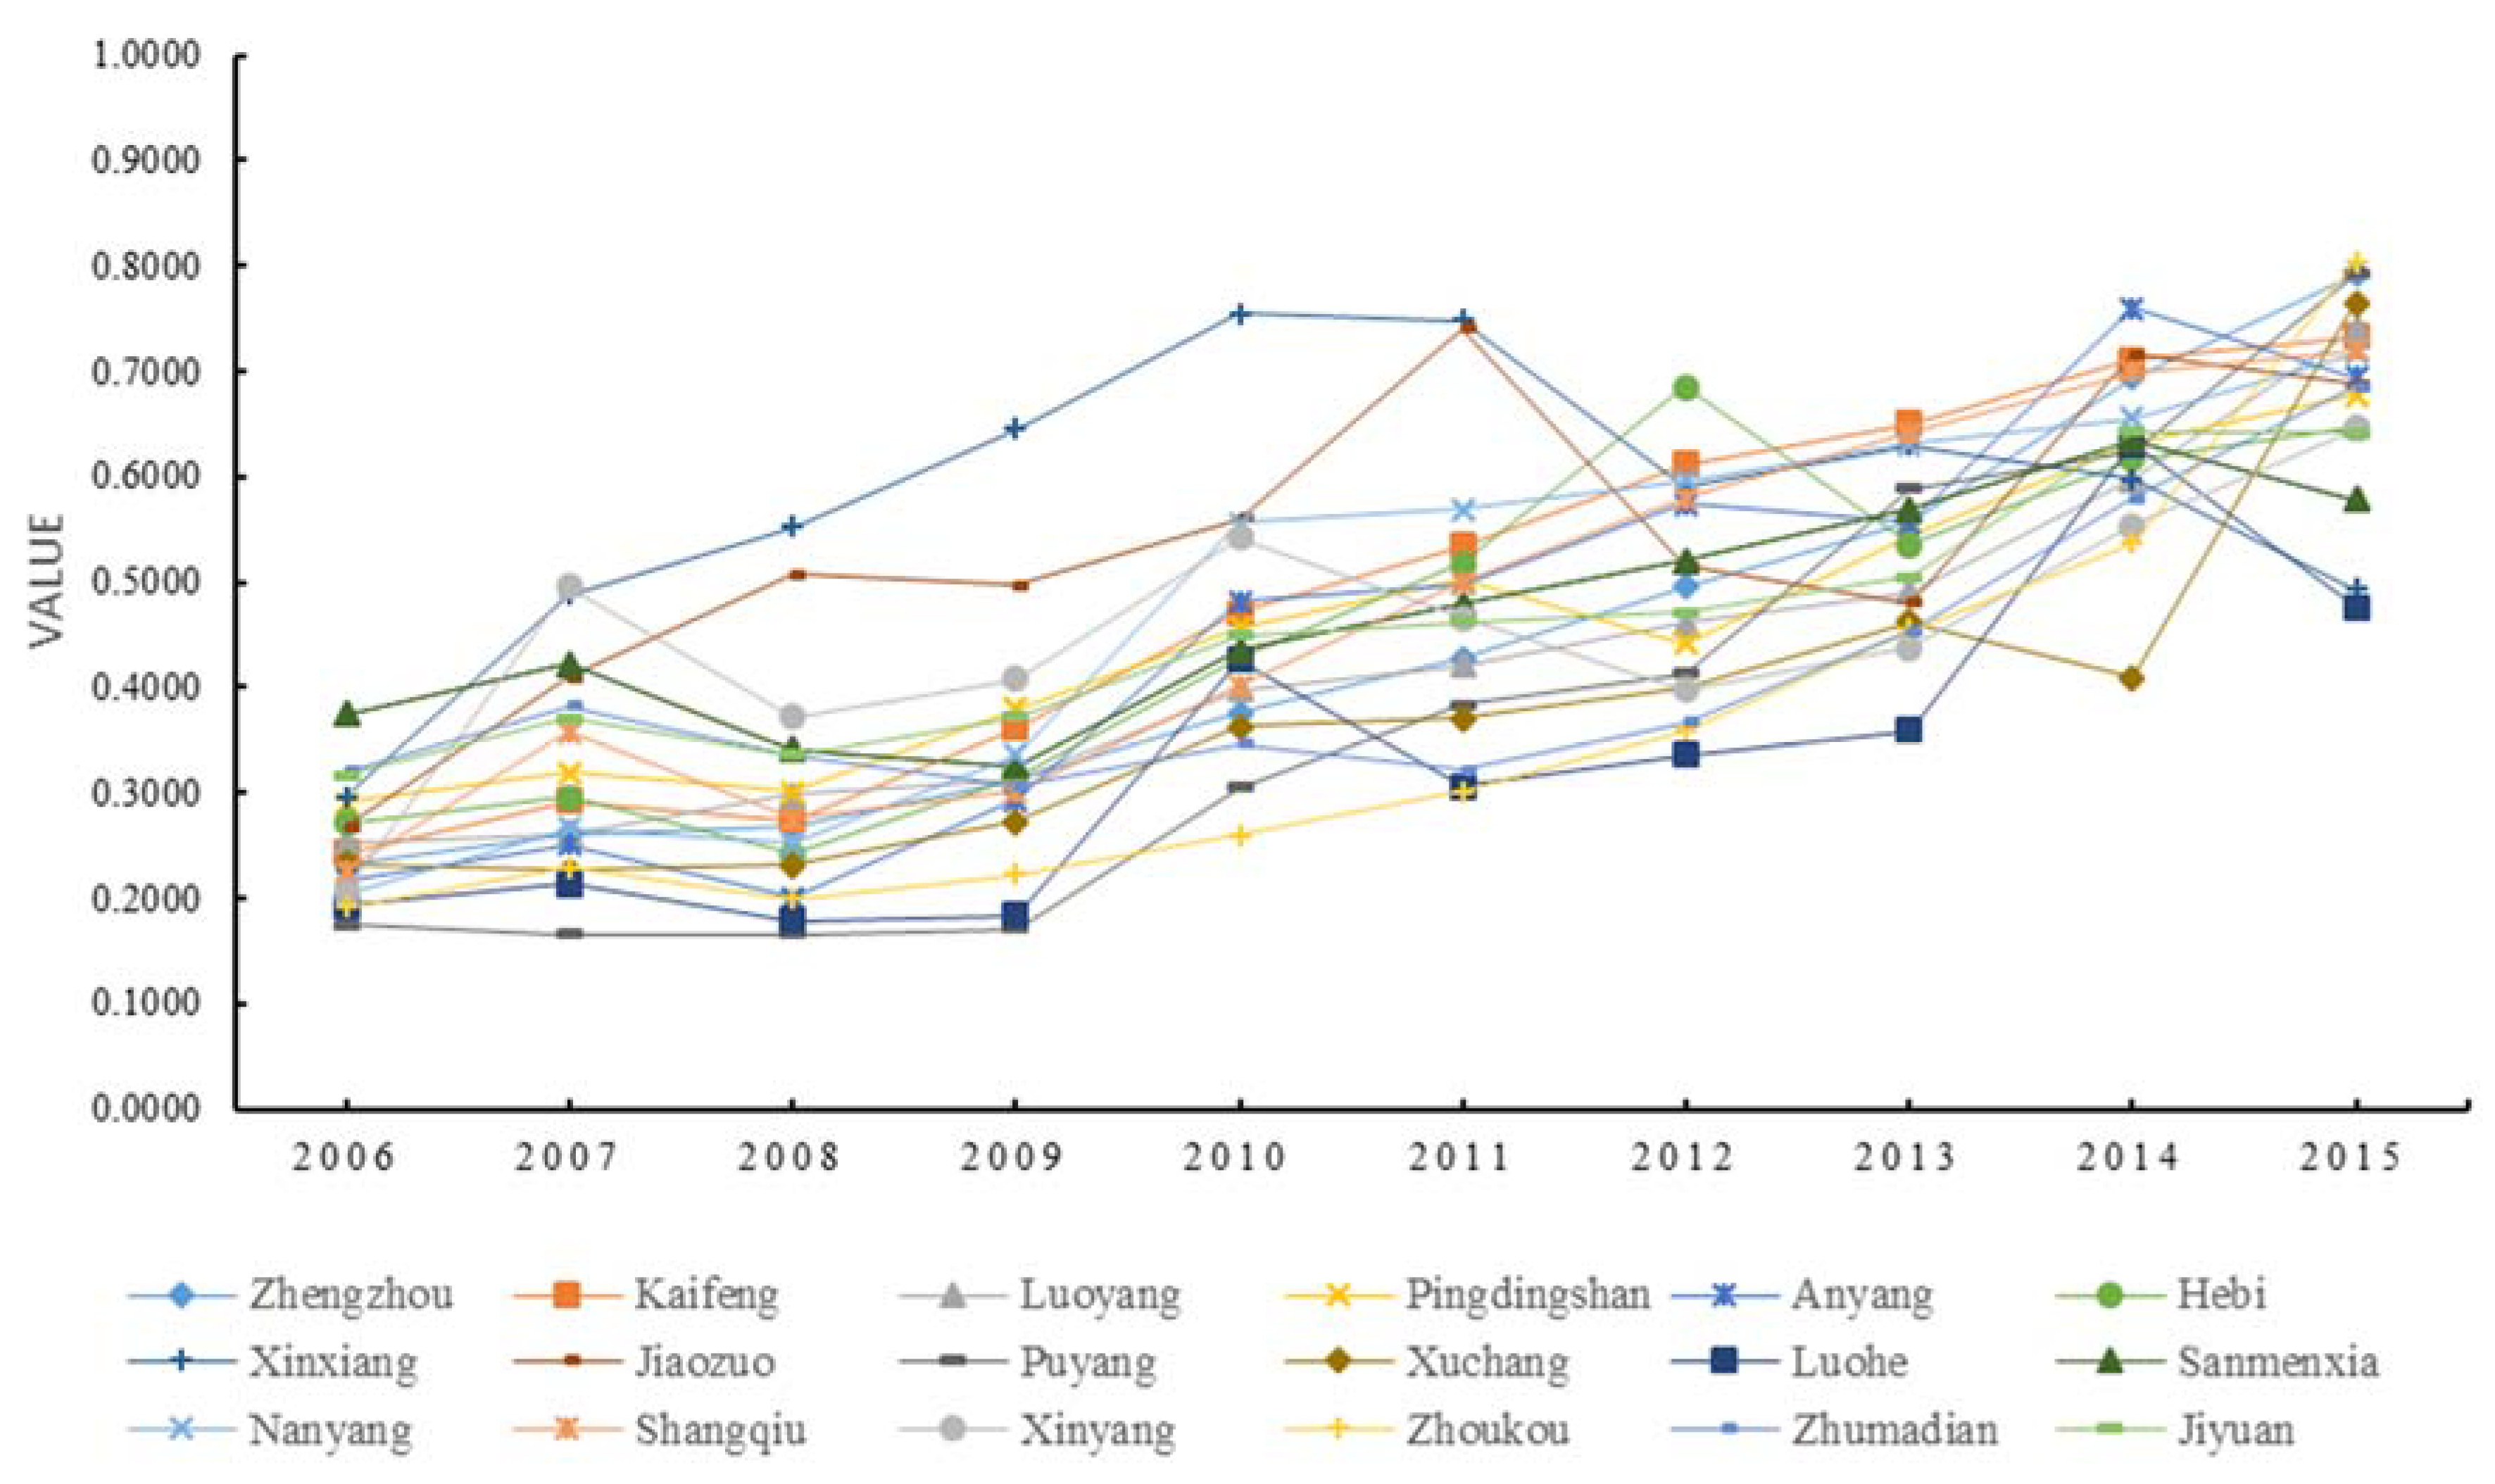
Table 3 and Figure 3 and Figure 4 show that the sustainable utilization of water resources in Henan Province has been increasing steadily in the past 10 years, with the average value increasing from 0.2507 in 2006 to 0.6827 in 2015. This level has changed from worse to general, but overall is still on the low side and the sustainable utilization of water resources varies greatly in different cities. In 2015, the highest value was 0.8043 (Zhoukou), which is 1.7 times the lowest Luohe (0.4758). Except for the obvious fluctuation of the value in Xinxiang over the past 10 years, the other cities showed an upward trend to varying degrees.
The spatial distribution of the sustainable utilization of water resources shows a pattern of high in the north and southwest and low in the middle and southeast, which is basically consistent with the economic development of each city. The rank order was in an olive-shaped distribution: Xinxiang and Jiaozuo were located at the top of the olive and were at a general level; Luohe, Zhoukou, Xuchang and Puyang are located at the bottom of the olive and were at the worst level, and the remaining 12 cities are in the middle of the olive and were at a poor level.
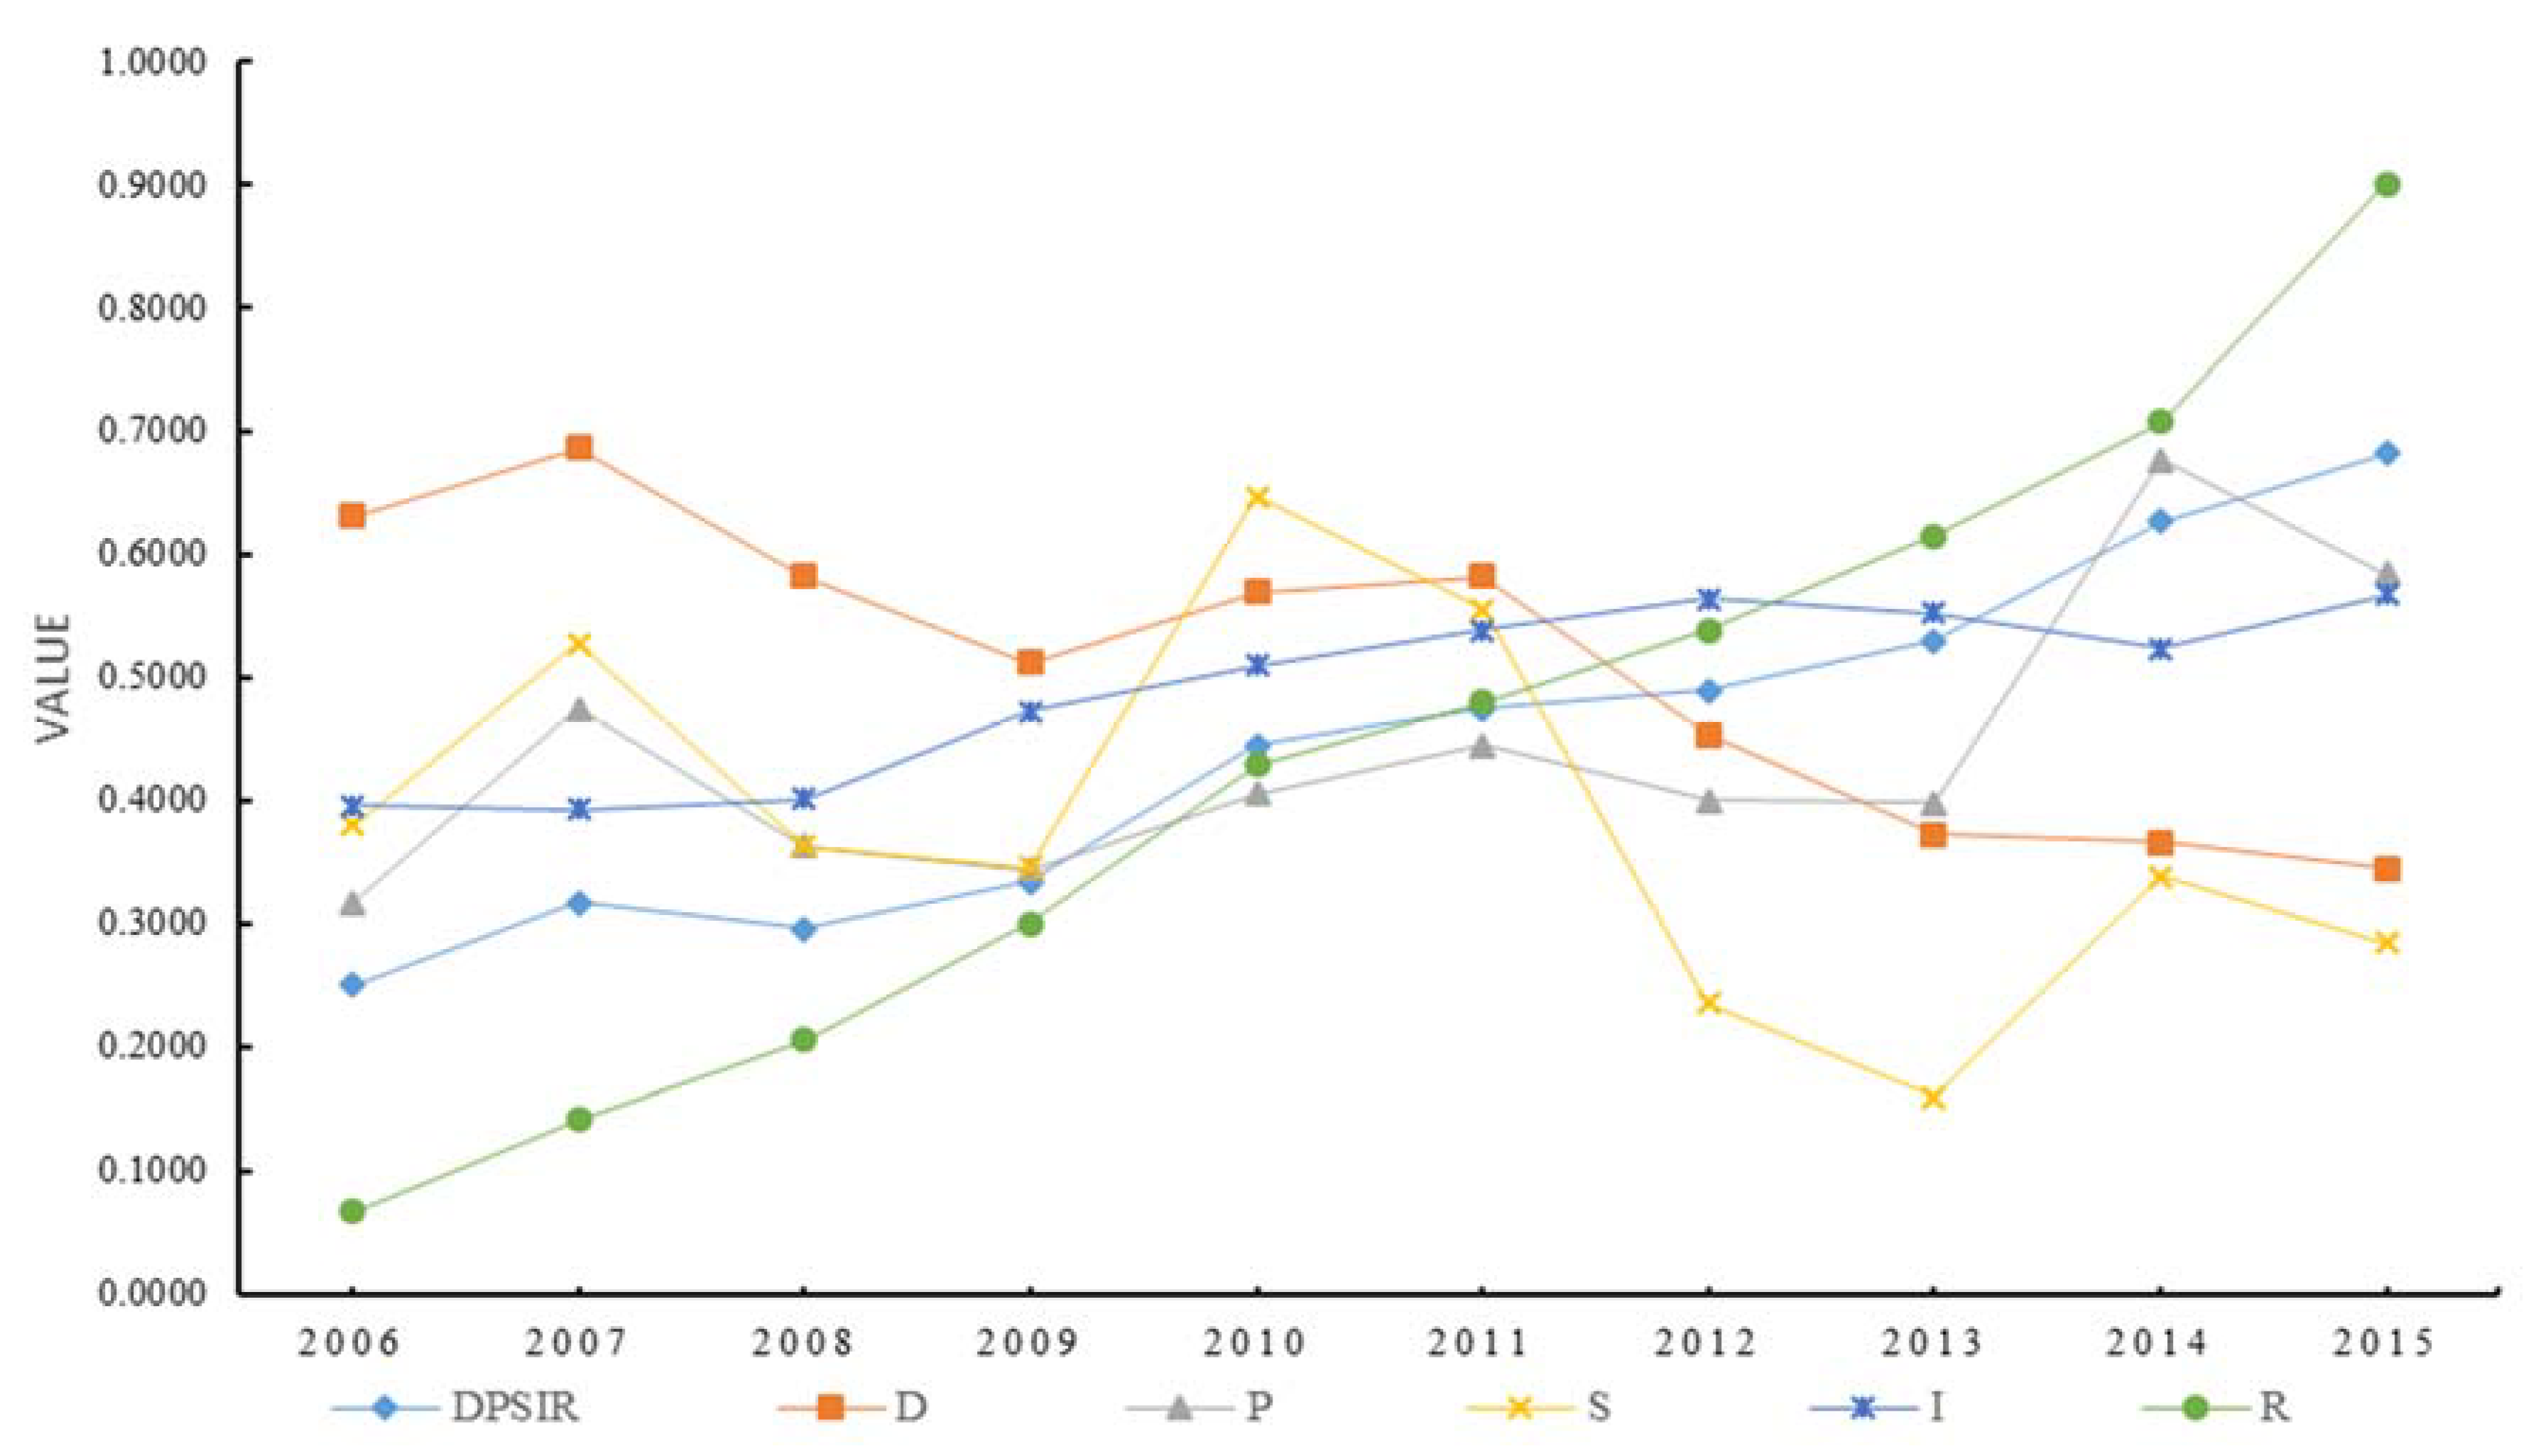
The influence of each subsystem on the comprehensive index of sustainable utilization of water resources is quite different. Table 3 and Figure 5 show that the average value of the composite index of the sustainable utilization of water resources is increasing year on year. The influence of each subsystem on the composite index is quite different. With domestic economic growth slowing down, the D subsystem gradually decreased from 0.6317 in 2006 to 0.3452 in 2015. Conversely, the contribution of the P subsystem to the comprehensive index increased gradually, with a slight upward trend, from 0.3171 in 2006 to 0.5814 in 2015. The relative variation of the S subsystem index was large, with a sudden change in 2010 and the maximum value being close to 0.647. The growth trend of subsystems I and P was the same, from 0.3962 in 2006 to 0.5676 in 2015. The R subsystem showed a significant upward trend, with an average index of 0.9 in 2015 and 13 times that in 2006, indicating that every city has taken a series of positive and effective measures to protect the water environment and promote the sustainable development of water resources.
4.2. Analysis of Subsystems of the Sustainable Utilization of Water Resources in Henan Province
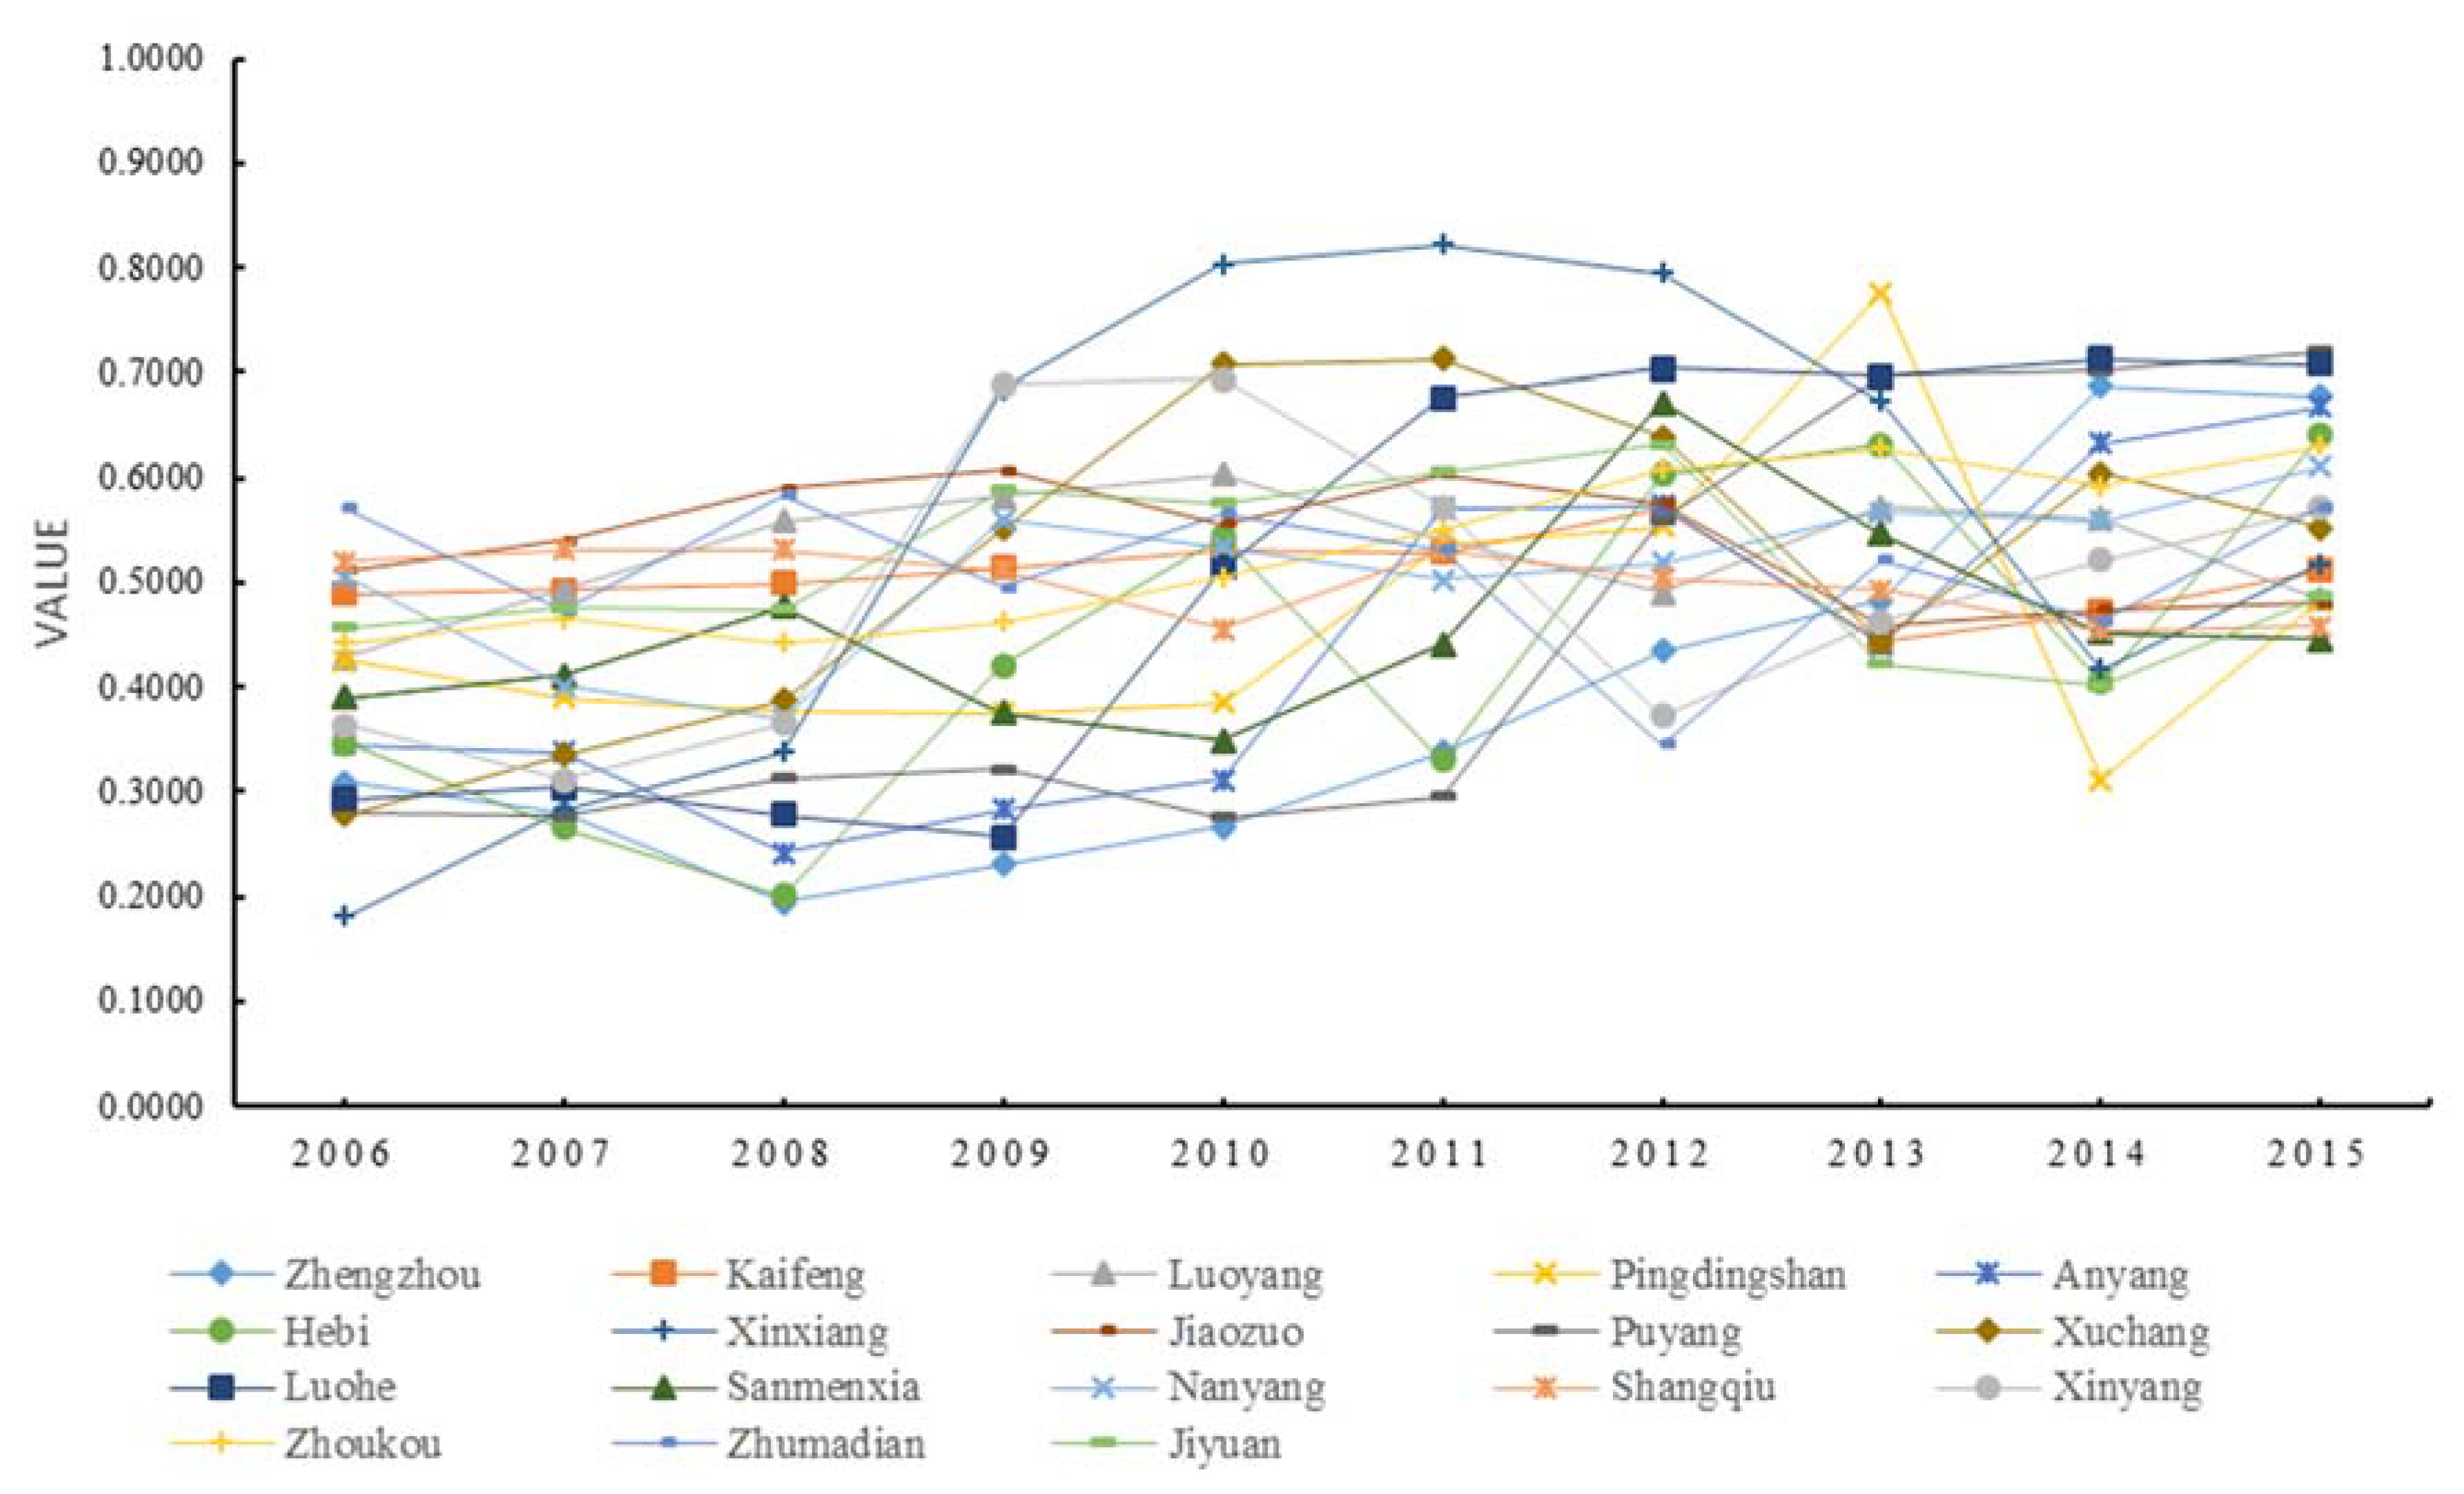
The sustainable utilization index of D subsystem in each city showed a fluctuating decreasing trend; the spatial pattern was high in the middle and low in the north and south.
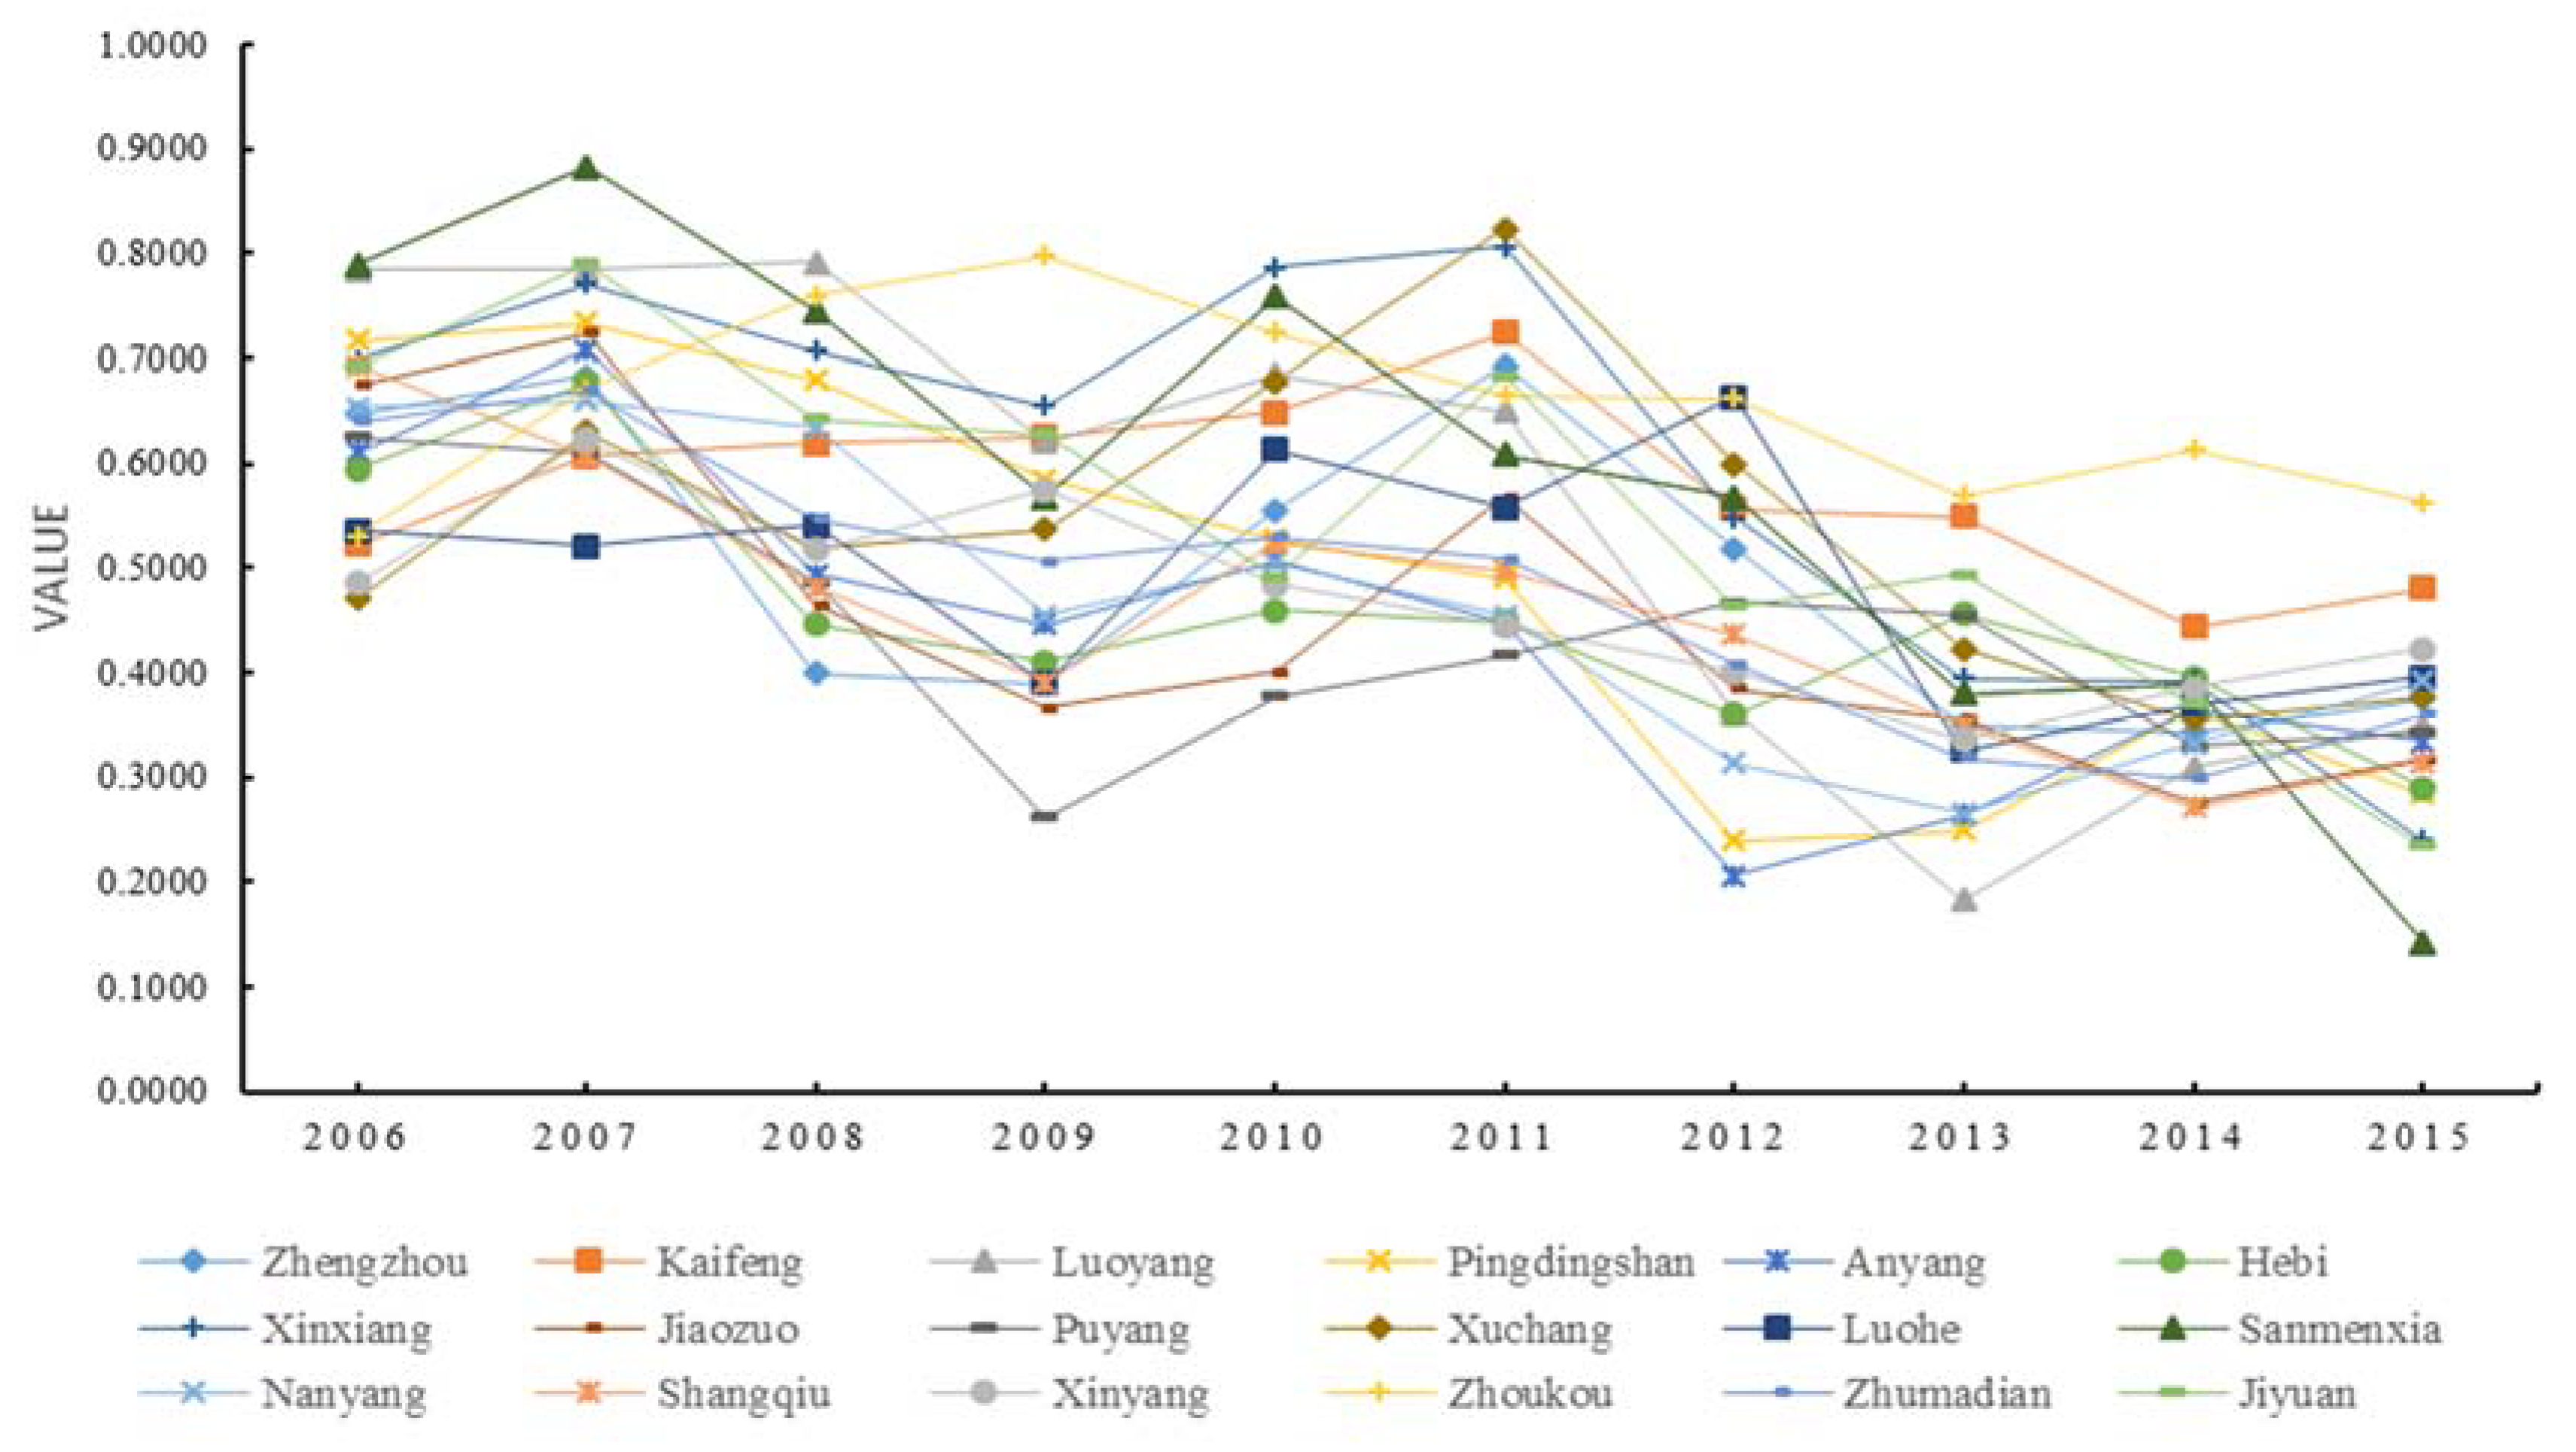
Figure 6 and Figure 7 show that in the last 10 years, the sustainable utilization index of D subsystem in the cities of Henan Province has experienced a fluctuating decrease, which is basically consistent with the trend of GDP in the cities. In 2006, the lowest sustainable utilization index of subsystem D was 0.5312, while the lowest value was 0.1426 in 2015 (around 25% of the 2006 figure). The spatial pattern was high in the Middle Eastern region and low in the South and North.
Since the global financial crisis in 2008, the growth rate of GDP in Henan Province has gradually decreased; the adjustment in industrial structure and the slowdown of urbanization have largely led to the decline of D subsystem index in various cities. In the central and eastern region, the population is concentrated, the industrial base is strong and the economy is developing rapidly, so the sustainable utilization index of subsystem D is higher than that in the southern and northern regions. The rank order is relatively balanced: there are ten cities at a poor level and eight at a general level.
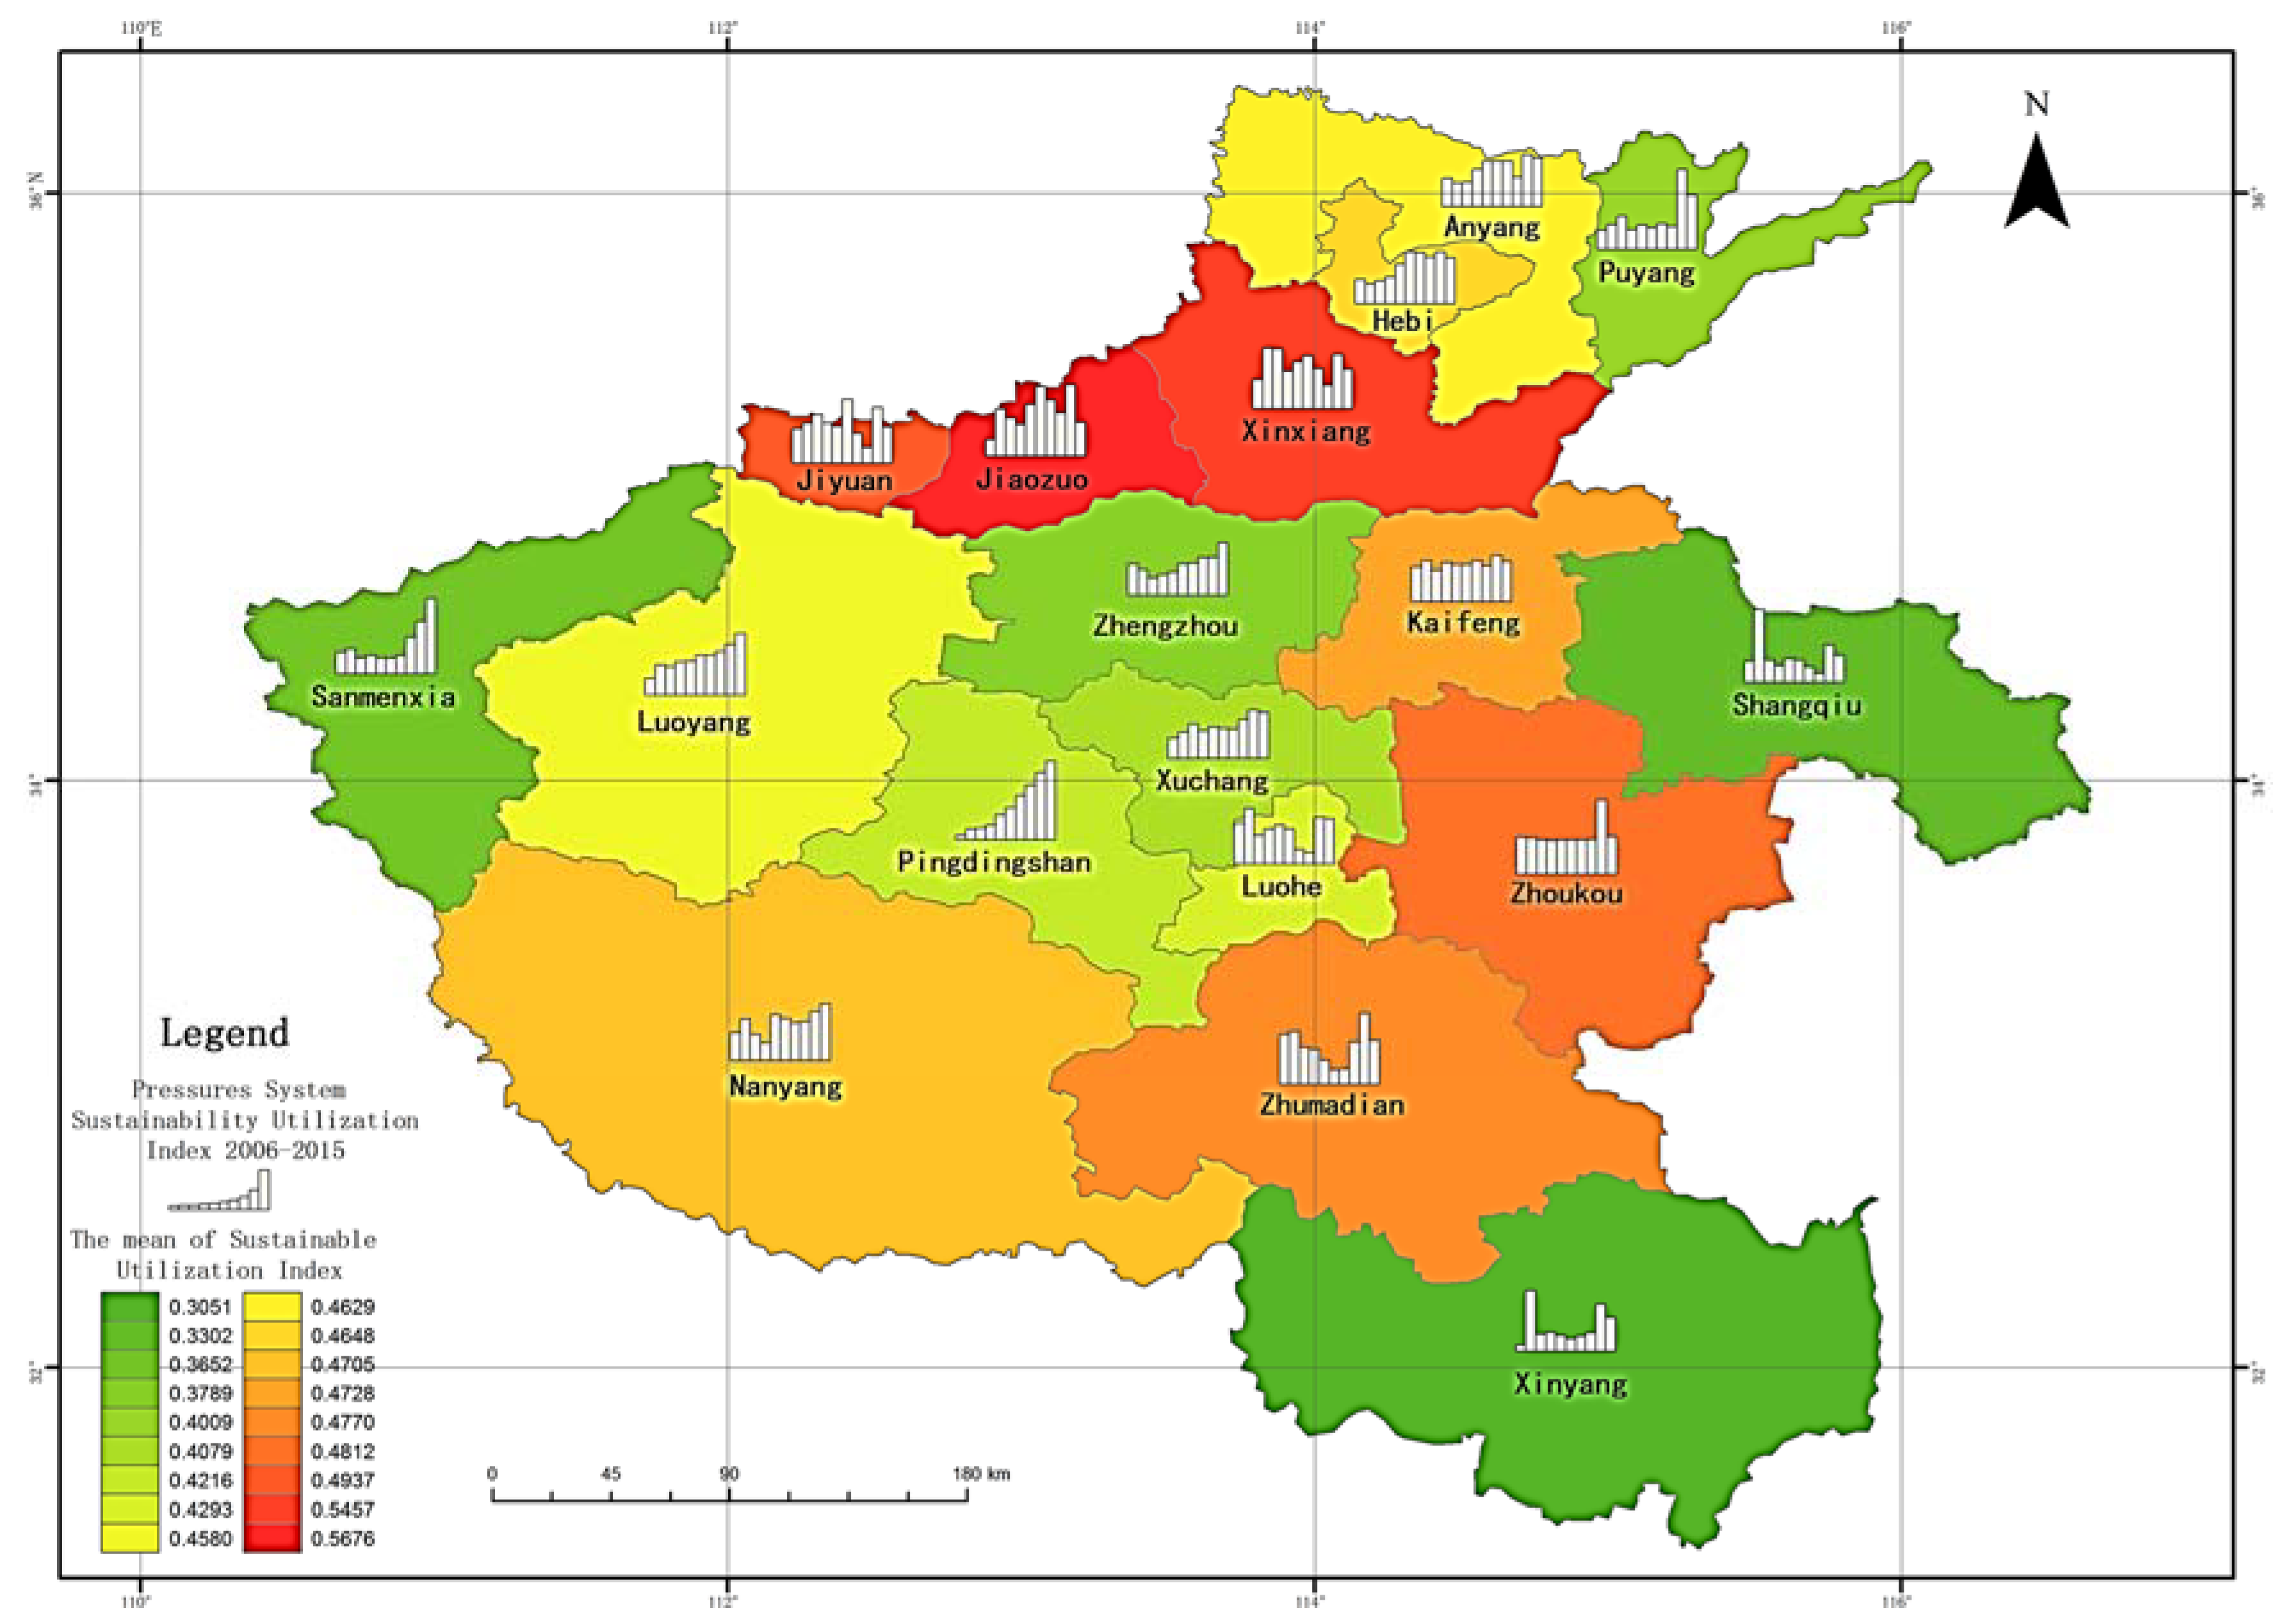
The sustainable utilization index of P subsystem in all cities showed a fluctuating upward trend, and the spatial pattern was low in the western mountainous area and the central plain, and high in the northwest and southeast.
Figure 8 and Figure 9 clearly show the trend and spatial pattern of the change in the sustainable utilization index of the P subsystem in Henan Province. In 2006–2015, the index of the sustainable utilization of the P subsystem showed a trend of rising volatility. Besides the Pingdingshan index rising linearly, the trend in the other cities was basically the same, and the contribution rate of the P subsystem to the whole increased gradually. In 2006, the highest sustainable utilization index of the P subsystem was in Zhumadian, with a value of 0.6169, while in 2015 the highest value was Pingdingshan (0.9645). The spatial pattern is low in the western mountainous area and central plain, and high in northwest and southeast (except Xinyang).
As the western mountainous area and the central plain are the main grain-producing and population concentration areas in the province, the traditional farmland diffuse irrigation method is relatively common, and water-saving irrigation technology is not mature, leading to a great waste and loss of water resources. This puts great pressure on the sustainable utilization of local water resources, and the contribution of the P subsystem to the whole is lower than that of the northwest and southeast cities.
The rank order is spindle-shaped distribution, at the ends are Jiaozuo and Xinxiang at a general level and Xinyang, Shangqiu, Sanmenxia and Zhengzhou at the worst level, and in the middle are 12 cities at the poor level. The overall contribution rate of the P subsystem is low and the sustainable pressure is high.
The sustainable utilization index of the S subsystem in the cities of Henan Province shows a W-shaped trend, with a large fluctuation range and a relatively low index. The spatial pattern is basically high in the east and low in the west.
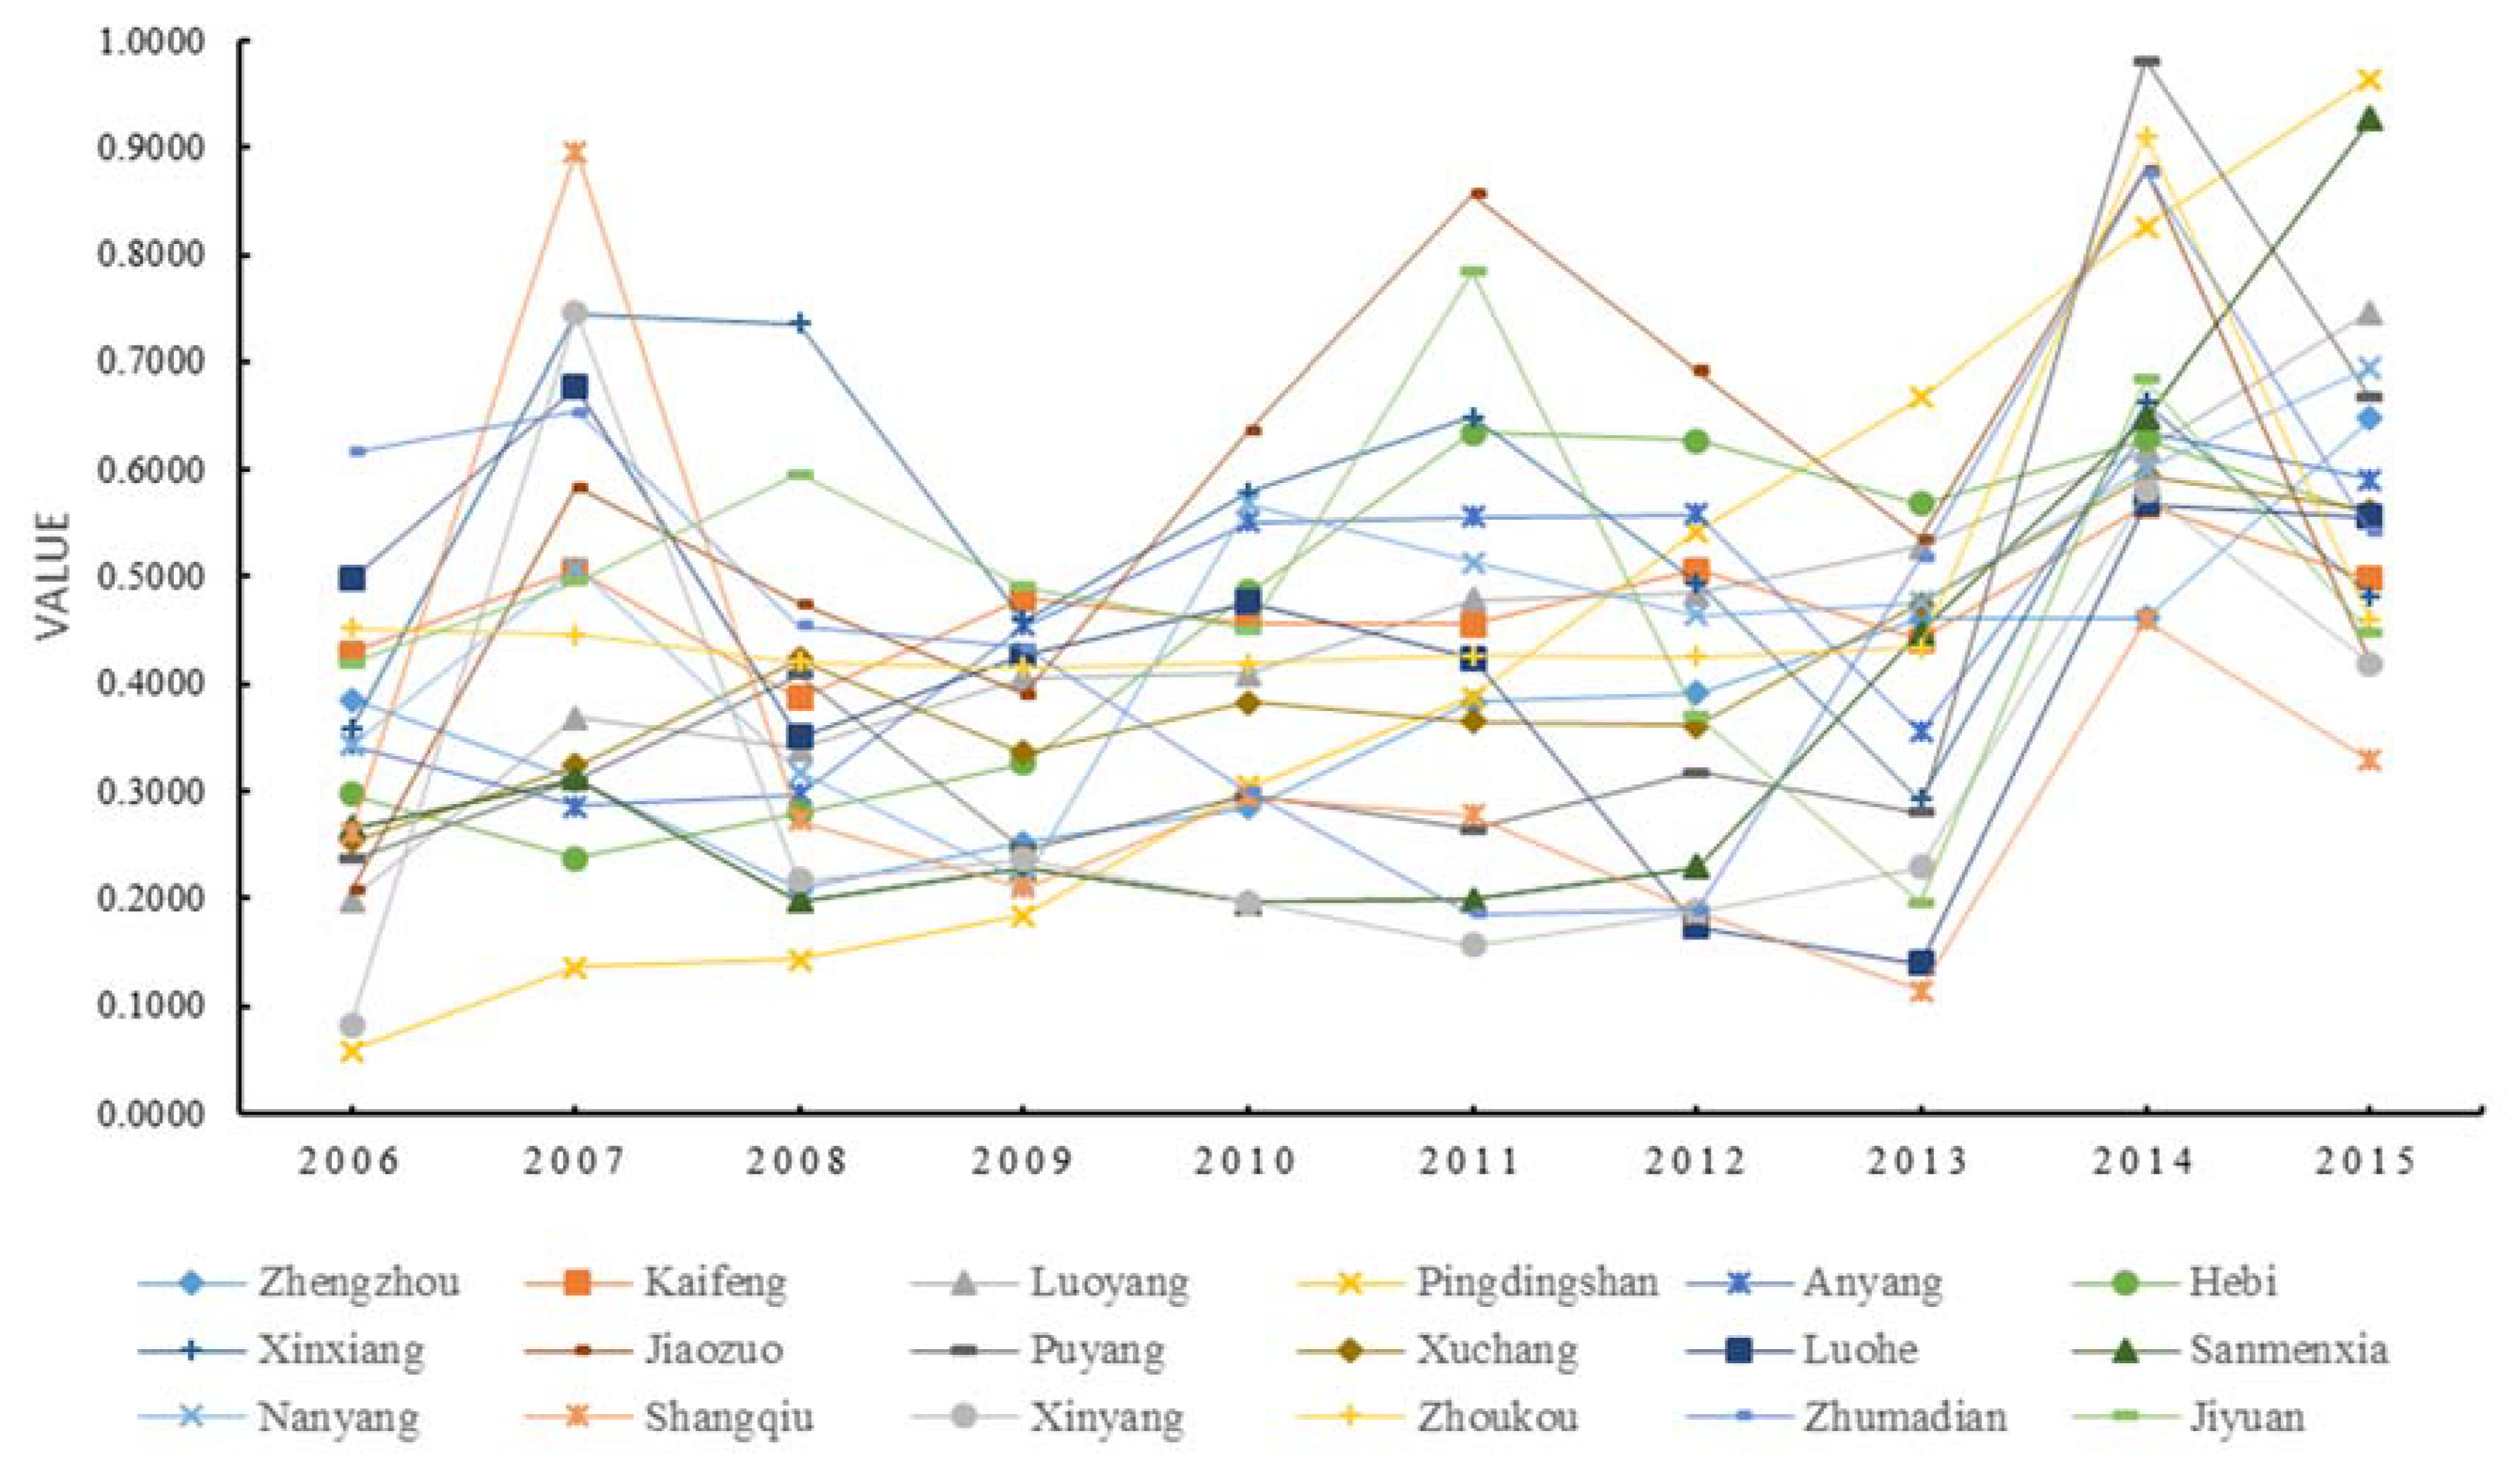
Figure 10 and Figure 11 show that the sustainable utilization index of the S subsystem in each city has changed frequently in the past 10 years and the amplitude is large, showing an obvious W shape. In 2006, the average value of the S subsystem in the province was 0.3805; it fluctuated to a local maximum of 0.6469 in 2010, and then fell to its lowest level of 0.1598 in 2013 and recovered slightly to 0.2847 in 2015. Although results in Luohe has been at a low level, the S subsystem in other cities has changed significantly, but the overall trend has decreased slightly. The index is relatively low, and the pressure of sustainable utilization is relatively large.
Due to climatic reasons, the annual precipitation and water resources in Henan Province are relatively small and the spatial-temporal distribution is uneven, which has a great impact on the change of the index. The spatial pattern is high in the east and low in west, and there are more rivers and lakes in the east, with a higher consciousness for saving water and lower per capita water consumption than in the west. Therefore, the overall contribution rate of the S subsystem in the eastern region is higher than that in the western region.
The rank order is pyramidal distribution, which can be divided into three levels: Kaifeng and Xinxiang in the first level, Xinyang, Zhoukou and other six cities in the second level, and Nanyang and ten other cities in the third level.
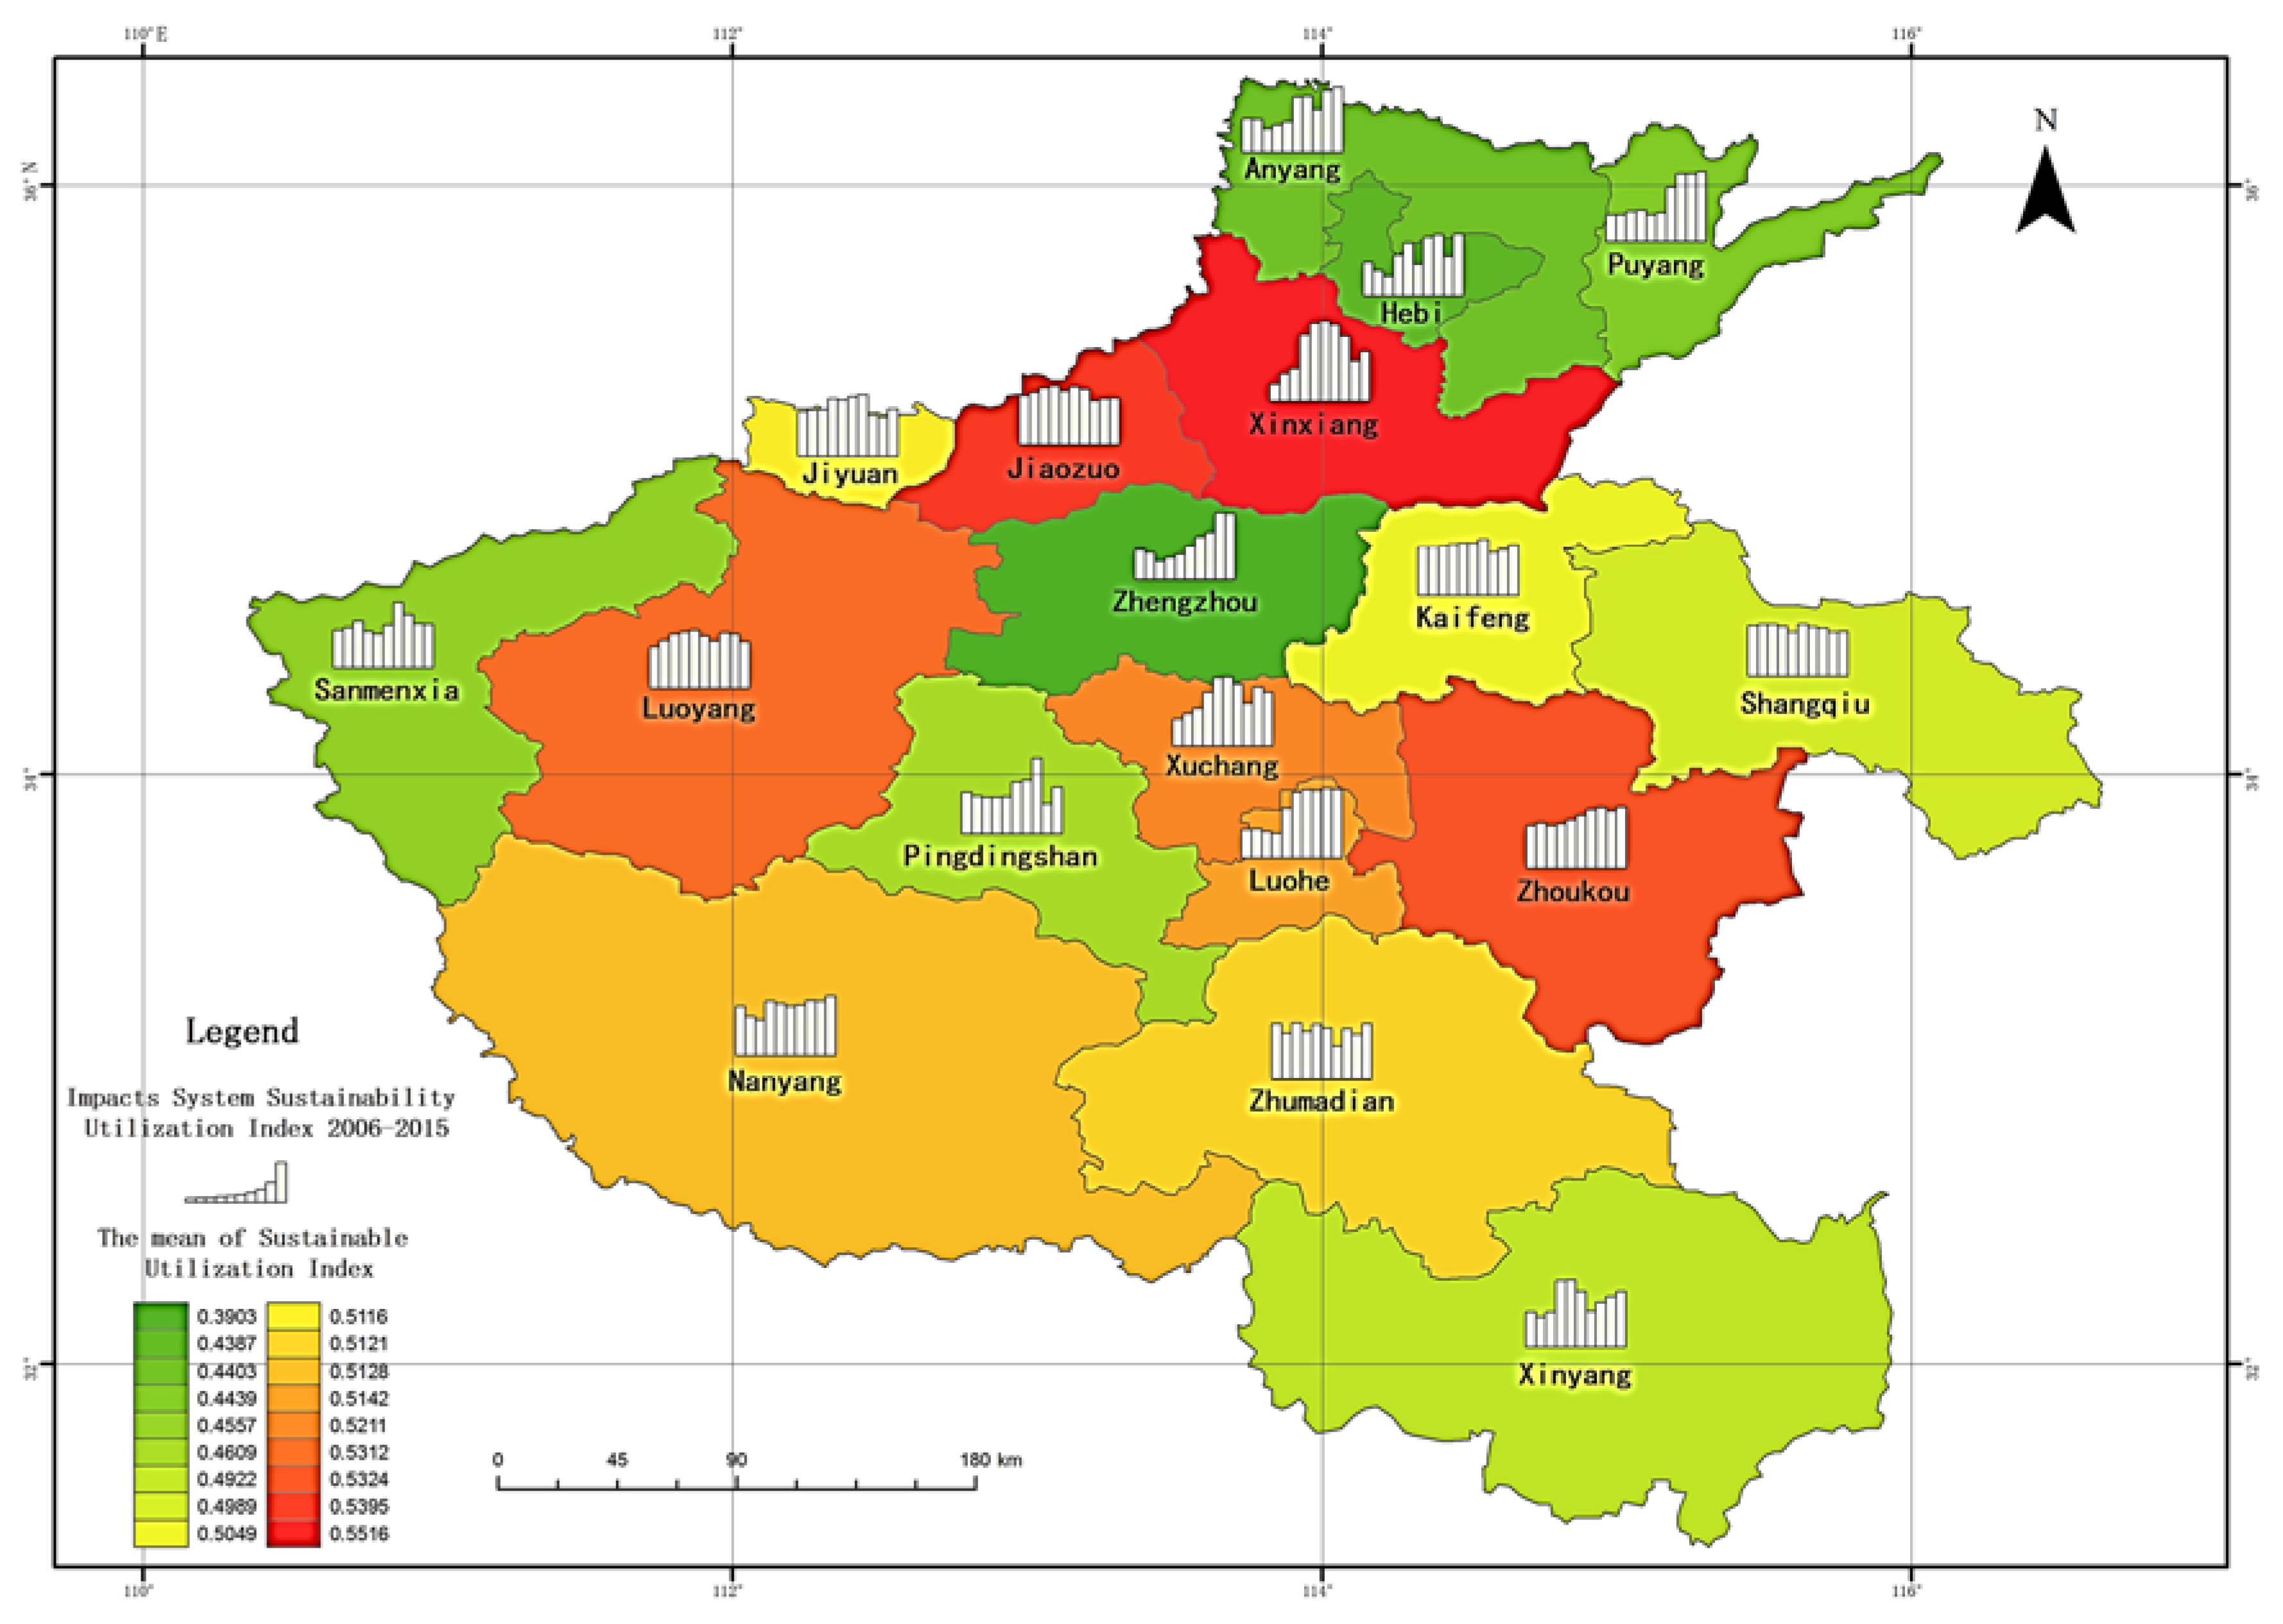
The index of sustainable utilization of subsystem I in Henan Province showed a steady upward trend, and the overall fluctuation was relatively small. The spatial pattern is basically high in the south and low in the north (except Jiaozuo and Xinxiang).
Figure 12 and Figure 13 show that the index value of I subsystem in 2006–2015 is steadily rising and has maintained at a moderate level. In 2006, the highest sustainable utilization index of system I was 0.5716, while the highest value of system I was 0.7196 in 2015, which was about 1.3 times the highest value in 2006.
In the past 10 years, the cities in Henan Province worked to improve the quality of regional water resources. The negative effect of economic development on the water ecological environment has been alleviated to a certain extent, so the sustainability of the I subsystem can continue to rise. The spatial pattern is high in the south and low in the north, and the average value of other cities in the north, except Jiaozuo and Xinxiang, is slightly lower than that in the south.
The rank order is in a funnel-shaped distribution: Luoyang, Xuchang and the other 10 cities are located at the top of the funnel at the general level; Shangqiu Kaifeng and other seven cities are located in the middle of the funnel, at a poor level; and at the bottom of the funnel is Zhengzhou City, at the worst level.
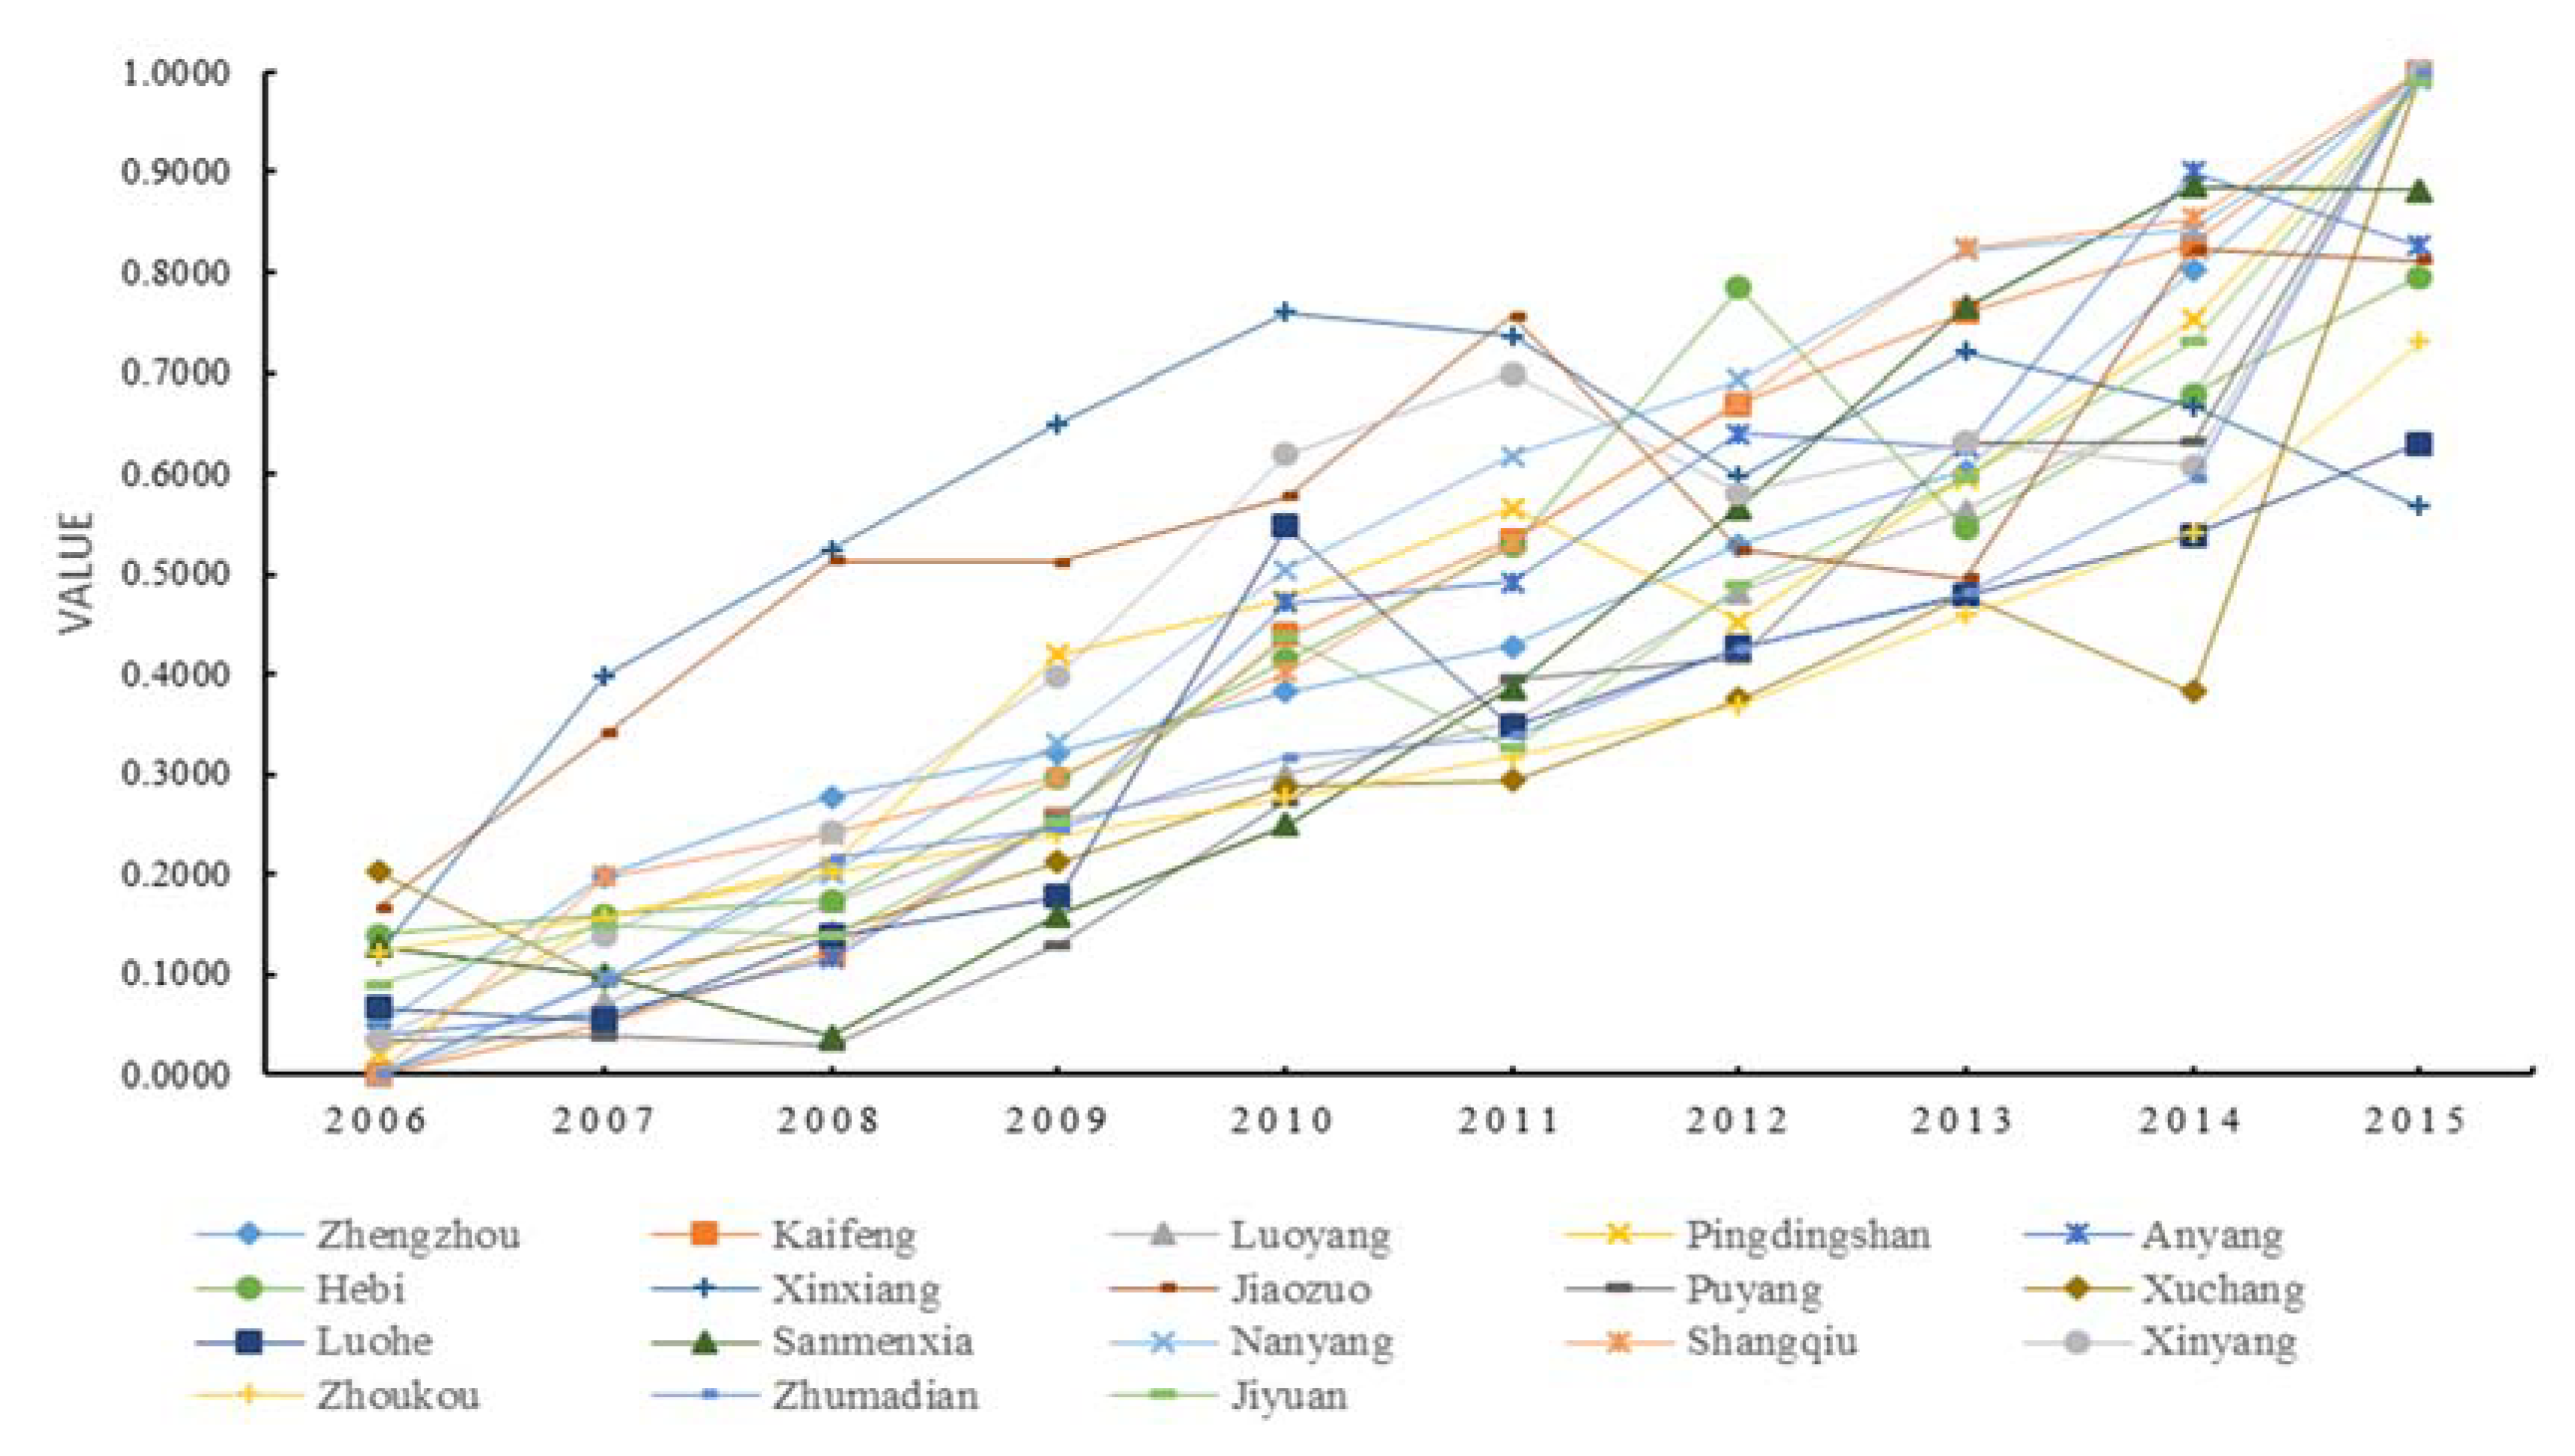
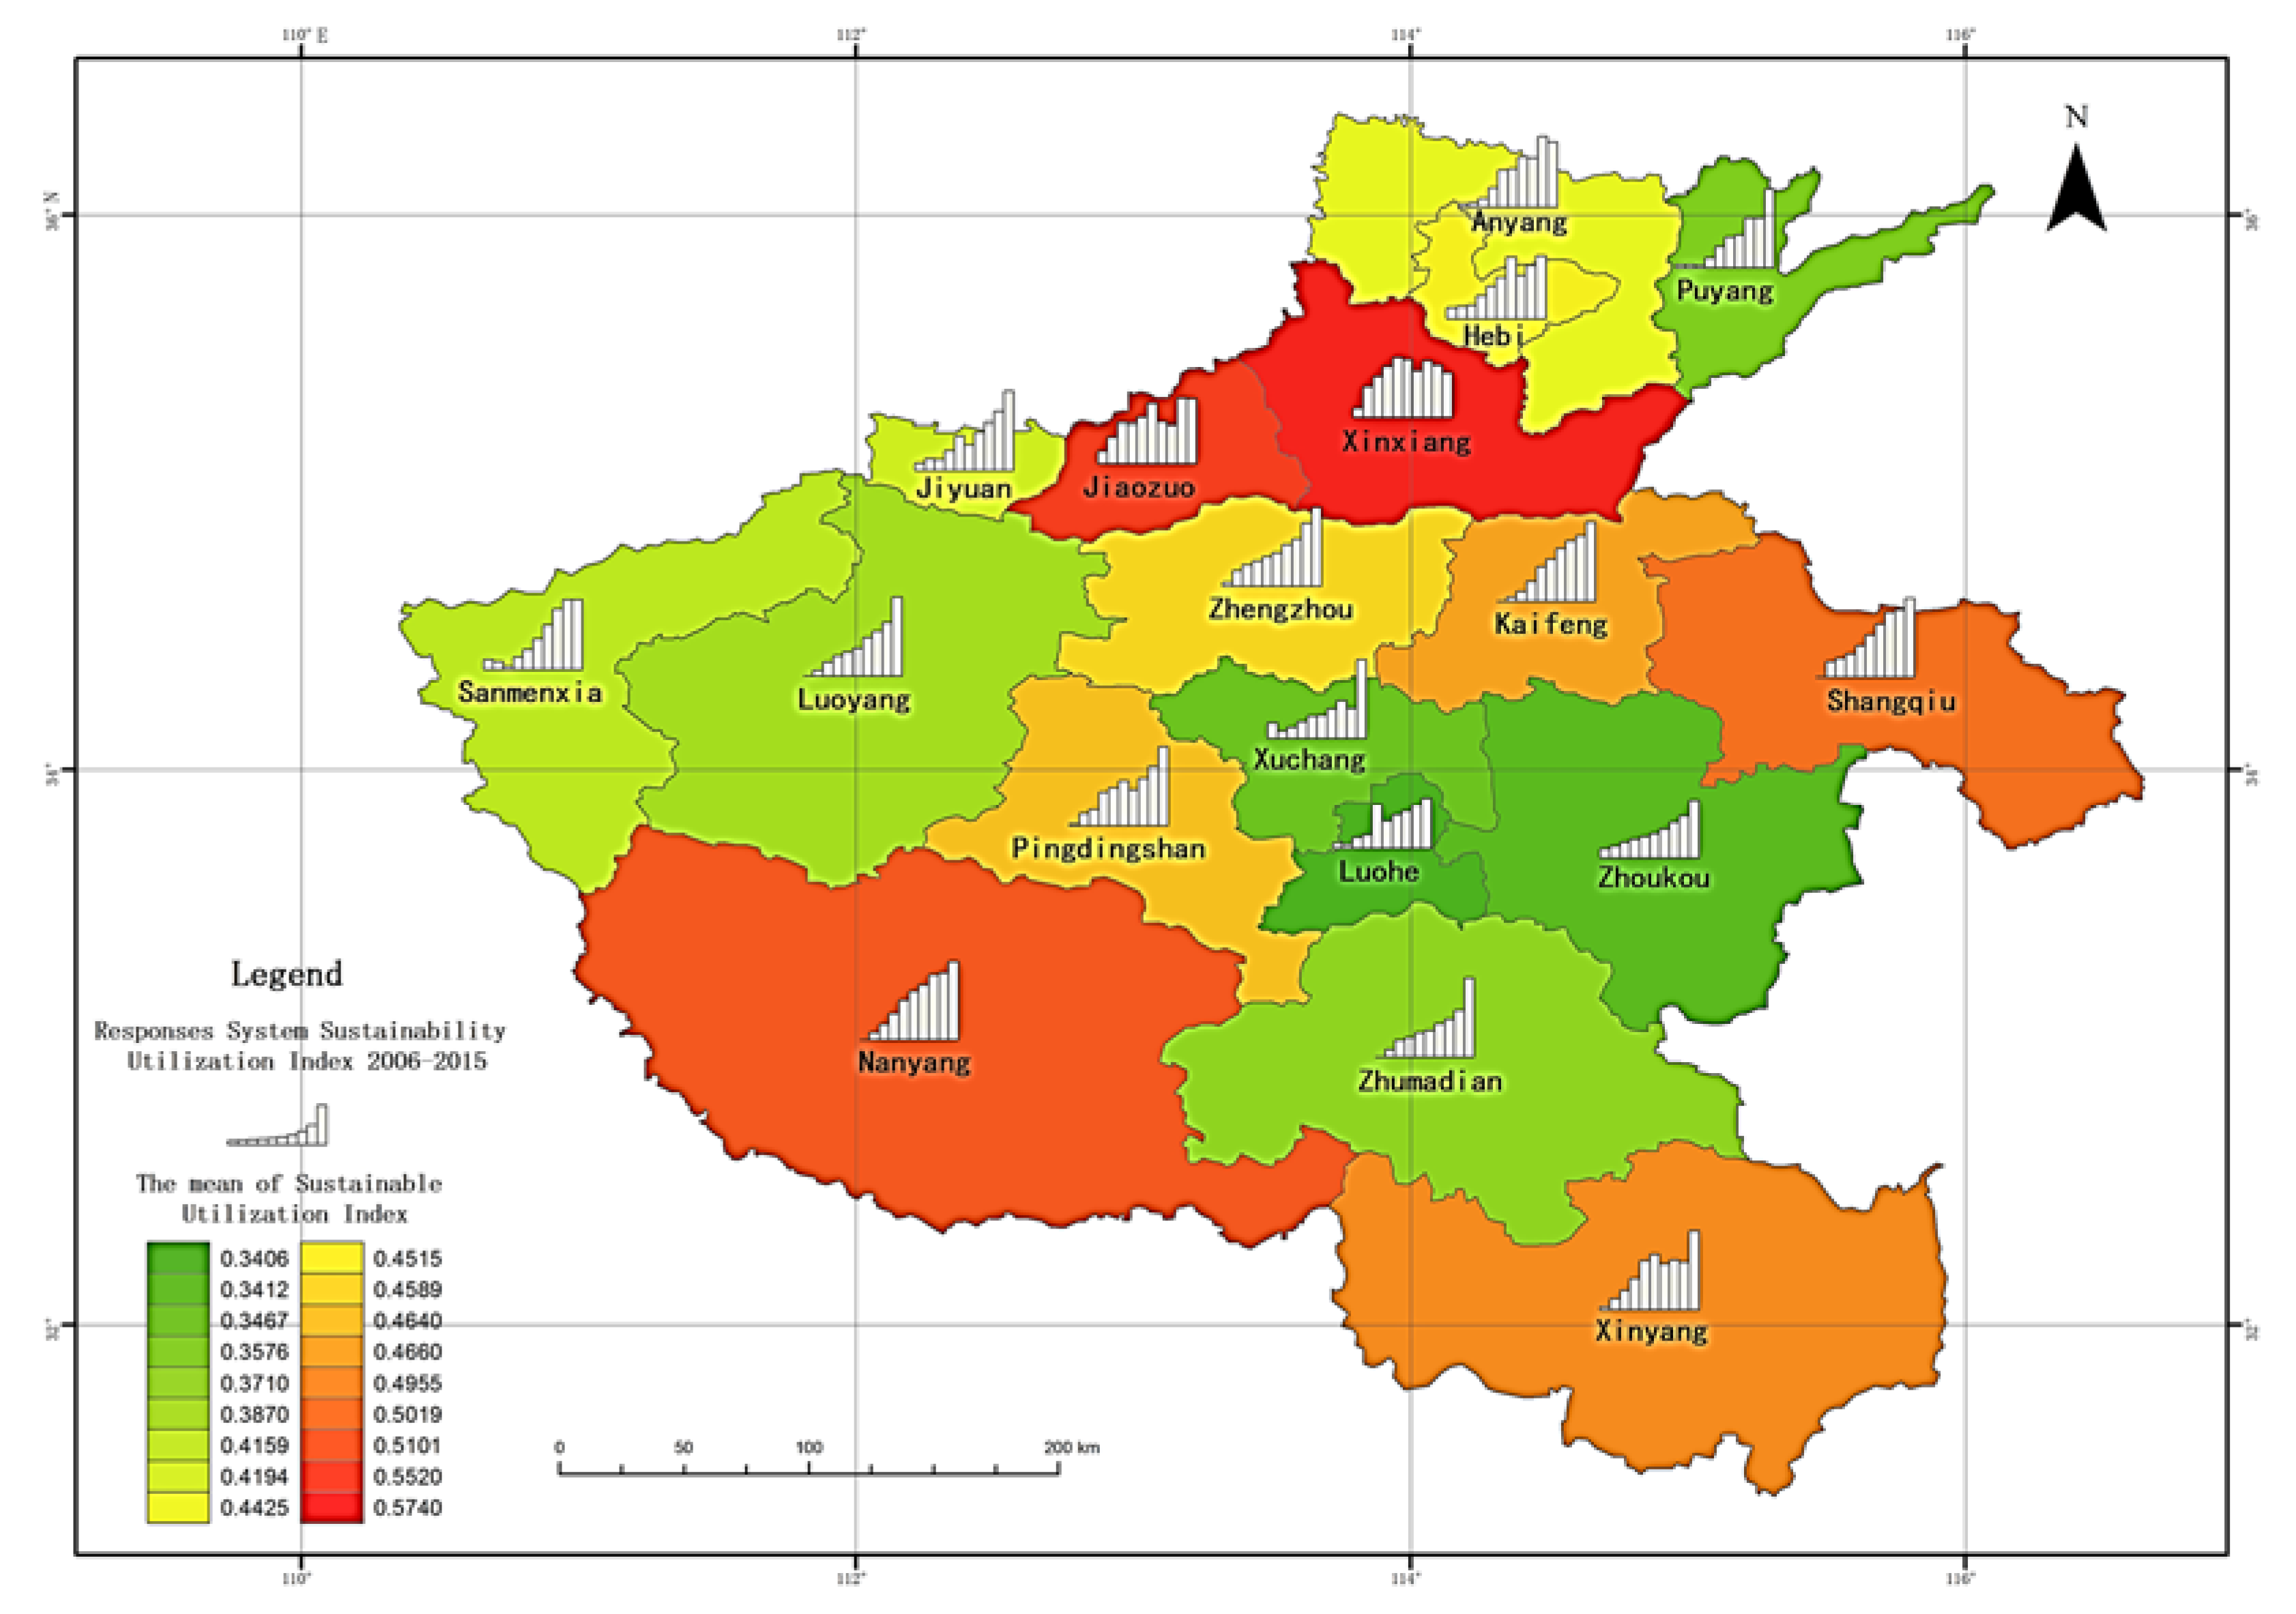
The sustainable utilization index of R subsystem in the cities of Henan Province shows a large increase trend. The spatial pattern is basically low in the west and southeast and high in the northeast and southwest.
Figure 14 and Figure 15 show that, except for the slight fluctuation in the Xinyang and Jiaozuo data, the index of the sustainable utilization of R subsystem is rising steadily for each city, and the sustainable utilization of water resources is in good condition. In 2006, the average value of the R subsystem index in Henan Province was 0.0674, and the average value showed a linear upward trend; in 2015, the average value of the R subsystem reached 0.9009, which was 13 times the initial value.
The cities in Henan Province have made great efforts to promote the adjustment and upgrading of industrial structures, increase the proportion of tertiary industries, limit the development of high water and energy consuming industries, and increase the investment quota of water conservation projects, year on year. These measures greatly promote the index of the R subsystem and increase the contribution of R subsystem in the whole system.
The rank order is trapezoidal, which can be divided into three levels: general, poor and worst. Nanyang, Jiaozuo and other four cities at the top of the trapezoid in the general level; Luohe, Zhoukou and other six cities are in the middle of trapezoid in the worst level; Jiyuan Anyang and other eight cities at the bottom of the trapezoid in the poor level.
5. Conclusions
Based on the DPSIR framework, 21 indices were selected to construct the evaluation index system of the sustainable utilization of water resources in Henan Province. Using a weighted TOPSIS model, the spatiotemporal dynamics of the sustainable utilization of water resources and the degree of sustainable utilization of subsystems were studied from the two dimensions of time and space.
The sustainable utilization of water resources in the cities of Henan Province is rising steadily and the level of sustainable utilization of water resources has changed from worst to general, but there is a great difference between the sustainable utilization of water resources in each city. The overall level is still on the low side. The spatial pattern is high in the north and southwest and low in the middle and southeast, with the rank order in an olive-shaped distribution.
The influence of each subsystem on the comprehensive index of sustainable utilization of water resources is different. The contribution of the P subsystem was the largest, the contribution of the D and S systems showed a fluctuating downward trend, the contribution of the P and I systems showed a slowly rising trend.
The evaluation results in this article are in line with the actual situation of economic and social development in Henan Province, which has a certain reference significance for improving the level of sustainable utilization of water resources locally. The water resources in Henan Province are relatively scarce and unevenly distributed in time and space, the total amount of water resources is less, and the water’s ecological environment is fragile. Therefore, in order to improve the sustainable utilization of water resources in Henan Province, we should adjust the industrial structure, improve residents’ awareness of water-saving methods, and reduce the consumption of water resources by industry and agriculture to improve the efficiency of water resources utilization and reduce the pressure on water ecological environments.
Author Contributions
Y.J. proposed the research ideas and methods of the manuscript and was responsible for data collection and writing. J.S. and H.W. put forward the revise suggestion to the paper. G.D. and F.S. are responsible for creating the figures and forms.
Acknowledgments
The study is supported by the Fundamental Research Funds for the Central Universities (No. 2016B46314) and the Study on Application of Accounting Method in Ecological Environment (No. 2014B09314).
Conflicts of Interest
The authors declare no conflicts of interest.
Appendix A
Table A1 Evaluation Value of Sustainable Utilization of Water Resources in Henan Province; Table A2 Subsystem Evaluation Value of Sustainable Utilization of Water Resources in Henan Province.

Table A1.
Evaluation Value of Sustainable Utilization of Water Resources in Henan Province.
| City | 2006 | 2007 | 2008 | 2009 | 2010 | 2011 | 2012 | 2013 | 2014 | 2015 | Mean |
|---|---|---|---|---|---|---|---|---|---|---|---|
| Zhengzhou | 0.2322 | 0.2609 | 0.2689 | 0.3111 | 0.3755 | 0.4280 | 0.4960 | 0.5573 | 0.6940 | 0.7921 | 0.4416 |
| Kaifeng | 0.2433 | 0.2926 | 0.2744 | 0.3611 | 0.4711 | 0.5348 | 0.6123 | 0.6504 | 0.7115 | 0.7326 | 0.4884 |
| Luoyang | 0.2538 | 0.2615 | 0.2985 | 0.3127 | 0.3974 | 0.4203 | 0.4607 | 0.4903 | 0.5971 | 0.7408 | 0.4233 |
| Pingdingshan | 0.2903 | 0.3196 | 0.3008 | 0.3803 | 0.4567 | 0.5040 | 0.4413 | 0.5431 | 0.6328 | 0.6778 | 0.4547 |
| Anyang | 0.2169 | 0.2505 | 0.2005 | 0.2928 | 0.4818 | 0.4979 | 0.5742 | 0.5560 | 0.7599 | 0.6946 | 0.4525 |
| Hebi | 0.2715 | 0.2956 | 0.2420 | 0.3156 | 0.4275 | 0.5176 | 0.6857 | 0.5354 | 0.6164 | 0.6460 | 0.4553 |
| Xinxiang | 0.2958 | 0.4879 | 0.5521 | 0.6455 | 0.7551 | 0.7486 | 0.5899 | 0.6293 | 0.5973 | 0.4931 | 0.5794 |
| Jiaozuo | 0.2680 | 0.4091 | 0.5068 | 0.4971 | 0.5608 | 0.7401 | 0.5149 | 0.4807 | 0.7155 | 0.6871 | 0.5380 |
| Puyang | 0.1747 | 0.1655 | 0.1660 | 0.1713 | 0.3048 | 0.3837 | 0.4129 | 0.5885 | 0.6234 | 0.7922 | 0.3783 |
| Xuchang | 0.2334 | 0.2268 | 0.2316 | 0.2723 | 0.3631 | 0.3710 | 0.3985 | 0.4627 | 0.4096 | 0.7648 | 0.3734 |
| Luohe | 0.1933 | 0.2133 | 0.1783 | 0.1833 | 0.4258 | 0.3056 | 0.3359 | 0.3587 | 0.6312 | 0.4758 | 0.3301 |
| Sanmenxia | 0.3743 | 0.4227 | 0.3406 | 0.3253 | 0.4350 | 0.4793 | 0.5205 | 0.5693 | 0.6351 | 0.5785 | 0.4681 |
| Nanyang | 0.2048 | 0.2665 | 0.2527 | 0.3360 | 0.5568 | 0.5690 | 0.5959 | 0.6316 | 0.6554 | 0.7168 | 0.4785 |
| Shangqiu | 0.2258 | 0.3576 | 0.2752 | 0.3010 | 0.4013 | 0.4991 | 0.5797 | 0.6419 | 0.6991 | 0.7200 | 0.4701 |
| Xinyang | 0.2055 | 0.4954 | 0.3721 | 0.4082 | 0.5426 | 0.4662 | 0.3982 | 0.4376 | 0.5535 | 0.6451 | 0.4524 |
| Zhoukou | 0.1918 | 0.2292 | 0.1999 | 0.2227 | 0.2601 | 0.3016 | 0.3588 | 0.4545 | 0.5370 | 0.8043 | 0.3560 |
| Zhumadian | 0.3202 | 0.3825 | 0.3359 | 0.3064 | 0.3461 | 0.3222 | 0.3666 | 0.4534 | 0.5797 | 0.6851 | 0.4098 |
| Jiyuan | 0.3169 | 0.3710 | 0.3364 | 0.3723 | 0.4499 | 0.4618 | 0.4716 | 0.5043 | 0.6429 | 0.6417 | 0.4569 |
Table A2.
Subsystem Evaluation Value of Sustainable Utilization of Water Resources in Henan Province.
Table A2.
Subsystem Evaluation Value of Sustainable Utilization of Water Resources in Henan Province.
| City | Driving Forces Index | ||||||||||
| 2006 | 2007 | 2008 | 2009 | 2010 | 2011 | 2012 | 2013 | 2014 | 2015 | Mean | |
| Zhengzhou | 0.6474 | 0.6834 | 0.3997 | 0.3897 | 0.5558 | 0.6933 | 0.5185 | 0.3506 | 0.3430 | 0.3747 | 0.4956 |
| Kaifeng | 0.5226 | 0.6071 | 0.6198 | 0.6251 | 0.6487 | 0.7244 | 0.5572 | 0.5494 | 0.4443 | 0.4810 | 0.5780 |
| Luoyang | 0.7845 | 0.7836 | 0.7916 | 0.6207 | 0.6847 | 0.6499 | 0.3614 | 0.1832 | 0.3101 | 0.3480 | 0.5518 |
| Pingdingshan | 0.7162 | 0.7336 | 0.6801 | 0.5846 | 0.5274 | 0.4906 | 0.2401 | 0.2500 | 0.3641 | 0.2834 | 0.4870 |
| Anyang | 0.6108 | 0.7078 | 0.4937 | 0.4458 | 0.5075 | 0.4477 | 0.2066 | 0.2642 | 0.3635 | 0.3343 | 0.4382 |
| Hebi | 0.5948 | 0.6778 | 0.4456 | 0.4109 | 0.4598 | 0.4482 | 0.3598 | 0.4557 | 0.3954 | 0.2899 | 0.4538 |
| Xinxiang | 0.6987 | 0.7703 | 0.7067 | 0.6555 | 0.7865 | 0.8062 | 0.5483 | 0.3940 | 0.3925 | 0.2399 | 0.5998 |
| Jiaozuo | 0.6752 | 0.7243 | 0.4644 | 0.3663 | 0.4009 | 0.5679 | 0.3848 | 0.3547 | 0.2751 | 0.3171 | 0.4530 |
| Puyang | 0.6262 | 0.6107 | 0.4866 | 0.2612 | 0.3772 | 0.4161 | 0.4668 | 0.4551 | 0.3292 | 0.3432 | 0.4372 |
| Xuchang | 0.4704 | 0.6309 | 0.5183 | 0.5366 | 0.6779 | 0.8240 | 0.5993 | 0.4225 | 0.3550 | 0.3768 | 0.5412 |
| Luohe | 0.5360 | 0.5212 | 0.5413 | 0.3901 | 0.6128 | 0.5579 | 0.6641 | 0.3257 | 0.3695 | 0.3957 | 0.4914 |
| Sanmenxia | 0.7896 | 0.8822 | 0.7450 | 0.5682 | 0.7581 | 0.6089 | 0.5673 | 0.3799 | 0.3888 | 0.1426 | 0.5830 |
| Nanyang | 0.6544 | 0.6605 | 0.6340 | 0.4548 | 0.5047 | 0.4550 | 0.3128 | 0.2651 | 0.3323 | 0.3919 | 0.4665 |
| Shangqiu | 0.6936 | 0.6070 | 0.4820 | 0.3909 | 0.5240 | 0.4972 | 0.4366 | 0.3485 | 0.2713 | 0.3148 | 0.4566 |
| Xinyang | 0.4855 | 0.6231 | 0.5171 | 0.5748 | 0.4848 | 0.4444 | 0.4008 | 0.3356 | 0.3853 | 0.4232 | 0.4675 |
| Zhoukou | 0.5312 | 0.6710 | 0.7595 | 0.7980 | 0.7246 | 0.6647 | 0.6623 | 0.5688 | 0.6127 | 0.5625 | 0.6555 |
| Zhumadian | 0.6409 | 0.6693 | 0.5473 | 0.5059 | 0.5298 | 0.5094 | 0.4077 | 0.3180 | 0.2987 | 0.3596 | 0.4787 |
| Jiyuan | 0.6919 | 0.7907 | 0.6428 | 0.6280 | 0.4910 | 0.6838 | 0.4632 | 0.4945 | 0.3696 | 0.2343 | 0.5490 |
| City | Pressures Index | ||||||||||
| 2006 | 2007 | 2008 | 2009 | 2010 | 2011 | 2012 | 2013 | 2014 | 2015 | Mean | |
| Zhengzhou | 0.3853 | 0.3110 | 0.2092 | 0.2526 | 0.2855 | 0.3837 | 0.3914 | 0.4612 | 0.4620 | 0.6477 | 0.3789 |
| Kaifeng | 0.4294 | 0.5067 | 0.3872 | 0.4799 | 0.4570 | 0.4552 | 0.5066 | 0.4409 | 0.5671 | 0.4976 | 0.4728 |
| Luoyang | 0.1995 | 0.3682 | 0.3392 | 0.4057 | 0.4102 | 0.4791 | 0.4851 | 0.5280 | 0.6189 | 0.7465 | 0.4580 |
| Pingdingshan | 0.0583 | 0.1355 | 0.1435 | 0.1840 | 0.3047 | 0.3884 | 0.5426 | 0.6681 | 0.8261 | 0.9645 | 0.4216 |
| Anyang | 0.3425 | 0.2857 | 0.2972 | 0.4544 | 0.5516 | 0.5558 | 0.5582 | 0.3557 | 0.6367 | 0.5909 | 0.4629 |
| Hebi | 0.2971 | 0.2383 | 0.2805 | 0.3263 | 0.4861 | 0.6353 | 0.6274 | 0.5689 | 0.6292 | 0.5591 | 0.4648 |
| Xinxiang | 0.3575 | 0.7440 | 0.7355 | 0.4588 | 0.5791 | 0.6493 | 0.4944 | 0.2925 | 0.6628 | 0.4828 | 0.5457 |
| Jiaozuo | 0.2076 | 0.5844 | 0.4748 | 0.3902 | 0.6369 | 0.8566 | 0.6916 | 0.5362 | 0.8792 | 0.4190 | 0.5676 |
| Puyang | 0.2365 | 0.3109 | 0.4089 | 0.2461 | 0.2960 | 0.2642 | 0.3174 | 0.2799 | 0.9810 | 0.6678 | 0.4009 |
| Xuchang | 0.2532 | 0.3235 | 0.4236 | 0.3360 | 0.3833 | 0.3646 | 0.3618 | 0.4757 | 0.5954 | 0.5623 | 0.4079 |
| Luohe | 0.4981 | 0.6776 | 0.3507 | 0.4262 | 0.4767 | 0.4244 | 0.1738 | 0.1401 | 0.5686 | 0.5567 | 0.4293 |
| Sanmenxia | 0.2654 | 0.3111 | 0.1979 | 0.2284 | 0.1972 | 0.1985 | 0.2295 | 0.4488 | 0.6485 | 0.9271 | 0.3652 |
| Nanyang | 0.3429 | 0.5088 | 0.3183 | 0.2164 | 0.5679 | 0.5143 | 0.4639 | 0.4757 | 0.6010 | 0.6955 | 0.4705 |
| Shangqiu | 0.2618 | 0.8960 | 0.2724 | 0.2094 | 0.2951 | 0.2775 | 0.1869 | 0.1143 | 0.4592 | 0.3290 | 0.3302 |
| Xinyang | 0.0826 | 0.7452 | 0.2176 | 0.2368 | 0.1962 | 0.1562 | 0.1877 | 0.2291 | 0.5804 | 0.4196 | 0.3051 |
| Zhoukou | 0.4526 | 0.4458 | 0.4204 | 0.4156 | 0.4197 | 0.4270 | 0.4258 | 0.4344 | 0.9113 | 0.4596 | 0.4812 |
| Zhumadian | 0.6169 | 0.6540 | 0.4544 | 0.4345 | 0.2992 | 0.1863 | 0.1888 | 0.5173 | 0.8770 | 0.5416 | 0.4770 |
| Jiyuan | 0.4197 | 0.4957 | 0.5964 | 0.4909 | 0.4513 | 0.7843 | 0.3700 | 0.1968 | 0.6846 | 0.4470 | 0.4937 |
| City | States Index | ||||||||||
| 2006 | 2007 | 2008 | 2009 | 2010 | 2011 | 2012 | 2013 | 2014 | 2015 | Mean | |
| Zhengzhou | 0.4737 | 0.5270 | 0.2085 | 0.4209 | 0.9126 | 0.6984 | 0.3396 | 0.2828 | 0.3021 | 0.4265 | 0.4592 |
| Kaifeng | 0.6138 | 0.8038 | 0.6689 | 0.7030 | 0.7379 | 0.6210 | 0.1834 | 0.2534 | 0.4417 | 0.4739 | 0.5501 |
| Luoyang | 0.2297 | 0.2299 | 0.0966 | 0.2301 | 0.9527 | 0.8396 | 0.2674 | 0.0226 | 0.1772 | 0.1409 | 0.3187 |
| Pingdingshan | 0.1775 | 0.4734 | 0.1847 | 0.2461 | 0.9972 | 0.4986 | 0.1661 | 0.0165 | 0.0282 | 0.0401 | 0.2829 |
| Anyang | 0.3054 | 0.3457 | 0.4476 | 0.4103 | 0.7862 | 0.6533 | 0.2708 | 0.0234 | 0.2745 | 0.2378 | 0.3755 |
| Hebi | 0.3360 | 0.3094 | 0.4028 | 0.2255 | 0.6045 | 0.6449 | 0.5816 | 0.3769 | 0.3658 | 0.3696 | 0.4217 |
| Xinxiang | 0.5797 | 0.3770 | 0.5177 | 0.5550 | 0.5889 | 0.8741 | 0.2554 | 0.4030 | 0.5057 | 0.4213 | 0.5078 |
| Jiaozuo | 0.6814 | 0.2064 | 0.1659 | 0.2365 | 0.2661 | 0.9503 | 0.1774 | 0.0942 | 0.3066 | 0.2300 | 0.3315 |
| Puyang | 0.1965 | 0.2743 | 0.4305 | 0.3689 | 0.8396 | 0.4545 | 0.0660 | 0.1518 | 0.2747 | 0.1976 | 0.3254 |
| Xuchang | 0.5195 | 0.7862 | 0.3778 | 0.4823 | 0.7364 | 0.4988 | 0.2142 | 0.2265 | 0.2895 | 0.3537 | 0.4485 |
| Luohe | 0.0605 | 0.1332 | 0.0285 | 0.0474 | 0.0835 | 0.0699 | 0.0000 | 0.0431 | 0.8882 | 0.0586 | 0.1413 |
| Sanmenxia | 0.1993 | 0.4061 | 0.0252 | 0.3386 | 0.6429 | 1.0000 | 0.2446 | 0.0898 | 0.3542 | 0.3858 | 0.3687 |
| Nanyang | 0.2168 | 0.3772 | 0.2412 | 0.3319 | 1.0000 | 0.3327 | 0.2305 | 0.0019 | 0.0617 | 0.0924 | 0.2886 |
| Shangqiu | 0.1883 | 1.0000 | 0.4722 | 0.3686 | 0.4103 | 0.3589 | 0.1348 | 0.0525 | 0.1225 | 0.3456 | 0.3454 |
| Xinyang | 0.2991 | 0.9677 | 0.8070 | 0.3901 | 0.8408 | 0.1370 | 0.1625 | 0.2346 | 0.4518 | 0.5872 | 0.4878 |
| Zhoukou | 0.4966 | 0.7242 | 0.5498 | 0.4591 | 0.5733 | 0.3648 | 0.3561 | 0.3607 | 0.5833 | 0.3374 | 0.4805 |
| Zhumadian | 0.4498 | 1.0000 | 0.6206 | 0.2339 | 0.3603 | 0.0127 | 0.0209 | 0.1606 | 0.3776 | 0.1171 | 0.3353 |
| Jiyuan | 0.8253 | 0.5703 | 0.2815 | 0.1761 | 0.3101 | 1.0000 | 0.5579 | 0.0830 | 0.2895 | 0.3093 | 0.4403 |
| City | Impacts Index | ||||||||||
| 2006 | 2007 | 2008 | 2009 | 2010 | 2011 | 2012 | 2013 | 2014 | 2015 | Mean | |
| Zhengzhou | 0.3092 | 0.2806 | 0.1945 | 0.2305 | 0.2669 | 0.3380 | 0.4349 | 0.4822 | 0.6883 | 0.6775 | 0.3903 |
| Kaifeng | 0.4888 | 0.4925 | 0.4986 | 0.5139 | 0.5303 | 0.5293 | 0.5693 | 0.4427 | 0.4721 | 0.5111 | 0.5049 |
| Luoyang | 0.4278 | 0.4932 | 0.5586 | 0.5821 | 0.6029 | 0.5397 | 0.4899 | 0.5728 | 0.5616 | 0.4835 | 0.5312 |
| Pingdingshan | 0.4252 | 0.3892 | 0.3766 | 0.3745 | 0.3849 | 0.5350 | 0.5533 | 0.7756 | 0.3116 | 0.4831 | 0.4609 |
| Anyang | 0.3445 | 0.3368 | 0.2413 | 0.2822 | 0.3111 | 0.5705 | 0.5738 | 0.4406 | 0.6335 | 0.6684 | 0.4403 |
| Hebi | 0.3462 | 0.2649 | 0.2011 | 0.4209 | 0.5432 | 0.3295 | 0.6037 | 0.6319 | 0.4049 | 0.6405 | 0.4387 |
| Xinxiang | 0.1803 | 0.2832 | 0.3377 | 0.6841 | 0.8037 | 0.8226 | 0.7952 | 0.6733 | 0.4175 | 0.5180 | 0.5516 |
| Jiaozuo | 0.5108 | 0.5400 | 0.5893 | 0.6077 | 0.5563 | 0.6029 | 0.5758 | 0.4581 | 0.4736 | 0.4806 | 0.5395 |
| Puyang | 0.2804 | 0.2765 | 0.3130 | 0.3212 | 0.2758 | 0.2951 | 0.5597 | 0.6961 | 0.7016 | 0.7196 | 0.4439 |
| Xuchang | 0.2775 | 0.3347 | 0.3872 | 0.5510 | 0.7081 | 0.7126 | 0.6397 | 0.4435 | 0.6044 | 0.5528 | 0.5211 |
| Luohe | 0.2924 | 0.3044 | 0.2775 | 0.2570 | 0.5135 | 0.6769 | 0.7039 | 0.6970 | 0.7125 | 0.7076 | 0.5142 |
| Sanmenxia | 0.3895 | 0.4108 | 0.4769 | 0.3748 | 0.3491 | 0.4409 | 0.6718 | 0.5458 | 0.4512 | 0.4458 | 0.4557 |
| Nanyang | 0.5046 | 0.4010 | 0.3699 | 0.5604 | 0.5343 | 0.5032 | 0.5185 | 0.5671 | 0.5582 | 0.6106 | 0.5128 |
| Shangqiu | 0.5200 | 0.5311 | 0.5315 | 0.5115 | 0.4549 | 0.5312 | 0.5035 | 0.4923 | 0.4547 | 0.4583 | 0.4989 |
| Xinyang | 0.3639 | 0.3109 | 0.3648 | 0.6886 | 0.6934 | 0.5728 | 0.3726 | 0.4633 | 0.5211 | 0.5708 | 0.4922 |
| Zhoukou | 0.4420 | 0.4654 | 0.4418 | 0.4616 | 0.5046 | 0.5498 | 0.6081 | 0.6277 | 0.5923 | 0.6302 | 0.5324 |
| Zhumadian | 0.5716 | 0.4729 | 0.5834 | 0.4951 | 0.5659 | 0.5315 | 0.3449 | 0.5207 | 0.4627 | 0.5723 | 0.5121 |
| Jiyuan | 0.4567 | 0.4753 | 0.4746 | 0.5882 | 0.5757 | 0.6063 | 0.6313 | 0.4214 | 0.4006 | 0.4859 | 0.5116 |
| City | Responses Index | ||||||||||
| 2006 | 2007 | 2008 | 2009 | 2010 | 2011 | 2012 | 2013 | 2014 | 2015 | Mean | |
| Zhengzhou | 0.0489 | 0.1984 | 0.2776 | 0.3213 | 0.3817 | 0.4285 | 0.5286 | 0.6028 | 0.8014 | 1.0000 | 0.4589 |
| Kaifeng | 0.0000 | 0.0518 | 0.1214 | 0.2553 | 0.4394 | 0.5345 | 0.6693 | 0.7603 | 0.8283 | 1.0000 | 0.4660 |
| Luoyang | 0.0000 | 0.0716 | 0.1725 | 0.2522 | 0.2995 | 0.3511 | 0.4827 | 0.5632 | 0.6776 | 1.0000 | 0.3870 |
| Pingdingshan | 0.0198 | 0.1566 | 0.2079 | 0.4191 | 0.4754 | 0.5666 | 0.4523 | 0.5955 | 0.7529 | 0.9942 | 0.4640 |
| Anyang | 0.0392 | 0.0601 | 0.1160 | 0.2530 | 0.4712 | 0.4923 | 0.6398 | 0.6262 | 0.9010 | 0.8261 | 0.4425 |
| Hebi | 0.1394 | 0.1589 | 0.1738 | 0.2964 | 0.4139 | 0.5280 | 0.7842 | 0.5464 | 0.6793 | 0.7952 | 0.4515 |
| Xinxiang | 0.1199 | 0.3978 | 0.5245 | 0.6498 | 0.7593 | 0.7366 | 0.5967 | 0.7202 | 0.6675 | 0.5678 | 0.5740 |
| Jiaozuo | 0.1666 | 0.3408 | 0.5125 | 0.5116 | 0.5771 | 0.7566 | 0.5248 | 0.4956 | 0.8223 | 0.8121 | 0.5520 |
| Puyang | 0.0347 | 0.0382 | 0.0282 | 0.1295 | 0.2727 | 0.3944 | 0.4151 | 0.6314 | 0.6317 | 1.0000 | 0.3576 |
| Xuchang | 0.2023 | 0.0961 | 0.1412 | 0.2115 | 0.2873 | 0.2939 | 0.3754 | 0.4785 | 0.3828 | 0.9974 | 0.3467 |
| Luohe | 0.0660 | 0.0537 | 0.1382 | 0.1773 | 0.5479 | 0.3481 | 0.4262 | 0.4791 | 0.5394 | 0.6301 | 0.3406 |
| Sanmenxia | 0.1280 | 0.0983 | 0.0382 | 0.1585 | 0.2491 | 0.3865 | 0.5666 | 0.7654 | 0.8857 | 0.8822 | 0.4159 |
| Nanyang | 0.0014 | 0.0956 | 0.2009 | 0.3312 | 0.5045 | 0.6182 | 0.6928 | 0.8215 | 0.8430 | 0.9919 | 0.5101 |
| Shangqiu | 0.0000 | 0.1976 | 0.2400 | 0.2968 | 0.4017 | 0.5322 | 0.6727 | 0.8240 | 0.8537 | 1.0000 | 0.5019 |
| Xinyang | 0.0353 | 0.1391 | 0.2431 | 0.3987 | 0.6190 | 0.6993 | 0.5811 | 0.6316 | 0.6081 | 1.0000 | 0.4955 |
| Zhoukou | 0.1223 | 0.1566 | 0.2025 | 0.2393 | 0.2766 | 0.3173 | 0.3684 | 0.4583 | 0.5411 | 0.7299 | 0.3412 |
| Zhumadian | 0.0000 | 0.0938 | 0.2155 | 0.2458 | 0.3165 | 0.3379 | 0.4255 | 0.4805 | 0.5943 | 1.0000 | 0.3710 |
| Jiyuan | 0.0893 | 0.1491 | 0.1376 | 0.2526 | 0.4368 | 0.3255 | 0.4882 | 0.5953 | 0.7302 | 0.9894 | 0.4194 |
References
- Pearce, M.; Willis, E.; Mamerow, L.; Jorgensen, B.; Martin, J. The prestige of sustainable living: Implications for water use in Australia. Geogr. J. 2014, 180, 161–174. [Google Scholar] [CrossRef]
- Molinos-Senante, M.; Mocholi-Arce, M.; Sala-Garrido, R. Estimating the environmental and resource costs of leakage in water distribution systems: A shadow price approach. Sci. Total Environ. 2016, 568, 180–188. [Google Scholar] [CrossRef] [PubMed]
- Wang, X.J.; Zhang, J.Y.; Shahid, S.; Guan, E.H.; Wu, Y.X.; Gao, J.; He, R.M. Adaptation to climate change impacts on water demand. Mitig. Adapt. Strateg. Glob. Chang. 2016, 21, 81–99. [Google Scholar] [CrossRef]
- Salman, D.A.; Amer, S.A.; Ward, F.A. Water Appropriation Systems for Adapting to Water Shortages in Iraq. J. Am. Water Resour. Assoc. 2014, 50, 1208–1225. [Google Scholar] [CrossRef]
- Saglam, Y. Supply-based dynamic Ramsey pricing: Avoiding water shortages. Water Resour. Res. 2015, 51, 669–684. [Google Scholar] [CrossRef]
- Meng, L.; Chen, Y.; Xu, Z.; Ma, F. Evaluation of Sustainable Utilization of Water Resources in Jiangxi Province. Bull. Soil Water Conserv. 2013, 33, 166–170. [Google Scholar]
- Poff, N.L.; Brown, C.M.; Grantham, T.; Matthews, J.H.; Palmer, M.A.; Spence, C.M.; Wilby, R.L.; Haasnoot, M.; Mendoza, G.F.; Dominique, K.C.; et al. Sustainable water management under future uncertainty with eco-engineering decision scaling. Nat. Clim. Chang. 2016, 6, 25–34. [Google Scholar] [CrossRef] [Green Version]
- Gong, L.; Jin, C.L. Fuzzy Comprehensive Evaluation for Carrying Capacity of Regional Water Resources. Water Resour. Manag. 2009, 23, 2505–2513. [Google Scholar] [CrossRef]
- Chaves, H.M.L.; Alipaz, S. An integrated indicator based on basin hydrology, environment, life, and policy: The watershed sustainability index. Water Resour. Manag. 2007, 21, 883–895. [Google Scholar] [CrossRef]
- Juwana, I.; Muttil, N.; Perera, B.J.C. Indicator-based water sustainability assessment—A review. Sci. Total Environ. 2012, 438, 357–371. [Google Scholar] [CrossRef] [PubMed]
- Wada, Y.; Bierkens, M.F.P. Sustainability of global water use: Past reconstruction and future projections. Environ. Res. Lett. 2014, 9, 17. [Google Scholar] [CrossRef]
- Wang, R.; Chen, Y.; Chen, X. Establishment of Indicators System for Sustainability Assessment of Regional Water Resources Use. J. Nat. Resour. 2014, 29, 1441–1452. [Google Scholar]
- Yang, G.; He, X.; Li, J.; Jia, X. The evaluation method of water resources sustainable utilization in Manas River Basin. Acta Ecol. Sin. 2011, 31, 2407–2413. [Google Scholar]
- Zhou, L.; Wang, L.; Yu, J. Assessment System of Water Resource Sustainable Utilization Based on Water Footprint Theory: A Case Study of Jimo. Resour. Sci. 2014, 36, 913–921. [Google Scholar]
- Xu, L.; Huang, Y.; Liu, A. Study on the Carrying Capacity of Water Resources in Jiangsu Province Based on the Principal Component Analysis. Resour. Environ. Yangtze Basin 2011, 20, 1468–1474. [Google Scholar]
- Sarkki, S.; Ficko, A.; Grunewald, K.; Kyriazopoulos, A.P.; Nijnik, M. How pragmatism in environmental science and policy can undermine sustainability transformations: The case of marginalized mountain areas under climate and land-use change. Sustain. Sci. 2017, 12, 549–561. [Google Scholar] [CrossRef]
- Baldwin, C.; Lewison, R.L.; Lieske, S.N.; Seger, M.; Hines, E.; Dearden, P.; Rudd, M.A.; Jones, C.; Satumanatpan, S.; Junchompoo, C. Using the DPSIR framework for transdisciplinary training and knowledge elicitation in the Gulf of Thailand. Ocean Coast. Manag. 2016, 134, 163–172. [Google Scholar] [CrossRef]
- Hannouf, M.; Assefa, G. Life Cycle Sustainability Assessment for Sustainability Improvements: A Case Study of High-Density Polyethylene Production in Alberta, Canada. Sustainability 2017, 9, 2332. [Google Scholar] [CrossRef]
- Debnath, A.; Majumder, M.; Pal, M. A Cognitive Approach in Selection of Source for Water Treatment Plant based on Climatic Impact. Water Resour. Manag. 2015, 29, 1907–1919. [Google Scholar] [CrossRef]
- Chen, W.; Li, W.P.; Chai, H.C.; Hou, E.K.; Li, X.Q.; Ding, X. GIS-based landslide susceptibility mapping using analytical hierarchy process (AHP) and certainty factor (CF) models for the Baozhong region of Baoji City, China. Environ. Earth Sci. 2016, 75, 14. [Google Scholar] [CrossRef]
- Han, B.L.; Liu, H.X.; Wang, R.S. Urban ecological security assessment for cities in the Beijing-Tianjin-Hebei metropolitan region based on fuzzy and entropy methods. Ecol. Model. 2015, 318, 217–225. [Google Scholar] [CrossRef]
- Bao, C.; Zou, J.J. Analysis of spatiotemporal changes of the human-water relationship using water resources constraint intensity index in Northwest China. Ecol. Indic. 2018, 84, 119–129. [Google Scholar] [CrossRef]
- Song, J.Y.; Chung, E.S. Robustness, Uncertainty and Sensitivity Analyses of the TOPSIS Method for Quantitative Climate Change Vulnerability: A Case Study of Flood Damage. Water Resour. Manag. 2016, 30, 4751–4771. [Google Scholar] [CrossRef]
- Santos, J.; Pagsuyoin, S.A.; Latayan, J. A multi-criteria decision analysis framework for evaluating point-of-use water treatment alternatives. Clean Technol. Environ. Policy 2016, 18, 1263–1279. [Google Scholar] [CrossRef]
- Han, M.; Du, H.; Zhang, C.; Li, G.; Shi, L. Water Resources Sustainable Utilization Evaluation Based on the DPSIR in the Yellow River Delta. China Popul. Resour. Environ. 2015, 25, 154–160. [Google Scholar]
- Yu, H.; Han, M. Spatial-temporal Analysis of Sustainable Water Resources Utilization in Shandong Province Based on Water Footprint. J. Nat. Resour. 2017, 32, 474–483. [Google Scholar]
Figure 1.
Administrative divisions of Henan Province.

Figure 2.
DPSIR Frame.

Figure 3.
The trend of composite index of sustainable utilization of water resources.

Figure 4.
Spatiotemporal pattern of composite index of sustainable utilization of water resources.

Figure 5.
The trend of average value of sustainable utilization of water resources.

Figure 6.
The Trend of D Subsystem Sustainable Utilization Index.

Figure 7.
Spatiotemporal pattern of D subsystem sustainable utilization index.

Figure 8.
The trend of P subsystem sustainable utilization index.

Figure 9.
Spatiotemporal pattern of P subsystem sustainable utilization index.

Figure 10.
The trend of S subsystem sustainable utilization index.

Figure 11.
Spatiotemporal pattern of S subsystem sustainable utilization index.

Figure 12.
The trend of I subsystem sustainable utilization index.

Figure 13.
Spatiotemporal pattern of I subsystem sustainable utilization index.

Figure 14.
The trend of R subsystem sustainable utilization index.

Figure 15.
Spatiotemporal pattern of R subsystem sustainable utilization index.

Table 1.
Evaluation index system of sustainable utilization of water resources.
| Factor | Indicators | Unit | Character | Identifier |
|---|---|---|---|---|
| Driving forces | GDP Growth Rate | % | + | D1 |
| Population Growth Rate | ‰ | + | D2 | |
| Urbanization Rate | % | + | D3 | |
| Population Density | Pop. per km2 | + | D4 | |
| Pressures | Unit GDP Water Consumption | m3 | − | P1 |
| Household Water Consumption | 109 m3 | − | P2 | |
| Farmland Irrigation Water Consumption | 109 m3 | − | P3 | |
| Sewage Discharge | 109 m3 | − | P4 | |
| Total Water Consumption | 109 m3 | − | P5 | |
| States | Water Production Modulus | 103 m3 km2 | + | S1 |
| Total Water Resources | 109 m3 | + | S2 | |
| Annual Precipitation | mm | + | S3 | |
| Per Capita Water Consumption | m3 | − | S4 | |
| Impacts | Water Source Compliance Rate | % | + | I1 |
| River Water Quality Compliance Rate | % | + | I2 | |
| Per Capita Disposable Income | Yuan | + | I3 | |
| Industrial Added Value Water Consumption | m3 | − | I4 | |
| Responses | The Proportion of Tertiary Industry | % | + | R1 |
| Sewage Treatment Rate | % | + | R2 | |
| Forest Cover Rage | % | + | R3 | |
| Investment in Water Conservancy Projects | 109 Yuan | + | R4 |
Table 2.
The weights of evaluation indicators for sustainable utilization of water resources.
| Factor | Identifier | AHP Weights (W1) | Entropy Weights (W2) | Combination Weights (W) |
|---|---|---|---|---|
| Driving forces (W 0.2118) | D1 | 0.3369 | 0.2527 | 0.3352 |
| D2 | 0.2382 | 0.2735 | 0.2565 | |
| D3 | 0.2833 | 0.2579 | 0.2878 | |
| D4 | 0.1416 | 0.2159 | 0.1205 | |
| Pressures (W 0.2406) | P1 | 0.1634 | 0.1949 | 0.1674 |
| P2 | 0.1238 | 0.1920 | 0.1251 | |
| P3 | 0.2685 | 0.1652 | 0.2334 | |
| P4 | 0.1018 | 0.2630 | 0.1408 | |
| P5 | 0.3425 | 0.1849 | 0.3333 | |
| States (W 0.1071) | S1 | 0.1665 | 0.2223 | 0.1503 |
| S2 | 0.4079 | 0.2224 | 0.3681 | |
| S3 | 0.1064 | 0.2753 | 0.1189 | |
| S4 | 0.3192 | 0.2800 | 0.3627 | |
| Impacts (W 0.1019) | I1 | 0.2833 | 0.3367 | 0.3938 |
| I2 | 0.3369 | 0.1714 | 0.2384 | |
| I3 | 0.1416 | 0.2908 | 0.1701 | |
| I4 | 0.2382 | 0.2011 | 0.1977 | |
| Responses (W 0.3386) | R1 | 0.3317 | 0.2997 | 0.3957 |
| R2 | 0.1972 | 0.2363 | 0.1855 | |
| R3 | 0.1394 | 0.2535 | 0.1407 | |
| R4 | 0.3317 | 0.2105 | 0.2780 |
Table 3.
The average value of composite index of sustainable utilization of water resources.
| 2006 | 2007 | 2008 | 2009 | 2010 | 2011 | 2012 | 2013 | 2014 | 2015 | |
|---|---|---|---|---|---|---|---|---|---|---|
| DPSIR | 0.2507 | 0.3171 | 0.2963 | 0.3342 | 0.4451 | 0.4750 | 0.4896 | 0.5303 | 0.6273 | 0.6827 |
| D | 0.6317 | 0.6864 | 0.5820 | 0.5115 | 0.5698 | 0.5827 | 0.4532 | 0.3731 | 0.3667 | 0.3452 |
| P | 0.3171 | 0.4746 | 0.3627 | 0.3440 | 0.4052 | 0.4445 | 0.4002 | 0.3980 | 0.6772 | 0.5841 |
| S | 0.3805 | 0.5284 | 0.3626 | 0.3458 | 0.6469 | 0.5561 | 0.2350 | 0.1598 | 0.3386 | 0.2847 |
| I | 0.3962 | 0.3924 | 0.4010 | 0.4725 | 0.5097 | 0.5382 | 0.5639 | 0.5529 | 0.5235 | 0.5676 |
| R | 0.0674 | 0.1419 | 0.2051 | 0.3000 | 0.4294 | 0.4804 | 0.5384 | 0.6153 | 0.7078 | 0.9009 |
© 2018 by the authors. Licensee MDPI, Basel, Switzerland. This article is an open access article distributed under the terms and conditions of the Creative Commons Attribution (CC BY) license (http://creativecommons.org/licenses/by/4.0/).
Share and Cite
MDPI and ACS Style
Jia, Y.; Shen, J.; Wang, H.; Dong, G.; Sun, F. Evaluation of the Spatiotemporal Variation of Sustainable Utilization of Water Resources: Case Study from Henan Province (China). Water 2018, 10, 554. https://doi.org/10.3390/w10050554
AMA Style
Jia Y, Shen J, Wang H, Dong G, Sun F. Evaluation of the Spatiotemporal Variation of Sustainable Utilization of Water Resources: Case Study from Henan Province (China). Water. 2018; 10(5):554. https://doi.org/10.3390/w10050554
Chicago/Turabian StyleJia, Yizhen, Juqin Shen, Han Wang, Guanghua Dong, and Fuhua Sun. 2018. "Evaluation of the Spatiotemporal Variation of Sustainable Utilization of Water Resources: Case Study from Henan Province (China)" Water 10, no. 5: 554. https://doi.org/10.3390/w10050554
Note that from the first issue of 2016, this journal uses article numbers instead of page numbers. See further details here.