Effect of Alternative Irrigation Strategies on Yield and Quality of Fiesta Raisin Grapes Grown in California

1
Visiting Scientist, Irrigation Dpt., CEBAS-CSIC, P.O. Box 164, 30100 Murcia, Spain
2
Research Agricultural Engineer, USDA Agricultural Research Service, San Joaquin Valley Agricultural Sciences Center, Parlier, CA 93648-9757, USA
*
Author to whom correspondence should be addressed.
Water 2018, 10(5), 583; https://doi.org/10.3390/w10050583
Submission received: 14 March 2018
/
Revised: 23 April 2018
/
Accepted: 25 April 2018
/
Published: 30 April 2018
(This article belongs to the Special Issue Innovation Issues in Water, Agriculture and Food)
Abstract
:Traditionally, grapes are fully irrigated, but alternative irrigation strategies to reduce applied irrigation water may be necessary in the future as occurrences of drought increase. This study was conducted in the San Joaquin Valley (SJV) of California from 2012 to 2014. Three irrigation treatments were used to study the effects on the yield and quality of Fiesta grapes. The treatments included: grower irrigation (GI) weekly irrigation lasting for approximately 65 h; sustained deficit (SD) equal to 80% of the GI treatment; and regulated deficit (RD) equal to 50% of the GI until fruit set when it was increased to 80% of the GI through harvest and reduced to 50% of the GI after harvest. Average water use across treatments was ≈489 mm. Average yield across all treatments was 7.9 t ha−1, 9.1 t ha−1 and 11.8 t ha−1 in 2012, 2013, and 2014, respectively. Yield was sustained in SD and RD, with up to a 20% reduction in applied water use compared to GI. There were no differences in raisin quality and grade among any of the treatments in any year. The percentage of substandard grapes decreased from an average of 12.6% in 2012 to 3.6% in 2013 and 2014. Growers may use a sustained deficit approach during periods of limited water availability to minimize the effect on yield.
1. Introduction
Irrigation scheduling is a practice that determines both the depth and time of application of irrigation water. A wide range of scientific methods have been developed to facilitate scheduling. These methods require a detailed understanding of the changing water requirements during crop growth and a detailed understanding of climate. The Food and Agriculture Organization (FAO) method of scheduling [1], using reference evapotranspiration (ETo) and a crop coefficient (Kc) is the classical scientific approach. This requires access to weather data and crop coefficients that describe the change in crop water use with time.
Eddy covariance and Bowen ratio systems have been used for direct measurement of crop water use. These systems are very expensive and used primarily for research but provide a detailed measurement of crop water use. Once crop water use is determined, it is integrated with available soil water and plant stress to determine the actual irrigation schedule.
Despite advances in science and technology and demonstrated success in improving water management, many farmers are reluctant to accept and incorporate scientific scheduling into their management practices. Instead, they rely on their experience and economic factors (cost of water, cost of electricity) for making irrigation decisions that typically result in over-irrigation.
California experienced five years of drought (2012–2017) that resulted in extensive fallowing of field crops throughout the state. Growers with perennial crops opted to remove older vineyards and orchards to extend available water supplies to the remainder of their farming operation. Due to the limited availability of surface water, groundwater became the primary source of irrigation water for many farmers resulting in an increased rate of over-drafting aquifers throughout California. The over-drafting resulted in legislation, the Sustainable Groundwater Management Act (SGMA) [2], to manage groundwater to achieve sustainable future withdrawals that will not restrict future water availability. This legislation will have a significant impact on the many growers in the San Joaquin Valley (SJV) who rely on groundwater as their primary source of irrigation water.
Deficit irrigation (DI) is a practice to reduce irrigation below the crop water requirement with minimal impact on yield and quality. There are several approaches, including: sustained deficit irrigation (SD), regulated deficit irrigation (RD), and partial root zone drying (PRD). SD is an approach that uniformly reduces the applied irrigation below the crop water requirement throughout the growing season. RD provides adequate water during critical growth periods that may affect yields and withholds water during those periods that will have minimal impact on the yield both during the current year and in subsequent years. PRD dries down half of the root zone and alternates between sides of the root zone when a threshold plant stress level in the canopy is reached on the side without irrigation. Studies have not demonstrated any advantage of the PRD approach relative to SD or RD [3].
RD has been successfully used in peach, pear, and apple [4,5,6,7]. However, recent results indicate the practice may be deleterious to long-term production in peach [7,8,9]. Early season varieties of plums [10] and grapes [11,12] are two examples of crops that can be deficit irrigated following harvest without impacting yield in subsequent years. Deficit irrigation is also routinely used as an irrigation strategy on wine grapes to promote quality parameters for wine production [13].
Nearly 80,000 ha of raisin grapes are produced in the SJV [14]. Traditionally, raisins are made by removing ripened grape clusters and laying them in the field on a paper “tray” to dry. New grape varieties have been bred to be dried on the vine (DOV) to reduce labor costs and minimize the impact of weather (rain) on the quality of the raisin [15]. Fiesta is a new variety developed for DOV production [16,17] that has little information available on its water requirements.
Using a weighing lysimeter, Williams et al. [18] demonstrated that Thompson seedless grapes could be irrigated with a sustained deficit equal to 80% of full crop evapotranspiration without impacting yield and quality. Thus, it may be possible to reduce irrigation on other table and raisin grape varieties without negative impacts on yield and quality. The objective of this study was to determine the water requirement and the effect of alternative irrigation strategies (SD and RD), on the yield and quality of Fiesta raisin grapes grown in the San Joaquin Valley of California.
2. Materials and Methods
2.1. Research Site
The research was conducted in a commercial vineyard located in Caruthers, California, USA (Lat. 36.54655° N, Long. −119.8791° W). The own-rooted vines (Vitis vinifera L. cv. Fiesta) were trained on a 45-cm-wide two-wire T trellis located ≈1.4 m above ground. The plant spacing was 3.6 m between rows and 2.1 m within the row, resulting in a plant density of ≈1280 vines per ha. The soil is a Hesperia fine sandy loam (Coarse-loamy, mixed, superactive, nonacid, thermic Xeric Torriorthents) with a bulk density ranging from 1.58 to 1.62 g/cm3. Field capacity (FC) is 0.198 cm3 cm−3 and the permanent wilting point (PWP) is 0.119 cm [19]. The total available water (TAW) in a 1.5 m profile is approximately 118 mm.
2.2. Irrigation Treatments and System
The irrigation schedule was determined by the grower based on his experience and the previous week’s weather and the crop growth stage. Weekly irrigations started at 5 pm on Friday and ended at 12 pm on Monday, typically lasting 65 h which corresponded to a period of reduced rates for electricity. We assumed the grower irrigation was at least meeting 100% of the water requirement and developed our irrigation treatments as a percentage of the grower irrigation practice (GI).
The three irrigation treatments were: grower irrigation (GI), consisting of weekly irrigations beginning in March and continuing through October except for approximately 2 to 3 weeks while the fruit was drying beginning at cane cutting and ending after harvest; sustained deficit (SD), equal to 80% of the GI treatment throughout the growing season; and regulated deficit (RD), equal to 50% of GI until fruit set at which time it was increased to 80% of GI until cane cutting and following harvest it was reduced to 50% of GI. Deficit irrigation strategies were implemented in 2012 and continued through 2014.
Irrigation was applied using a drip system with 2 L h−1 emitters per plant spaced 0.5 m on either side of a vine, with an additional dripper 2 L h−1 mid-way between vines in a row. The application rate was approximately 0.8 mm hr−1. The drip line was suspended approximately 0.5 m above the ground and attached to the trellis posts. Irrigation water was supplied by a well located in the vineyard. The experimental block was isolated from the remainder of the field by installing sub-mains that connected all replications of a treatment. Each submain had a flow meter and valve installed and flow was recorded using a CS 3000 data logger (Campbell Scientific, Logan UT) that also controlled and monitored the irrigation in each treatment. The irrigation control program began operating at ≈ 5 pm on Friday afternoon and ended at 12 pm on the following Monday. All treatments began at the same time, but the SD and RD treatments ended before the GI finished irrigating based on their operational criteria. All fertilization was done through the drip system at the beginning of an irrigation. Disease, pest management, and fertilization were applied by the grower based on commercial practices.
2.3. Weather, Leaf Water Potential, and Soil Water Data
The experimental site was in an area of the SJV without any close coverage by a California Irrigation Management Information System (CIMIS) station. However, the CIMIS network provides an option for the spatial determination of the reference evapotranspiration (ETo) and this option was used to estimate the ETo at the research site. For spatial determination of ETo CIMIS uses a combination of data derived from satellites and interpolated from CIMIS station measurements to estimate ETo at a 2 kilometer (km) spatial resolution using the American Society of Civil Engineers version of the Penman-Monteith equation (ASCE-PM). Required input parameters are solar radiation, air temperature, relative humidity, and wind speed at two meters’ height. The CIMIS weather station at the University of California West Side Research and Extension Center (WSREC) is located approximately 50 km west of the research site. The WSREC CIMIS station was used for reference evapotranspiration data and precipitation data prior to the installation of the Puresense Irrigation Manager (Jain Irrigation, Fresno, CA) system located in the research plot.
Leaf water potential (Ψ) was measured weekly throughout the summer using a pressure chamber (Soilmoisture Equipment Corp., Santa Barbara, CA). The measurements were taken at midday on 12 mature fully sunlit leaves in each treatment, following the recommendations of Hsiao [20]. Accumulated water stress over the season was characterized using a water stress integral (WSI) estimated over the entire growing season as represented by (t) in equation 1 from daily measurements of Ψ at an interval of n days between measurement using Equation (1),
where Ψ (i, i + 1) is the mean of Ψ for any interval (i, i + 1) and c is the least stress measured during the season [21].
Soil water content was measured in 30-cm increments to a depth of 1.5 m using a Puresense Irrigation Manager capacitance probe (Jain Irrigation, Fresno, CA, USA). One probe was in a single replication of each treatment. The probes were installed in June 2012 and were run continuously until the end of the project using the factory calibration. These are non-saline soils and the factory calibration was suitable for characterizing the changes in soil water content. Data from the probes were used to characterize the changes in soil water content. Crop water was calculated for the growing season and dormancy using precipitation (P), irrigation (I), and change in stored soil water (∆SW). There was no water table in the region and thus no capillary rise and no surface runoff since the field was drip irrigated. Deep percolation was not considered significant because of the interval between irrigation and the crop water use dried down the profile and stored most of the applied water. Dormancy was defined as the period from harvest in one year to bud break in the following year and included November through March. The growing season was defined as running from April through October, which corresponded to approximately bud break to leaf drop. The ETo was determined for the growing season from the spatial CIMIS data prior to the installation of the Puresense equipment.
2.4. Yield and Fruit Quality
Prior to cutting the canes, the number of clusters on the 10-experimental vines was counted, harvested into a bin, and weighed to determine an average fresh cluster weight. The fruit on 5 additional contiguous vines was partially dried by cutting the canes and after 3 to 5 days on the vine, the fruit was mechanically harvested and placed on a continuous paper tray to complete the drying process [16]. The dates for cane cutting, laying the raisins on the ground, and harvest are provided in Table 1.
Yield was measured by weighing the total fruit from the additional five contiguous vines in each plot, after being dried for approximately 10 days on the ground. A 1 kg subsample of fruit from each plot was taken to the U.S. Department of Agriculture (USDA) grading station located on the Sun Maid packing facility, Selma, CA. Raisins were graded using an airstream sorter and reported as Grade A, with 80% of well-matured grapes, Grade B, with 70% of reasonably well matured grapes, and Grade C, with 55% of fairly well matured grapes. Raisins failing to meet the Grade C maturity requirements were categorized as substandard grade (United States Standards for Grades of Processed Raisins, 1978). Grade A and Grade B were combined and reported as B or Better. Samples were tested for moisture, substandard percent, and % grade B or better. In terms of moisture, USDA dictates that raisins should contain no more than 16%.
2.5. Statistics
The treatments were distributed in a randomized complete block design with three replications. Each plot consisted of three rows with ten experimental vines identified in the center row of each plot. The 10 vines were subdivided into 2 groups of 3 contiguous vines and one group of 4 contiguous vines distributed along the row. Because of the machine harvest, five contiguous vines in the center row were used for yield and quality analysis. Raisin moisture content was adjusted to 14% prior to yield analysis [17]. Data were analyzed by one-way analysis of variance (ANOVA: SPSS, Chicago, IL, USA), and means were separated at p ≤ 0.05 using Tukey’s test.
3. Results
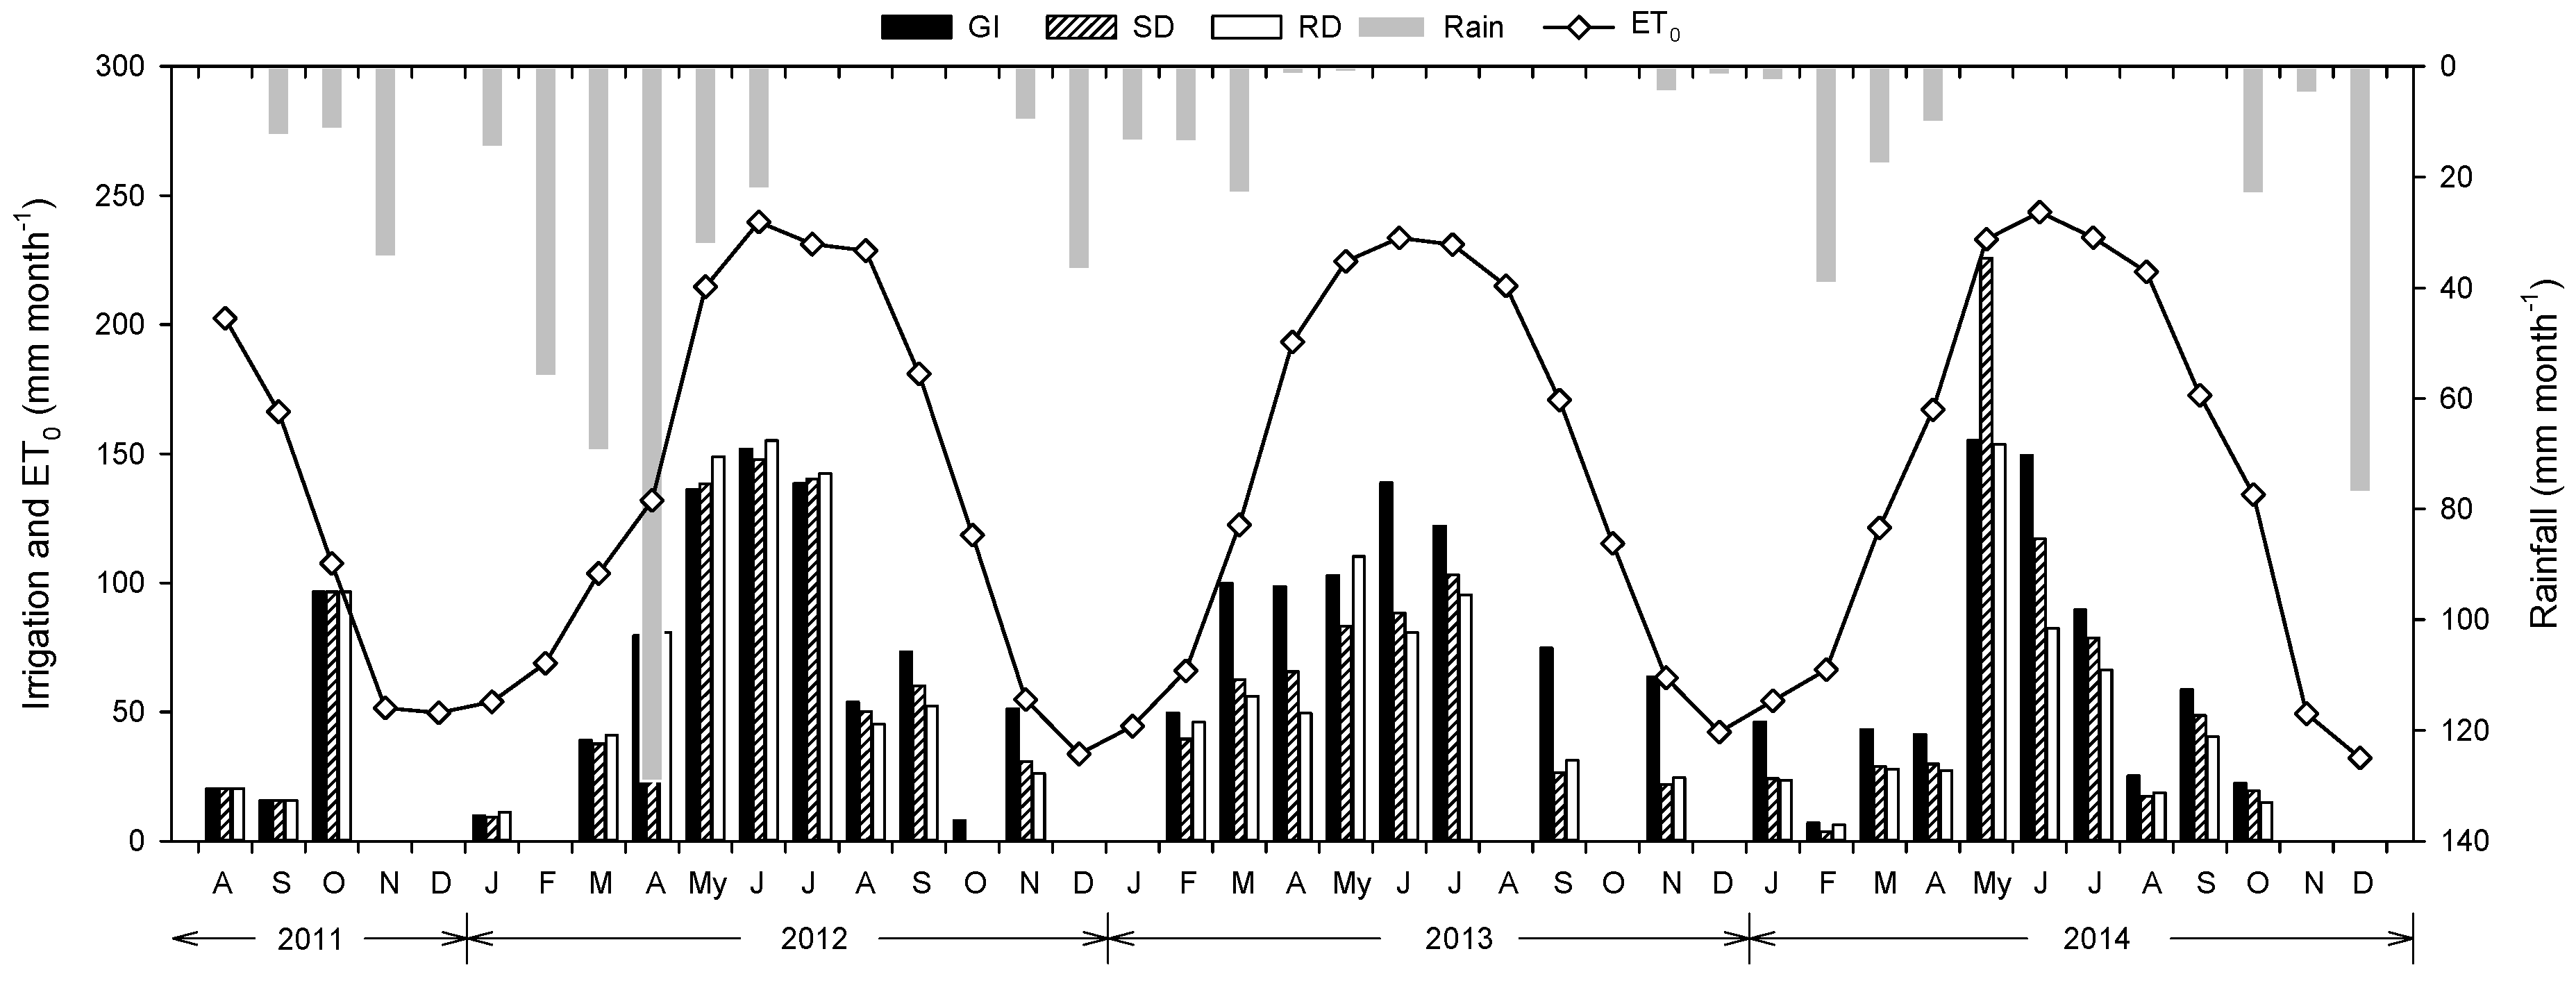
Climate in the SJV is characterized as Mediterranean, with most rainfall occurring during the winter months (November to March) and no rainfall occurring during the summer months (Figure 1). Rainfall in the winter of 2011–2012 was 140 mm, 96 mm in the winter of 2012–2013 and 65 mm in the winter of 2013 to 2014 compared the 27-year average of 218 mm. There was 183 mm, 3 mm, and 10 mm rainfall during 2012, 2013, and 2014 growing seasons (Table 2). The large difference in the total water use between the 2012 growing season and the 2013 and 2014 seasons was the rainfall that extended in April and May in 2012 and not in 2013 and 2014 which increased the total water availability and crop use.
To ensure that the plant has adequate water for early season growth and development and delay the time of the first irrigation, growers of perennial crops in the SJV typically try to have a full soil water profile in the root zone prior to bud break in the spring. This is done using a combination of rainfall and irrigation. In this area, the rainfall period extends from dormancy of the previous year to bud break in the current year. Growers will estimate and apply the irrigation water needed to supplement rainfall and fill the soil water profile prior to bud break. To capture this practice, we divided the crop water use calculations in Table 2 into two periods; from harvest the previous year to bud break in the current year, and from bud break to dormancy in the current year (growing season). We found that the combined rainfall and irrigation data in Table 2 averaged across years and treatments is approximately 198 mm. This amount of applied water was adequate to fill the crop root zone in these soils prior to bud break.
The total crop water use in 2012 included 140 mm of rainfall plus 43 mm of irrigation prior to bud break and 183 mm of rainfall and irrigation in the GI treatment (47% of ETo) during the growing season as well. There was significant crop water use from soil water in all treatments during this growing season as well. Applied irrigation in the GI treatment was reduced in 2013 and 2014 to 41% and 36% of ETo respectively, (Table 2) due to drought restrictions and concern by the grower for the pump operation and depth of available water in the irrigation well. The total irrigation for the growing season averaged across all treatments was 625 mm in 2012 mm 369 mm in 2013, and 426 mm in 2014. The average contribution of the stored soil water to the vines across all treatments also declined each year from a high of 207 mm in 2012 to 174 mm in 2013 to 67 mm in 2014 (Table 2). The total calculated water use for the GI treatment was 1070 mm in 2012, which was equal to 80% of ETo, 527 mm in 2013 which was equal of 38% of ETo, and 530 mm in 2014, which was equal to 40% of ETo.
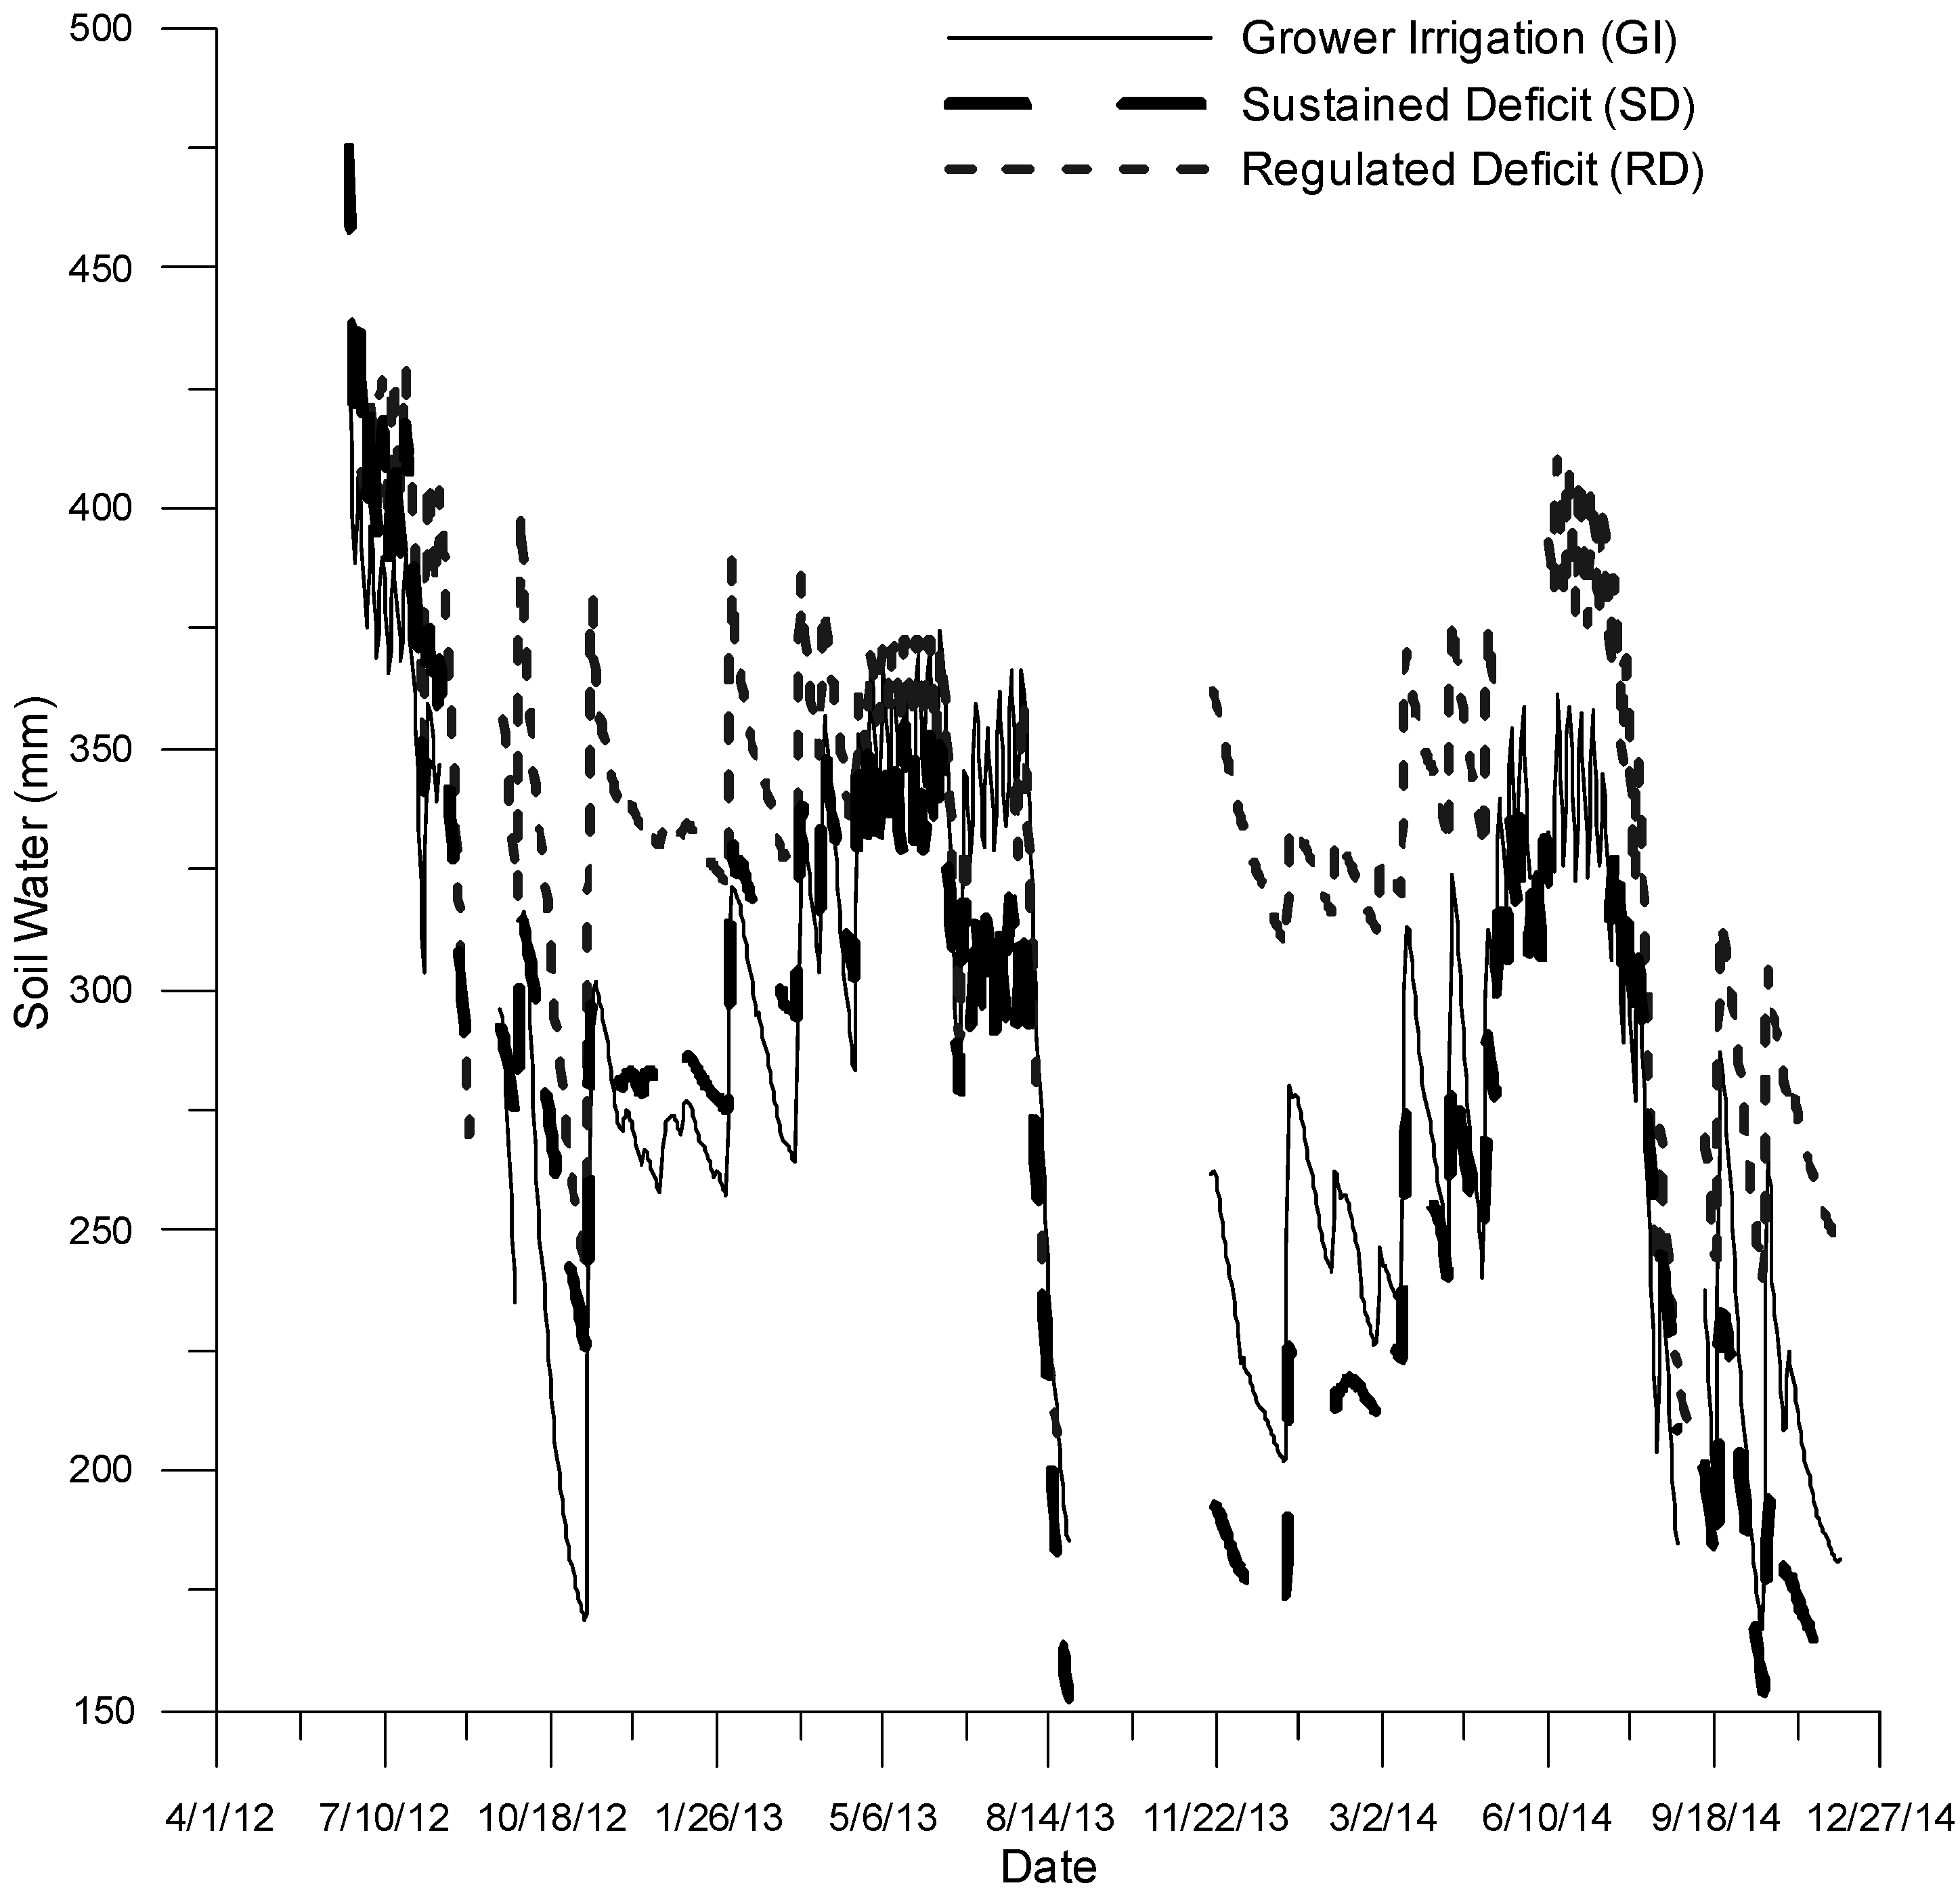
The variation in the soil water content in 1.5 m of the soil profile in Figure 2. The data show that during the growing season there was a consistent change in the stored soil water that reflected the irrigation and crop water use. This ranged between 325 and 425 mm of water stored in the soil profile. At the end of the irrigation season before leaf drop each of the treatments extracted significant quantities of water from the soil profile. A total input of rainfall and irrigation of approximately 190 mm returned the stored water in the profile to 360 mm which was sufficient to meet the early season demand from bud break to early canopy development.
The crop water use for the Fiesta grapes in the SD treatment was 1023.3 mm in 2012, 449.1 mm in 2013 and 554.3 mm in 204. The water use for the RD treatment was 952.2 mm in 2012, 528.8 mm in 2013, and 426.1 mm in 2014. The 3-year crop water use averages for the GI, SD and RD treatments are 735 mm, 675 mm, and 635 mm, respectively. When just 2013 and 2014 are considered, the average water use across years was 566.8, 501.7 and 477.4 mm for the GI, SD and RD treatments respectively. This compares to the estimate of 560 and 710 mm of water for fully irrigated Thompson seedless grapes grown for raisins in the southern SJV [22].
Since ETc is proportional to the leaf area exposed to sunlight, the difference in well-watered Thompson Seedless and Fiesta may be the result of differences in the size of the cross arm used to support the crop. Williams et al. [18] using a weighing lysimeter found that ETc for high frequency irrigated Thompson Seedless grape ranged from 718 to 865 mm. Using the same weighing lysimeter, Williams et al. [23] demonstrated that crop water use of Thompson Seedless was a linear function of the shaded area. In the Williams, et al., study [18] the vines were trained on 0.6-m cross-arms rather than 0.45-m cross-arms used in the present study A proportional reduction the leaf area exposed to sunlight based on the cross-arm length would result in a 25% reduction in the ETc [23,24].
There is not a crop coefficient for Fiesta raisin grapes to use in scheduling irrigation or determining crop water use. Williams et al. [25] developed a Kc for Thompson Seedless grapevine as a function of the day of the year. We applied that Kc to ETo values measured during this experiment. The resulting values for ETc adjusted for the reduced leaf area are: 520.4 mm, 507.2 mm and 533.8 mm for 2012, 2013 and 2014, respectively. These values reflect the crop water use for the GI treatment and demonstrate that the 2012 irrigation was excessive. The 2013 GI exceeded the above estimates for well-watered grapevines.
There continues to be a lack of acceptance in the grower community of a scientific approach to irrigation management. This project was developed using the grower methods as demonstration of a method to refine his current practice with the goal of improving water management. Williams et al. [18] had demonstrated with Thompson seedless that irrigation could be reduced by 80% without affecting yield and quality of grapes. This represented a starting point for the grower to modify his current practice. This was an effective technique and one that could be easily applied in other regions. Typically, this would be tested on a small block and expanded as the grower gained confidence. It also provides a management alternative during periods of limited water supply.
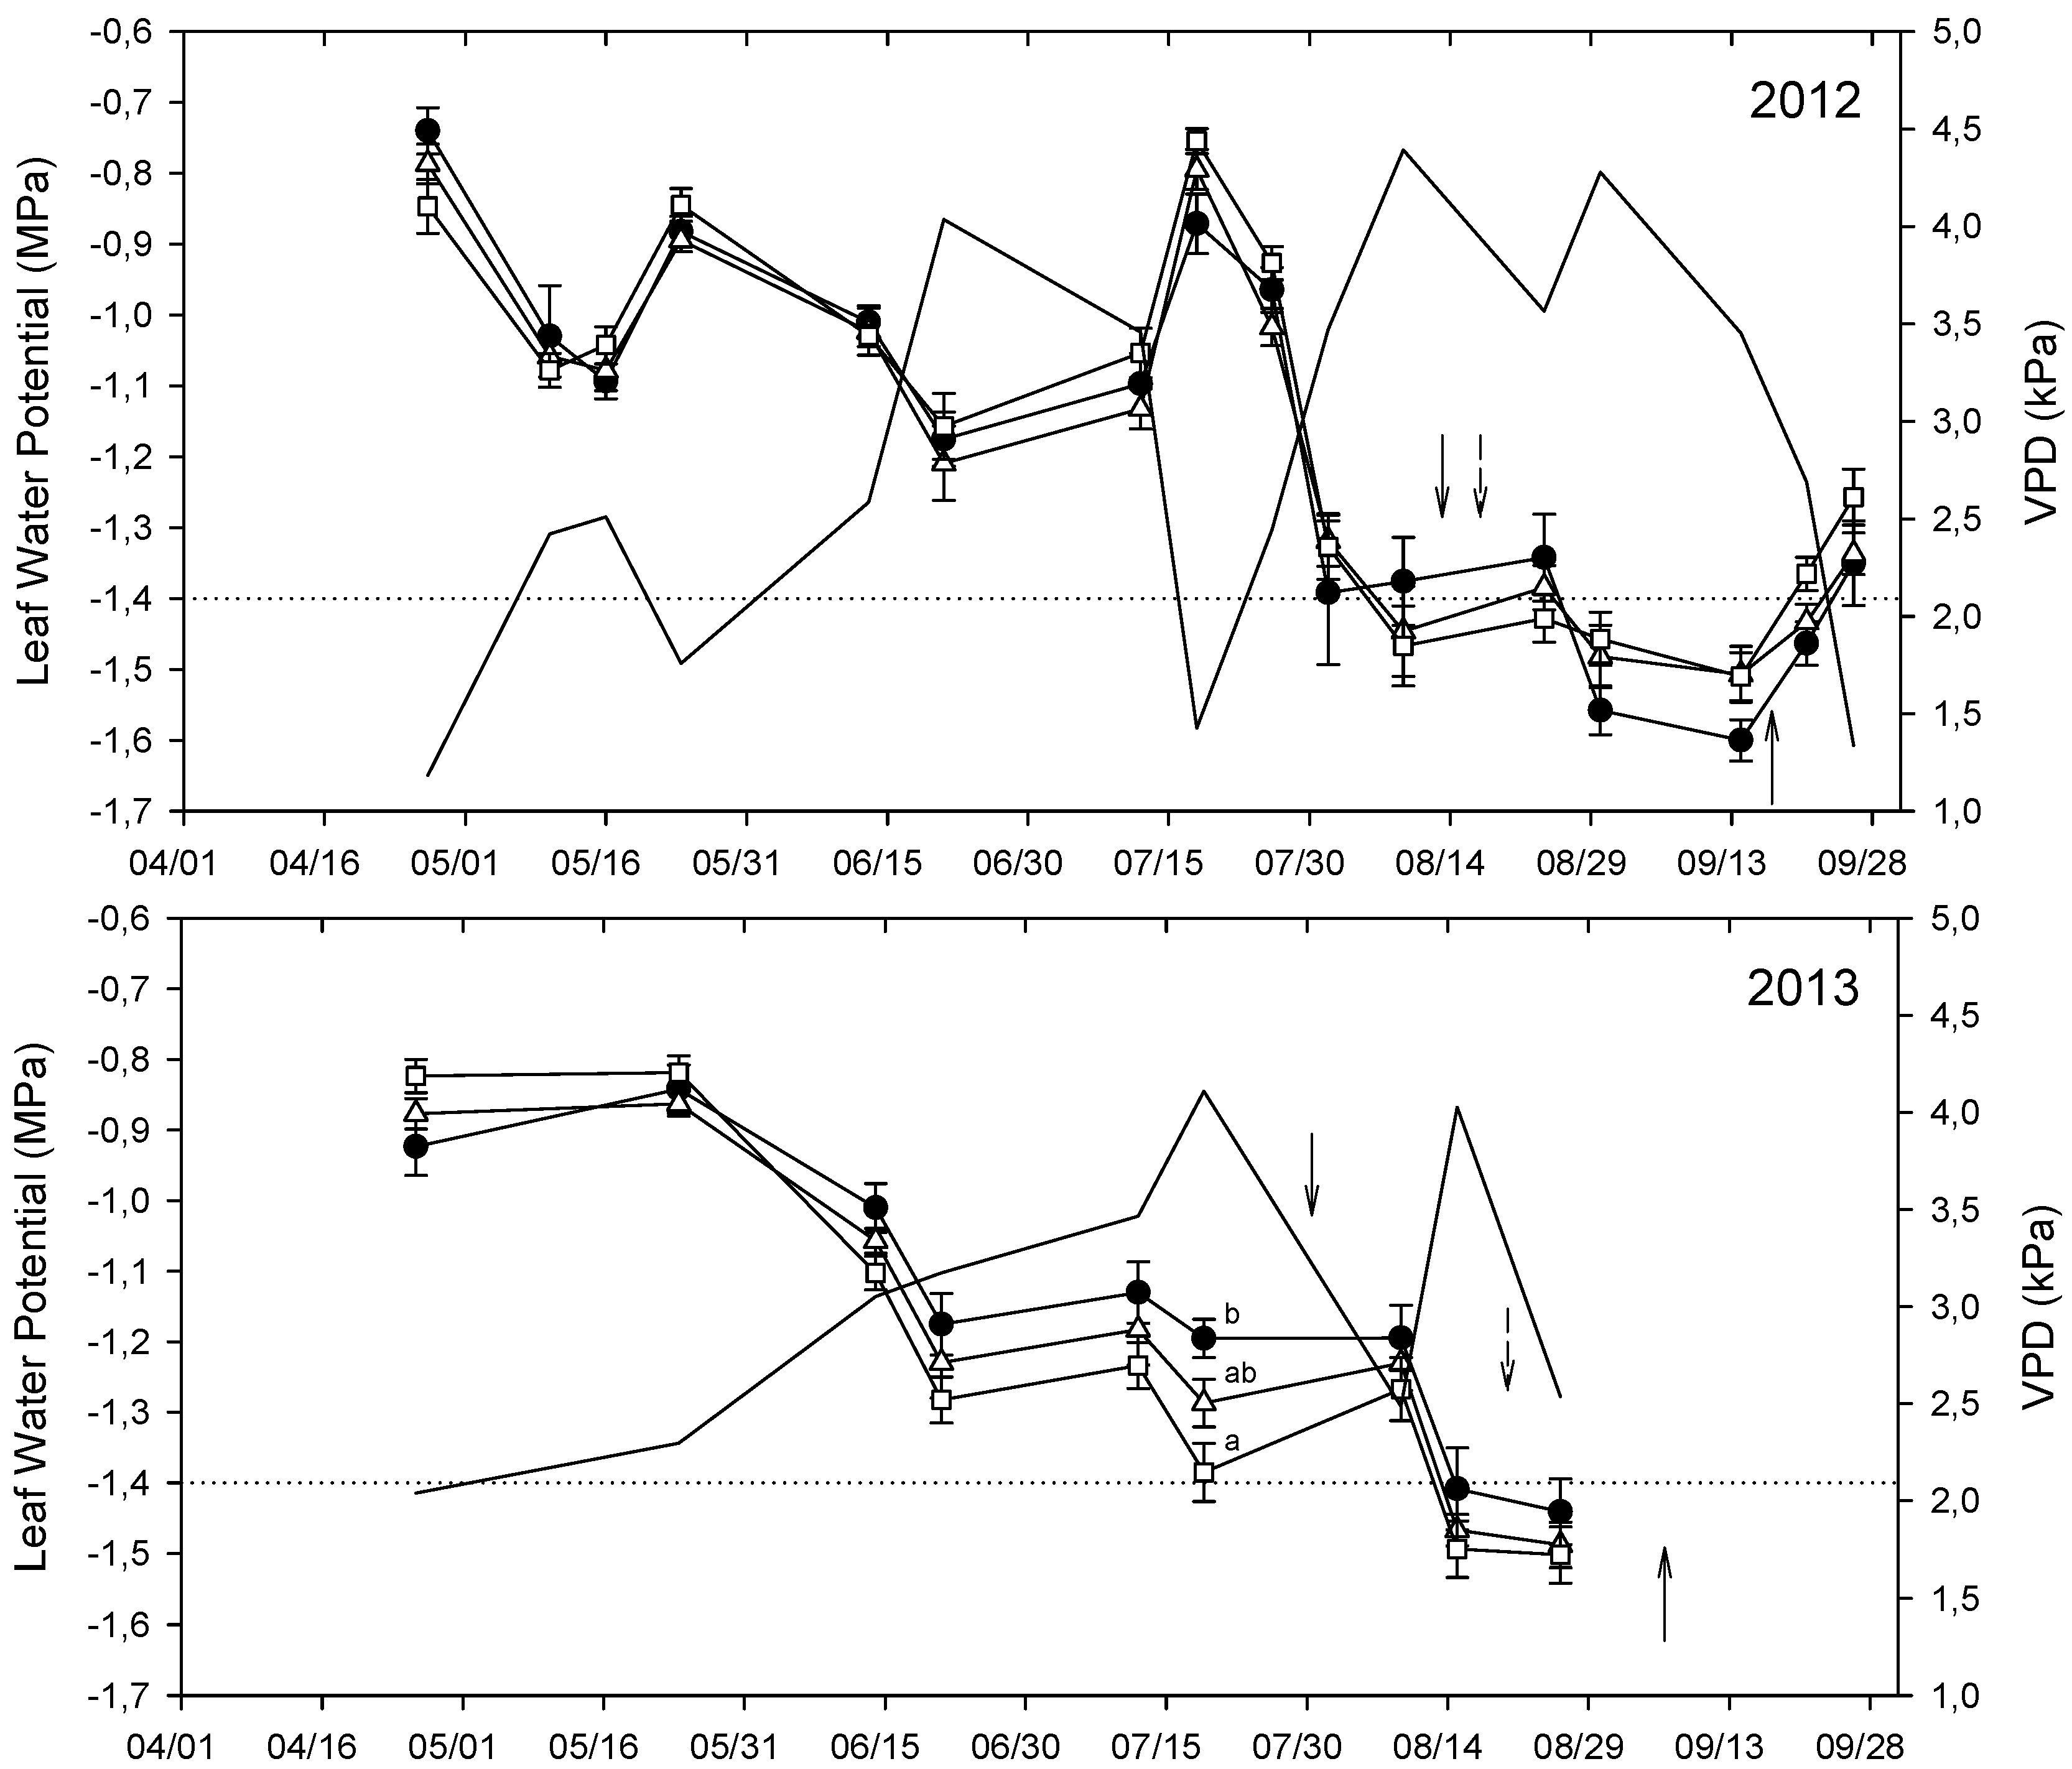
There were no differences in Ψ among the treatments early in the season each year, except in 2014 (Figure 3). In 2012, rain along with irrigation maintained high levels of soil water content (data not shown), minimizing plant water stress. Thus, Ψ ranged from −0.75 to −1.20 MPa early on in 2012 and dropped to ≈−1.4 MPa in August, at which point irrigation was withheld in order to dry the raisins; Ψ reached a minimum of −1.6 MPa just after harvest which would not affect the yield or quality of the fruit. In 2013, there was rain prior to bud break, and Ψ remained >−1.3 MPa until mid-June. The stress did not increase until after fruit development was completed and thus had no impact on the final yield.
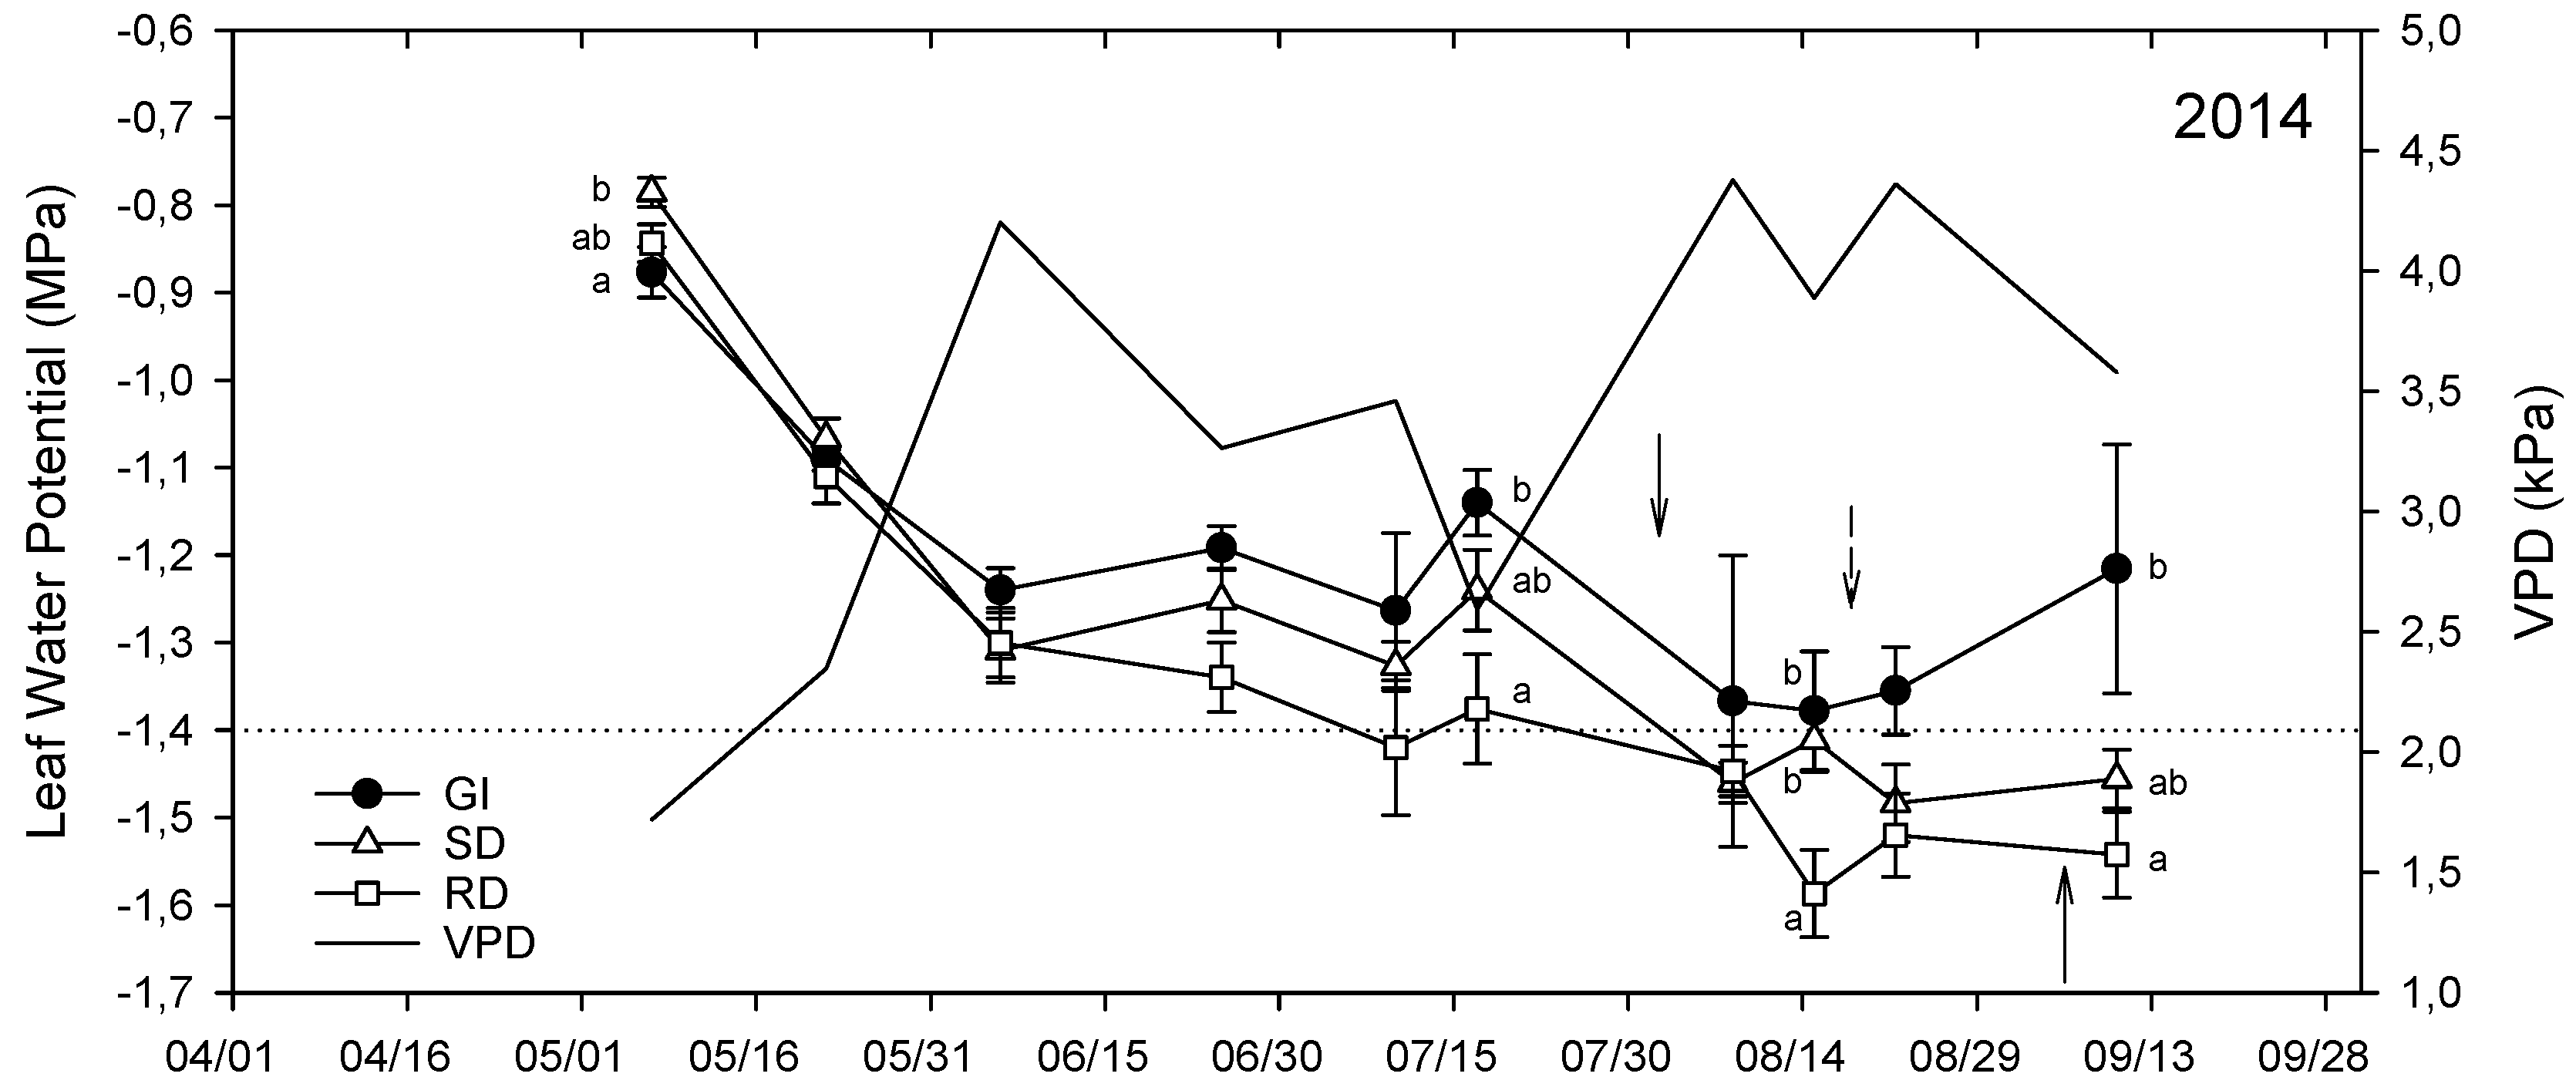
With one exception in mid-July, there were no differences in Ψ among the treatments in 2013. Due to a problem with the pressure chamber, Ψ was not measured after the canes were cut in 2013. In 2014, Ψ reached −1.4 MPa by the beginning of July.
The stress integral as a measure of accumulated stress over a growing season has been used to characterize stress development to differentiate treatment effects. Overall, there was very little difference in accumulated water stress as characterized by the stress integral among the treatments in 2012 and 2013. In 2012 the GI had slightly greater accumulated stress and the RD treatment had the greatest accumulated stress in 2013. In 2014, the deficit treatments had higher values of accumulated stress than GI (Table 3). However, the accumulated stress in the SD and RD treatments in 2014 were like the values found in 2012.
In 2013 and 2014 there were statistical differences in the number of clusters per vine between the SD and RD treatment (Table 4). In 2013 and 2014, the RD treatment had a greater number of clusters per vine than the GI treatment. The SD had a greater number of clusters per vine in 2014 than either of the other two and fewer in 2013 than the remaining treatments. There was no difference in the cluster weights in 2013 statistically, however, there was a statistical difference in the cluster weights between treatments in 2014.
In all three years, the total yield estimated on the weight per vine resulted in no yield differences statistically, however, there were differences in yield. In 2012 and 2013 the SD and RD treatments had higher yields than the GI treatment which was not the case in 2014 when the GI treatment had the highest of the three yields. The average yield across all treatments was 7.9 t ha−1 in 2012, 9.6 t ha−1 2013 and 11.8 t ha−1 in 2014.
The SD treatment showed similar yield, fruit quality, and clusters per vine as the GI treatment but used less water, which increased water productivity. Except for 2012 when the SD treatment had significantly greater % substandard than the GI treatment. Fidelibus et al. [16] described an industry average volume of production for a Fiesta vineyard of 10.1 t ha−1, with individual vineyards mostly averaging between 7.6 and 15.0 t ha−1. Using the yield per vine data and the vines per ha estimate, the yields in this experiment are comparable to the industry average. During 2014, the SD treatment had slightly, although not significantly, lower yield than the rest of the treatments, but within the range described by Christensen [24]. In 2014 the GI treatment had fewer clusters per vine than the deficit irrigated treatments but this was offset by the increased cluster weight resulting in greater yield than the remaining treatments.
Even though there were no statistical differences in the yields between treatments, the actual yield data (t ha−1) in Table 4 were divided by the applied water (I) data were used to determine the water productivity (WP). However, the WP data demonstrated that there were statistical differences in the water productivity between treatments in 2013 and 2014. In both years, RD had the highest water productivity of the three treatments. In 2013 there was a difference in water productivity between the GI and both SD and RD treatments but not between the SD and RD treatments. In 2014 the RD and GI were statistically different from the SD treatment but not from each other.
Raisin quality in the SD and RD treatments was comparable to the GI treatment in all three years. In 2012 there were statistical differences in the substandard treatment but not in the B and better categories. The percentage of substandard raisins in 2013 and 2014 was significantly less than in 2012, coming from an average of 12.6% to 3.6%. The average B and better percentages were 55.3%, 84.1%, and 75.4% in 2012, 2013 and 2014, respectively. This resulted in a reduction of the percentage of grade C fruit going from 33.9% in 2012 to 12.3% and 21.0% in 2013 and 2014, respectively. The major difference between 2012, 2013 and 2014 is the depth of applied irrigation water and the total estimated crop water use.
4. Conclusions
The average crop water use for 2013 and 2014 was 567 mm, 502 mm, and 477 mm for the GI, SD and RD treatments respectively, when the soil water content is at field capacity at bud break. Approximately 190 mm of combined rainfall and irrigation are required to ensure that the soil profile is up to field capacity prior to bud break in this soil. Yield was sustained in SD and RD, with up to a 20% reduction in applied water use compared to the GI (566 mm) in 2013 and 2014. There were no statistical differences in yield between treatments in any of the three years of the project. The yield increased from an average of 7.9 tons per hectare to 11.8 tons per hectare in 2014. The accumulated stress as characterized by the stress integral over the season was similar across the treatments indicating that deficit irrigation was a viable alternative in situations with limited water supplies. There were no differences in the % B or Better raisins between any of the treatments in any year. The percent B or Better was 53.5, 84.0, and 75.4% in 2012, 2013, and 2014, respectively. There were statistical differences in the percent of substandard in 2012 but not in 2013 and 2014. The percentage of substandard grapes decreased from an average of 12.6% in 2012 to 3.6% in 2013 and 2014. This corresponded to a reduction in total average water use from 1015 mm in 2012 to 503 mm in 2014. There is little acceptance and implementation of scientific irrigation management by the grower community and this project demonstrated an approach that can be used to facilitate improving irrigation management. Use of a sustained deficit similar to the SD treatment would be recommended to a grower for ease of implementation. Previous research on fully irrigated grapevines has demonstrated that applied water could be reduced by 20% without impacting yield or quality. This represents a starting point.
Author Contributions
This research was conceptualized by James E. Ayars during the funding acquisition. The methodology for the field investigation was a joint effort between James E. Ayars and Isabel Abrisqueta. Isabel Abrisqueta was responsible for the field data collection, analysis and the original draft preparation under James E. Ayars’ supervision. Ayars reviewed, edited and submitted the manuscript and has followed up on required revisions. James E. Ayars was responsible for administering the project.
Funding
This research was funded by National Institutes of Food and Agriculture – Specialty Crops Research Initiative (NIFA-SCRI) grant number 2010-01119.
Acknowledgments
The authors thank Richard Schoneman for his assistance in the installation and maintenance of the project. We thank Tim Rodrigues for the use of his vineyard for the project and the assistance and cooperation throughout the project. We are indebted to Sun Maid Growers for their support in particular, Rick Stark and Mike Moriyama. The authors also thank the two anonymous reviewers for their assistance and thoughtful suggestions and annotations used during the revision of this manuscript. This research was supported in part by a National Institutes of Food and Agricultural – Specialty Crops Research Initiative (NIFA-SCRI) grant “Vineyard water management strategies with Limited and Impaired Water Supplies”. “The U.S. Department of Agriculture (USDA) prohibits discrimination in all its programs and activities on the basis of race, color, national origin, age, disability, and where applicable, sex, marital status, familial status, parental status, religion, sexual orientation, genetic information, political beliefs, reprisal, or because all or part of an individual's income is derived from any public assistance program. (Not all prohibited bases apply to all programs.) Persons with disabilities who require alternative means for communication of program information (Braille, large print, audiotape, etc.) should contact USDA’s TARGET Center at (202) 720-2600 (voice and TDD). To file a complaint of discrimination, write to USDA, Director, Office of Civil Rights, 1400 Independence Avenue, S.W., Washington, D.C. 20250-9410, or call (800) 795-3272 (voice) or (202) 720-6382 (TDD). USDA is an equal opportunity provider and employer.”
Conflicts of Interest
The authors declare no conflict of interest. The funding sponsors had no role in the design of the study; in the collection, analyses, or interpretation of data; in the writing of the manuscript, and in the decision to publish the results.
References
- Allen, R.A.; Pereira, L.S.; Raes, D.; Smith, M. Crop Evapotranspiration Guidelines for Computing Crop Water Requirements; FAO Drainage and Irrigation Paper 56; FAO: Rome, Italy, 1998; 300p. [Google Scholar]
- Sustainable Groundwater Management Act. Composed of Following Bills, AB 1739, SB 1319, and SB 1186, 2014. Available online: https://leginfo.legislature.ca.gov/faces/billNavClient.xhtml?bill_id=201320140AB1739 (accessed on 24 June 2016).
- Sadras, V.O. Does partial root-zone drying improve irrigation water productivity in the field? A meta-analysis. Irrig. Sci. 2009, 27, 183–190. [Google Scholar] [CrossRef]
- Chalmers, D.J.; Mitchell, P.D.; van Heek, L. Control of peach tree growth and productivity by regulated water supply, tree density, and summer pruning. J. Am. Soc. Hortic. Sci. 1981, 106, 307–312. [Google Scholar]
- Chalmers, D.J.; Burge, G.; Jerie, P.H.; Mitchell, P.D. The mechanism of regulation of “Bartlett” pear fruit and vegetative growth by irrigation withholding and regulated deficit irrigation. J. Am. Soc. Hortic. Sci. 1986, 6, 904–907. [Google Scholar]
- Girona, J.; Mata, J.; Arbones, A.; Alegre, S.; Rufat, J.; Marsal, J. Peach tree response to single and combined regulated deficit irrigation regimes under shallow soils. J. Am. Soc. Hortic. Sci. 2003, 128, 432–440. [Google Scholar]
- Girona, J.; Gelly, M.; Mata, M.; Arbones, A.; Rufat, J.; Marsal, J. Peach tree response to single and combined deficit irrigation regimes in deep soils. Agric. Water Manag. 2005, 72, 97–108. [Google Scholar] [CrossRef]
- Abrisqueta, I.; Vera, J.; Tapia, L.M.; Abrisqueta, J.M.; Ruiz-Sanchez, M.C. Soil water content criteria for peach trees water stress detection during the postharvest period. Agric. Water Manag. 2012, 104, 62–67. [Google Scholar] [CrossRef]
- Vera, J.; Abrisqueta, I.; Abrisqueta, J.M.; Ruiz-sánchez, M.C. Effect of deficit irrigation on early-maturing peach tree performance. Irrig. Sci. 2013, 31, 747–757. [Google Scholar]
- Johnson, R.S.; Handley, D.E.; Day, K.R. Postharvest water stress of an early maturing plum. J. Hortic. Sci. Biotechnol. 1994, 69, 1035–1041. [Google Scholar]
- Netzer, Y.; Chongren, Y.; Shenker, M.; Bravdo, B.A.; Schwartz, A. Water use and the development of seasonal crop coefficients for Superior Seedless grapevines trained to an open-gable trellis system. Irrig. Sci. 2009, 27, 109–120. [Google Scholar] [CrossRef]
- Serman, FV.; Liotta, M.; Parrea, C. Effects of Irrigation Deficit on Table Grapes cv. Superior Seedless Production; International Society for Horticultural Science (ISHS): Leuven, Belgium, 2004. [Google Scholar]
- Acevedo-Opazo, C.; Ortega-Farias, S.; Fuentes, S. Effects of grapevine (Vitis vinifera L.) water status on water consumption, vegetative growth and grape quality: An irrigation scheduling application to achieve regulated deficit irrigation. Agric. Water Manag. 2010, 97, 956–964. [Google Scholar] [CrossRef]
- Staff, California Grape Acreage. Report. Food and Agriculture; Sacramento, California Department of Food and Agriculture: Sacramento, CA, USA, 2013; 63p.
- Peacock, W.L.; Swanson, F.H. The Future California Raisins is Drying on the Vine; California Agriculture, University of California: Davis, CA, USA, 2005; Volume 59, pp. 70–74. [Google Scholar]
- Fidelibus, M.W. Grapevine Cultivars, Trellis Systems, and Mechanization of the California Raisin Industry. HortTechnology 2014, 24, 285–289. [Google Scholar]
- Fidelibus, M.W.; Christensen, P.L.; Katayama, D.G.; Ramming, D.W. Early-ripening Grapevine Cultivars for Dry-on-vine Raisins on an Open-gable Trellis. HortTechnology 2008, 18, 740–745. [Google Scholar]
- Williams, L.; Phene, C.J.; Grimes, D.W.; Trout, T.J. Water use of young Thompson Seedless grapevines in California. Irrig Sci. 2003, 22, 1–9. [Google Scholar]
- Isidoro, D.; Grattan, S.R. Predicting soil salinity in response to different irrigation practices, soil types and rainfall scenarios. Irrig. Sci. 2011, 29, 197–211. [Google Scholar] [CrossRef] [Green Version]
- Hsiao, T.C. Measurements of plant water stress. In Irrigation of Agricultural Crops; Stewart, B.A., Nielsen, D.R., Eds.; Agronomy Monograph No. 30; American Society of Agronomy: Madison, WI, USA, 1990; pp. 243–279. [Google Scholar]
- Myers, B.J. Water stress integral—A link between short-term and long-term growth. Tree Physiology 1988, 4, 315–322. [Google Scholar] [CrossRef] [PubMed]
- Peacock, W. Water Management for Grapevines; IG1-95; UC Cooperative Extension Bulletin Pub.: Davis, CA, USA, 1995; p. 4. [Google Scholar]
- Williams, L.; Ayars, J.E. Grapevine water use and the crop coefficient are linear functions of the shaded area measured beneath the canopy. Agric. For. Meteorol. 2005, 132, 201–211. [Google Scholar] [CrossRef]
- Christensen, L.P. Raisin grape varieties. In Raisin Production Manual; University of California, Agricultural and Natural Resources Publication: Oakland, CA, USA, 2000; pp. 38–47. [Google Scholar]
- Williams, L.E.; Phene, C.J.; Grimes, D.W.; Trout, T.J. Water use of mature Thompson Seedless grapevines in California. Irrig. Sci. 2003, 22, 11–18. [Google Scholar]
Figure 1.
Monthly irrigation water applied in each treatment (GI—grower irrigation, SD—sustained deficit, RD—regulated deficit), rainfall and reference crop evapotranspiration (ETo) from 2011 to 2014.
Figure 1.
Monthly irrigation water applied in each treatment (GI—grower irrigation, SD—sustained deficit, RD—regulated deficit), rainfall and reference crop evapotranspiration (ETo) from 2011 to 2014.

Figure 2.
Soil water (mm) in 1.5 m of soil profile measured with capacitance probe. One measurement site in each treatment.
Figure 2.
Soil water (mm) in 1.5 m of soil profile measured with capacitance probe. One measurement site in each treatment.

Figure 3.
Leaf water potential for 2012, 2013, and 2014 for grower irrigation (GI), sustained deficit (SD) and regulated deficit (RD) vapor pressure deficit (VPD). The down arrow represents irrigation withhold start point. The dotted shape arrow down represents the date when the canes were cut. The arrow up represents the restoration of the irrigation after harvest. Each value is the mean ± SE of six individual measurements. Different letters at each time indicates significant differences according to the Tukey’s Test HSD (p ≤ 0.05).


Table 1.
Dates for cutting canes, laying fruit on continuous paper tray and harvest (picking fruit off the continuous paper tray) at Caruthers, California field site.
Table 1.
Dates for cutting canes, laying fruit on continuous paper tray and harvest (picking fruit off the continuous paper tray) at Caruthers, California field site.
| Cut Canes | Fruit on Ground | Harvest |
|---|---|---|
| 08/16/2012 | 08/31/2012 | 09/07/2012 |
| 08/20/2013 | 08/28/2013 | 09/04/2013 |
| 08/18/2014 | 08/29/2014 | 09/05/2014 |
Table 2.
Crop reference evapotranspiration (ETo) based on California Irrigation Management Information System (CIMIS) and local data, precipitation (P) and applied water (I) and change in soil water content (∆SW) data from harvest the previous year to bud break the current year and the growing season bud break to harvest in the current year and percentage of reduction (Red) in applied water compared to grower practice (GI) at Fiesta raisin project in Caruthers, CA. Grower Irrigation (GI) weekly beginning at bud break until cane cutting, halt until harvest then resume weekly until end of October, Sustained deficit (SD)—sustained deficit equal to 80% of GI, and Regulated deficit (RD)—50% of GI until fruit set, increased to 80% of GI, decreased to 50% of GI after harvest. Crop water use (ETc) is sum of rainfall and irrigation and change in soil water.
| Year | Treatment | Harvest—Bud Break (mm) | Growing Season (mm) | % Red | |||||||
|---|---|---|---|---|---|---|---|---|---|---|---|
| P | I | I + P | ETo | P | I | I + P | ∆SW | ETc | |||
| 2012 | GI | 140 | 48.8 | 188.8 | 1345.6 | 183.5 | 641.2 | 824.7 | 246.8 | 1071.5 | - |
| SD | 46.9 | 186.9 | 609.8 | 793.3 | 230.0 | 1023.3 | 5 | ||||
| RD | 52.2 | 192.2 | 624.5 | 808.0 | 144.2 | 952.2 | 11 | ||||
| 2013 | GI | 96.3 | 172.5 | 268.8 | 1383.4 | 3.1 | 438.8 | 441.9 | 160.8 | 602.7 | - |
| SD | 109.0 | 205.3 | 301.4 | 304.5 | 194.6 | 449.1 | 25 | ||||
| RD | 125.2 | 224.6 | 360.9 | 364.0 | 167.9 | 528.8 | 12 | ||||
| 2014 | GI | 65.6 | 160.1 | 225.7 | 1270.6 | 10.2 | 460.7 | 470.9 | 60.0 | 530.9 | - |
| SD | 78.8 | 144.4 | 468.7 | 478.9 | 75.4 | 554.3 | 4 | ||||
| RD | 82.1 | 147.7 | 348.3 | 358.5 | 66.6 | 426.1 | 20 | ||||
Table 3.
Stress integral in megapascal a day (MPa * Day) for grower irrigation (GI), sustained deficit (SD) and regulated deficit (RD) irrigation treatments in Fiesta raisin grape deficit irrigation study for the period from April to August at the Caruthers, CA. field site.
Table 3.
Stress integral in megapascal a day (MPa * Day) for grower irrigation (GI), sustained deficit (SD) and regulated deficit (RD) irrigation treatments in Fiesta raisin grape deficit irrigation study for the period from April to August at the Caruthers, CA. field site.
| Irrigation Treatment | Stress Integral (MPa*Day) (April–August) | ||
|---|---|---|---|
| 2012 | 2013 | 2014 | |
| GI | 45.3 | 30.1 | 13.5 |
| SD | 41.6 | 32.0 | 45.6 |
| RD | 43.2 | 45.6 | 45.6 |
Table 4.
Summary of the yield and quality components of the fiesta table grapes grown in Caruthers California. Water Productivity (WP) was calculated as kilogram of fruit/ha per mm of applied water for the grower irrigation (GI), sustained deficit (SD) and regulated deficit (RD) irrigation treatments. Moisture remaining in the fruit is given as % Moisture. Raisin grades include A, B and C and raisins graded C are considered Substandard and B or Better include both grades A and B (See Materials and Methods for Definition of Grades).
| Year | Treatment | Clusters vine−1 | Cluster Weight (g) | Yield (kg vine−1) | Yield (t ha−1) | WP (kg ha−1 mm−1) | % Moisture | % Substandard | % B or Better |
|---|---|---|---|---|---|---|---|---|---|
| 2012 | GI | nd | nd | 5.92 | 7.58 | 11.8 | 12.2 | 9.6 a | 60.5 |
| SD | nd | nd | 6.34 | 8.11 | 13.3 | 11.3 | 16.0 b | 49.2 | |
| RD | nd | nd | 6.35 | 8.13 | 13.0 | 12.5 | 12.3 ab | 50.7 | |
| 2013 | GI | 44.5 a | 137 | 6.02 | 7.71 | 17.5 a | 14.6 | 3.8 | 83.6 |
| SD | 42.4 a | 156 | 7.31 | 9.36 | 31.0 b | 13.3 | 3.7 | 82.3 | |
| RD | 52.4 b | 150 | 8.01 | 10.25 | 28.4 b | 13.5 | 3.4 | 86.3 | |
| 2014 | GI | 27.9 a | 271 b | 10.14 | 12.97 | 28.1 ab | 10.5 | 3.3 | 77.9 |
| SD | 37.6 b | 155 a | 8.3 | 10.63 | 22.6 a | 10.5 | 3.7 | 71.6 | |
| RD | 33.5 ab | 211 ab | 9.24 | 11.83 | 33.9 b | 11.2 | 3.7 | 76.6 |
Values for each year and parameter followed by different letters are significantly different by Tukey’s HDS (p ≤ 0.05). nd—Data not collected.
© 2018 by the authors. Licensee MDPI, Basel, Switzerland. This article is an open access article distributed under the terms and conditions of the Creative Commons Attribution (CC BY) license (http://creativecommons.org/licenses/by/4.0/).
Share and Cite
MDPI and ACS Style
Abrisqueta, I.; Ayars, J.E. Effect of Alternative Irrigation Strategies on Yield and Quality of Fiesta Raisin Grapes Grown in California. Water 2018, 10, 583. https://doi.org/10.3390/w10050583
AMA Style
Abrisqueta I, Ayars JE. Effect of Alternative Irrigation Strategies on Yield and Quality of Fiesta Raisin Grapes Grown in California. Water. 2018; 10(5):583. https://doi.org/10.3390/w10050583
Chicago/Turabian StyleAbrisqueta, Isabel, and James E. Ayars. 2018. "Effect of Alternative Irrigation Strategies on Yield and Quality of Fiesta Raisin Grapes Grown in California" Water 10, no. 5: 583. https://doi.org/10.3390/w10050583
Note that from the first issue of 2016, this journal uses article numbers instead of page numbers. See further details here.