Article

Spatial Variation in Trophic Structure of Dominant Fish Species in Lake Dongting, China during Dry Season

1
College of Fisheries, Huazhong Agricultural University, Wuhan 430070, China
2
Donghu Experimental Station of Lake Ecosystems, State Key Laboratory of Freshwater Ecology and Biotechnology, Institute of Hydrobiology, Chinese Academy of Sciences, Wuhan 430072, China
3
School of Life Sciences, Nanchang University, Nanchang 330031, China
4
Current address: Collaborative Innovation Center for Efficient and Health Production of Fisheries in Hunan Province, Key Laboratory of Health Aquaculture and Product Processing in Dongting Lake Area of Hunan Province, Hunan University of Arts and Science, Changde 415000, China
5
Current address: IDG/McGovern Institute for Brain Research at Tsinghua, School of Life Science, Tsinghua University, Beijing 100084, China
*
Authors to whom correspondence should be addressed.
Water 2018, 10(5), 602; https://doi.org/10.3390/w10050602
Submission received: 24 February 2018 / Revised: 7 April 2018 / Accepted: 25 April 2018 / Published: 5 May 2018
(This article belongs to the Section Water Quality and Contamination)

Abstract

:
Understanding trophic interactions in food webs is crucial to revealing the transfer of substances and energy from primary food sources to consumers in aquatic ecosystems. We hypothesize that the trophic structure of consumers can be significantly affected by primary food sources (pelagic, benthic, and littoral sources) through complex trophic interactions. This study used stable isotope analysis and Bayesian mixing models to estimate the trophic levels of fish consumers and the contributions of primary food sources in the three sub-lakes (Eastern, Southern, and Western Dongting) of Lake Dongting, which have different physical and chemical parameters of water, fish species diversity, and plankton (phytoplankton and zooplankton) density. Results showed the differences in community structures of fish among sub-lakes. Fish trophic levels were significantly higher in Eastern Dongting than those in the two other areas. The contributions of primary food sources to fishes were as follows: the pelagic source was the main basal food source in Eastern Dongting, and littoral and pelagic sources played equally essential roles in Southern Dongting; fishes in Western Dongting relied on more benthic source to growth than those in the two other regions. This study can fill gaps in our knowledge of the influence of the underlying food available on trophic structure of consumers by exploring the role of primary food sources and making the trophic structure of consumers in the aquatic food web highly complicated and diverse through control of the distribution of primary food sources.

1. Introduction

Energy flow from primary sources to aquatic consumers is crucial to understanding the function of lake ecosystems [1]. Previous studies showed that the primary food sources of water ecosystems are considered mainly pelagic, benthic and littoral [1,2,3,4]. Their energy flow processes can be associated with a variety of approaches [5,6,7], including cross-habitat foraging by fishes [8] and consumption by omnivorous organisms [9]. The energy of carnivorous consumers is often largely obtained from primary consumers whose energy depends on primary food sources, thereby linking the consumers and food sources in food webs [10]. Nevertheless, how primary food sources affect the trophic relationship of consumers is unclear [9]. The food web structure and trophic structure of consumers are expected to change with variation in food sources [11]. Trophic interaction can be explored by constructing food webs and analyzing the contribution of primary food sources to consumers.
Ecologists have long been interested in trophic interactions, particularly the factors constraining the transfer of energy from primary food sources to consumers [12,13]. Nonetheless, the relationship between primary food sources and consumers is still complicated. The trophic level provides an integrated view of intricate interactions in food webs [14]. Studies have been undertaken on the trophic structure and trophic interactions in marine [14,15,16] and freshwater ecosystems [17,18]. In freshwater ecosystems, de Bernardi and Giussani [19] suggested that the trophic structures of consumers are probably determined on the basis of available food. Another study indicated that the trophic structures of consumers are associated with the dietary composition and food source distributions [20]. Hence, the present study aimed to understand how primary food sources affect the trophic structure of consumers.
The ratios of stable carbon (δ13C) and nitrogen (δ15N) isotopes have been applied extensively to examine aquatic food webs [21,22,23]. These ratios can reveal the spatial variation in fish trophic level [24] and determine the contribution of food sources to consumers [25]. Most of the preceding studies showed the remarkable difference in the trophic levels of the same species in different lakes [8,9,21], but scarcely any study focused on this difference in a large floodplain lake, which presents environmental heterogeneity. Lake Dongting is the second largest freshwater lake in China at 2540 km2 [26,27]. Given its severe silting and geographic interruption, the lake is divided into three major sub-lakes: Eastern (1300 km2), Southern (900 km2), and Western (340 km2) Dongting [27,28,29,30], as indicated in Figure 1. Previous studies showed that the fish diversity and plankton (phytoplankton and zooplankton) density are different in these three areas of Lake Dongting [27,30,31]. The major interruption among the regions occurs at the low water stage, especially during the sampling period [29]; during that time, fish exhibit rare inter-regional movement. Inevitably, the complex ecological processes result in space variation in the fish community structure in different sub-lakes [27,31]. Consumer tissues, such as muscle, can integrate and indicate the stable isotopic signal of food sources after a period of days to months [32]. Therefore, the present study selected the dry season, which can provide consumers with sufficient time to integrate and reflect the signal of food sources in their respective habitats. Subsequently, comprehensive investigations on the trophic structure of consumers in different spatial areas were carried out in Lake Dongting.
The aim of this study is to examine the differences in the trophic levels of fish species in the three areas of Lake Dongting. We hypothesized that the trophic structure of consumers are largely affected by primary food sources through complex trophic interactions. We also explored the role of primary food sources and hoped to make the trophic structure of consumers highly complicated and diverse by controlling the distribution of food sources.

2. Materials and Methods
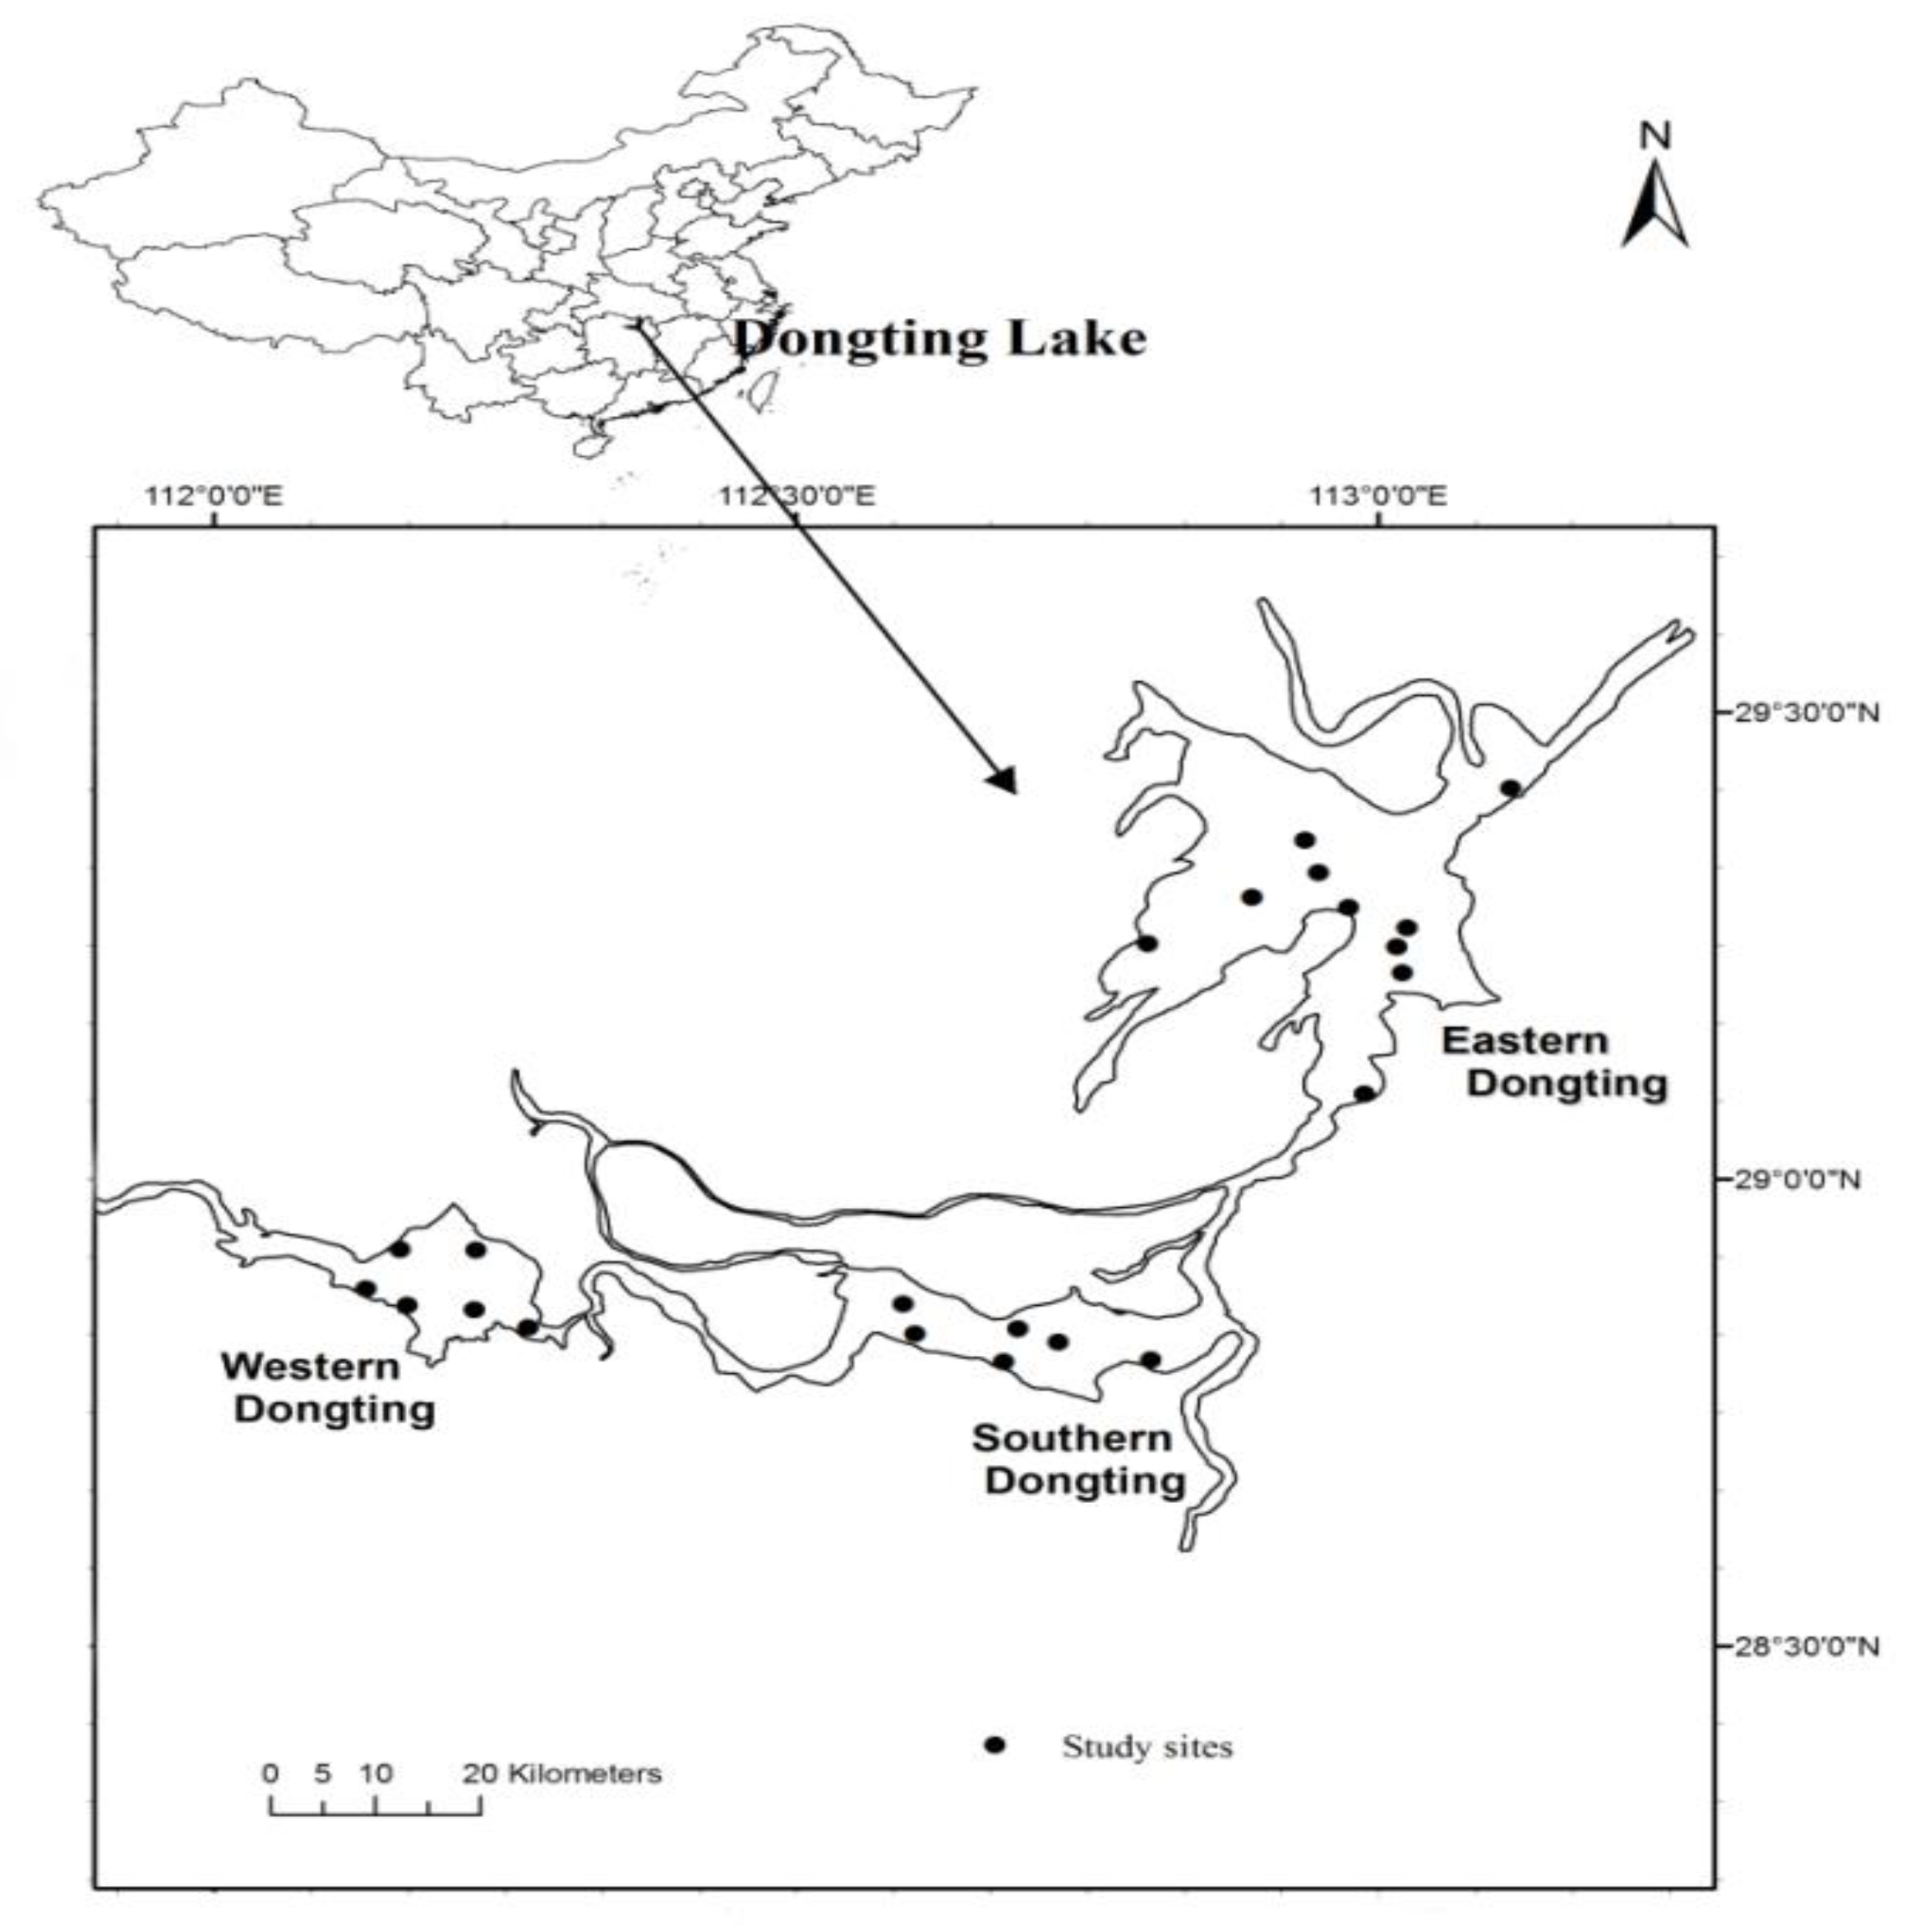
2.1. Study Area

Lake Dongting is situated in the middle reach of the Yangtze River Basin [28,33] (Figure 1). This area connects to the Yangtze River. Hence, Lake Dongting is crucial to the biodiversity conservation of Yangtze floodplain ecosystems, and it serves as an important nursery and feeding ground for numerous fish species [31]. Each area displays different physical and chemical parameters of the water and distributions of primary food sources. Eastern Dongting presents a higher phytoplankton density (pelagic sources) than those of the two other areas (Table 1). The faster flow of water and the more severe sedimentation in Western Dongting provide benefits to benthic algae (benthic sources) [27]. And more littoral sources were found in Southern Dongting because of large-scale poplar cultivation [34].

2.2. Sample Processing and Treatment

Sampling was carried out from November to December in 2013. Ten sampling sites in Eastern Dongting and six sampling sites each in Southern and Western Dongting were evenly distributed (Figure 1). Samples were collected monthly from each sampling site. All samples collected from the same sub-lake were used as sample replicates. Water samples were collected at 0.5 m below the surface (upper part) and mixed with that from 0.5 m above the sediment surface (lower part) using a 5L Schindler sampler. Water temperature (T), oxidation–reduction potential (ORP), and water depth were measured by the multiparameter water quality meter YSI Pro Plus (Yellow Springs, OH, USA) at 0.5 m below the water surface in situ. Physical and chemical parameters and biotic samples were treated according to the methods described by Huang et al. [35].
Total nitrogen (TN), total phosphorus, ammonium nitrogen (NH4-N), and nitrate nitrogen (NO3-N) were measured for each water sample in the laboratory according to the methods described in detail by Huang et al. [35]. Water sample (1 L) was preserved in acetic Lugol’s solution and concentrated to 50 mL after sedimentation for 48 h for phytoplankton identification [35]. Phytoplankton were counted and measured under 400× magnification by using an Olympus BX41 microscope (Olympus, Tokyo, Japan). Taxonomic identification of phytoplankton was performed according to the method of Hu and Wei [36]. With regard to crustacean zooplankton, 10 L of water samples were sieved through 64 m plankton nets and preserved with 5% formalin for further analysis [35]. Zooplankton were counted and measured under 40× magnification by using an Olympus CX21 microscope (Olympus, Tokyo, Japan) and identified according to the methods of Chiang and Du [37] and Shen [38]. The density of each plankton species was calculated using the methods described by Huang et al. [35].
Fish samples were obtained from November to December in 2013 in the three sub-lakes of Lake Dongting (Figure 1). Fish species were sampled by local fishermen who were fishing adjacent to the site with gill and seine nets of the same mesh size during sample collection. The number and weight of fish species and types of fishing gears were also recorded. Unidentified fish species were photographed, placed into the anhydrous ethanol solution, and brought to the laboratory for further identification. A total of 43 fish species were found in the three sub-lakes. Nine economical and dominant fish species, i.e., Ctenopharynodon idellus, Parabramis pekinensis, Hypophthalmichthys molitrix, Aristichthys nobilis, Acheilognathus macropterus, Carassius auratus, Cyprinus carpio, Cultrichthys erythropterus and Siniperca chuatsi, were selected from each sub-lake. Nine replicates of each fish species were collected randomly at each region. Thus, food webs were constructed, and trophic levels were calculated using these nine species. White muscle (dorsal muscle) was removed and collected from fish individually [1,39]. These muscle samples were placed in refrigerators at −20 °C until the treatment for isotopic analyses.
Primary food sources were also collected from each sub-lake. Particulate organic matter was considered a pelagic source and collected after filtering water samples through glass microfiber filters (Whatman GF/C) [17]. Moreover, benthic sources, which were regarded as attached algae [40], were collected from stones and aquatic plant leaves. Littoral sources, which were regarded as aquatic plants or terrestrial plants [1], were also collected from each sub-lake. We also collected freshwater snails (Bellamya aeruginosa) to analyze the trophic levels of consumers in Lake Dongting. Samples for isotopic analyses were immediately treated when samples were brought back to the laboratory.
All samples, which were used for isotopic analyses, i.e., white muscles and food sources sampled from study sites, were rinsed with distilled water and subsequently dried to a constant weight in an oven at 60 °C for at least 48 h [1]. Samples were ground into homogeneous fine powder by mortars and pestles. The powdered samples were kept in Eppendorf tubes and sealed in desiccators with silica gel for later analyses [17].

2.3. Stable Isotope Analyses

Stable C and N isotope ratios were analyzed with a Delta Plus (Finnigan, Bremen, Germany) continuous-flow isotope ratio mass spectrometer directly coupled to a NA2500 elemental analyzer (Carlo Erba Reagenti, Milan, Italy). Stable isotope ratios were expressed in delta (δ) notation in parts per thousand (‰) deviation from the international standards, according to the following equation: δX (‰) = [(Rsample/Rstandard) − 1] × 1000, where X is the corresponding ratio to 15N/14N or 13C/12C, R is 15N or 13C, and δ is the measure of heavy to light isotope in the sample. The standards used for carbon and nitrogen isotopes were the Vienna Pee Dee belemnite and atmospheric nitrogen, respectively. Urea was used as an internal working standard (δ15N = −1.53% and δ13C = −49.44%) for daily analysis. Two standards were run after every 10 samples to correct the instrumental drift during analysis. The deviations in the analysis of δ13C and δ15N replicates were both at 0.3‰.

2.4. Modeling Trophic Levels

Snails are commonly used to estimate the trophic level of consumers because they are a long-lived primary consumer, which is a more accurate parameter than primary productivity to calculate the trophic level [1,17].
Trophic level was calculated as follows:
Trophic level = λ + [δ15Nfish − (δ15Nsnail)]/3.4,
where 3.4 is a generally assumed per trophic level enrichment of δ15N [1,41]. λ = 2, which is used for primary consumers, is the baseline. δ15Nfish and δ15Nsnail represent the mean δ15N of the fish and snail, respectively [1].

2.5. Bayesian Mixing Model

Fish diet is considerably complex in freshwater ecosystem. Therefore, we selected the basic and feasible primary food sources to analyze their diet pattern. The contribution of the three types of primary food sources (pelagic, benthic and littoral) to consumers was estimated using Bayesian mixing models, which were implemented in the Stable Isotope Analysis in R package [42]. The trophic enrichment factors were 3.4 ± 1.0‰ and 0.4 ± 1.3‰ for δ15N and δ13C [1], respectively, to account for trophic fractionation.

2.6. Statistical Analyses

To analyze the differences in stable isotope values between sub-lakes and species, multivariate analysis of variance (MANOVA) was used to compare multivariate variance (δ15N and δ13C) among sub-lakes and species. Furthermore, the physical and chemical parameters, zooplankton and phytoplankton density, trophic levels of consumers, and contribution proportions of primary food sources in different sub-lakes were analyzed with one-way analysis of variance (ANOVA). The statistical analyses were conducted using IBM SPSS Statistics (Version 20.0). Procrustes analysis by vegan package in R [43] was used to analyse the effect of fish community structures and large proportion native species (Carassius auratus and Cyprinus carpio) on stable isotopic results. All statistically significant values were considered at p < 0.05.

3. Results

3.1. Limnological Parameters and Fish Community Structure

Differences in water quality and densities of plankton were observed in the three study areas of Lake Dongting (Table 1). Results revealed the large spatial heterogeneity of this lake. Limnological parameters, including water temperature, ORP, water depth, TN, NO3-N, and NH4-N, showed significant differences in Eastern Dongting (Table 1) compared with those in Southern and Western Dongting; in particular, the TN in Eastern Dongting (mean: 1.98 ± 0.14) was higher (one-way ANOVA, F = 9.71, p < 0.01) than that in Southern Dongting (mean: 1.44 ± 0.11). The NO3-N in Eastern Dongting (mean: 1.24 ± 0.15) was also considerably higher than those in Southern (mean: 0.64 ± 0.12) and Western (mean: 0.74 ± 0.20) areas (one-way ANOVA, F = 12.01, p < 0.01). Moreover, the density of phyplankton in Eastern Dongting was tenfold higher than those in the two other areas (one-way ANOVA, F = 6.11, p < 0.05).
A total of 43 fish species were surveyed in Lake Dongting. Nine dominant fish species, i.e., C. idellus, P. pekinensis, H. molitrix, A. nobilis, A. macropterus, C. auratus, C. carpio, C. erythropterus, and S. chuatsi, were the important economic fish species. These species also represented different fish trophic status in food web such as herbivorous, planktivorous, omnivorous and carnivorous fish, which can represent the main consumer in a food web. The weight percentages of fish catch of these nine fish species were approximately 75.31%, 80.9%, and 84.24% in Eastern, Southern, and Western Dongting, respectively (Figure 2, Table S1). Additionaly, the fish community structure differed among these three areas (Figure 2). The fish catch percentage, particularly those of C. carpio and C. auratus, varied considerably among different sub-lakes. Furthermore, Eastern Dongting showed a relatively higher percentage of fish catch than those in other sub-lakes, except for C. carpio and C. auratus. The C. carpio percentage (44.19%) in Southern Dongting was 5.8 and 3.2 times higher than those in Western and Eastern Dongting, respectively. The C. auratus percentage in Western Dongting was 55.13%, which was much higher than those in other sub-lakes (Figure 2).

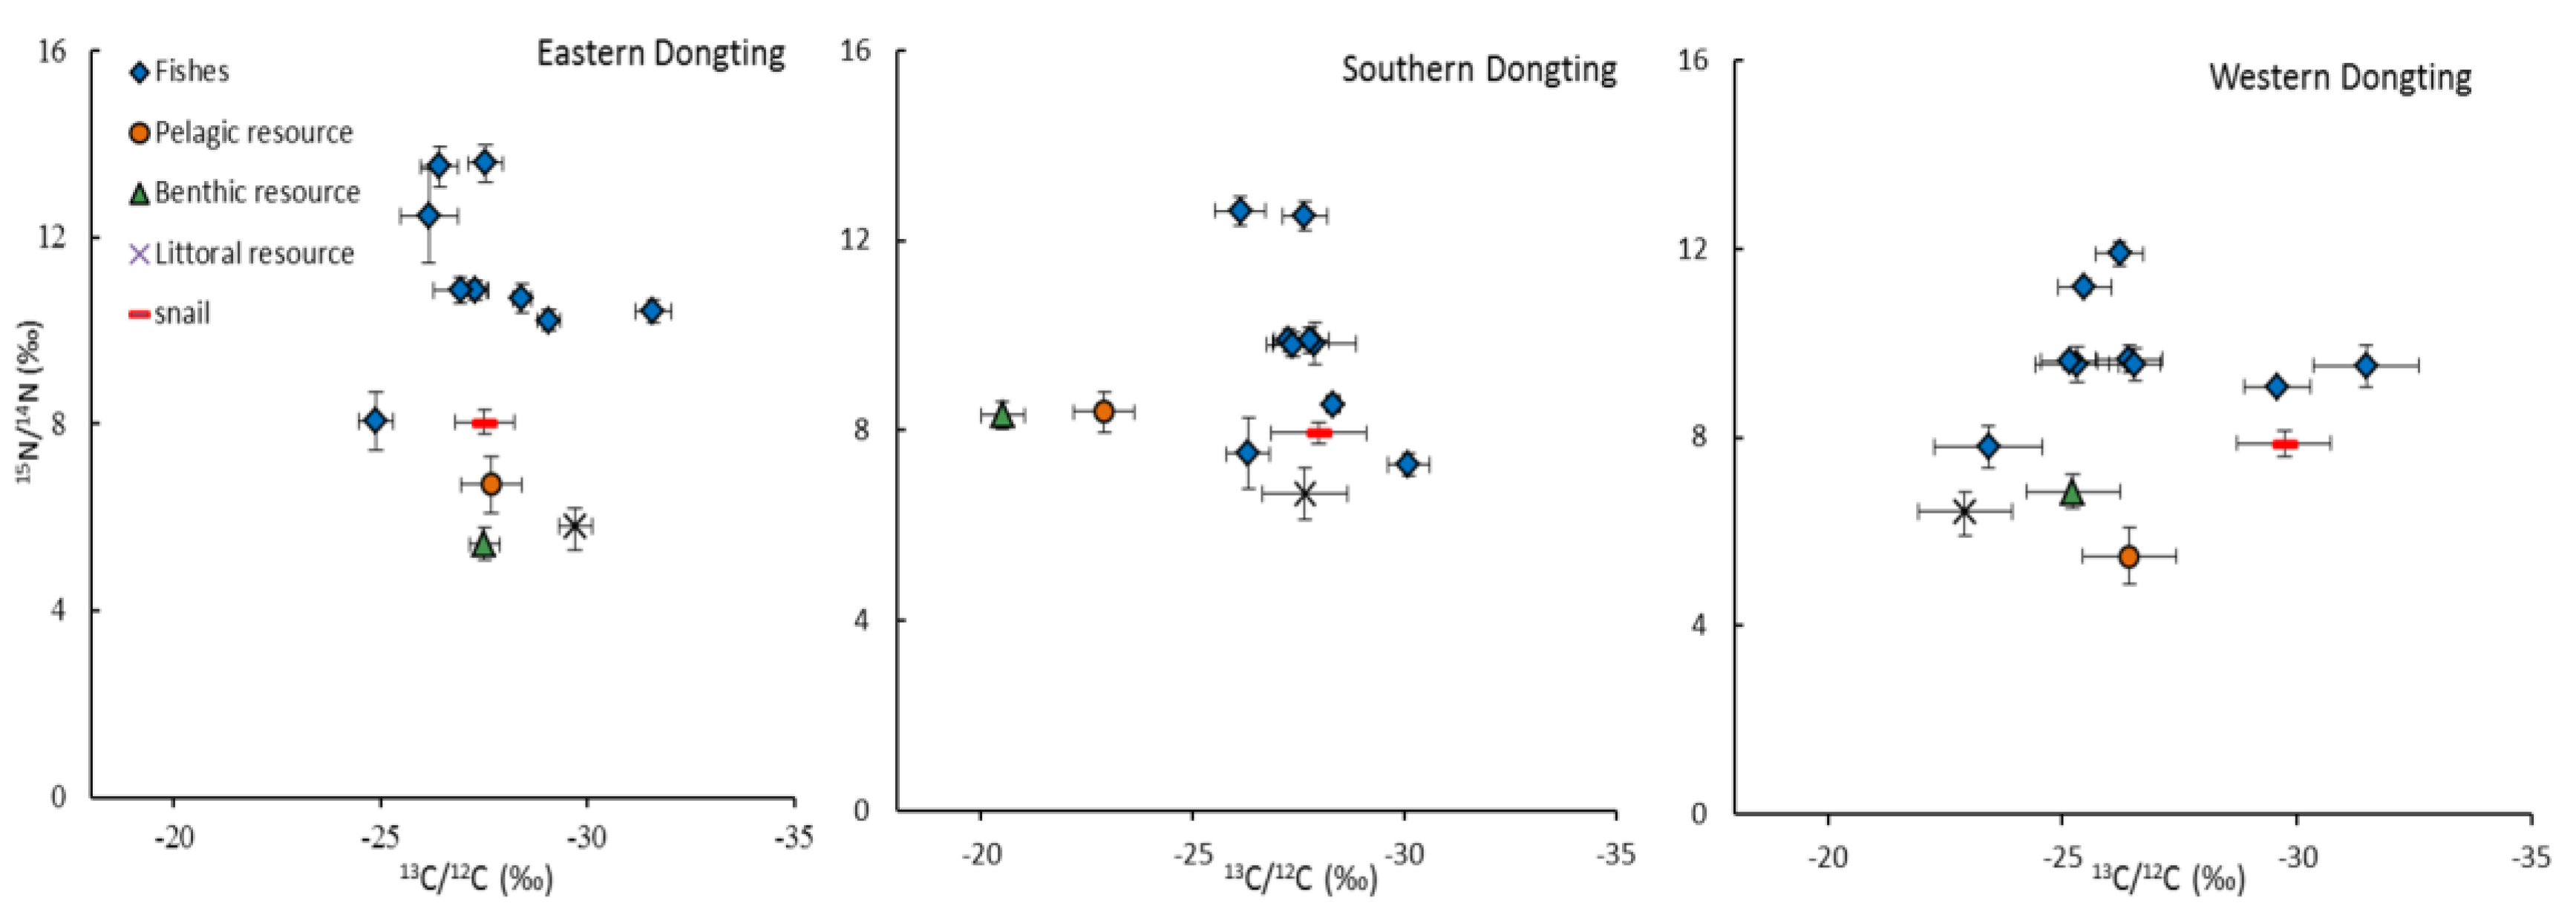
3.2. Isotopic Values

Isotope analysis exhibited that the δ13C values of fish varied from −31.64‰ to −22.94‰ in Eastern Dongting, from −30.67‰ to −23.39‰ in Southern Dongting, and from −34.12‰ to −20.31‰ in Western Dongting (Figure 3). The δ15N values were within the range of 5.43‰–16.85‰, 4.17‰–13.75‰, and 6.40‰–13.07‰ in Eastern, Southern and Western Dongting, respectively (Figure 3). The δ13C values of fishes in Western Dongting were significantly higher than those in Eastern and Southern Dongting (F = 10.27, p < 0.001). In addition, the fish δ15N values in Eastern Dongting were remarkably higher than those in the two other sub-lakes (F = 14.36, p < 0.001). Procrustes analysis also showed that for C. carpio and C. auratus even fish community structure exerted no influence on the C and N stable isotope values of nine dominant fish species (p > 0.05).

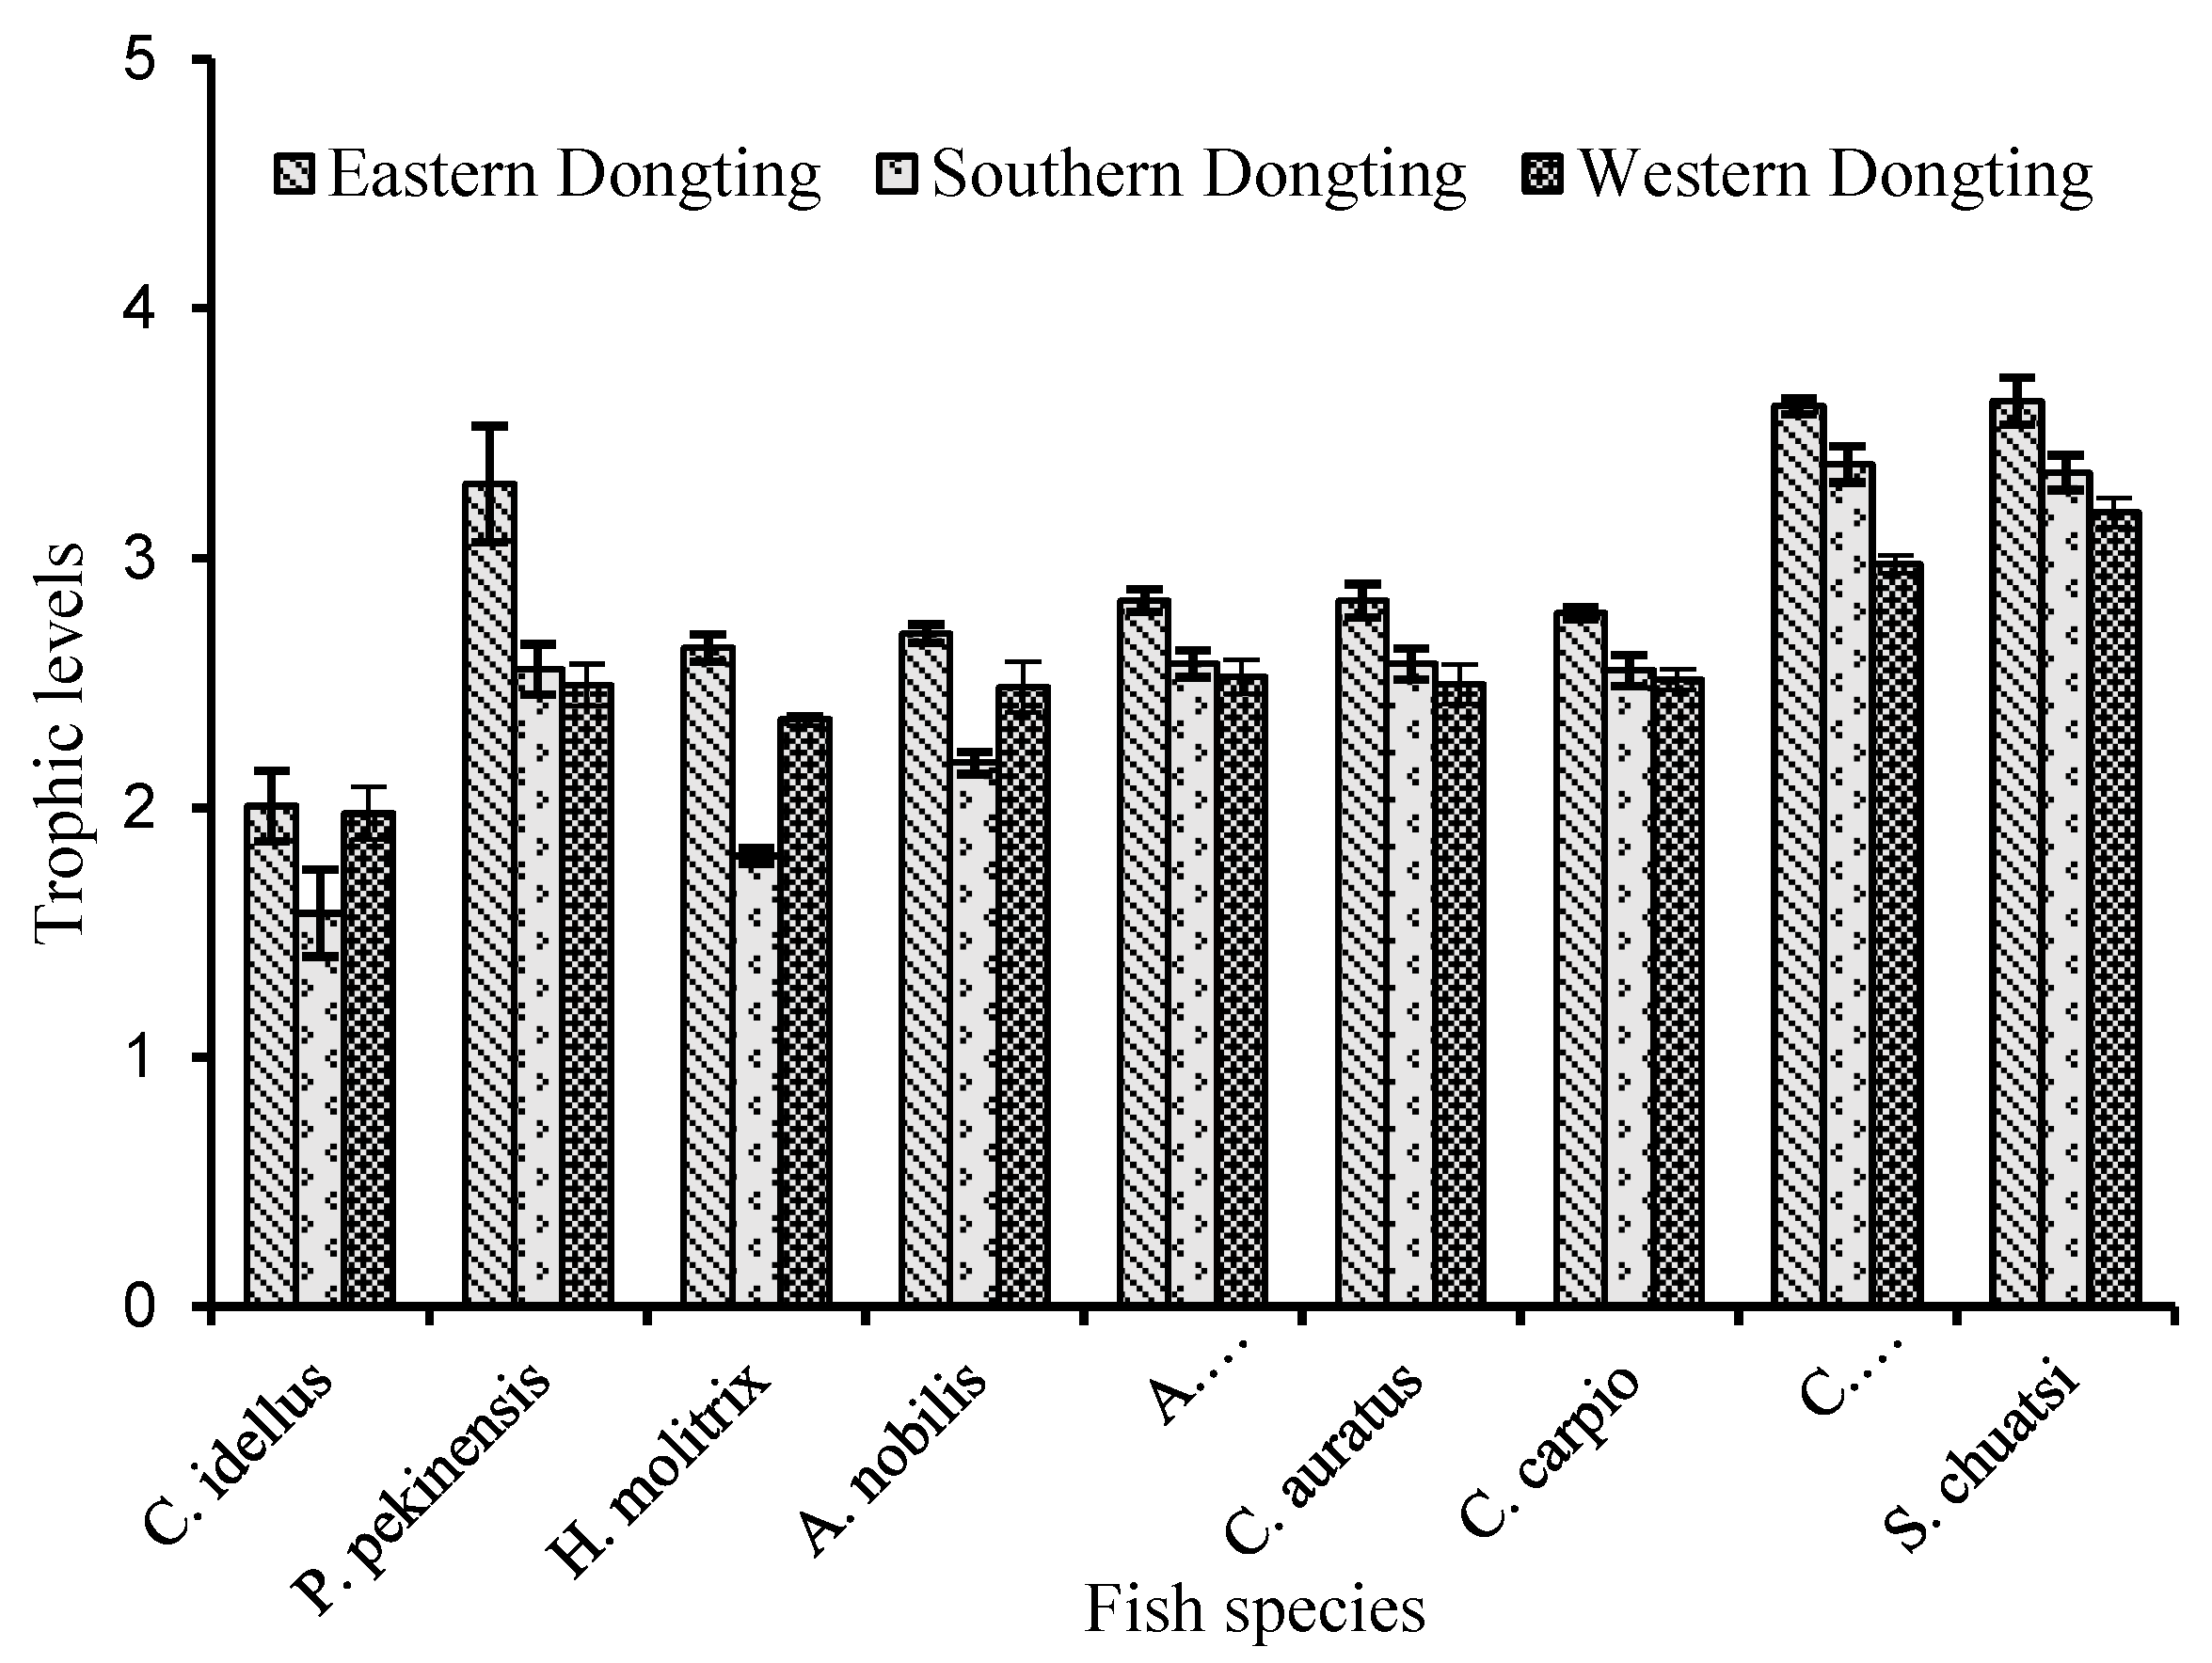
3.3. Trophic Levels of Fishes

The trophic levels of nine dominant fish species were different among the three sub-lakes (Figure 4). S. chuatsi showed the highest trophic level in Eastern Dongting, the value was 3.63 ± 0.09, which was significantly higher than those in Southern (mean: 3.34 ± 0.07) and Western Dongting (mean: 3.18 ± 0.06) (Figure 4, Table 2). The trophic levels of fish species, except that for C. idellus and A. nobilis, in Eastern Dongting were remarkably higher than those in the two other sub-lakes (Table 2). The trophic levels of H. molitrix and C. erythropterus demonstrated considerable difference between each sub-lake (one-way ANOVA, p < 0.05). The trophic levels of P. pekinensis, A. macropterus, C. auratus, C. carpio, and S. chuatsi in Western Dongting were not considerably different than those of fish species in Southern Dongting (Table 2).

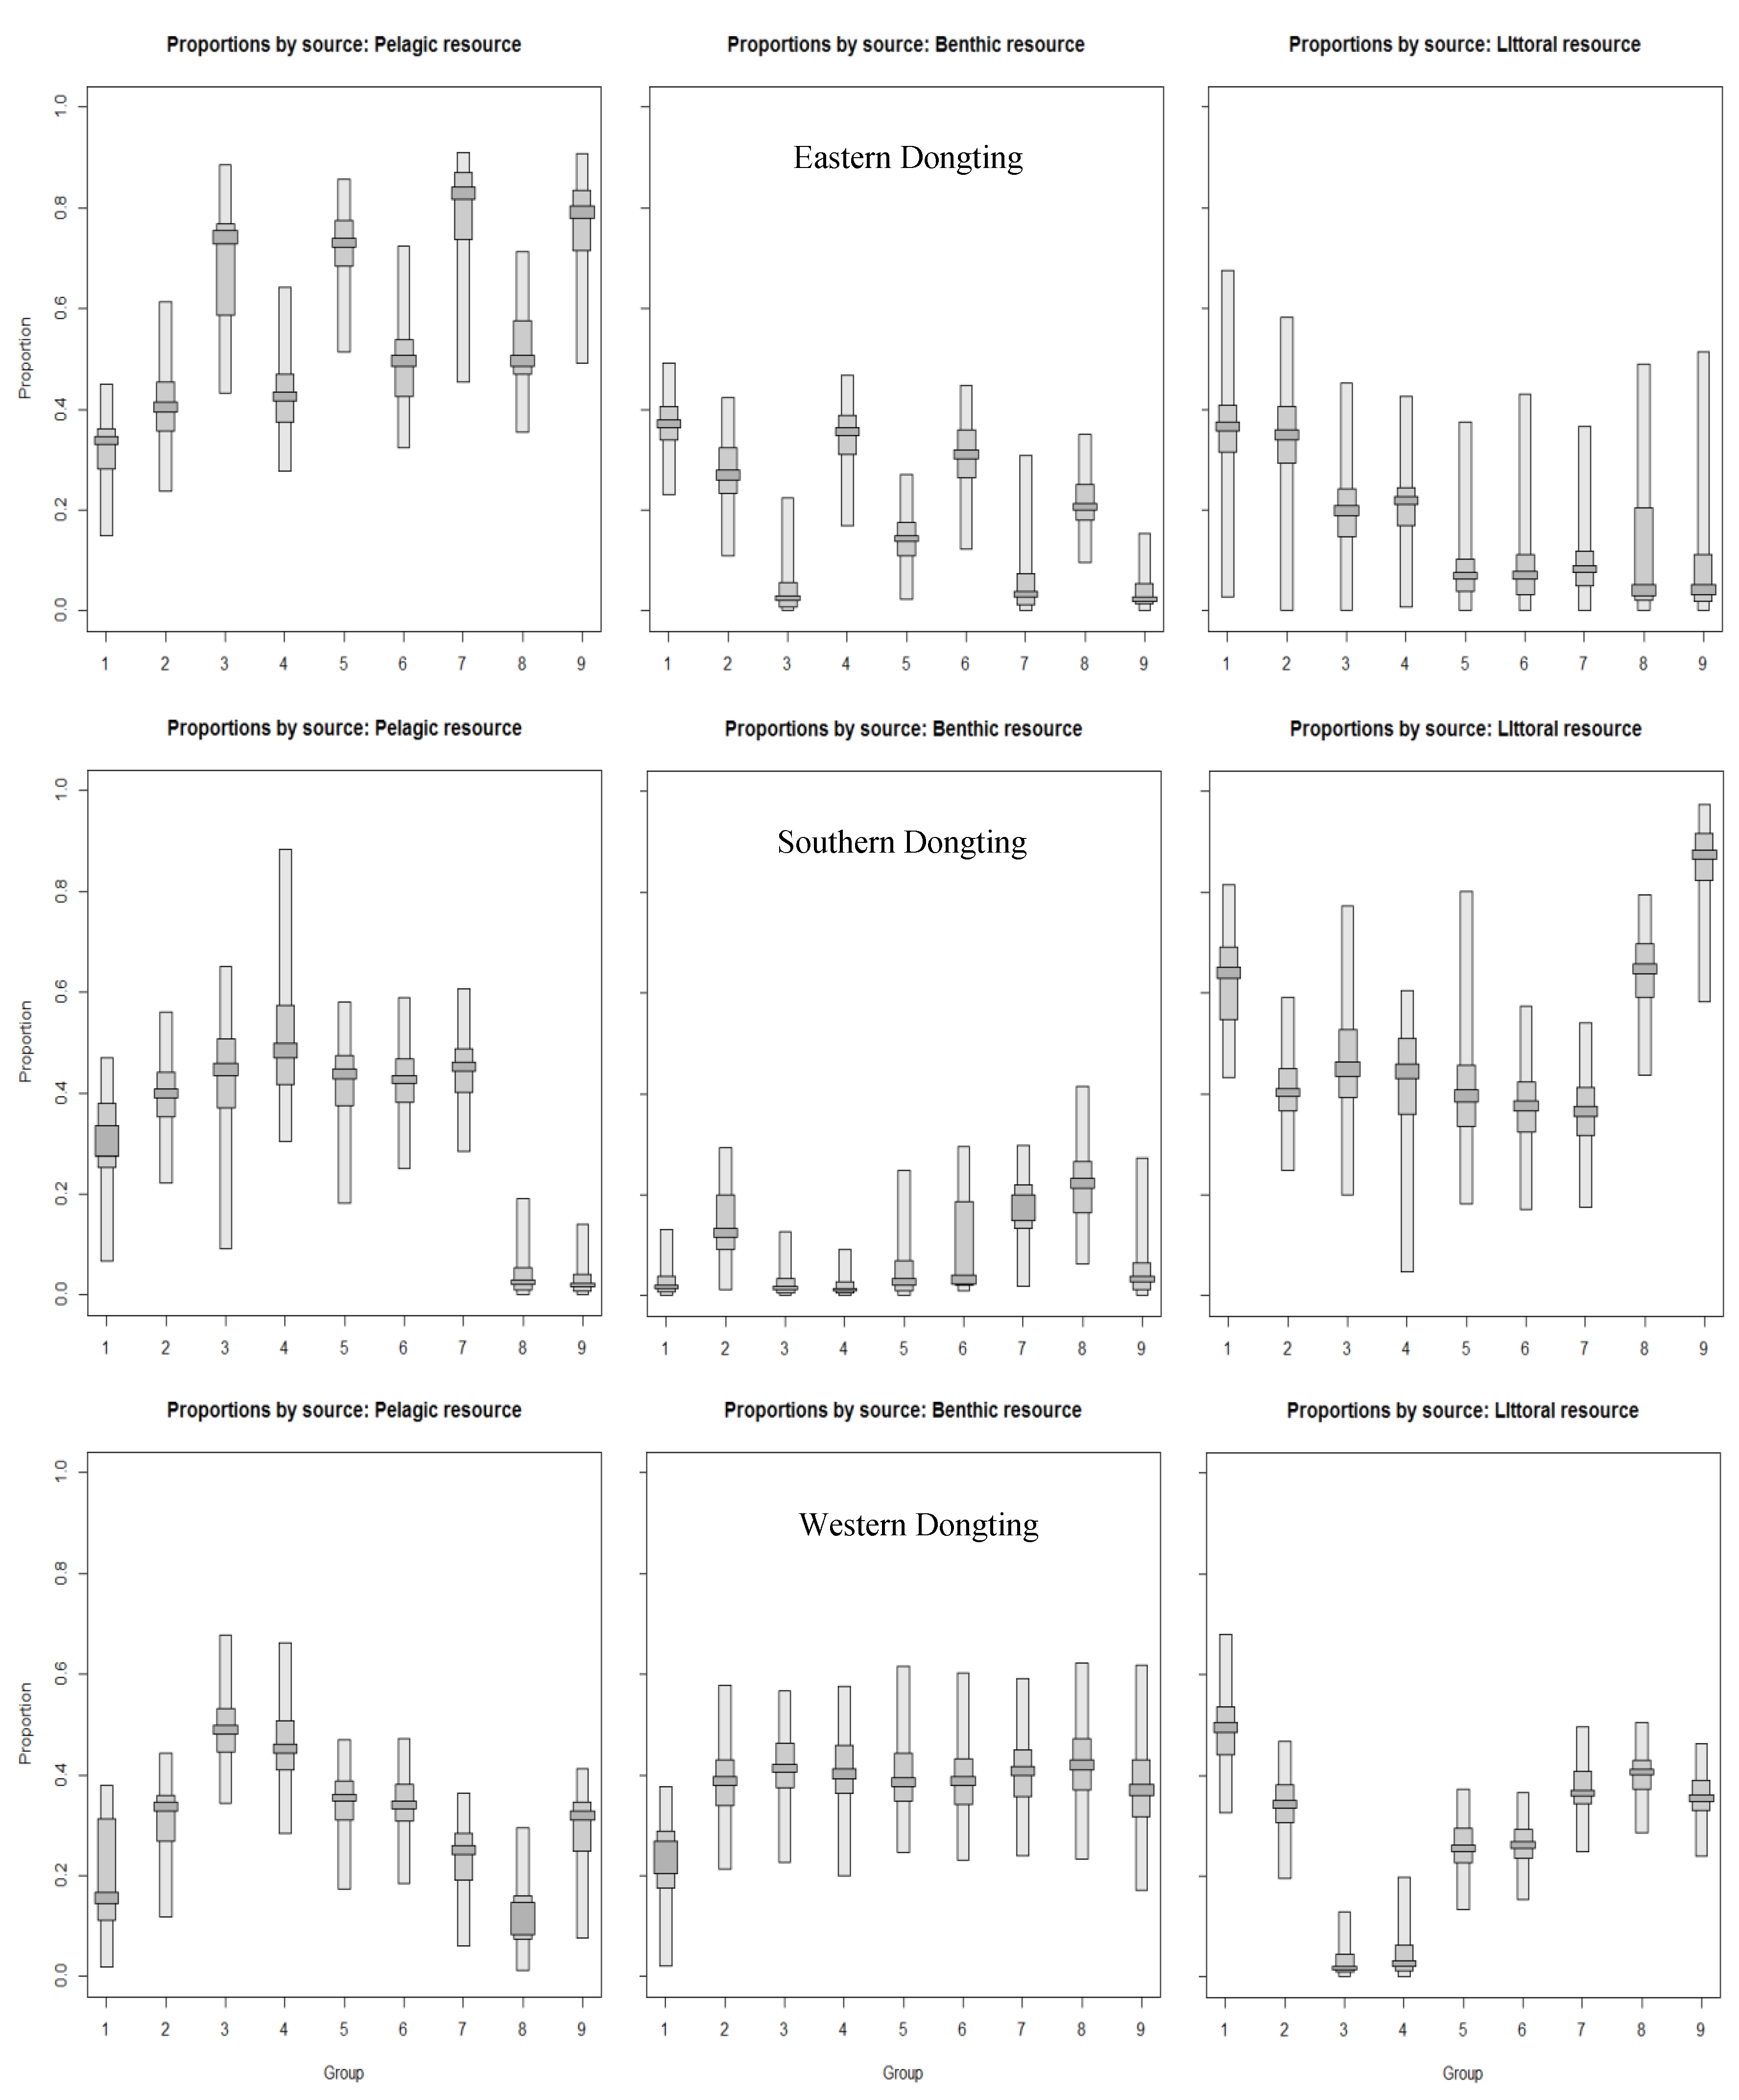
3.4. Contribution Proportions of Primary Food Sources to Fishes

The contribution proportions of pelagic sources for fish species in Eastern Dongting were more than 47.45%. Four fish species, i.e., H. molitrix, A. macropterus, C. carpio, and S. chuatsi, showed a proportion of approximately 65.11% in Eastern Dongting; this value was significantly higher than those in Southern (one-way ANOVA, p = 0.07) and Western Dongting (one-way ANOVA, p = 0.03) (Figure 5, Table 3). Littoral and pelagic sources played the same important role in Southern Dongting, with the contribution proportions ranging from 37.71% to 59.96%. The contribution proportions of littoral sources were remarkably higher in Southern Dongting than those in Eastern (one-way ANOVA, p < 0.001) and Western Dongting (one-way ANOVA, p = 0.001). However, benthic sources played a key role in providing food sources for fish in Western Dongting. The contribution proportion of benthic sources in Western Dongting was 1.69 and 2.41 times higher than those in Eastern (one-way ANOVA, p < 0.001) and Southern Dongting (one-way ANOVA, p < 0.001), respectively (Figure 5, Table 3).

4. Discussion

4.1. Spatial Differences in Fish Community and Top-Down Effects of Omnivorous Fish on Primary Food Sources

Biological community structures can be changed with distinct water habitats; these structures can also affect the shift in trophic structure of consumers [44,45]. In the present study, the spatial variation in fish community structures was observed in Lake Dongting (Figure 2). This result is supported by previous studies [31,46]. The results showed that fish species, except for C. carpio and C. auratus, in Eastern Dongting, presented relatively higher fish-catch rates than those in the two other sub-lakes (Figure 2). Fish diversity and abundance in Eastern Dongting were also higher than those in Southern and Western Dongting [46]. Furthermore, omnivorous fish, such as C. carpio and C. auratus were the native species and they account for a large percentage of the fish catch in Lake Dongting (Figure 2). Top-down effects should be taken into account because C. carpio and C. auratus can influence the nutrient dynamics and directly and indirectly affect the community structures of primary food sources [47,48,49]. Previous study also showed that omnivorous fish can increase the nutrient recycling by enhancing sediment resuspension and excreting nutrients into the water column in dissolved inorganic forms [48], thereby increasing the density of primary food sources [48]. In the present study, the fish catch rate of C. carpio and C. auratus in Eastern Dongting was lower than those in the two other regions. But TN, NO3-N and the density of phytoplankton and zooplankton in Eastern Dongting were the higher than those of the two others. In this case, water environment could be changed by anthropogenic effects [50,51,52,53]. In particular, Eastern Dongting has been affected by human activities [54], which directly and indirectly affect the diversity of primary food sources and fish trophic structure [18,55,56]. Procrustes analysis also showed that for C. carpio and C. auratus even fish community structures exerted no influence on the trophic structure of dominant fish species.

4.2. Effect of Primary Food Sources on the Trophic Structure of Fish Consumers

Consumers at high trophic level can indicate the isotopic compositions of their assimilated food [1]. The trophic level index of Lake Dongting has increased in recent years, and the same species in different environmental conditions may show diverse trophic levels [57]. Two key points were used to explain the result that trophic levels of consumers in Eastern Dongting were remarkably higher than those in the two other regions. (1) The first possible explanation is that primary producers are the basic food sources for consumers [1,2,17]. Additionally, the contributions of primary food sources to consumers will change in different water habitats [8,9,55], e.g., the contribution proportions of pelagic sources in Eastern Dongting were significantly higher than those in the two other regions (p < 0.05). Therefore, stable isotopic values and contributions of primary food sources among different trophic status habitats may affect the trophic level of consumers; (2) The second possible explanation is the baseline of δ15N values. The isotopic values of food source after assimilated diet over a period of time can be reflected in consumers [1,39]. Each food source item possesses an individual stable isotopic value [17]. In the present study, the δ15N values of pelagic source showed considerably higher baselines in Eastern Dongting than those in other sub-lakes. Results showed that TN and NO3-N were relatively high in Eastern Dongting. Yang et al. [58] illustrated Eastern Dongting was seriously eutrophic, and Fox et al. [54] also indicated there were intensive human and agricultural activities in Eastern Dongting. Previous studies showed that the δ15N values in lakes exhibited a positive correlation with physical and chemical parameters, human activities, and intensive agricultural activities in surrounding areas [59]. However, physical and chemical parameters can also be influenced by anthropogenic and agricultural activities [54,60]. Hence, we concluded that anthropogenic and agricultural activities could affect the baseline of δ15N value of primary food sources, which caused the changes of trophic structure of consumers in complex trophic interactions.

4.3. Different Contribution Proportions of Primary Food Sources

There was a significant difference in contributions of primary food sources between the three sub-lakes of Lake Dongting. The contribution proportions of pelagic source varied from 49.45% to 75.51% in Eastern Dongting, thereby suggesting that a pelagic source was the most prominent basal source assimilated by consumers in Eastern Dongting. The key role of a pelagic source for fish consumers in Eastern Dongting may be explained by the following: Firstly, different trophic strategies indicate diverse dietary patterns [20]. Secondly, anthropogenic nutrient input can affect food sources and food webs [50,55,56]. Intensive human and agricultural activities in Eastern Dongting made this region eutrophic [54,61]. Eastern Dongting can offer a large amount of pelagic sources to consumers because of its high phytoplankton density. Thirdly, high phytoplankton density reduced light penetration, which limited the growth of benthic algae (benthic source) and aquatic plant (littoral source) to some extent [40]. Nevertheless, different aquatic conditions were also observed in Southern and Western Dongting. Faster-flowing water and the more severe sedimentation were observed in Western Dongting [27]. Faster-flowing water and sedimentation cause the benthic source, especially attached algae, to grow faster [62], but phytoplankton cannot replicate quickly in fast-flowing water. The benthic source may be utilized by consumers when Western Dongting has a low density of phytoplankton (pelagic source). Therefore, the benthic source, together with two other primary food sources (benthic and littoral source), was important in Western Dongting. Southern Dongting is surrounded with large-scale poplar cultivation [34], and this offered a large amount of leaves to the littoral zone. This condition might be the main reason that led to a higher contribution of littoral source in Southern Dongting. These results indicated that the different contribution proportions of primary food sources to consumers are largely affected by underlying food availability in complex trophic interactions. Thus, bottom-up control should be applied by changing the distribution of primary food sources in the lake, such as changing the density and biomass of phytoplankton, periphyton, and aquatic plants [17] or controlling the density of nutrients [63] to adjust the growth of primary food sources [9]; these changes cannot only increase the available supply of a food source for consumers but also make the trophic structure of consumers in an aquatic food web highly complicated and diverse. Top-down control should also be taken into account because it can affect the diversity and structure of primary food sources [47,48,49]. A higher diversity of the predator results in a stronger top-down control, whereas more diverse primary food sources might be less vulnerable to predation [64], which could contribute to the stability and the resilience of food web [65].

5. Conclusions

This study showed that there were differences in fish community structures among three sub-lakes of Lake Dongting. Results indicated that primary food sources can affect the trophic structures of fish species. Consumers can not only change their diet strategies to respond to the complex spatial variation of the environment in lake, but also select a relative abundance of food sources. This observation can explain the different contributions of primary food sources to the trophic structure of consumers and why underlying food availability changes the trophic levels of consumers. Bottom-up control should be applied by changing the distribution of primary food sources in the lake, which can increase the available supply of food sources for consumers and make the trophic level of consumers in the aquatic food web highly complicated and diverse. Top-down control should also be applied to change the diversity of primary food sources. A higher diversity of the predator results in a stronger top-down control, whereas more diverse primary food sources might be less vulnerable to predation, which could contribute to the stability and resilience of the food web. Further information about the effects of primary food sources on trophic dynamics should also be obtained to explore the mechanisms underlying complex trophic interactions.

Supplementary Materials

The following are available online at https://www.mdpi.com/2073-4441/10/5/602/s1, Table S1: Weight and percentage of fish catch in the three sub-lakes.

Author Contributions

Longgen Guo, Ping Xie, Jun Xu and Jia Yu conceived and designed the work plan; Jia Yu and Huan Zhang wrote the paper; Huaming Hu, Ting Xue and Jia Yu collected the samples; Congqiang Luo and Chunlong Yi helped with sample measurements; Yufei Hu and Kaluwa Handi Wasana Lalanthi De Silva revised the grammar of this manuscript. All authors have made contributions to this work.

Acknowledgments

This work was supported by the National Key Research and Development Program of China (Grant number: 2017YFA0605201), the State Key Laboratory of Freshwater Ecology and Biotechnology (Grant number: 2016FBZ08) and the Evolution of the Water Environment of Dongting Lake and Risk Control Integration of Algal Bloom (Grant number: Y53Z051201). We also thank the anonymous reviewers for providing valuable comments on the manuscript. We appreciate the helpful suggestions of Dr. Liang Chen and Dr. Haojie Su for the final draft of this manuscript.

Conflicts of Interest

The authors declare no conflict of interest.

References

  1. Post, D.M. Using stable isotopes to estimate trophic position: Models, methods, and assumptions. Ecology 2002, 83, 703–718. [Google Scholar] [CrossRef]
  2. Karlsson, J.; Jansson, M.; Jonsson, A. Similar relationships between pelagic primary and bacterial production in clear water and humic lakes. Ecology 2002, 83, 2902–2910. [Google Scholar] [CrossRef]
  3. Vadeboncoeur, Y.; Lodge, D.M. Periphyton production on wood and sediment: Substratum-specific response to laboratory and whole-lake nutrient manipulations. J. N. Am. Benthol. Soc. 2000, 19, 68–81. [Google Scholar] [CrossRef]
  4. Vadeboncoeur, Y.; Lodge, D.M.; Carpenter, S.R. Whole-lake fertilization effects on distribution of primary production between benthic and pelagic habitats. Ecology 2001, 82, 1065–1077. [Google Scholar] [CrossRef]
  5. Blumenshine, S.C.; Vadeboncoeur, Y.D.; Lodge, M.; Cottingham, K.L.; Knight, S.E. Benthic-pelagic links: Responses of benthos to water-column nutrient enrichment. J. N. Am. Benthol. Soc. 1997, 16, 466–479. [Google Scholar] [CrossRef]
  6. Schindler, D.E.; Scheuerell, M.D. Habitat coupling in lake ecosystems. Oikos 2002, 98, 177–189. [Google Scholar] [CrossRef]
  7. Vadeboncoeur, Y.; Vander Zanden, M.J.; Lodge, D.M. Putting the lake back together: Reintegrating benthic pathways into lake food webs. Bioscience 2002, 52, 44–54. [Google Scholar] [CrossRef]
  8. Sha, Y.C.; Su, G.H.; Zhang, P.Y.; Zhang, H.; Xu, J. Diverse dietary strategy of lake anchovy Coilia ectenes taiensis in lakes with different trophic status. J. Ichthyol. 2015, 55, 866–873. [Google Scholar] [CrossRef]
  9. Yao, X.Y.; Huang, G.T.; Xie, P.; Xu, J. Trophic niche differences between coexisting omnivores silver carp and bighead carp in a pelagic food web. Ecol. Res. 2016, 31, 831–839. [Google Scholar] [CrossRef]
  10. Schindler, D.E.; Hodgson, J.R.; Kitchell, J.F. Density-dependent changes in individual foraging specialization of largemouth bass. Oecologia 1997, 110, 592–600. [Google Scholar] [CrossRef] [PubMed]
  11. Power, M.E.; Dietrich, W.E. Food webs in river networks. Ecol. Res. 2002, 17, 451–471. [Google Scholar] [CrossRef]
  12. Lindeman, R.L. The trophic-dynamic aspect of ecology. Ecology 1942, 23, 399–417. [Google Scholar] [CrossRef]
  13. Dickman, E.M.; Newell, J.M.; Gonzalez, M.J.; Vanni, M.J. Light, nutrients and food-chain length constrain planktonic energy transfer efficiency across multiple trophic levels. Proc. Natl. Acad. Sci. USA 2008, 105, 18408–18412. [Google Scholar] [CrossRef] [PubMed]
  14. Butchart, S.H.M.; Walpole, M.; Collen, B.; van Strien, A.; Scharlemann, J.P.W.; Almond, R.E.A.; Baillie, J.E.M.; Bomhard, B.; Brown, C.; Bruno, J.; et al. Global biodiversity: Indicators of recent declines. Science 2010, 328, 1164–1168. [Google Scholar] [CrossRef] [PubMed]
  15. Essington, T.E.; Beaudreau, A.H.; Wiedenmann, J. Fishing through marine food webs. Proc. Natl. Acad. Sci. USA 2006, 103, 3171–3175. [Google Scholar] [CrossRef] [PubMed]
  16. Branch, T.A.; Watson, R.; Fulton, E.A.; Jennings, S.; McGilliard, C.R.; Pablico, G.T.; Ricard, D.; Tracey, S.R. The trophic fingerprint of marine fisheries. Nature 2010, 468, 431–435. [Google Scholar] [CrossRef] [PubMed]
  17. Xu, J.; Zhang, M.; Xie, P. Sympatric variability of isotopic baselines influences modeling of fish trophic patterns. Limnology 2011, 12, 107–115. [Google Scholar] [CrossRef]
  18. Briones, J.C.A.; Papa, R.D.S.; Cauyan, G.A.; Mendoza, N.; Okuda, N. Fish diversity and trophic interactions in Lake Sampaloc (Luzon Is. Philippines). Trop. Ecol. 2016, 57, 567–581. [Google Scholar]
  19. De Bernardi, R.; Giussani, G. Are blue-green algae a suitable food for zooplankton? An overview. Hydrobiologia 1990, 61, 29–41. [Google Scholar] [CrossRef]
  20. Gu, B.; Schelske, C.; Hoyer, M. Stable isotopes of carbon and nitrogen as indicators of diet and trophic structure of the fish community in a shallow hypereutrophic lake. J. Fish. Biol. 1996, 49, 1233–1243. [Google Scholar] [CrossRef]
  21. Fry, B. Stable isotope diagrams of freshwater food webs. Ecology 1991, 72, 2293–2297. [Google Scholar] [CrossRef]
  22. Zeug, S.C.; Winemiller, K.O. Evidence supporting the importance of terrestrial carbon in a large-river food web. Ecology 2008, 87, 1733–1743. [Google Scholar] [CrossRef]
  23. Winemiller, K.O.; Zeug, S.C.; Robertson, C.R.; Winemiller, B.K.; Honeycutt, R.L. Food-web structure of coastal streams in Costa Rica revealed by dietary and stable isotope analyses. J. Trop. Ecol. 2011, 27, 463–476. [Google Scholar] [CrossRef]
  24. Saito, L.; Rosen, M.R.; Chandra, S.; Fritsen, C.H.; Arufe, J.A.; Redd, C. Using semi-permeable membrane devices and stable nitrogen isotopes to detect anthropogenic influences on the Truckee River, USA. Environ. Eng. Sci. 2008, 25, 585–600. [Google Scholar] [CrossRef]
  25. Bristow, L.A.; Jickells, T.D.; Weston, K.; Marca-Bell, A.; Parker, R.; Andrews, J.E. Tracing estuarine organic matter sources into the southern North Sea using C and N isotopic signatures. Biogeochemistry 2013, 113, 9–22. [Google Scholar] [CrossRef]
  26. Li, Y.S.; Li, Y.; Yu, D.B.; Xia, M.; Hu, S.Q.; Xiang, Y.; Zhong, Z.N. A multivariate analysis of the relationship between work ability and S. japonicum infection in Dongting Lake Region, in China. Rev. Inst. Med. Trop. São Paulo 1993, 35, 347–353. [Google Scholar] [PubMed]
  27. Li, C. Study on the Investigation of Main Economic Fishery Resource and the Law of Its variety in the Dongting Lake. Master’s Thesis, Hunan Agricultural University, Changsha, China, 2006. [Google Scholar]
  28. Qian, Y.; Zheng, M.; Zhang, B.; Gao, L.; Liu, W. Determination and assessment of HCHs and DDTs residues in sediments from Lake Dongting, China. Environ. Monit. Assess. 2006, 116, 157–167. [Google Scholar] [CrossRef] [PubMed]
  29. Zhang, J.; Xu, K.; Yang, Y.; Qi, L.; Hayashi, A.S.; Watanabe, M. Measuring water storage fluctuations in Lake Dongting, China, by Topex/Poseidon satellite altimetry. Environ. Monit. Assess. 2006, 115, 23–37. [Google Scholar] [CrossRef] [PubMed]
  30. Niu, Y.; Yu, H.; Jiang, X. Within-lake heterogeneity of environmental factors structuring bacterial community composition in Lake Dongting, China. World J. Microbiol. Biotechnol. 2015, 31, 1683–1689. [Google Scholar] [CrossRef] [PubMed]
  31. Ru, H.J.; Liu, X.Q.; Huang, X.R.; Ning, Y.Z.; Wang, H.Z. Diversity of fish species and its spatio-temporal variations in Lake Dongting, a large Yangtze connected lake. J. Lake Sci. 2008, 20, 93–99. [Google Scholar]
  32. Marianna, P.; Mario, A.; Loreen, H.; Nicolas, S.; Loïc, N.M.; Ursula, S.; Krishna, D. Carbon, nitrogen and sulphur isotopic fractionation in captive juvenile hooded seal (Cystophora cristata): Application for diet analysis. Rapid Commun. Mass Spectrom. 2017, 31, 1720–1728. [Google Scholar]
  33. Li, Y.S.; Sleigh, A.C.; Ross, A.G.P.; Williams, G.M.; Tanner, M.; McManus, D.P. Epidemiology of Schistosoma japonicum in China: Morbidity and strategies for control in the Dongting Lake region. Int. J. Parasitol. 2000, 30, 273–281. [Google Scholar] [CrossRef]
  34. Li, Y.Z.; Chen, X.S.; Xie, Y.H.; Li, X.; Li, F.; Hou, Z.Y. Effects of young poplar plantations on understory plant diversity in the Dongting Lake wetlands, China. Sci. Rep. UK 2014, 4, 6339. [Google Scholar] [CrossRef] [PubMed]
  35. Huang, X.; Chen, W.; Cai, Q. Survey, Observation and Analysis of Lake Ecology; Standard Methods for Observation and Analysis in Chinese Ecosystem Research Network, Series V; Standards Press of China: Beijing, China, 1999. [Google Scholar]
  36. Hu, H.J.; Wei, Y.X. The Freshwater Algae of China; Science and Technology Press: Beijing, China, 2006. [Google Scholar]
  37. Chiang, S.C.; Du, N.S. Fauan Sinica, Crustacea, Freshwater Cladocera; Science Press, Academia Sinica: Beijing, China, 1979. [Google Scholar]
  38. Shen, J.R. Fauna Sinica, Crustacea, Freshwater Copepoda; Science Press, Academia Sinica: Beijing, China, 1979. [Google Scholar]
  39. Xu, J.; Zhang, M.; Xie, P. Stable isotope changes in freshwater shrimps (Exopalaemon modestus and Macrobrachium nipponensis): Trophic pattern implications. Hydrobiologia 2008, 605, 45–54. [Google Scholar] [CrossRef]
  40. Sand-Jensen, K.J.; Borum, P. Interactions among phytoplankton, periphyton, and macrophytes in temperate freshwaters and estuaries. Aquat. Bot. 1991, 41, 137–175. [Google Scholar] [CrossRef]
  41. Vander Zanden, M.J.; Chandra, S.; Allen, B.C.; Reuter, J.E.; Goldman, C.R. Historical food web structure and restoration of native aquatic communities in the Lake Tahoe (California-Nevada) Basin. Ecosystems 2003, 6, 274–288. [Google Scholar] [CrossRef]
  42. Parnell, A.C.; Inger, R.; Bearhop, S.; Jackson, A.L. Source Partitioning Using Stable Isotopes: Coping with Too Much Variation. PLoS ONE 2010, 5, 9672. [Google Scholar] [CrossRef] [PubMed] [Green Version]
  43. Peres-neto, P.R.; Jackson, D.A. How well do multivariate data sets match? The advantages of a Procrustean superimposition approach over the Mantel test. Oecologia 2001, 129, 169–178. [Google Scholar] [CrossRef] [PubMed]
  44. Vuorio, K.; Meili, M.; Sarvala, J. Taxon-specific variation in the stable isotopic signatures (δ13C and δ15N) of lake phytoplankton. Freshw. Biol. 2006, 51, 807–822. [Google Scholar] [CrossRef]
  45. Sanchez-Hernandez, J.; Eloranta, A.P.; Finstad, A.G.; Amundsen, P.A. Community structure affects trophic ontogeny in a predatory fish. Ecol. Evol. 2017, 7, 358–367. [Google Scholar] [CrossRef] [PubMed]
  46. Li, J.Q. Research Progress of Fish resources in Dongting Lake. J. Anhui Agric. Sci. 2013, 41, 3898–3900. [Google Scholar]
  47. Iii, J.J.P.; Santucci, V.J.; Wahl, D.H. Effects of adult common carp (Cyprinus carpio) on multiple trophic levels in shallow mesocosms. Can. J. Fish. Aquat. Sci. 2003, 192, 182–192. [Google Scholar]
  48. Matsuzaki, S.S.; Usio, N.; Takamura, N.; Washitani, I. Effects of common carp on nutrient dynamics and littoral community composition: Roles of excretion and bioturbation. Fundam. Appl. Limnol. 2007, 168, 70176. [Google Scholar] [CrossRef]
  49. Xu, J.; Wen, Z.; Ke, Z.; Zhang, M.; Zhang, M.; Guo, N.; Hansson, L.-A.; Xie, P. Contrasting energy pathways at the community level as a consequence of regime shifts. Oecologia 2014, 175, 231–241. [Google Scholar] [CrossRef] [PubMed]
  50. De Bruyn, A.M.H.; Rasmussen, J.B. Quantifying assimilation of sewage derived organic matter by riverine benthos. Ecol. Appl. 2002, 12, 511–520. [Google Scholar] [CrossRef]
  51. Winemiller, K.O.; Hoeinghaus, D.J.; Pease, A.A.; Esselman, P.C.; Honeycutt, R.L.; Gbanaador, D.G.; Carrera, E.; Payne, J. Stable isotope analysis reveals food web structure and watershed impacts along the fluvial gradient of a Mesoamerican coastal river. River Res. Appl. 2011, 27, 791–803. [Google Scholar] [CrossRef]
  52. Jeppesen, E.; Meerhoff, M.; Davidson, T.A.; Trolle, D.; Søndergaard, M.; Lauridsen, T.L.; Beklioglu, M.; Brucet, S.; Volta, P.; González-Bergonzoni, I.; et al. Climate change impacts on lakes: An integrated ecological perspective based on a multi-faceted approach, with special focus on shallow lakes. J. Limnol. 2014, 73, 88–111. [Google Scholar] [CrossRef] [Green Version]
  53. Jeppesen, E.; Søndergaard, M.; Liu, Z. Lake Restoration and Management in a Climate Change Perspective: An Introduction. Water 2017, 9, 122. [Google Scholar] [CrossRef]
  54. Fox, A.D.; Cao, L.; Barter, M.; Rees, E.C.; Hearn, R.D.; Cong, P.H.; Wang, X.; Zhang, Y.; Dou, S.T.; Shao, X.F. The functional use of East Dongting Lake, China, by wintering geese. Wildfowl 2008, 58, 3–19. [Google Scholar]
  55. Anderson, C.; Cabana, G. δ15N in riverine food webs: Effects of N inputs from agricultural watersheds. Can. J. Fish. Aquat. Sci. 2005, 62, 333–340. [Google Scholar] [CrossRef]
  56. Simon, K.S.; Niyogi, D.K.; Frew, R.D.; Townsend, C.R. Nitrogen dynamics in grassland streams along a gradient of agricultural development. Limnol. Oceanoga 2007, 52, 1246–1257. [Google Scholar] [CrossRef]
  57. Thomas, S.H.; Kiljunen, M.; Malinen, T.; Eloranta, A.P.; Amundsen, P.A.; Lodenius, M.; Kahilnen, K.K. Food-web structure and mercury dynamics in a large subarctic lake following multiple species introductions. Freshw. Biol. 2016, 61, 500–517. [Google Scholar] [CrossRef]
  58. Yang, G.S.; Zhang, Q.; Wan, R.R.; Lai, X.J.; Jiang, X.; Li, L.; Dai, H.C.; Lei, G.C.; Chen, J.C.; Lu, Y.J. Lake hydrology, water quality and ecology impacts of altered river–lake interactions: Advances in research on the middle Yangtze river. Hydrol. Res. 2016, 47. [Google Scholar] [CrossRef]
  59. Bricker, S.B.; Rice, K.C.; Bricker, O.P. From Headwaters to Coast: Influence of Human Activities on Water Quality of the Potomac River Estuary. Aquat. Geochem. 2014, 20, 291–323. [Google Scholar] [CrossRef]
  60. Hu, Y.; Lu, Y.H.; Liu, C.K.; Shang, P.; Liu, J.; Zheng, C.M. Sources and Dynamics of Dissolved Inorganic Carbon, Nitrogen, and Phosphorus in a Large Agricultural River Basin in Arid Northwestern China. Water 2017, 9, 415. [Google Scholar] [CrossRef]
  61. Xie, Y.H.; Tang, Y.; Chen, X.S.; Li, F.; Deng, Z.M. The impact of Three Gorges Dam on the downstream eco-hydrological environment and vegetation distribution of East Dongting Lake. Ecohydrology 2015, 8, 738–746. [Google Scholar] [CrossRef]
  62. Barry, J.F.; Murray, E. Periphyton biomass dynamics in gravel bed rivers: The relative effects of flows and nutrients. Freshw. Biol. 1989, 10, 1365–2427. [Google Scholar]
  63. Jeppesen, E.; Jensen, J.P.; Søndergaard, M.; Lauridsen, T. Trophic structure, species richness and biodiversity in Danish lakes: Changes along a phosphorus gradient. Freshw. Biol. 2000, 201–218. [Google Scholar] [CrossRef]
  64. Gremberghe, I.V. How Do Diversity and Identity at Different Trophic Levels Influence the Strength of Top-Down Control in a Simple Aquatic Food Web? A Mediation Analysis. Master’s Thesis, Ghent University, Ghent, Belgium, 2016. [Google Scholar]
  65. Colombo, F.; Costa, V.; Stanislas, F.; Dubois, S.F.; Gianguzza, P.; Mazzola, A.; Vizzini, S. Trophic structure of vermetid reef community: High trophic diversity at small spatial scales. J. Sea Res. 2013, 77, 93–99. [Google Scholar] [CrossRef]
Figure 1. Map of Lake Dongting in southern China.
Water 10 00602 g001
Figure 2. Precentage of fish catch in three sub-lakes of Lake Dongting.
Water 10 00602 g002
Figure 3. δ15N plotted against δ13C was composed of nine dominant fishes and their food sources. Error bars represent ± 1 SE (stand error) of replicate samples. δ13C values of fishes in Western Dongting were significantly higher than those in Eastern and Southern Dongting (F = 10.27, p < 0.001); δ15N values in Eastern Dongting were remarkably higher than those in the two other sub-lakes (F = 14.36, p < 0.001).
Water 10 00602 g003
Figure 4. Trophic levels of nine dominant fishes. The nine fish species included Ctenopharynodon idellus; Parabramis pekinensis; Hypophthalmichthys molitrix; Aristichthys nobilis; Acheilognathus macropterus; Carassius auratus; Cyprinus carpio; Cultrichthys erythropterus; and Siniperca chuatsi.
Water 10 00602 g004
Figure 5. Contribution proportions of food sources in pelagic, benthic, and littoral sources for nine dominant fishes sampled from the three sub-lakes. The boxes indicate 95%, 75%, and 50% Bayesian confidence intervals for posterior distributions based on Stable Isotope Analysis in R mixing models. The three lines in this figure are the Eastern, Southern and Western Dongting, respectively. The contribution proportions of three food sources are presented on the y axis. The fish species: 1, C. idellus; 2, P. pekinensis; 3, H. molitrix; 4, A. nobilis; 5, A. macropterus; 6, C. auratus; 7, C. carpio; 8, C. erythropterus; and 9, S. chuatsi are shown on the x-axis.
Water 10 00602 g005
Table 1. Limnological parameters in three regions of Dongting Lake during the study period.
Eastern DongtingSouthern DongtingWestern Dongting
Sub-lake area (km2)1300900340
Water temperature (°C)25.28 ± 0.22 a24.04 ± 0.35 ab23.56 ± 0.35 b
ORP (mv)79.20 ± 24.22 a112.36 ± 22.35 b161.17 ± 15.36 c
Water depth (m)5.47 ± 2.13 a2.85 ± 0.74 b3.34 ± 0.69 c
TN (mg/L)1.98 ± 0.14 a1.44 ± 0.11 b1.78 ± 0.15 ab
NO3-N (mg/L)1.24 ± 0.15 a0.64 ± 0.12 b0.74 ± 0.20 ab
NH4-N (mg/L)0.14 ± 0.02 a0.43 ± 0.09 b0.36 ± 0.05 c
TP (mg/L)0.10 ± 0.01 a0.10 ± 0.02 a0.07 ± 0.01 a
Density of phytoplankton (cells/L)(10.26 ± 4.19) × 106 a(1.09 ± 0.19) × 106 b(1.20 ± 0.31) × 106 b
Density of zooplankton (inds/L)29.09 ± 5.71 a3.51 ± 1.40 b1.66 ± 0.72 c
Note: values with different superscripted letters are significantly different from one another within a row (p < 0.05). ORP, oxidation–reduction potential; TN, total nitrogen; NO3-N, nitrate nitrogen; NH4-N, ammonium nitrogen; TP, total phosphorus; the area of each sub-lake in Lake Dongting is obtained from the report of Li et al. [27].
Table 2. One-way ANOVA (analysis of variance) was used to analyze significant differences in the trophic levels of the same fish species among the sub-lakes.
Eastern and Southern DongtingEastern and Western DongtingSouthern and Western Dongting
dfFpdfFpdfFp
Ctenopharynodon idellus172.9140.107170.0210.886173.0670.099
Parabramis pekinensis176.8550.019178.4720.010170.1810.676
Hypophthalmichthys molitrix17135.099<0.0011718.8550.00117150.433<0.001
Aristichthys nobilis1765.325<0.001173.1310.096175.9830.026
Acheilognathus macropterus1710.2990.0051711.2590.004170.2850.601
Carassius auratus176.1750.024178.3110.011170.5010.489
Cyprinus carpio179.6940.0071725.780<0.001170.1900.669
Cultrichthys erythropterus176.8850.01817136.225<0.0011719.543<0.001
Siniperca chuatsi174.8220.0431713.1810.002172.4950.134
Note: statistically significant relationships at p < 0.05 are indicated by bold letters.
Table 3. One-way ANOVA was used to analyze differences in the contribution proportions of primary food sources between sub-lakes.
Primary Food SourcesEastern and Southern DongtingEastern and Western DongtingSouthern and Western DongtingOne-Way ANOVA
Pelagic source0.070.030.921Turkey HSD
Benthic source0.155<0.001<0.001Dunnett T3
Littoral source<0.0010.4210.001Turkey HSD
Statistically significant relationships at p < 0.05 are indicated by bold letters.

