Morphometric Change Detection of Lake Hawassa in the Ethiopian Rift Valley
by
 ,
,
Yonas Abebe
1,* ,
,
Menberu Bitew
2,
Tenalem Ayenew
3,
Clement Alo
4,
Assegid Cherinet
5 and
Mulugeta Dadi
6 1
Ethiopian Institute of Water Resources, Addis Ababa University, P.O. Box 89, Kality, Addis Ababa, Ethiopia
2
USDA ARS Southwest Watershed Research Center, 2000 E Allen Road, Tucson, AZ 85719, USA
3
School of Earth Sciences, Addis Ababa University, P.O. Box 1176, AAU, Addis Ababa, Ethiopia
4
Earth and Environmental Studies, Montclair State University, 1 Normal Ave., Montclair, NJ 07043, USA
5
School of Bio-Systems and Environmental Engineering, Institute of Technology, Hawassa University, P.O. Box 5, Hawassa, Ethiopia
6
School of Water Resources Engineering, Institute of Technology, Hawassa University, P.O. Box 5, Hawassa, Ethiopia
*
Author to whom correspondence should be addressed.
Water 2018, 10(5), 625; https://doi.org/10.3390/w10050625
Submission received: 12 March 2018
/
Revised: 2 May 2018
/
Accepted: 3 May 2018
/
Published: 10 May 2018
(This article belongs to the Section Water Resources Management, Policy and Governance)
Abstract
:The Ethiopian Rift Valley lakes have been subjected to environmental and ecological changes due to recent development endeavors and natural phenomena, which are visible in the alterations to the quality and quantity of the water resources. Monitoring lakes for temporal and spatial alterations has become a valuable indicator of environmental change. In this regard, hydrographic information has a paramount importance. The first extensive hydrographic survey of Lake Hawassa was conducted in 1999. In this study, a bathymetric map was prepared using advances in global positioning systems, portable sonar sounder technology, geostatistics, remote sensing and geographic information system (GIS) software analysis tools with the aim of detecting morphometric changes. Results showed that the surface area of Lake Hawassa increased by 7.5% in 1999 and 3.2% in 2011 from that of 1985. Water volume decreased by 17% between 1999 and 2011. Silt accumulated over more than 50% of the bed surface has caused a 4% loss of the lake’s storage capacity. The sedimentation patterns identified may have been strongly impacted by anthropogenic activities including urbanization and farming practices located on the northern, eastern and western sides of the lake watershed. The study demonstrated this geostatistical modeling approach to be a rapid and cost-effective method for bathymetric mapping.
1. Introduction
Lakes are among the most fragile environments due to anthropogenic effects alongside natural phenomena that can trigger rapid environmental changes to their ecosystems. For instance, declining lake levels were indicative of climate-driven changes [1]. Soil erosion and sediment deposition as well as pollution from municipal, industrial and agricultural waste are among the major menaces to which lakes are exposed [2]. Severe erosion and sedimentation may result in diminishing lake size and, in some cases, can cause the disappearance of a lake body and induce changes in its fauna and flora population. Because lakes and reservoirs are low points in the landscape, they receive water and sediment inputs from the surrounding terrestrial catchment and the upwind airsheds [3]. These inputs can influence the environs positively or negatively and bring about environmental change resulting in the alteration of limnological, hydrological and morphometric characteristics. Therefore, lakes are important sentinels of environmental variations due to the integration of changes in the surrounding landscape and atmosphere [1,4].
Changes in lakes can be manifested in surface area, volume or capacity changes and variation in the water quality depending on the dynamics in the contributing area, the size and shape of the water body, and the geologic formation. The study of lake morphology is important not only to understand spatial change in the shape and size of the lake, but also to comprehend its hydrologic and limnologic characteristics [5,6,7]. Historical morphometric studies in general provide information on spatial and temporal changes in erosion and sediment deposition, as well as bathymetric characteristics. This information can be used to study and remedy the implications on both physical and biological systems [8,9,10,11,12,13].
Lake Hawassa and the adjoining small, Lake Cheleleka, like most Ethiopian Rift Valley lakes, have been subjected to natural and anthropogenic alterations. The recent level rise in Lake Hawassa has been attributed to land-use changes in the watershed [14] and possibly to climate change [15]. However, in the Sixties, the rise in the levels of the Ethiopian Rift Valley lakes were apparently related to lake-level changes throughout East and Central Africa due to climate variability [16]. The geology of the Lake Hawassa catchment is characterized by rift system faults and cracks. It was reported that between 1996 and 1998 new cracks were formed on the western side of Lake Hawassa [17] which may influence groundwater flows thereby affecting lake levels. A number of studies have also explored the role of recent land-use and land-cover changes on rising Lake Hawassa levels [14,18,19,20,21]. Natural forests on the Wondo Genet escarpments have been under continued threat by human settlement and associated farm expansion, especially since 1990 [19,20]. It was also indicated that the natural vegetation in the watershed decreased by about 9% between the years 1995–1998 [22]. In addition, point and non-point pollution sources from agriculture, industries and municipal waste had affected the quality of groundwater resources in the watershed [18].
Until recent years, morphometric information of Ethiopian lakes was not available. Lake Zeway was the only Rift Valley lake for which a bathymetric map was developed in 1992 [23]. In recent years, bathymetry has been established for a number of Ethiopian rift lakes [24]. Despite the various investigations on Ethiopian lakes, monitoring these ecosystems for hydrographical changes over time is still lacking. The first extensive hydrographic survey of Lake Hawassa was conducted in 1999 by the Water Works Design and Supervision Enterprise (WWDSE) as part of a study to identify the cause of a rise in Hawassa Lake’s level and flooding of Hawassa Town. The environmental changes that Lake Hawassa and Lake Cheleleka had undergone were exhibited in the alteration of their morphologic characteristics. Therefore, studying the morphometric changes uncovers valuable information for the management and protection of the lakes.
Monitoring changes in major Ethiopian lakes that require frequent bathymetric surveys has always been a challenge due to cost and technology-related limitations. These limitations resulted in fewer research dedicated to studying morphometries. With recent advances in remote-sensing and geographic information system (GIS) technology, morphometric studies and bathymetric mapping have become more feasible. This study aims (1) to detect surface area changes in Lake Hawassa and Lake Cheleleka in 1985, 1999 and 2011; (2) to detect morphometric changes, based on the comparison of bathymetric maps for 1999 and 2011; and (3) to estimate the rate and extent of water loss and sediment build up in Lake Hawassa by employing progresses in geostatistics, portable sonar sounding, the global positioning system, and remote-sensing and GIS software analysis tools.
2. Materials and Methods
2.1. Description of the Study Lakes
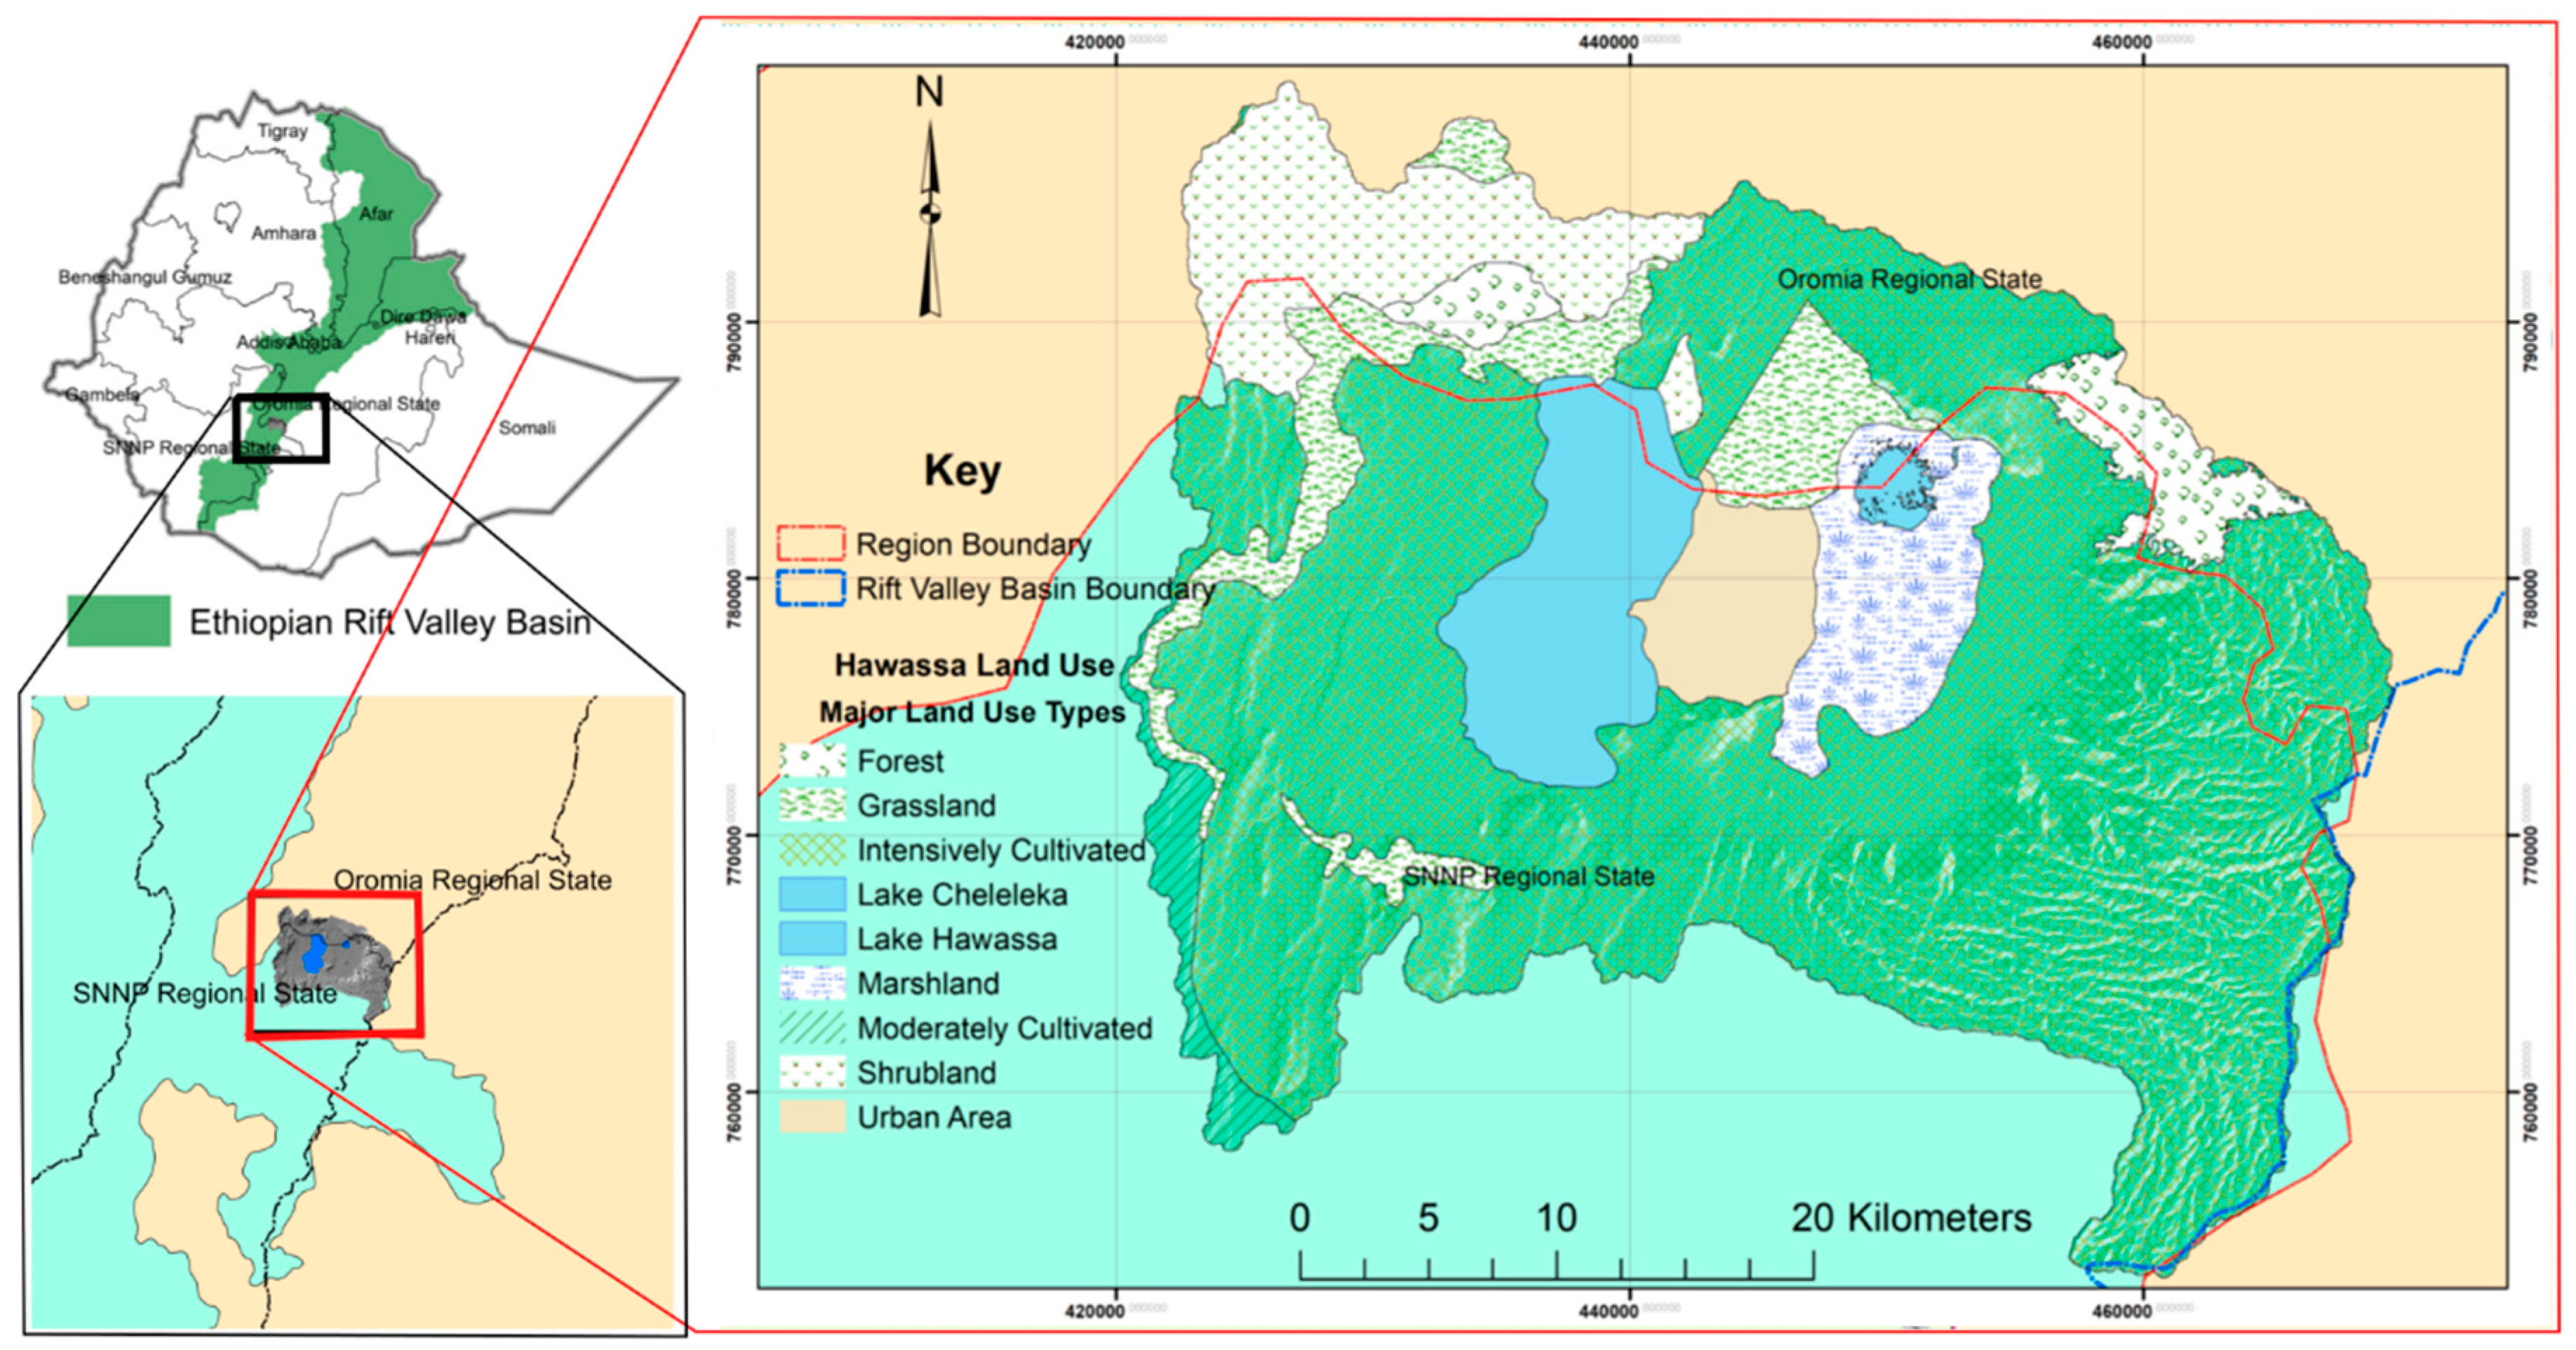
Ethiopia has many lakes of volcanic, tectonic and anthropogenic origins. Lake Hawassa and the adjoining small Lake Cheleleka are few of the several volcano-tectonic lakes formed in collapsed calderas [25]. These lakes are believed to have been a single lake in the past [16]. Lake Hawassa, an endorheic freshwater lake, is located between 6°59′3.91″–7°7′42.24″ N latitude and 38°23′17.8″–38°28′52.9″ E longitude in the Southern Nations, Nationality and Peoples Regional State (SNNPRS) and Oromia Regional State, within the Central Ethiopian Rift Valley Basin (Figure 1). Lake Cheleleka on the other hand is found about 6 km east of Lake Hawassa. Even though Lake Hawassa rests at 1680 m above sea level (asl), the edges of the caldera peaks to 2995 masl towards the south-east. The streams in the eastern caldera drain to Lake Cheleleka and the associated swamp, which in turn replenishes Lake Hawassa through the perennial river, Tikur Wuha. Lake Hawassa is the source for commercial fishing in the town of Hawassa. It is also a recreational site and tourist destination. Moreover, it is the main source for domestic, livestock and irrigation water for the community. Although the lake watershed is a closed basin, previous studies have shown that there is groundwater inflow and outflow to surrounding watersheds [21,24,26]. In recent years, Lake Cheleleka has disappeared, signifying the environmental changes taking place in the watershed.
While the eastern and south-eastern escarpments are relatively well covered by mixed vegetation, where agroforestry is widely practiced, the western part of the watershed is poorly vegetated [20]. Dense bush cover the north-western parts, which are part of the Senkele wildlife sanctuary. Northern, central and southern parts of the watershed are manly agricultural lands populated by smallholder and mechanized commercial farms. The major soil types within the catchment include cambisols, vertic cambisols, andosols, vertic luvisols, regosols, greysols, alisols and leptosols [14].
The 1381.2-square kilometer watershed is the result of volcanic and tectonic activities. The presence of hot springs and recent cracks are evidence of active geologic phenomena in the basin. Based on five nearby rainfall stations’ data, the area receives about 1028 mm rainfall annually. The long-term mean annual temperature is around 19 °C while the mean monthly evapotranspiration in the low lands ranges from 39 mm in July to 100 mm in January [26].
In this study, spatial and bathymetric changes were investigated in the Lake Hawassa watershed. While spatial changes were explored for Lake Hawassa and Lake Cheleleka in 1985, 1999 and 2011, morphometric changes in 1999 and 2011 were examined for Lake Hawassa.
2.2. Data
Primary and secondary data were collected for this study. The primary data were obtained by rapid bathymetric surveying using the SonarMite echo-sounder (Bonn, Germany) (235 kHz frequency, 0.3–75 m depth capacity and +/− 0.025 m accuracy), eTrex Venture Garmin (Garmin Corporation, Taipei County, Taiwan) geographic positioning system (GPS) and a motorized boat to measure lake depth at uniform grid points, and a leveling survey to determine the lake level elevation in January 2011. Water depth measurements from 396 grid points and several shoreline points were collected. The secondary data were satellite images, Lake Hawassa level observation data, and the 1999 bathymetric map of Lake Hawassa. Cloud-free Landsat Thematic Mapper (TM) images (Path: 168, Row: 55) acquired on the 18 January 1985, 25 January 1999 and 10 January 2011 were downloaded from the United States Geological Survey (USGS) Earth explorer website [27]. A copy of the hand-drawn bathymetric map of Lake Hawassa prepared by WWDSE in 1999 was obtained from the SNNPRS Water Bureau. The 1999 bathymetry was available only as a hard copy of four A0-size maps showing the four quadrants of the lake. Additionally, the Lake Hawassa level data was obtained from the Federal Ministry of Water, Irrigation and Electricity.
2.3. Survey and Shoreline Detection
A grid of points (500 × 500 m) was prepared in ArcMap 10.1 (Esri Eastern Africa Ltd., Nairobi, Kenya) (Section 3.2) and was uploaded to the Garmin GPS. During the survey work, this grid was used to navigate the boat for depth measurement at the vertices. Echo-sounder measurements were taken in triplicate at each grid point to ensure vertical alignment of the sonar sensor and to verify consistency in measurement. The three measurements were then averaged for each grid point. Depth measurements in areas of aquatic grass and shallow depths of less than 1 m, where sounding was difficult, were made with a standard measuring rod. A leveling survey was also conducted to determine the lake level elevation from a standard benchmark located at Fikir Haik roundabout.
Lake shoreline detection from optical remote sensing has been an important method in the monitoring of lake surface extent [28]. Lake Hawassa and Lake Cheleleka shorelines were delineated using the modified normalized difference water index (mNDWI) [29] analyses for images in 1985, 1999 and 2011 to derive the areal extent in their respective years. Each Landsat image was enhanced to improve the visualization, and atmospheric and sun-angle corrections were made. The modified NDWI map of Lake Hawassa for 2011 was validated using GPS readings taken during the ground survey in January 2011 to be integrated with the grid point survey data (Section 2.4.1).
2.4. Bathymetry
Two bathymetric maps, namely the 1999 and 2011 bathymetric maps, were utilized to detect morphometric changes in Lake Hawassa. The 1999 four bathymetric maps were digitized in a GIS environment after being scanned and georeferenced. The contour lines were then converted to point features with elevation data as an attribute. The ArcGIS 10.1 (Esri Eastern Africa Ltd., Nairobi, Kenya) kriging interpolation tool was used to reconstruct the 1999 bathymetry digital surface model from which the morphometric characteristics were derived.
The 2011 bathymetric map and morphometric characteristics were generated with state-of-the-art technology, using rapid surveying, portable equipment and geostatistics at low cost. Remote sensing (mNDWI) was used for shoreline detection and ArcGIS 10.1 was employed for raster calculations, mapping and deriving the morphometric characteristics. The details are explained as follows.
2.4.1. 2011 Bathymetric Data Preparation
To develop a geostatistical bathymetric model for Lake Hawassa in 2011, sounding depth data were converted to elevation data by subtracting the measured depth from the lake level elevation at the grid locations resulting in point bed elevation data. The delineated and GPS verified shoreline result of the modified NDWI analysis on the 2011 Landsat image was converted to point data having the same elevation with the Lake Hawassa level. The Lake Hawassa level elevation was determined from a standard benchmark located at the Fikir Haik roundabout by leveling survey. However, the WWDSE bathymetric map was prepared using an assumed lake water surface elevation. The water level on 21 June 1999 was taken to be 1681.7 masl [14]. This datum was used to adjust elevation readings by making use of the lake level data obtained from the Ministry of Water Irrigation and Electricity. The point bed elevation data acquired from the survey in 2011 were combined with the elevation point data from the shoreline delineation to form the elevation point dataset for the geostatistical analysis.
2.4.2. Geostatistical Analysis
A geostatistical modeling approach known as kriging interpolation was used to predict a continuous bathymetric surface from observation points. The method is based on Tobler’s premise that neighboring points are more similar than points farther away, a phenomenon known as spatial autocorrelation [30,31,32]. Spatial autocorrelation can be detected, quantified and modeled by semivariogram analysis, and used to make predictions at locations where measurements were not made [32]. The characteristics used to describe this semivariogram model applied for the prediction are the range, sill, and nugget parameters. Observing the plot of the semivariogram [32,33], the distance where the model first flattens out is known as the range where distances smaller than the range are spatially autocorrelated, whereas locations farther apart than the range are not. The sill is the value that the semivariogram model attains at the range. The Y-axis intercept of the semivariogram plot shows the nugget effect. Kriging has the advantage that it is stochastic in contrast with deterministic techniques like trend surfaces, which predict an unknown value without an associated measure of uncertainty [34]. Kriging indicates the errors and uncertainties associated with the interpolated values, based on a variance surface of the estimated values [35]. In this study, the kriging interpolation method was chosen over other methods for its comparatively better estimation of digital elevation model values [36].
The point dataset for geostatistical analysis were fitted to experimental semivariograms with linear, exponential, Gaussian and spherical equations. The semivariances of the different models were evaluated by calculating variances for all possible pairs of points in the dataset and assigning each pair to an interval class. The quality of the experimental semivariogram model estimated was checked by cross-validation analysis. This was a means for evaluating effective parameters for kriging interpolations by hiding information, one observation at a time. Once the variogram is selected, kriging interpolation can commence predicting the model surface. The geostatistical analysis was carried out with GS+ geostatistical software (Gamma Design Software, LLC, Plainwell, MI, USA) [33].
2.5. Morphometric Characterization and Change Detection in Lake Hawassa
Once all the maps were prepared, morphometric parameters were evaluated using ArcMap analysis tools. These parameters, defined in [5], include surface area and volume of the lake; maximum, minimum and mean length, width and depth of the lake; and hypsographic and volume curves, which determine certain elements of the lake form and also provide means to estimate the area and volume at any depth. Maps of deposition and erosion in the lake bottom were generated by differencing the 1999 and 2011 bathymetries. Multiplying the increment or decrement of bed elevation, due to deposition or erosion, by the surface area on a cell-by-cell basis, resulted in volumetric measurements of sediment change.
3. Results
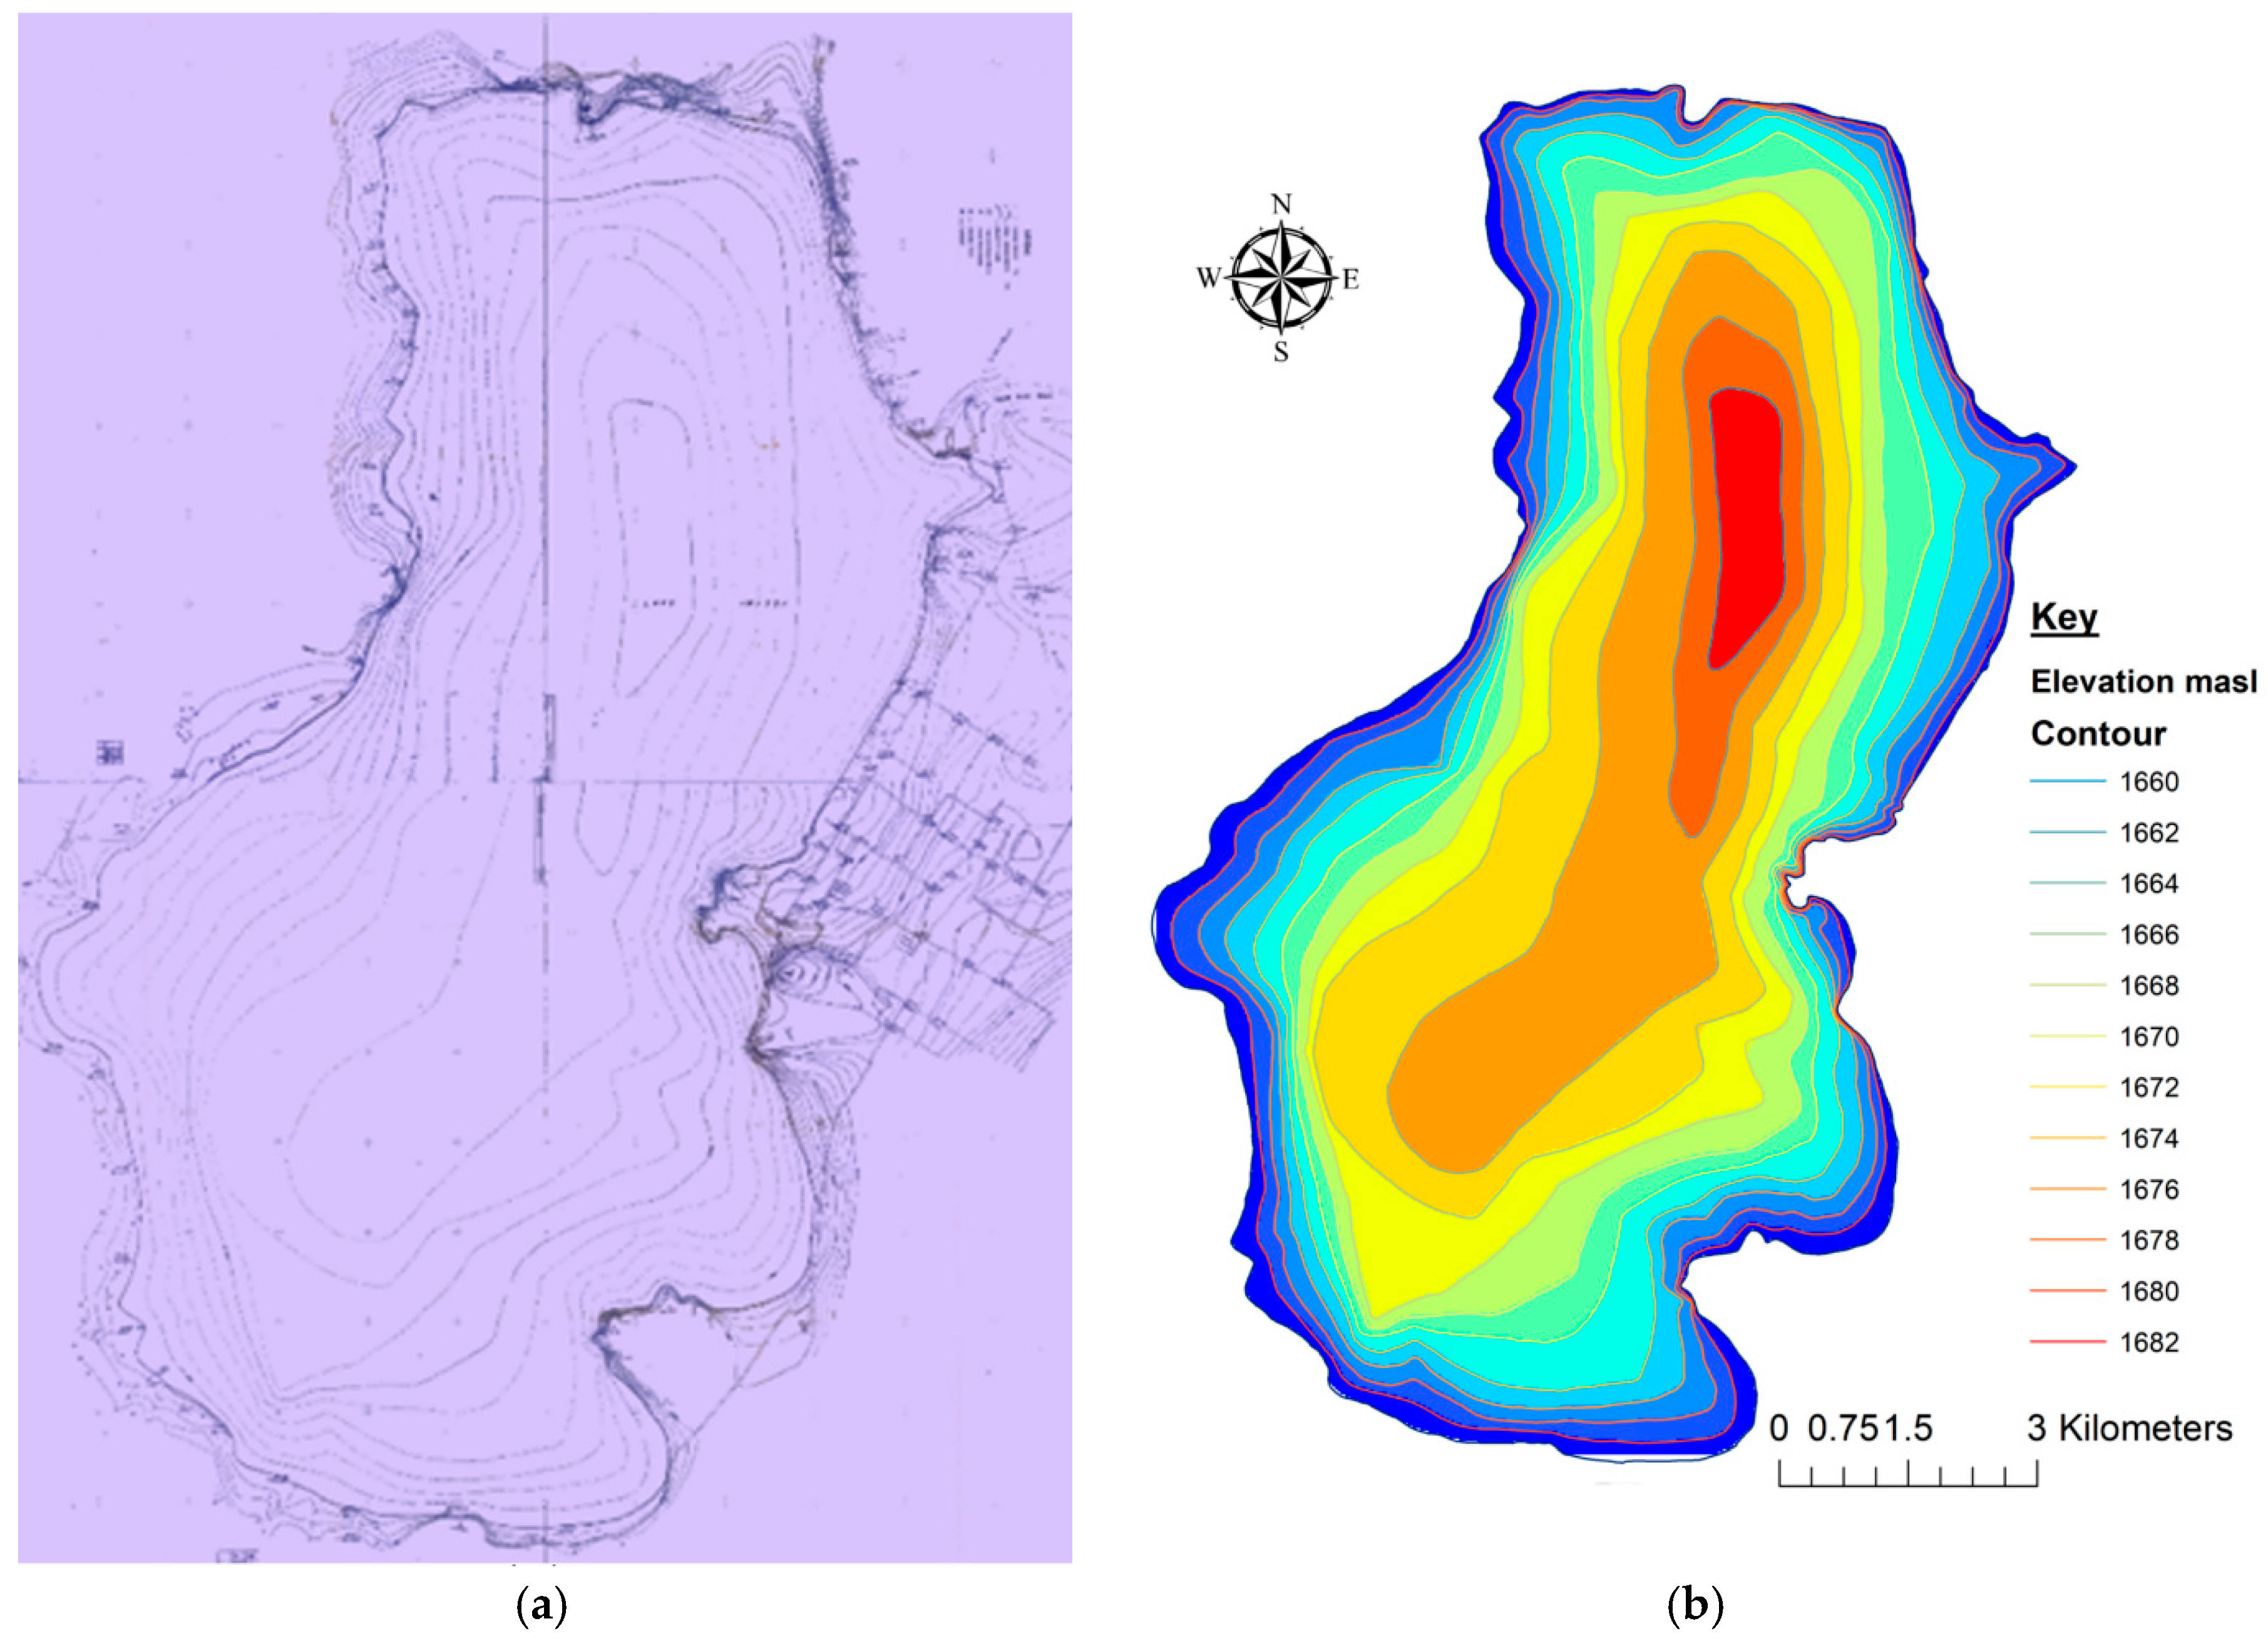
During the reconstruction of the 1999 Lake Hawassa bathymetry some inconsistencies were observed on the original hand-drawn map (Figure 2a). The contours on the maps did not fit exactly. Therefore, necessary adjustments were made to fix the misalignment. Moreover, the island found on the northern part of Lake Hawassa was missing on the 1999 map. Comparisons were made after adjustments and correction of these errors. The reconstructed 1999 bathymetry is depicted in Figure 2b.
3.1. Lake Surfaces and Shore Lines
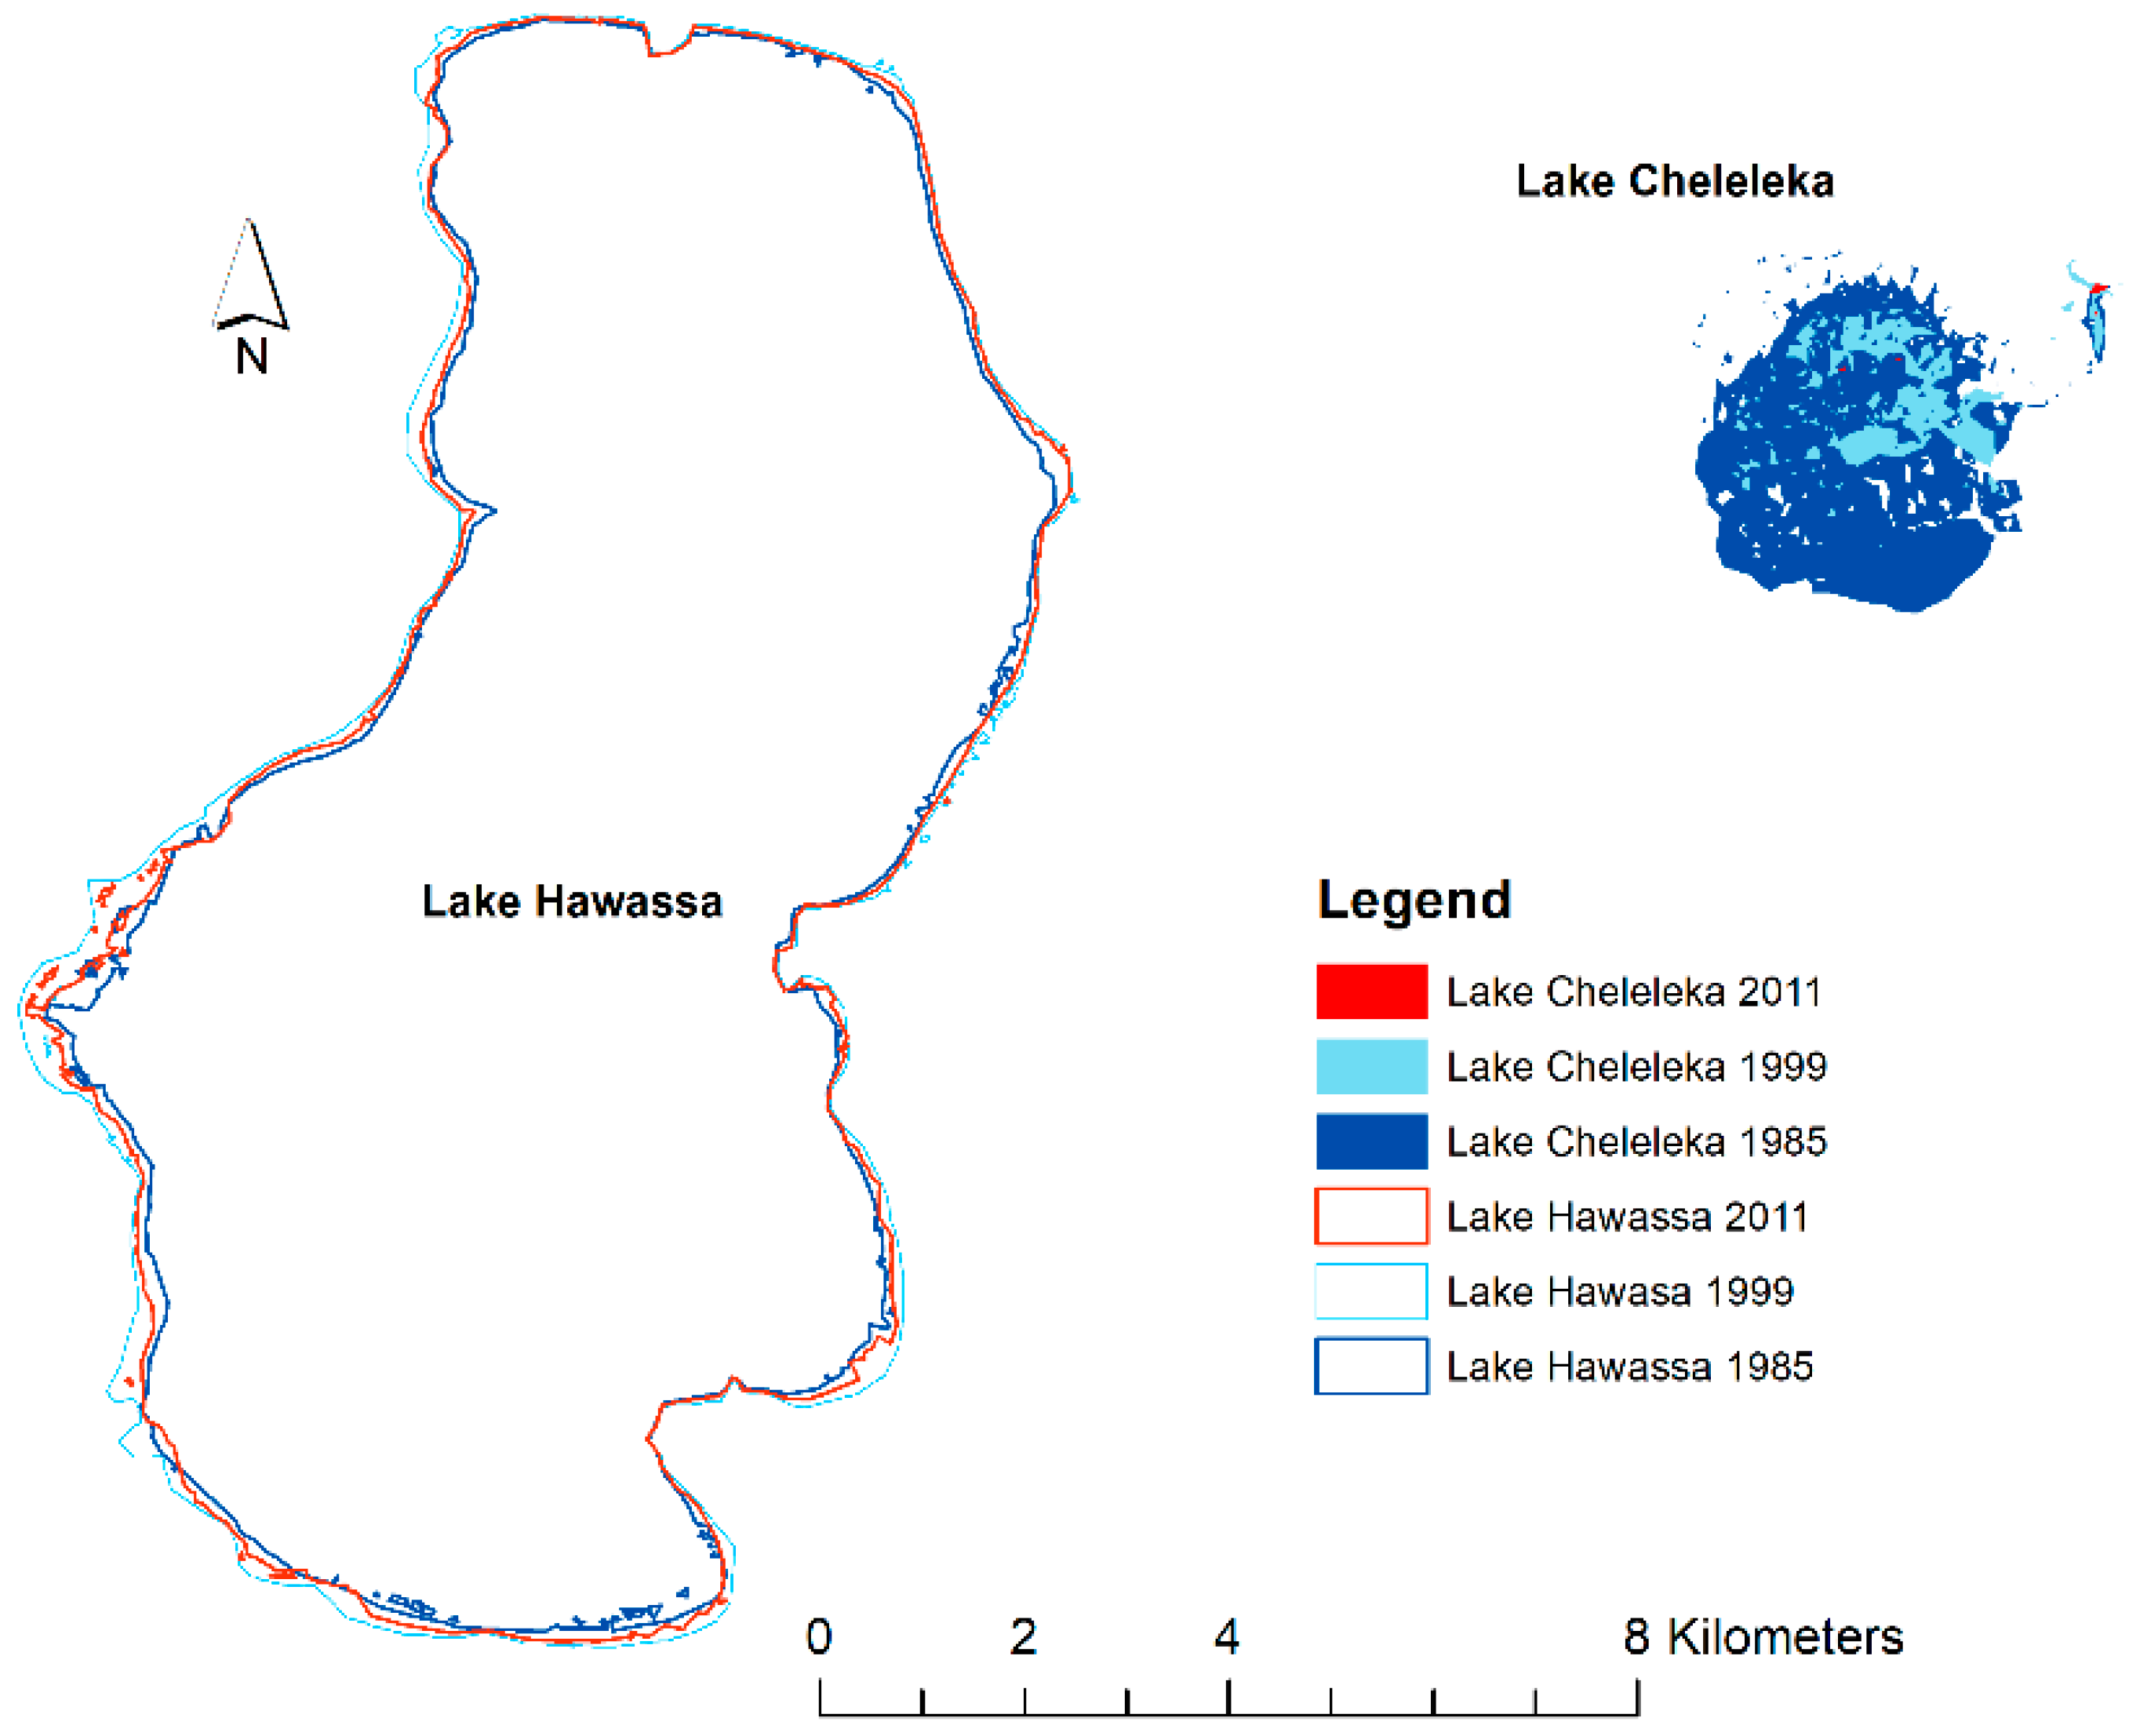
The surfaces and shorelines of Lake Hawassa and Lake Cheleleka in 1985, 1999 and 2011 were determined from the modified NDWI maps which were used to calculate the lakes’ surface areas and shore lengths (Figure 3). The surface area of Lake Hawassa increased by 7.5% and 3.2%, while Lake Cheleleka decreased by 87% and 99.8% in 1999 and 2011 from that of 1985, respectively (Table 1). According to the lake level data, Lake Hawassa registered the highest level in its recorded history in December 1998. The surface area of Lake Hawassa, therefore, must have shown an increasing trend until 1998 and a decreasing trend thereafter. The shore length of Lake Hawassa increased over time, while Lake Cheleleka showed a decrease in shore length. Early in this century, Lake Cheleleka completely dried up.
3.2. Geostatistical Analysis and Bathymetry
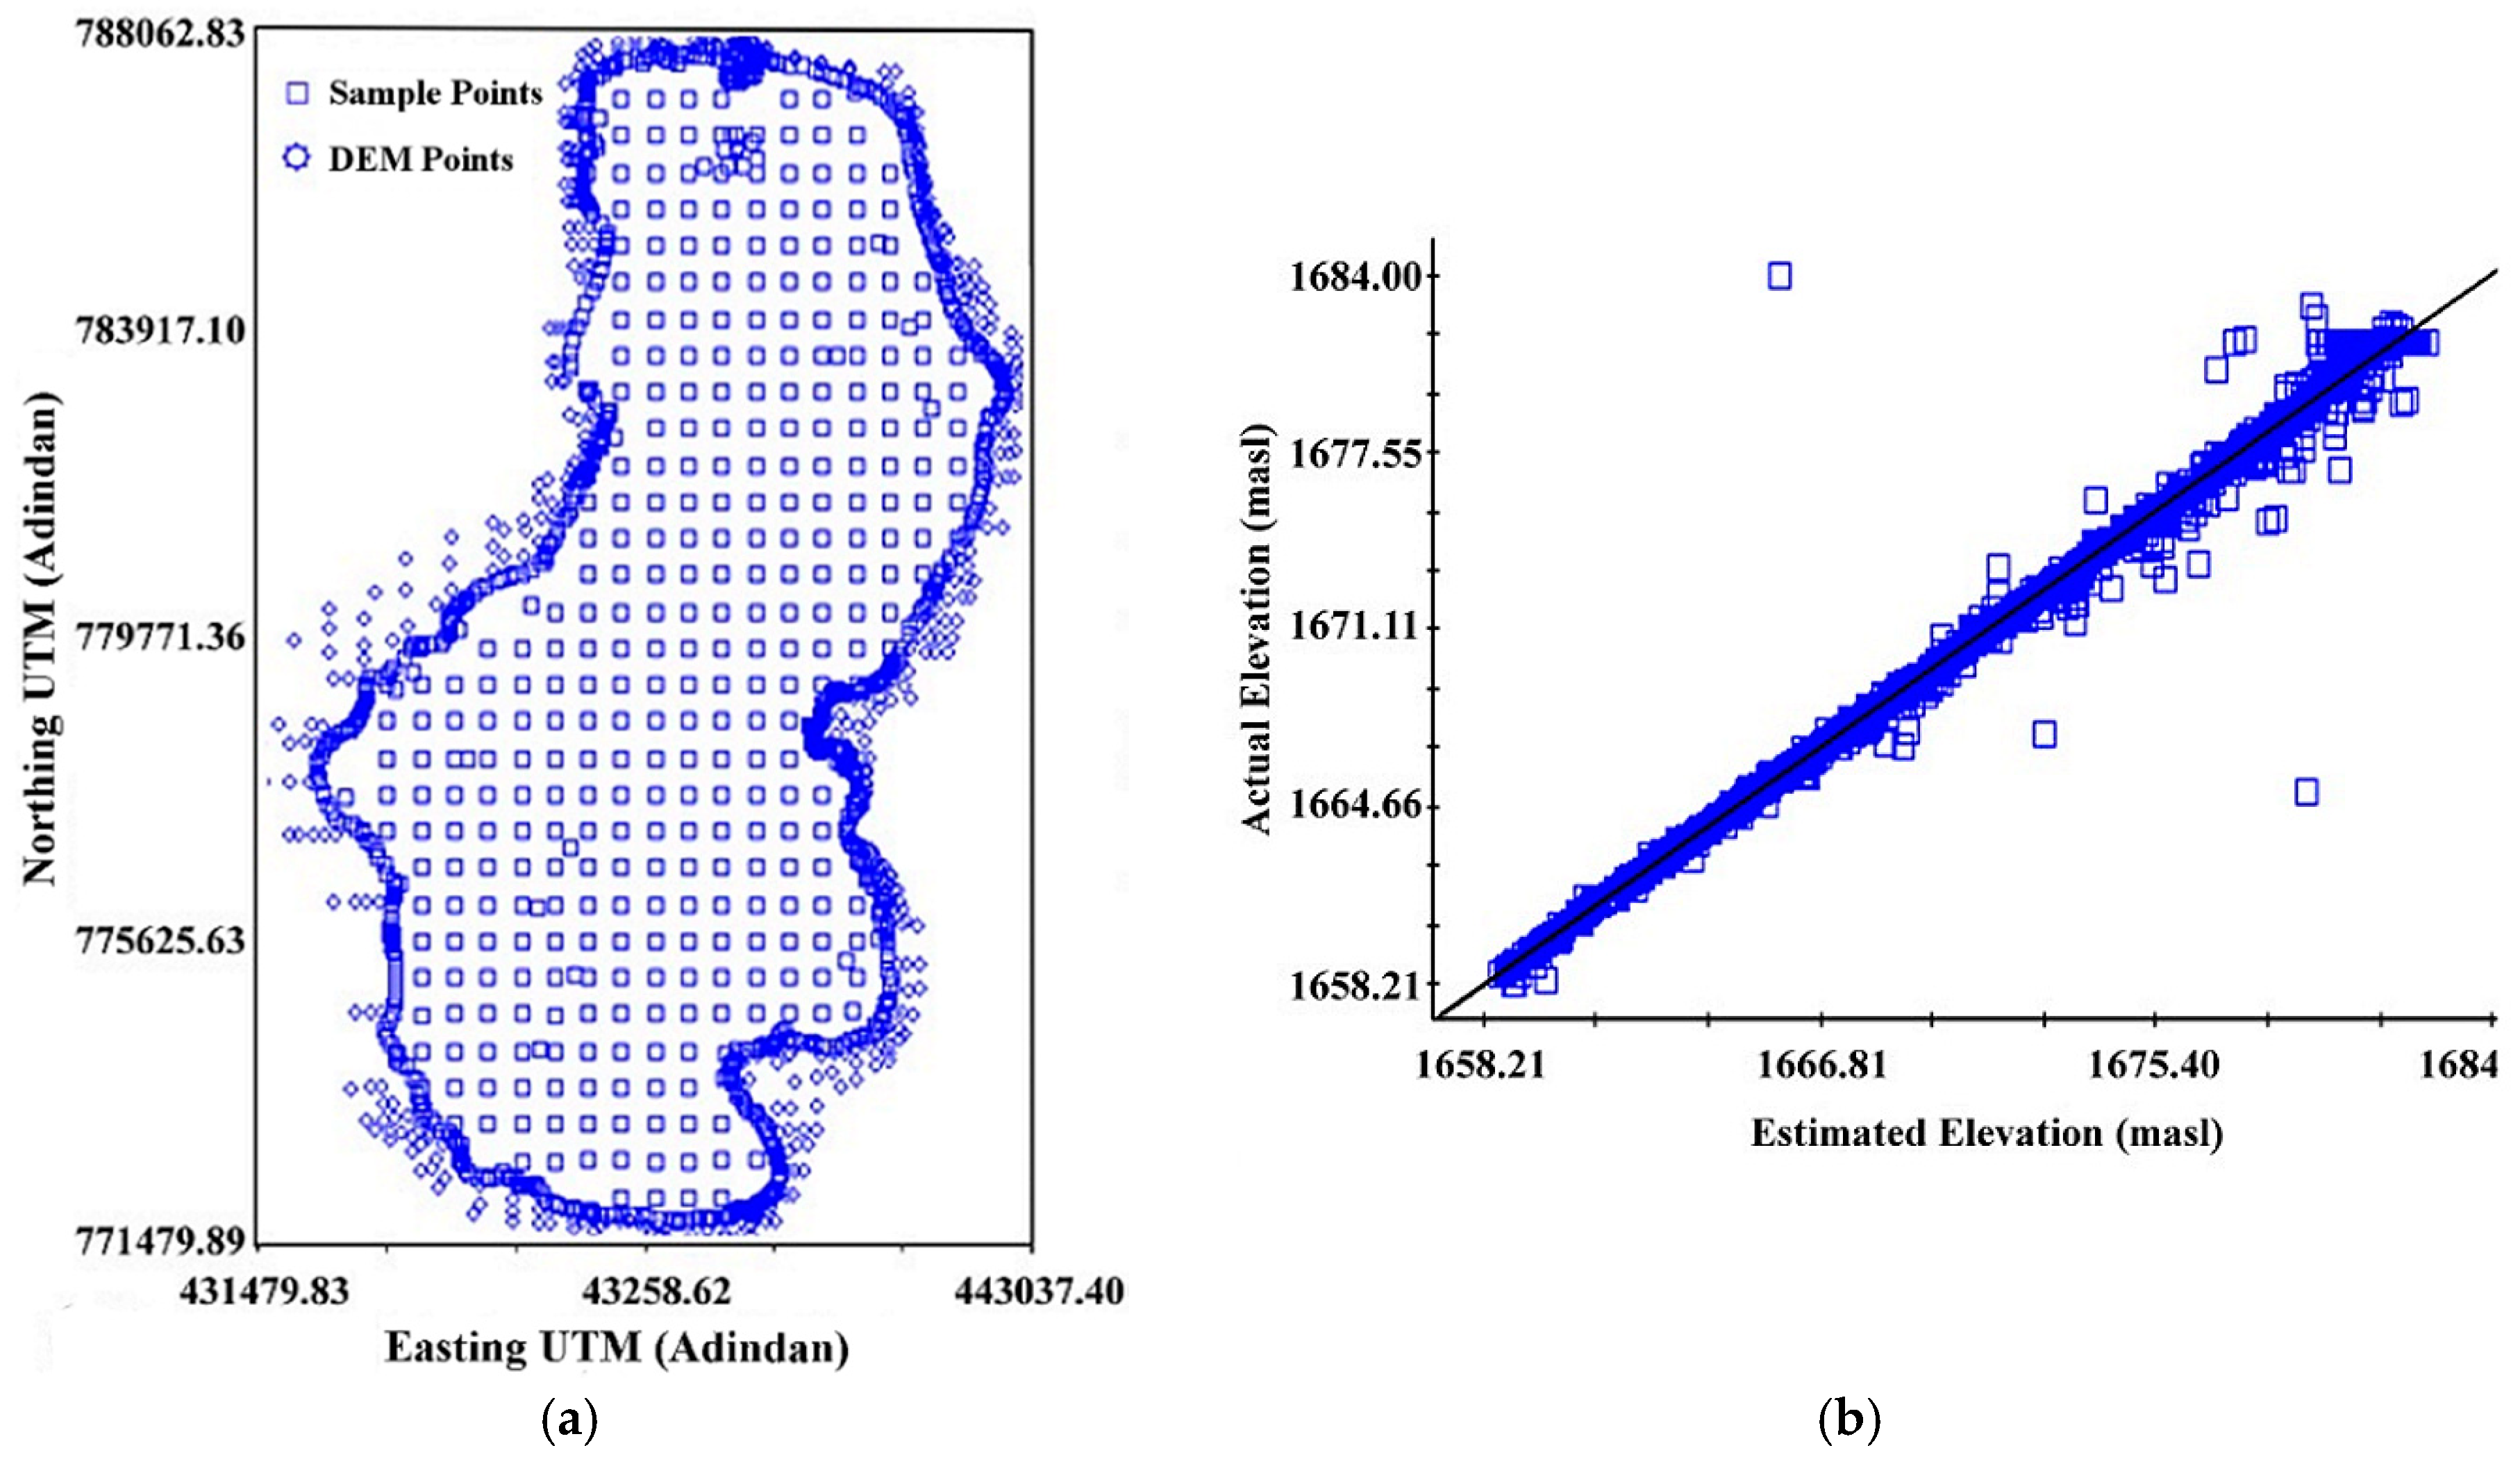
Combined dataset from modified NDWI analysis, GPS and survey point bed elevation data (Figure 4a) was fitted to linear, spherical, exponential and Gaussian experimental variogram models. The spherical model was the best fit, defining the spatial structure of the variations. It had a parametric nugget value of 0.01 m2, sill value of 63.64 m2 and range parameter of 5940 m with a residual sum of squares (RSS) of 7039 and R2 0.962. The spatial dependence investigation showed an anisotropic behavior caused by the shape of the lake (i.e., the lake has greater stretch than width) which suggested the anisotropic kriging interpolation method.
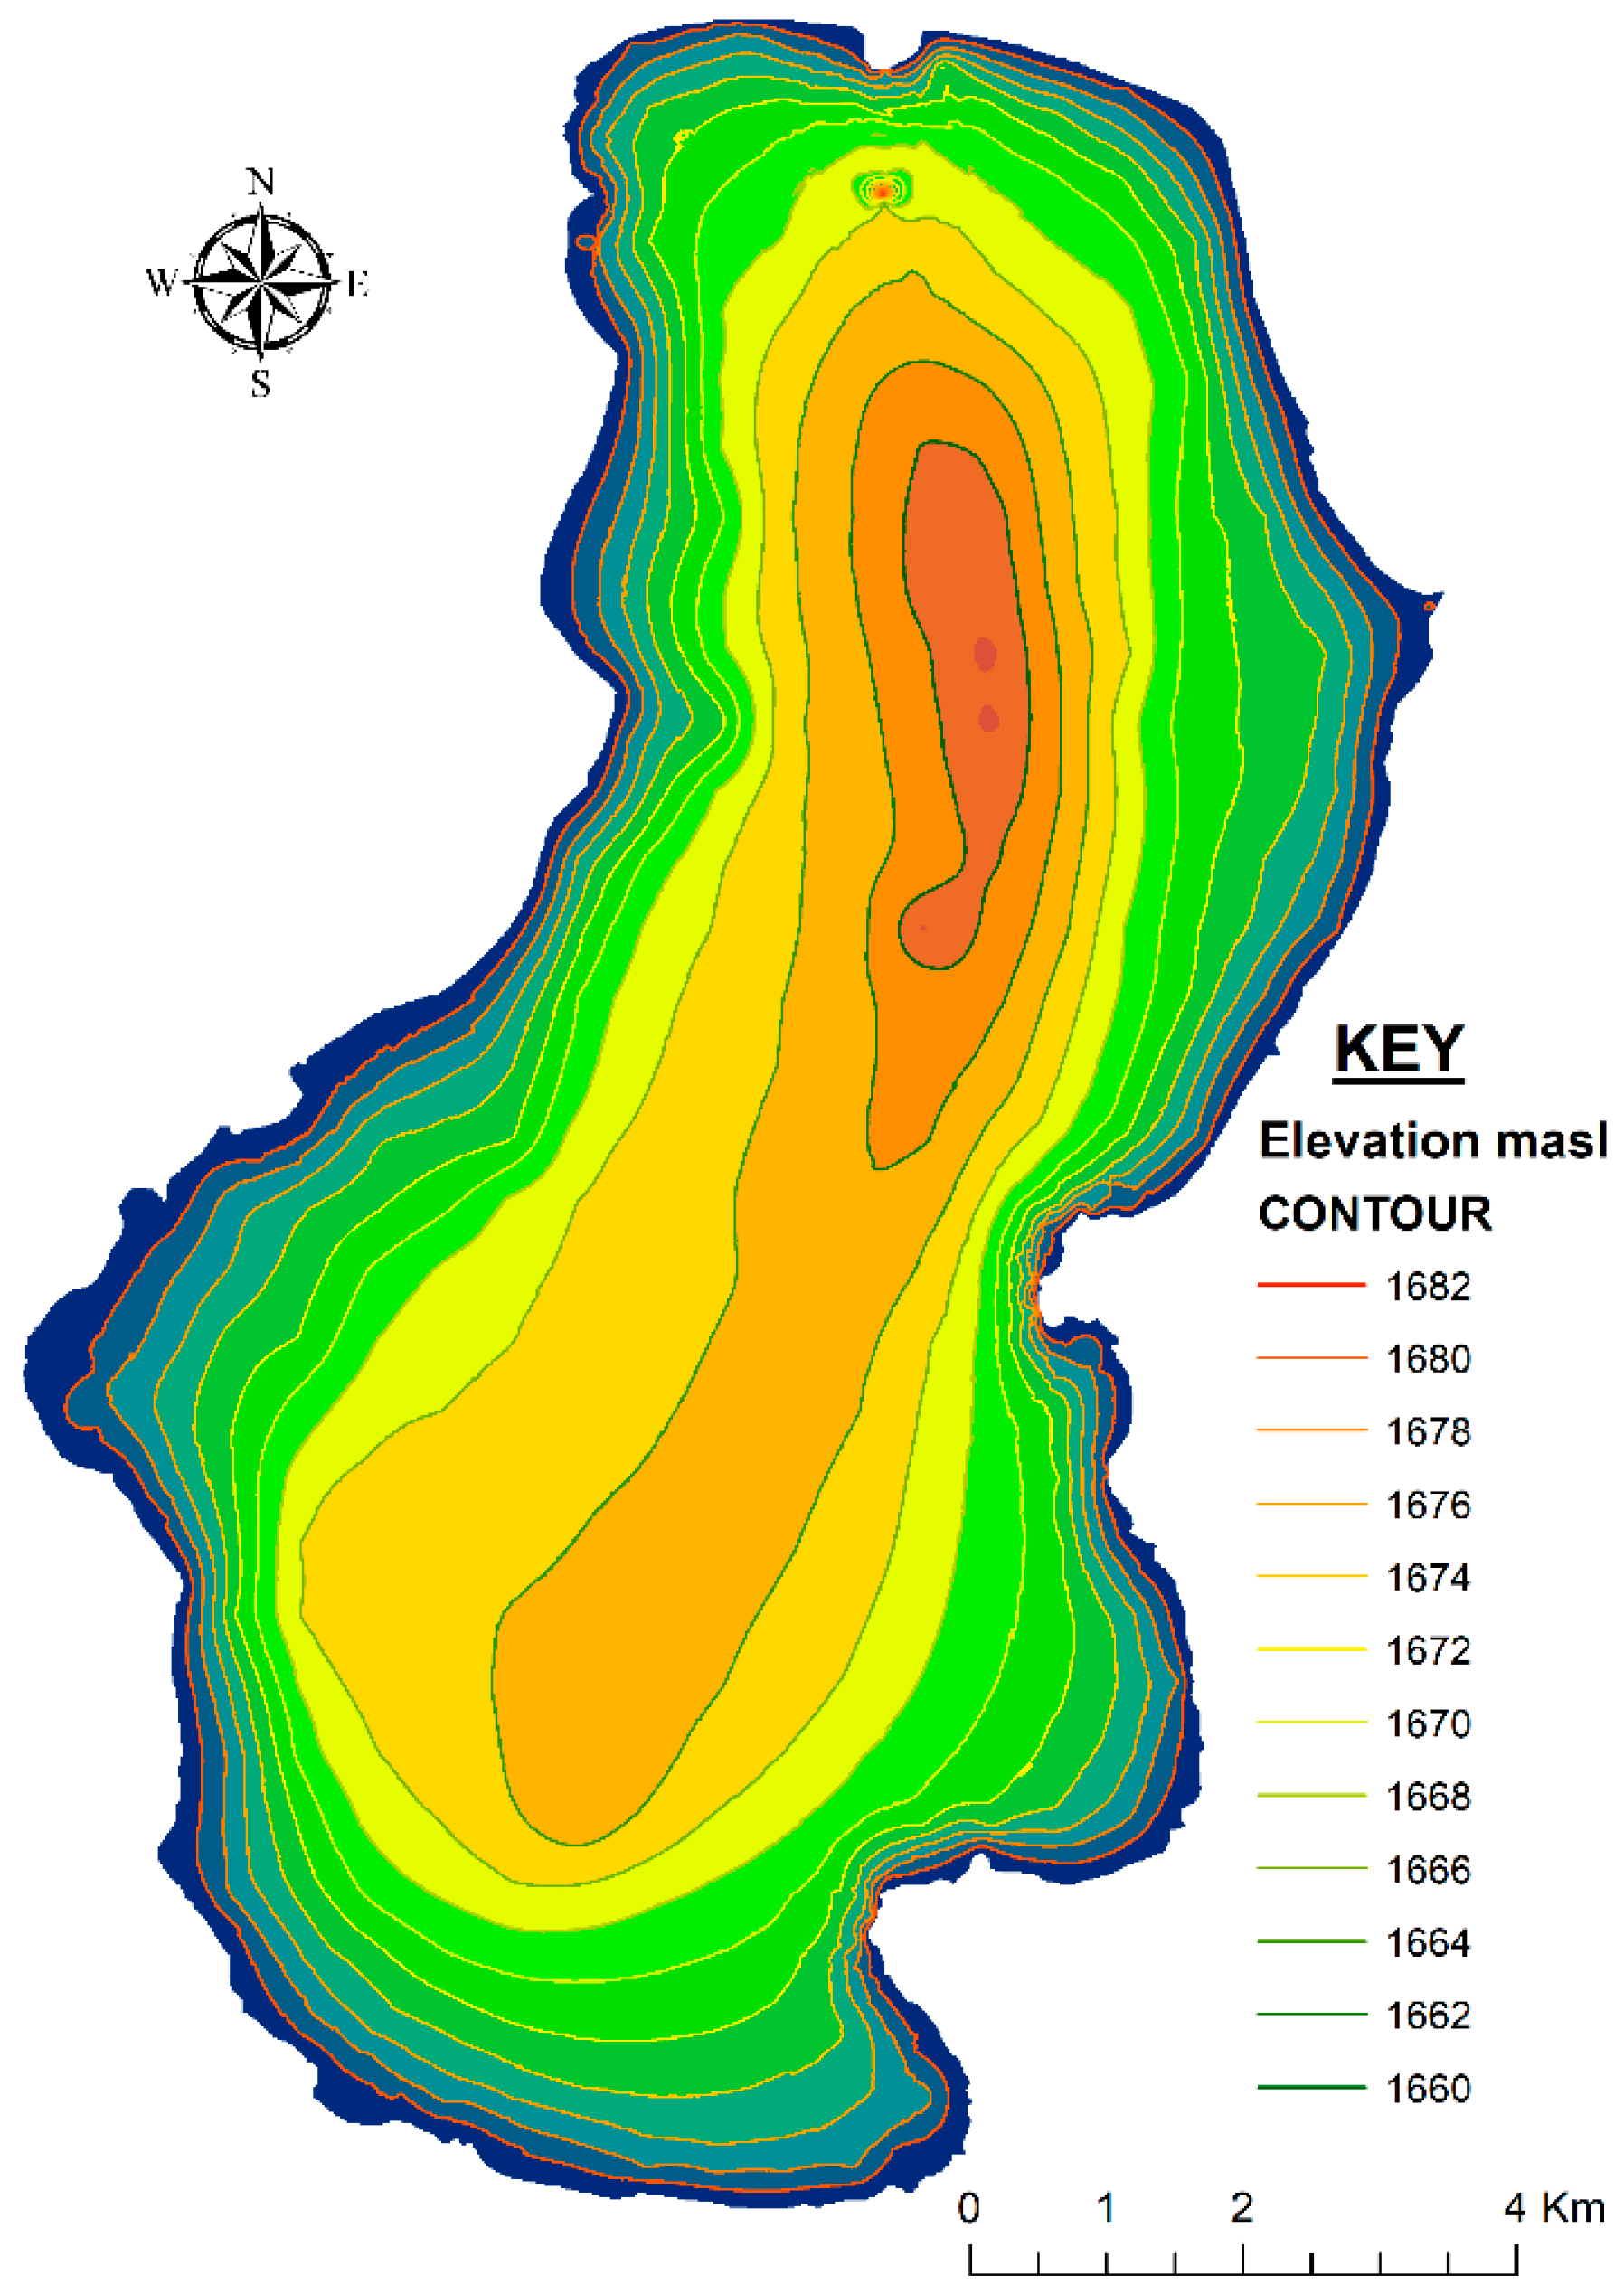
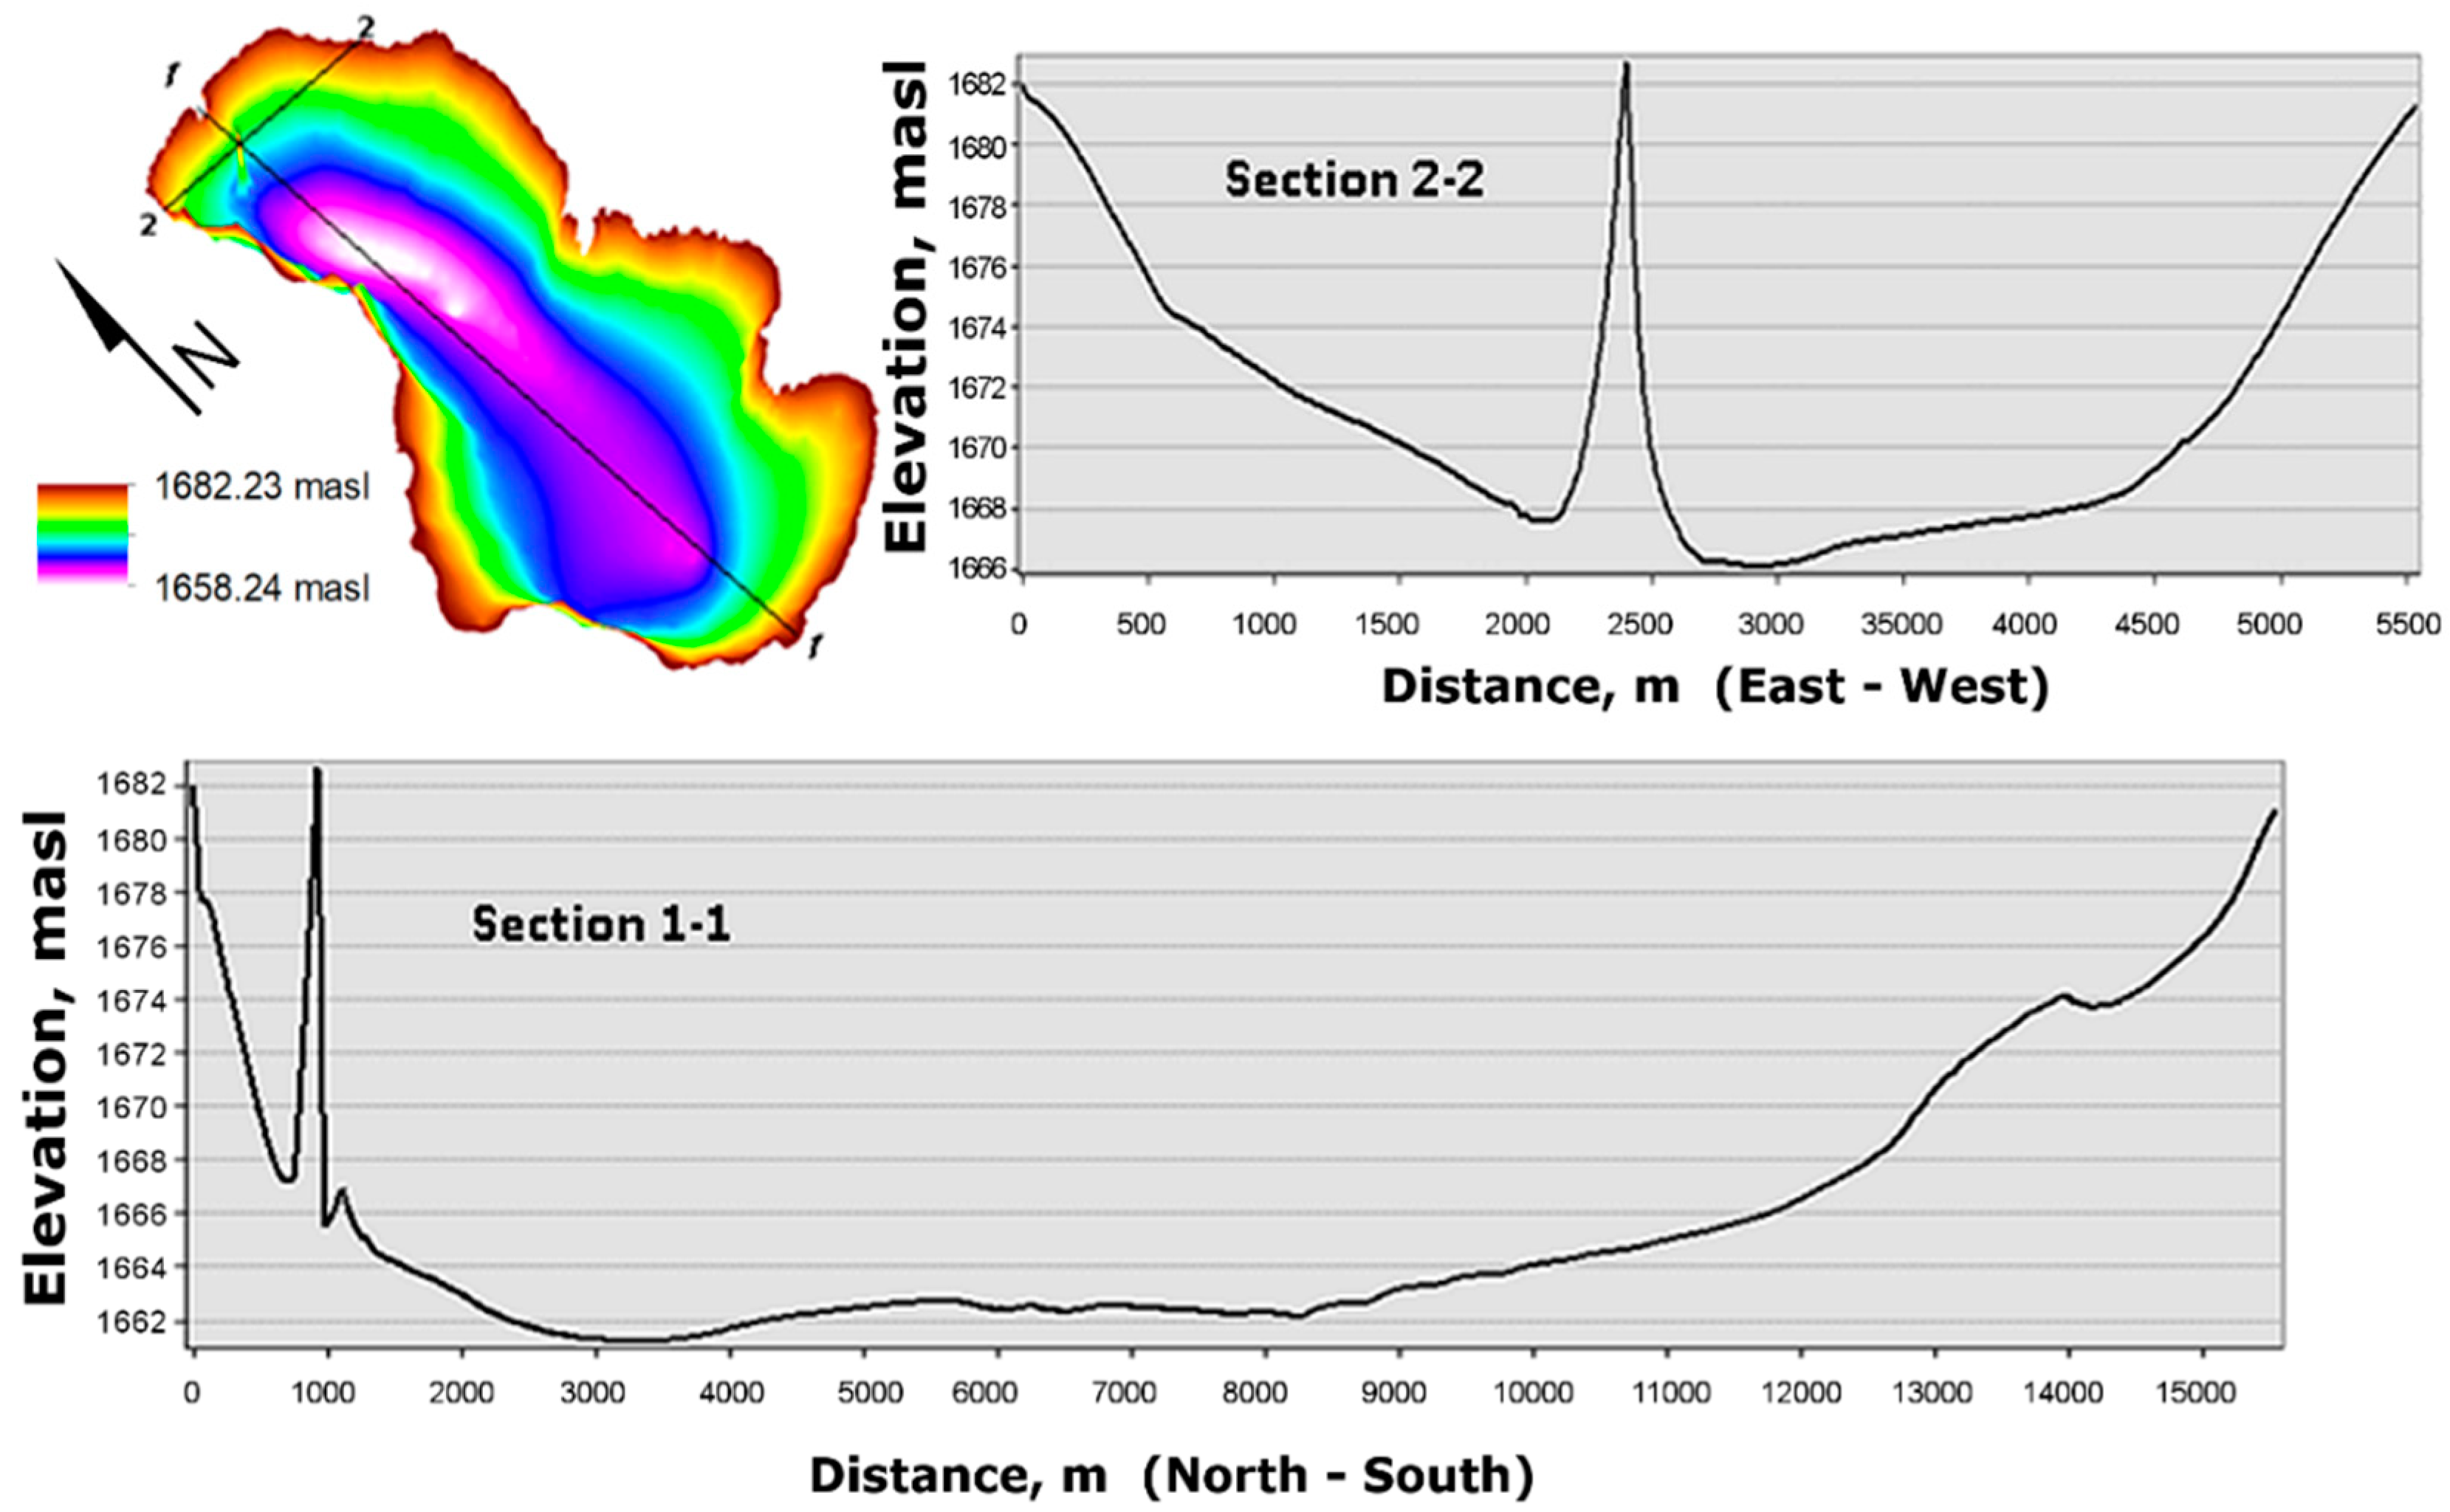
A 10 m resolution hydrographic map of Lake Hawassa (Figure 5) was developed by the kriging interpolation method. The cross-validation analysis (Figure 4b) indicated a very good fit (with standard error (SE) of 0.003, regression coefficient of 1.004, Y-intercept of −6.99 and R2 of 0.987). Examination of the 2011 bathymetric surface model effectively represented interesting characteristics of Lake Hawassa such as the small island in the northern part of the Lake. Vertical profiles of the lake along cross-sections 1-1 and 2-2, both passing through the island, are shown in Figure 6.
3.3. Morphometric Characteristics of Lake Hawassa
Physical parameters of the lake, including depth, volume, area, width and length were derived from the newly constructed bathymetry of 2011 and the reconstructed 1999 bathymetric map (Table 2). As in the NDWI result in 1985, 1999 and 2011, Lake Hawassa’s surface area in the 1999 bathymetric map had decreased in 2011. With the decrease in surface area in 2011, the maximum length, maximum width and mean width of Lake Hawassa decreased from that of 1999 by 110, 470 and 224.48 m, respectively. Conversely, an increase of 3990 m shoreline was observed. Within these years, the volume of Lake Hawassa decreased by about 17%. The volume change percentage was four times more than that of the surface area change. This has resulted in the reduction of the mean depth by 1.86m and lake level by 0.87 m during the same period. The minimum bathymetric elevation remained more or less the same.
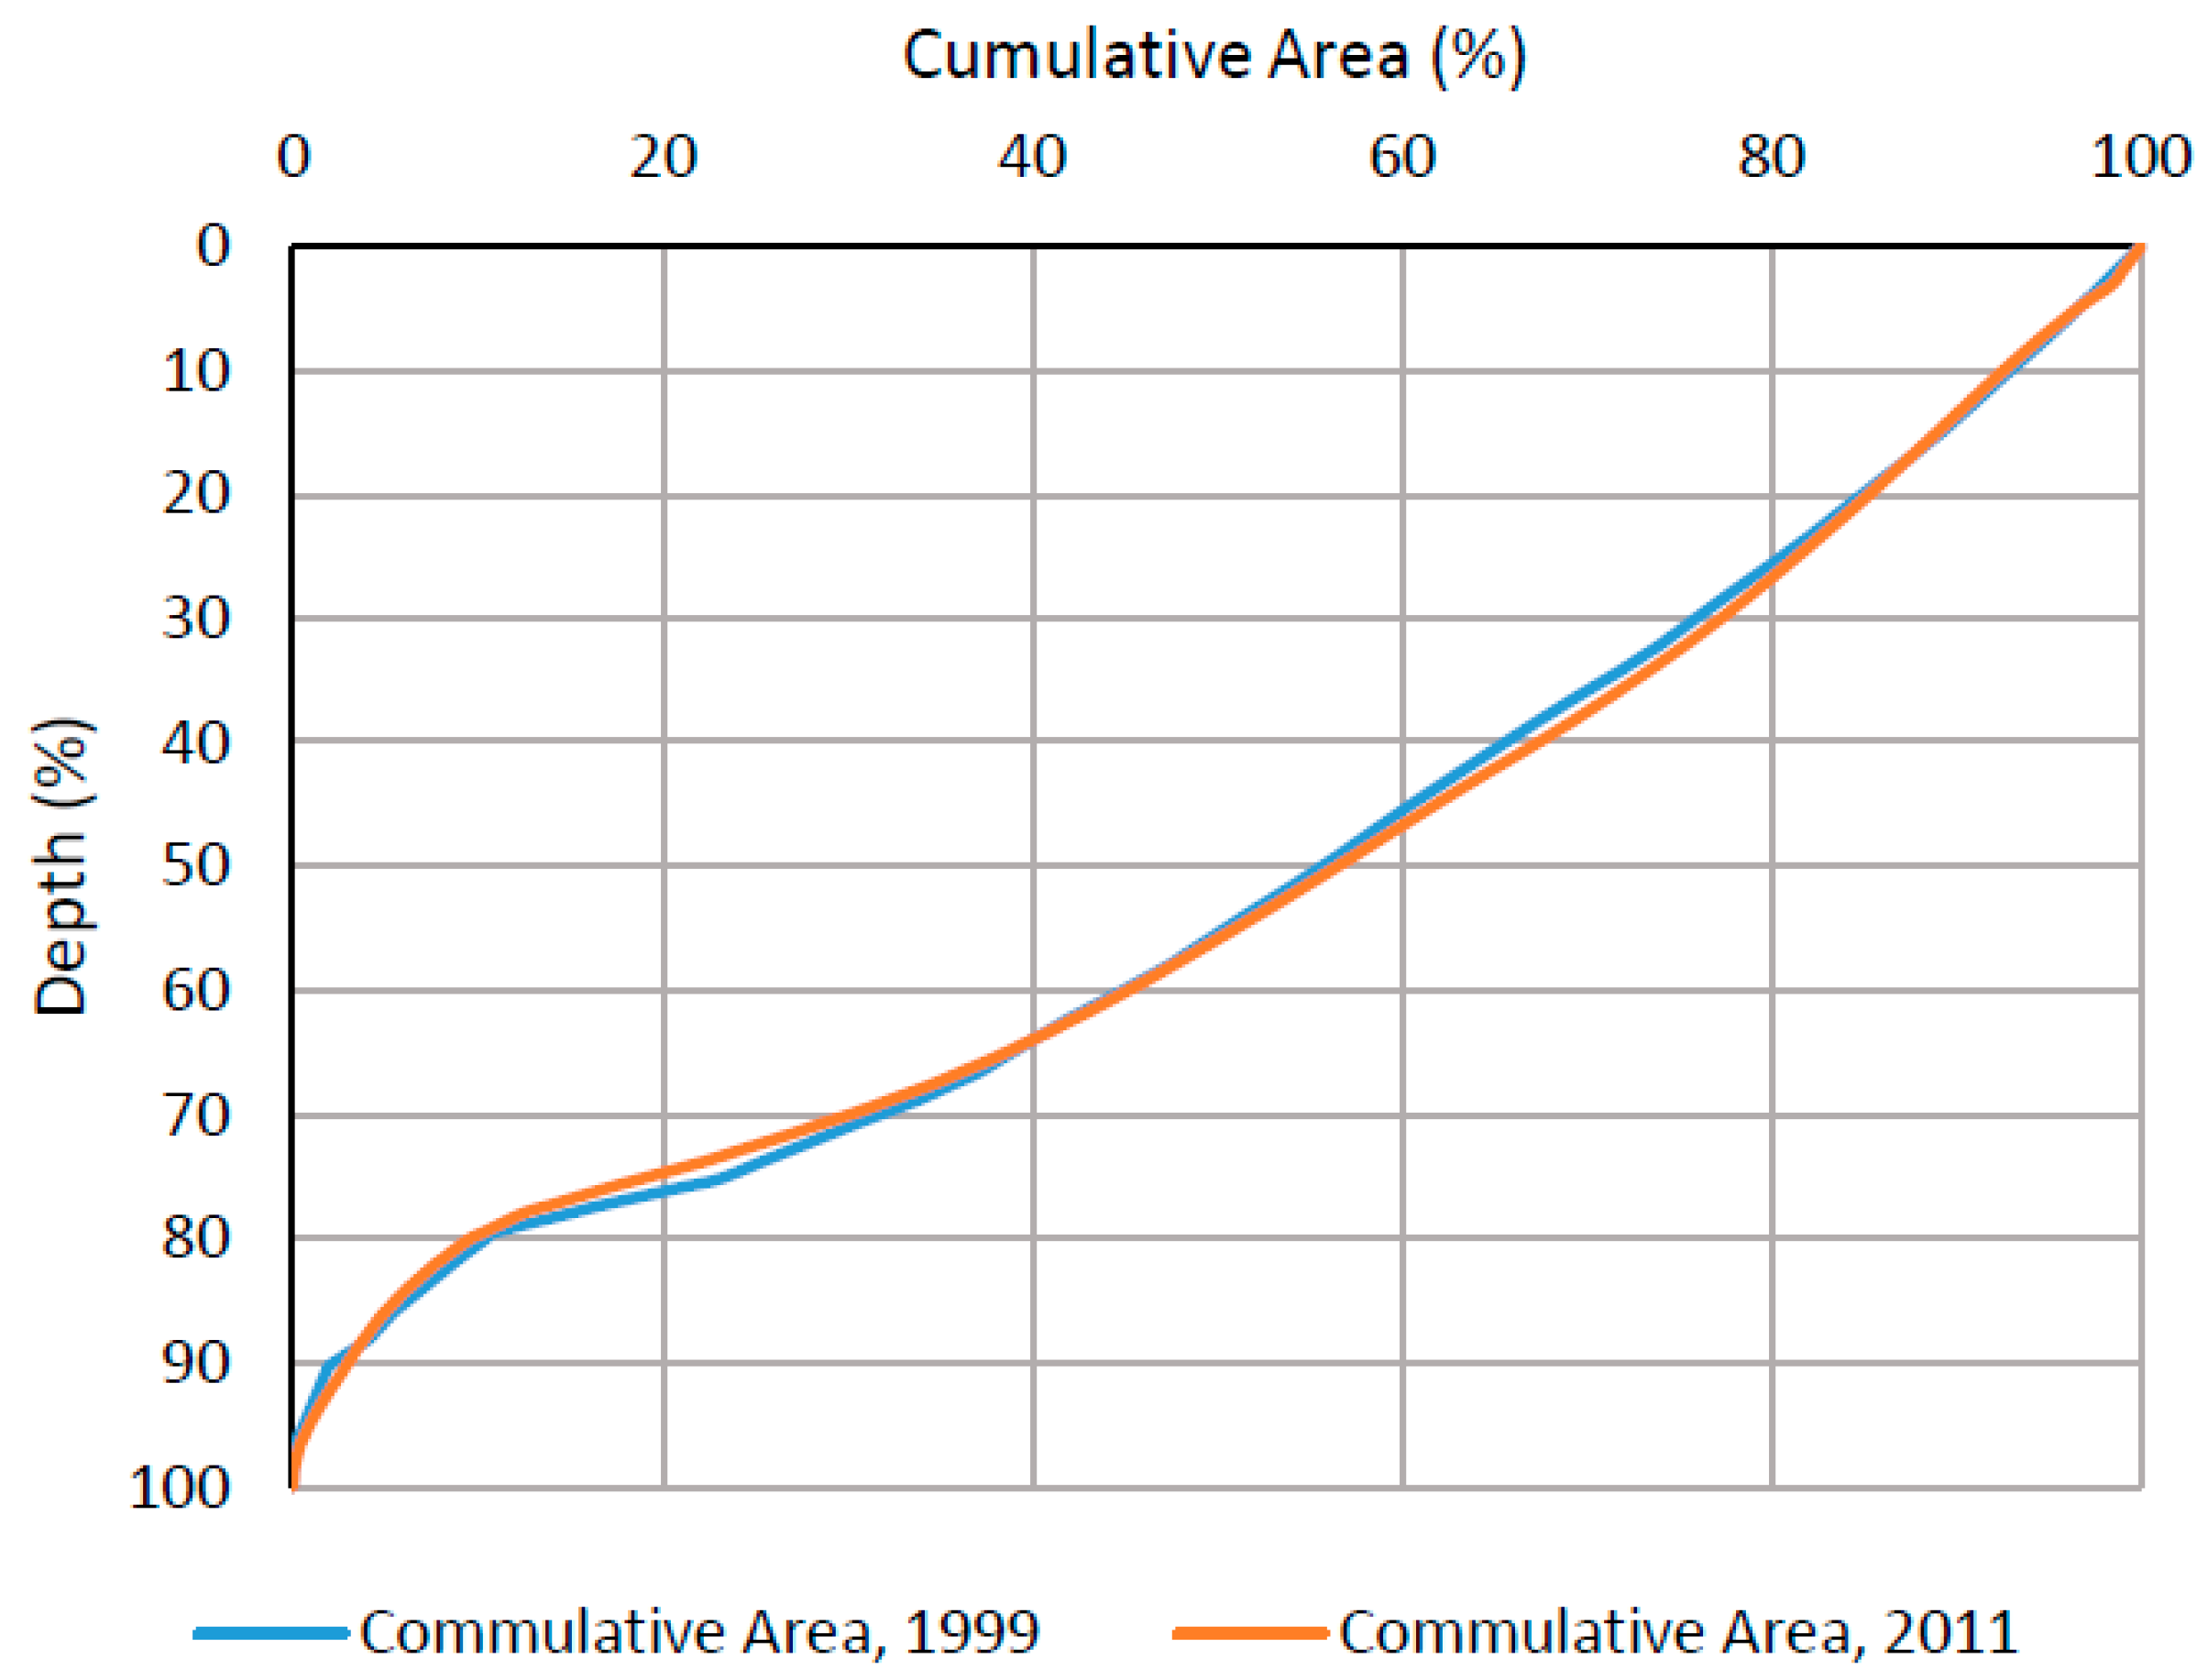
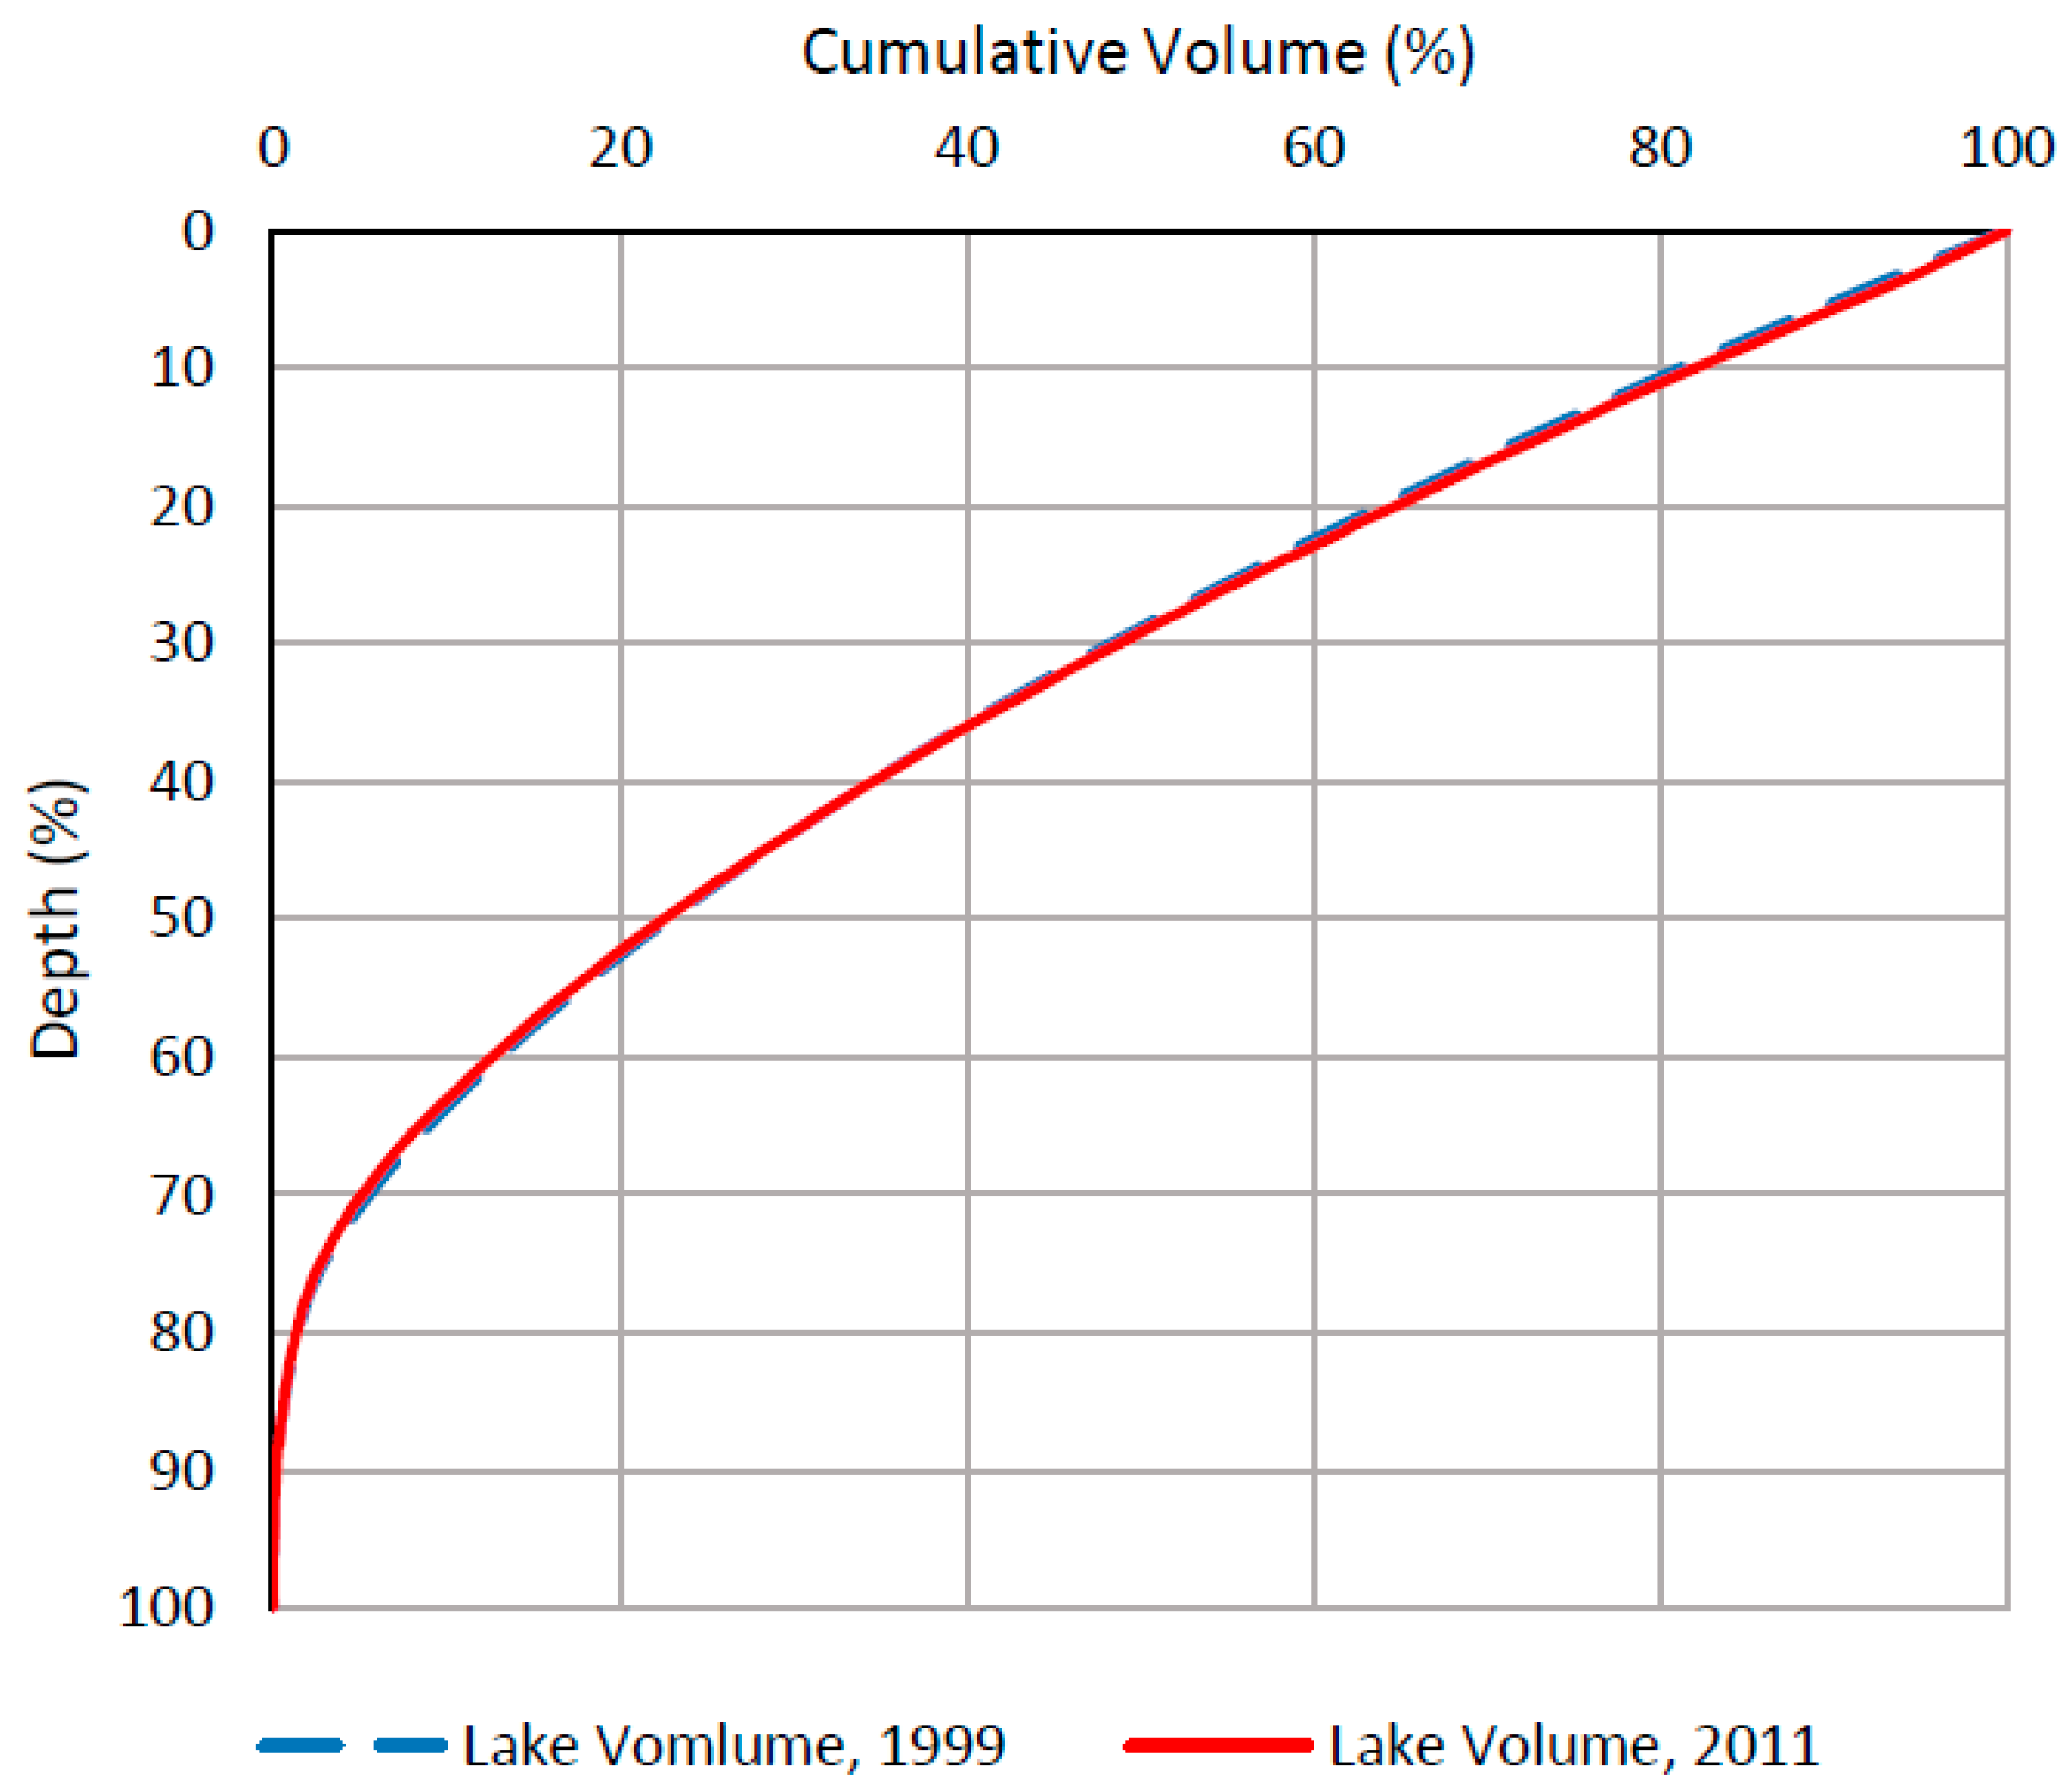
The relative hypsographic curves (Figure 7) show that Lake Hawassa has a concave upper portion and convex lower portion. This may be attributed to sediment movement within the Lake bed. It was also evident from the comparison of the hypsographic curves that in 2011 there was a horizontal cross-sectional area increase in the top 18–50% cumulative depth and a decrease in the bottom 65–88 cumulative depth percentage. Relative cumulative volume curves (Figure 8) depicted volume increase in the top 30% and a decrease between 50–75% of the cumulative depth. The increase in area and volume (as shown by the relative hypsographic and volume graphs) could be explained by the erosion of sides of the walls of the lake bed while the decrease is attributed to the deposition of sediments. The flat shapes of both curves suggest that small depth variation near the top surface results in considerable variation in the volume and surface area of the lake. The magnitudes of the slopes of the curves also suggest that small volumetric increases result in large surface area coverage. This explains the increase in surface area and, thereby, the increase in the perimeter, maximum length and width of Lake Hawassa in 2011.
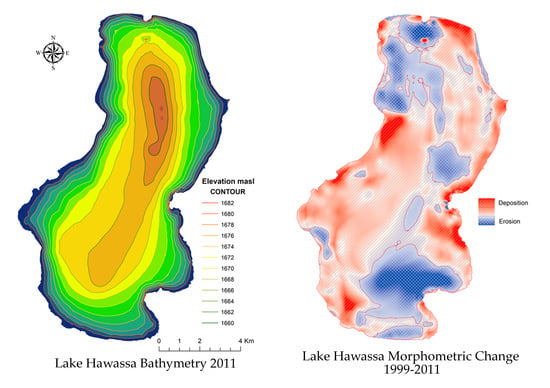
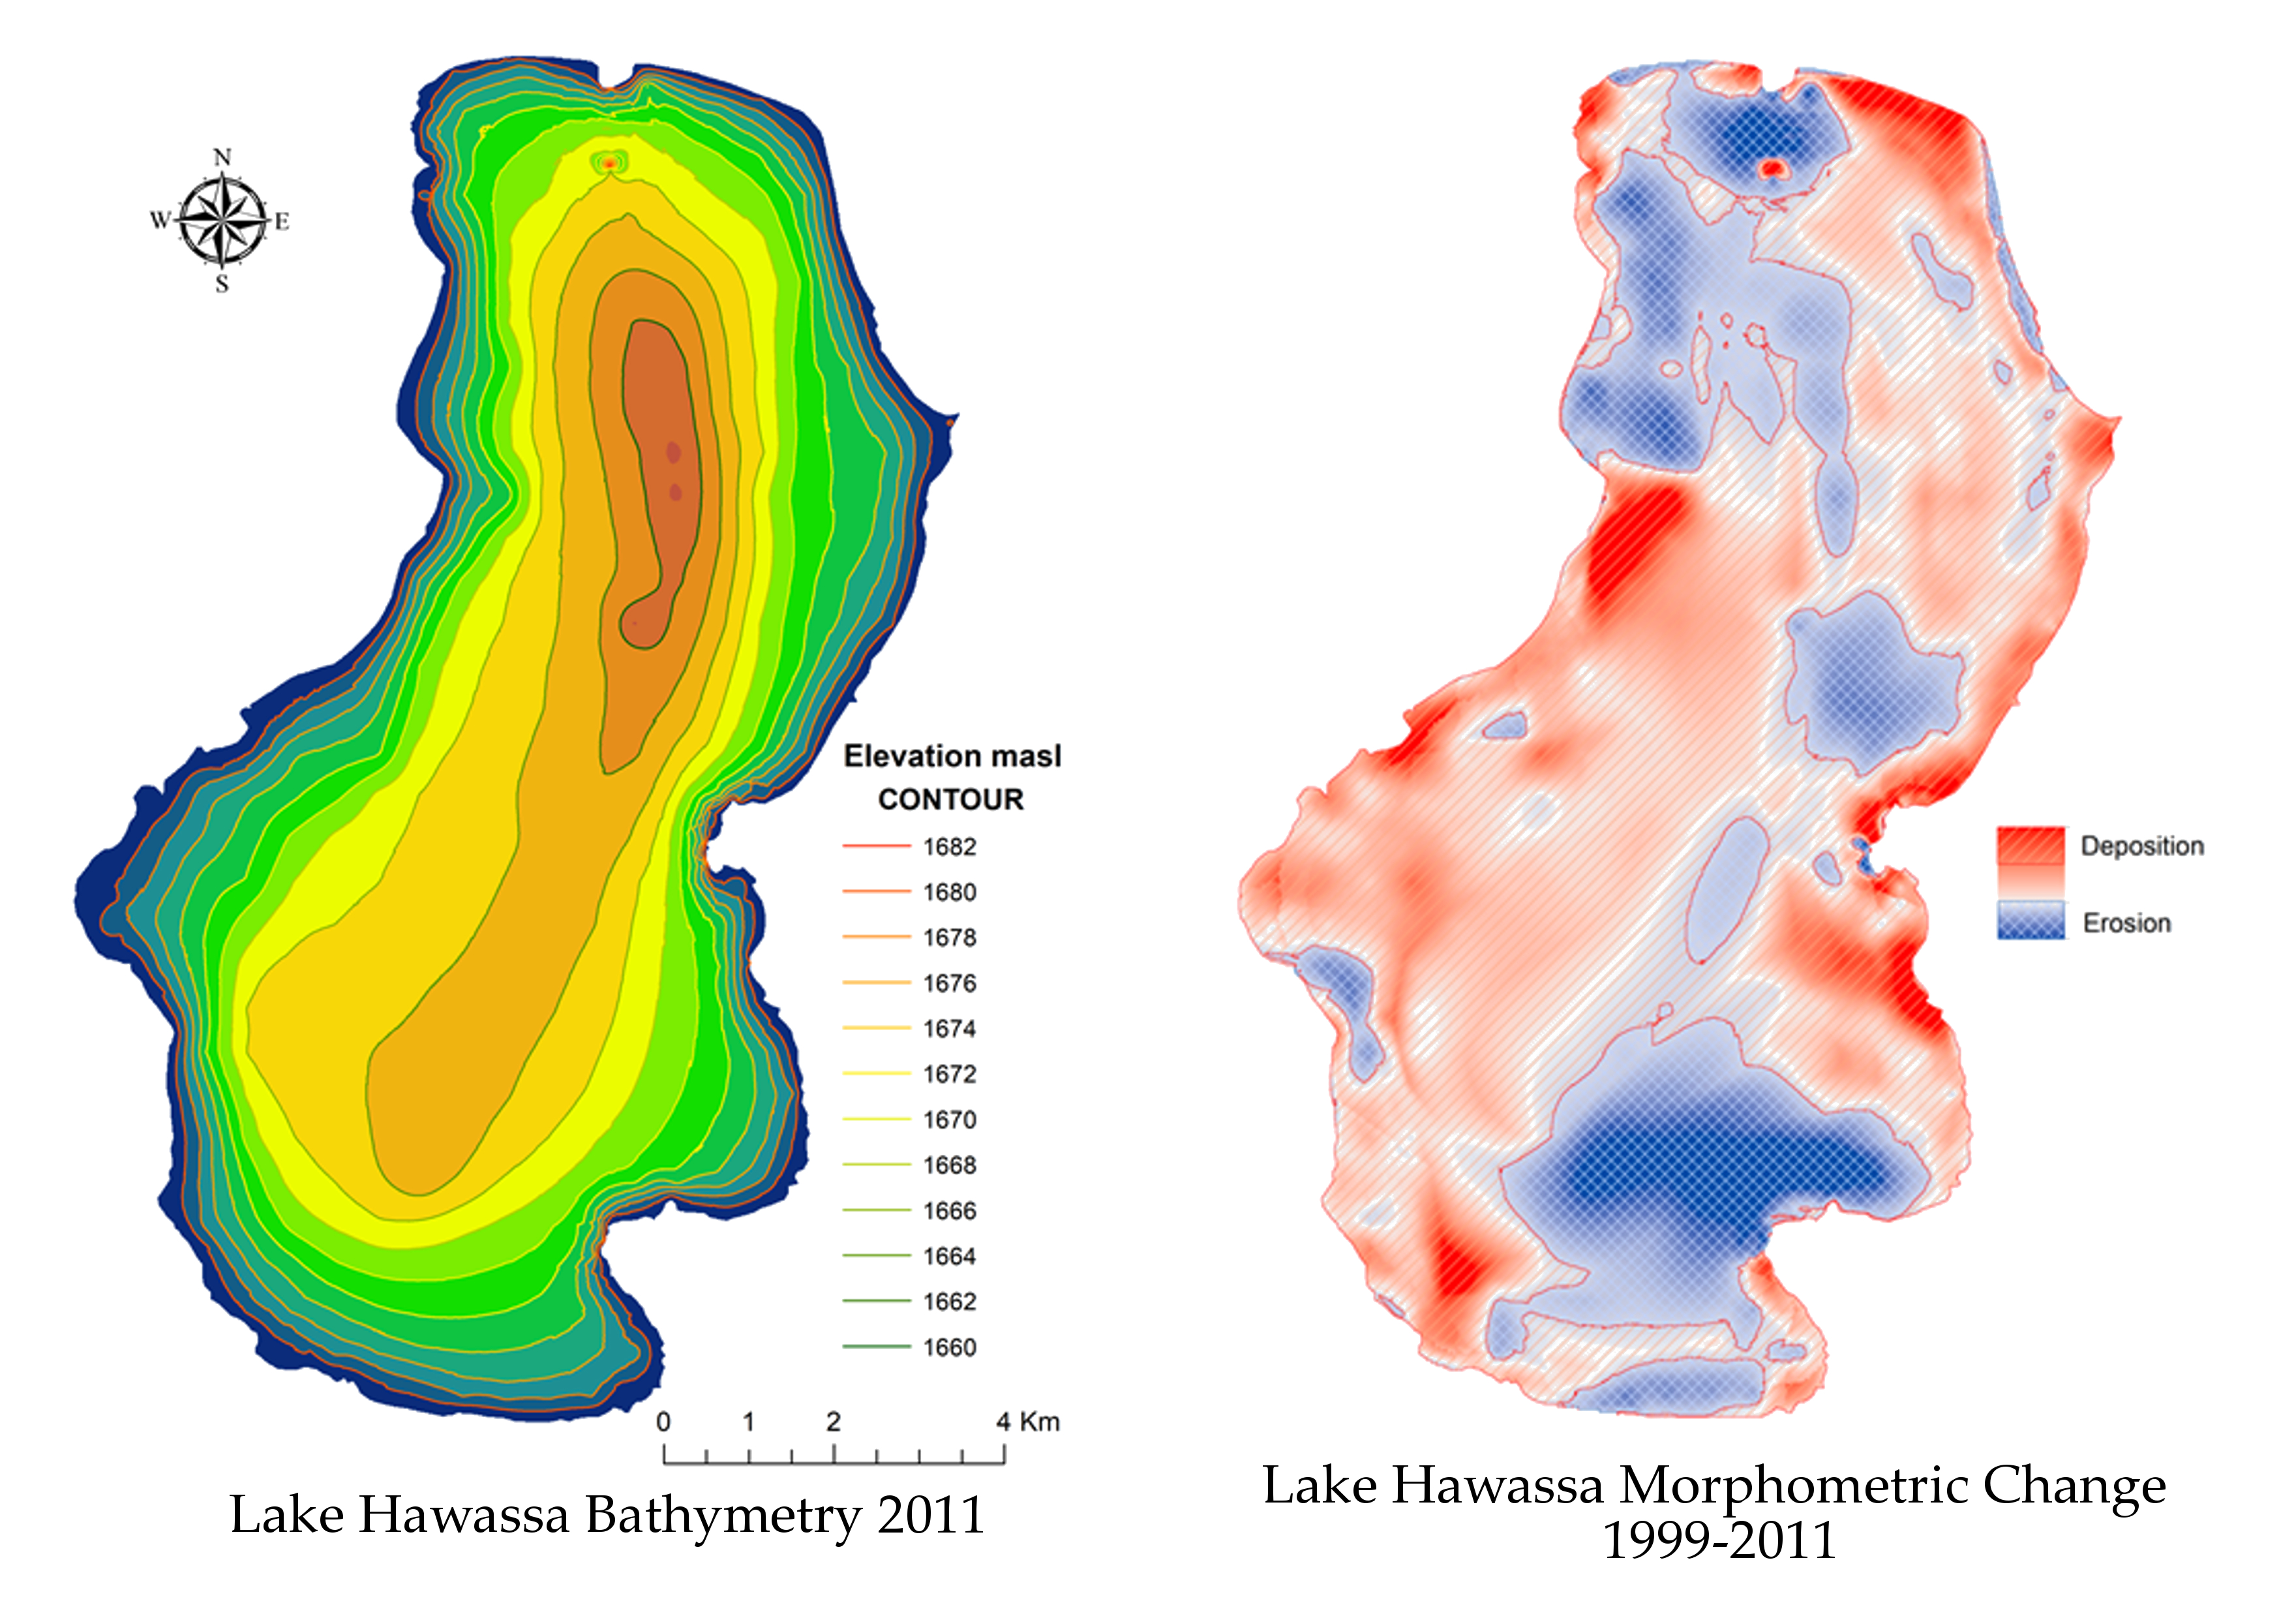
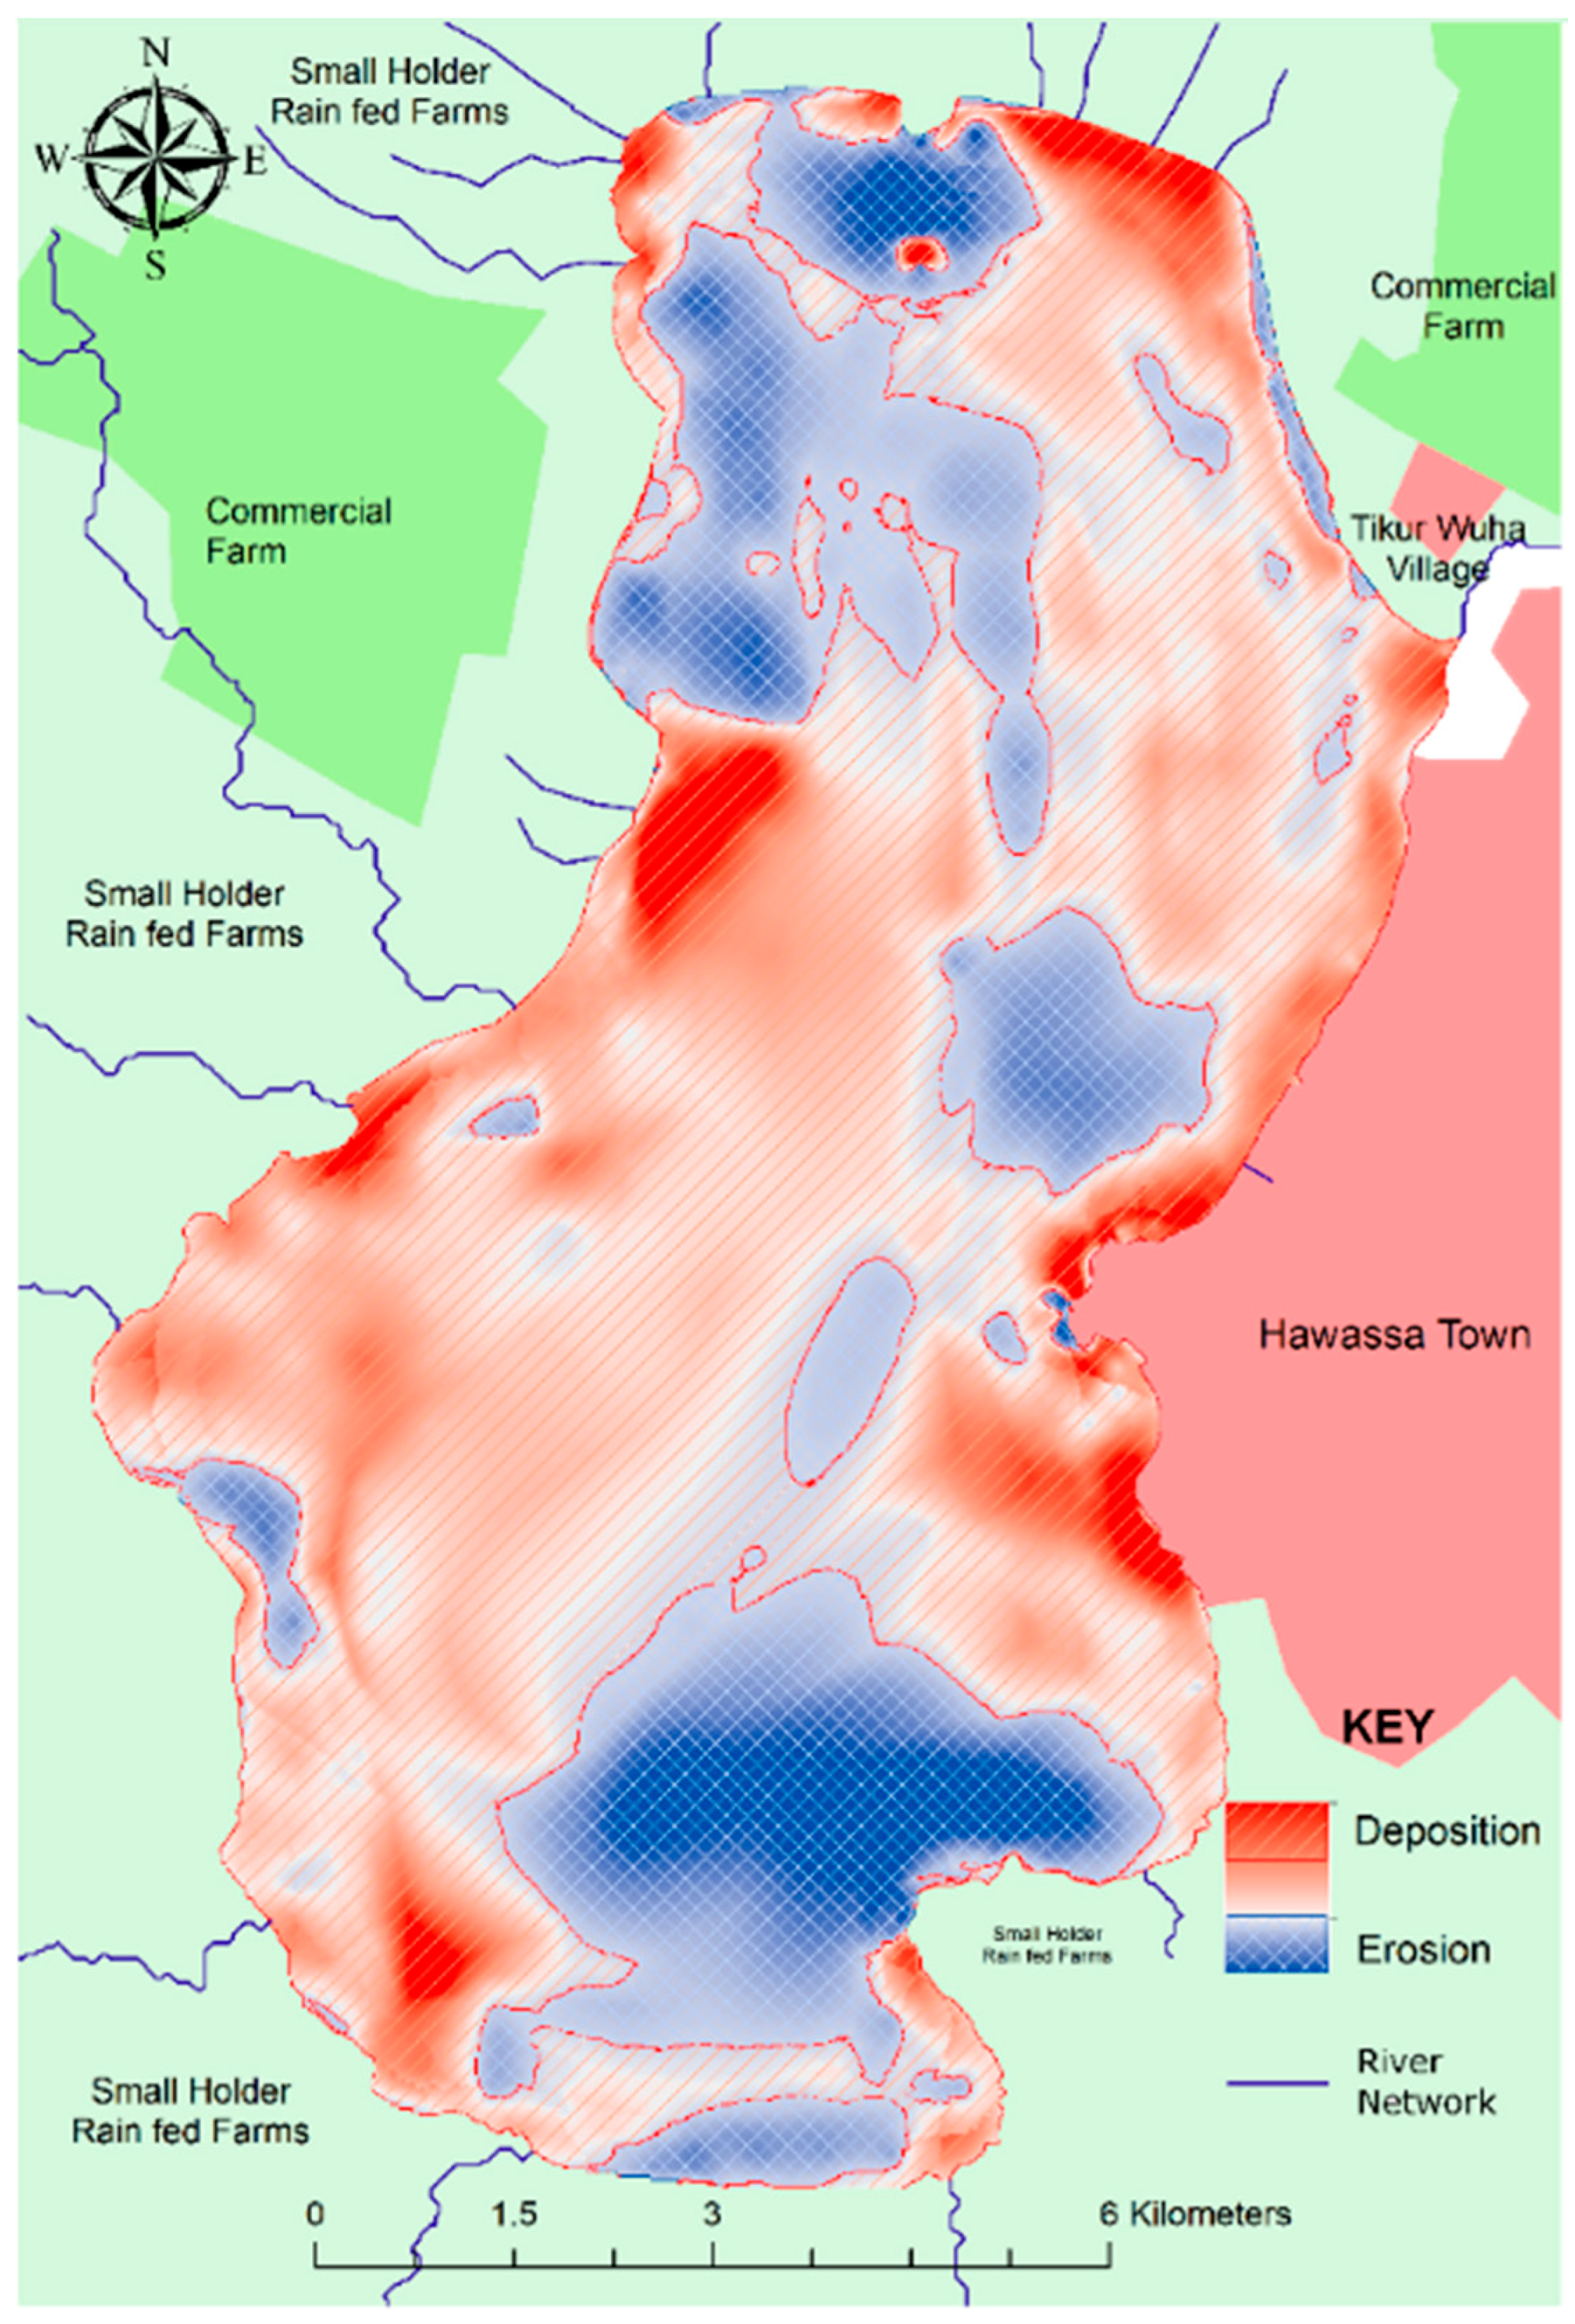
The spatial comparison by differencing the bathymetries (Figure 9) depicted that much of the western and eastern part of the Lake and north-eastern shores had sediment build up. The north-western, south-eastern as well as some central pocket parts of the lake were eroded. This comparison took into account the volume implication due to the island on the 2011 bathymetry. About 77.86 million cubic meters of silt was deposited over the 49 km2 area of the bottom surface. The additional capacity of 31.2 million cubic meters was created by erosion (sediment movement) of the lake bed. Saltation has cut about 46.66 million cubic meters of the lake’s volume, which was about 4% of the volume in 2011. Although deposition was observed over a vast surface of the lake, the northern and southern parts of the lake each accounted for about 11% of the deposition. About 47% of the deposition occurred in the western part, while the remaining 30% was deposited adjacent to Hawassa Town.
4. Discussion
The mNDWI analysis for the images of 1985, 1999 and 2011 showed that Lake Hawassa coverage had an increasing trend up to the late 1990s and a decreasing trend afterwards, while the surface area of Lake Cheleleka decreased to the point of disappearance. Lake Cheleleka lost 5.9 km2 of its surface between the years 1985 and 1999 at a loss rate of 0.422 km2 loss per year. If this rate persisted, the lake would disappear in about four years after 1999. In fact, inspection of Landsat images from 2000–2003 showed the lake completely dried up in the dry season of 2002 indicating the actual rate was even faster. Nonetheless, small inundations still collect sporadically during wet seasons. Between the years 1973 and 1999, Lake Hawassa’s surface area increased by 8.8%, its depth rose by more than 2 m and its volume increased by 17.7% [14]. Most of these changes were observed in the latter years. For instance, substantial surface area increase (7.5%) occurred between 1985 and 1999. Since groundwater levels were influenced by the water levels of the surrounding water bodies [14,15], the increase may also be linked with the significant surface area decrease (87%) in Lake Cheleleka during the same period. In 2011, however, Lake Hawassa seemed to have attained a new equilibrium with lesser surface coverage (3.2%) than in 1985. Regarding the volume of Lake Hawassa, about the same percentages of volume, 17.7% and 17%, were lost between the years 1973–1999 and 1999–2011 respectively. Although the percentages were similar, the rate of volume loss more than doubled between the two time periods.
This study exemplified the importance of bathymetric investigation in that an increase in surface area and lake level may not necessarily increase lake volume. Monitoring the surface of a lake alone may lead to inaccurate conclusions about the state of a lake.
The information derived from the bathymetric investigations has also showed morphometric changes that resulted in volumetric changes of Lake Hawassa during 1999–2011. The changes in morphometry of Lake Hawassa seen in the relative hypsographic and volume curves were also evidently varying with depth. The increase in cross-sectional area at relatively shallow depths (18–50%) could be explained by the erosion of the lake bed with high elevation, while the decreased area at deeper levels (65–88%) was attributed to the deposition of sediments. Correspondingly, the increase in volume in the top 30% and decrease in volume at deeper depths as depicted by the relative volume curves may likewise be attributed to the erosion and deposition of sediments. Although there was erosion and deposition at different parts of the lake bed, Lake Hawassa has lost 50.74 million cubic meters of volume to sedimentation. Saltation to the lake due to land-use change in the catchment has been reported [37]. The overall 4% volumetric decrease in just one decade signifies the importance of catchment management in the watershed.
Three deposition zones, namely the western, northern and eastern, were identified in this study. The northern and eastern zones were dominantly areas of shore development for residential purposes. The town of Hawassa is located on the eastern shore (Figure 9). Reduction in depth in these parts of the lake could be attributed to urban development. The fact that the town’s road network is aligned with the slope of the watershed would easily transport sediment materials via the drainage canals that end up in the lake. The western zone is largely agricultural land where small farms and medium commercial farms are located up the slope. These farms have sparse vegetation cover and are left fallow in the dry season, as they are mainly rain fed, favoring erosion during the rainy season.
During the period 1965 to 1998 agricultural land and urban areas increased from 28.41% to 41.96% and 0.34% to 1.23%, respectively, while the natural vegetation decreased from 47.03% to 37.98% [22]. Natural land-use types such as water body, swamps, grassland and shrub land also decreased in the same period. Land-use assessment for the time span 1973 to 2000 also showed similar trends in urban area development and agriculture expansion, and reduction of the woodlands, water body, grassland and swamps [38]. In 2011, agricultural land, the dominant land-cover type in the watershed, had increased to 56.4% [39]. The anthropogenic (i.e., urban and farm development) factors probably were directly linked to the spatial sediment distribution on the lake bed impacting the morphometry.
However, streamflow, the transporting agent of the silt, may not only be influenced by human activities. Makin et al. [16] reported that in the 1970s surface flow from the northern and western parts of the catchment occasionally reach the lake and runoff contribution was mainly from Tikur Wuha River. Nowadays, huge gullies have emerged especially on the western part of the lake watershed where farming is the dominant activity and where land cracks were recently reported. The importance of tectonic activities in changing the hydrodynamics of the lake, as indicated in [40], may also have resulted in the silting up of the lake. Therefore, the impact of tectonic activities should be studied further.
To mitigate the saltation problem, resulting from the land-use/land-cover changes, appropriate soil and water conservation measures are vital. Best-management practices of minimum tillage, biological and mechanical soil conservation measures, and cover cropping could be applicable to the agricultural areas while the urban sediment issue can be addressed by the proper control of urban development (construction of infrastructures and houses), constructing water and sediment control ponds and stilling basins, especially at the inlets. In light of the spatial distribution of the sediments in the lake bed, watershed management in the catchment requires a thorough investigation.
The 2011 bathymetric and sediment maps can be used in various limnologic, hydrologic and watershed management studies, environmental impact assessment studies, and navigation. The maps also further the spatial database of Lake Hawassa besides proving the goestatistical approach of developing lake bathymetries to be quick and cost effective.
5. Conclusions
The spatial extent of water bodies in the Lake Hawassa watershed and morphometric changes in the lake were investigated in this study. A hydrographic map of Lake Hawassa was prepared from gridded sounding data, GPS data and satellite images using a geostatistical method. The bathymetric surface generated by kriging was utilized to extract information about the lake’s characteristics. The 10 m resolution hydrographic map accurately depicted the features of the lake. Morphometric characteristics of the lake in 2011 were compared with the bathymetric map prepared in 1999 by WWDSE. The latter was reconstructed from the only available four A0-size hand-drawn maps.
The study revealed that there had been morphometric dynamics in Lake Hawassa and the adjoining Lake Cheleleka as a result of natural and anthropogenic activities between the years 1999 and 2011. The surface area of Lake Hawassa increased and later declined while Lake Cheleleka declined to the point of disappearance. Lake Hawassa’s volume and lake level followed a similar trend to the surface area variation. However, the rate of change of lake surface area and volume were not straightforward. Generally, although there was increase in surface area and lake level, the lake volume decreased during the study period. This evidences the importance of bathymetric investigation. Monitoring the surface of a lake alone may lead to inaccurate conclusions about the state of a lake.
In Lake Hawassa, three saltation zones were identified: the northern, eastern and western parts of the lake bed representing their respective parts of the lake watershed. These zones were most probably linked with the anthropogenic factors of farming and urban development contributing to the lake’s morphometric dynamics. These zones should be focus areas for timely interventions on catchment rehabilitation and proper land- and water-management practice to minimize or avert the anthropogenic influences. The changes, however, may not have been solely due to these anthropogenic factors. Tectonic activities may also have potential impacts on the hydrology of the lake which will aggravate the problem. The study demonstrated the use of geostatistical modeling as a timely and cost-effective bathymetric mapping approach.
Author Contributions
The research article is a product of PhD research by Y.A. He is responsible for conceiving, designing, and performing the survey data collection with A.C. and M.D., and analyzing and writing the paper. M.B. and T.A. are supervisors of the PhD research work who contributed substantially in reviewing the write up as did C.A.
Funding
This research was funded by Hawassa University and Norman E. Borlaug Leadership Enhancement in Agriculture Program, spring 2014.
Acknowledgments
The study was supported by the United States Agency for International Development (USAID) under the USAID/HED grant in the Africa-US Higher Education Initiative—HED052-9740-ETH-11-01. The authors are grateful to Southern Peoples Nations and Nationalities Regional State Water Bureau and the Ethiopian Ministry of Water Irrigation and Energy for providing invaluable data. Due thanks also goes to Hawassa University for funding the survey work and Norman Borlaug Leadership Enhancement in Agriculture Program (LEAP) for funding verification works.
Conflicts of Interest
The authors declare no conflict of interest.
References
- Williamson, C.E.; Saros, J.E.; Schindler, D.W. Sentinels of change. Science 2009, 323, 887–888. [Google Scholar] [CrossRef] [PubMed]
- Ławniczak, A.E.; Choiński, A.; Kurzyca, I. Dynamics of Lake Morphometry and Bathymetry in Various Hydrological Conditions. Polish J. Environ. Stud. 2011, 20, 931–940. [Google Scholar]
- Williamson, C.E.; Saros, J.E.; Vincent, W.F.; Smol, J.P. Lakes and reservoirs as sentinels, integrators, and regulators of climate change. Limnol. Oceanogr. 2009, 54, 2273–2282. [Google Scholar] [CrossRef]
- Adrian, R.; O’Reilly, C.M.; Zagarese, H.; Baines, S.B.; Hessen, D.O.; Keller, W.; Livingstone, D.M.; Sommaruga, R.; Straile, D.; Van Donk, E. Lakes as sentinels of climate change. Limnol. Oceanogr. 2009, 54, 2283–2297. [Google Scholar] [CrossRef] [PubMed] [Green Version]
- Hakanson, L. A Manual of Lake Morphometry; Springer-Verlag: Berlin/Heidelberg, Germany, 1981. [Google Scholar]
- Sandwell, D.T.; Smith, W.H. Bathymetric estimation. In Satellite Altimetry and Earth Sciences: A Handbook of Techniques and Applications; Fu, L.-L., Cazenave, A., Eds.; Academic Press: San Diego, CA, USA, 2000; pp. 441–457. [Google Scholar]
- Schäfer, A.E.; Marchett, C.A.; Schuh, S.M.; Ahlert, S.; Lanzer, R.M. Morphological characterization of eighteen lakes of the north and middle coast of Rio Grande do Sul, Brazil. Acta Limnol. Bras. 2014, 26, 199–214. [Google Scholar] [CrossRef]
- Foxgrover, A.C.; Higgins, S.A.; Ingraca, M.K.; Jaffe, B.E.; Smith, R.E. Deposition, Erosion, and Bathymetric Change in South San Francisco Bay: 1858–1983; 2004-1192; U.S. Geological Survey: Reston, VA, USA, 2004; p. 25.
- Fregoso, T.A.; Foxgrover, A.C.; Jaffe, B.E. Sediment Deposition, Erosion, and Bathymetric Change in Central San Francisco Bay: 1855–1979; 2331-1258; U.S. Geological Survey: Reston, VA, USA, 2008.
- Jaffe, B.; Foxgrover, A.C. Sediment Deposition and Erosion in South San Francisco Bay, California from 1956 to 2005; U.S. Geological Survey: Reston, VA, USA, 2006.
- Jaffe, B.E.; Smith, R.E.; Foxgrover, A.C. Anthropogenic influence on sedimentation and intertidal mudflat change in San Pablo Bay, California: 1856–1983. Estuar. Coast. Shelf Sci. 2007, 73, 175–187. [Google Scholar] [CrossRef]
- Jaffe, B.E.; Smith, R.E.; Torresan, L.Z. Sedimentation and Bathymetric Change in San Pablo Bay, 1856–1983; 2331-1258; U.S. Geological Survey: Reston, VA, USA, 1998.
- Thompson, D.M.; Plant, N.G.; Hansen, M.E. Analysis of Bathymetric Surveys to Identify Coastal Vulnerabilities at Cape Canaveral, Florida; 2331-1258; U.S. Geological Survey: Reston, VA, USA, 2015.
- Water Works Design and Supervision Enterprise. The Study of Lake Awassa Level Rise; Southern Nations Nationalities and Peoples Regional State: Adiss Ababa, Ethiopia, 2001. [Google Scholar]
- Belete, M.D.; Diekkrüger, B.; Roehrig, J. Linkage between water level dynamics and climate variability: The case of Lake Hawassa hydrology and ENSO phenomena. Climate 2017, 5, 21. [Google Scholar] [CrossRef]
- Makin, M.J.; Kingham, T.; Waddams, A.; Birchall, C.; Teferra, T. Development Prospects in the Southern Rift Valley, Ethiopia; 21; Ministry of Overseas Development: Surrey, UK, 1975. [Google Scholar]
- Ayalew, L.; Yamagishi, H.; Reik, G. Ground cracks in Ethiopian Rift Valley: Facts and uncertainties. Eng. Geol. 2004, 75, 309–324. [Google Scholar] [CrossRef]
- Abiye, T.A. Environmental resources and recent impacts in the Awassa collapsed caldera, Main Ethiopian Rift. Quat. Int. 2008, 189, 152–162. [Google Scholar] [CrossRef]
- Gebremariam, Z. The Ethiopian Rift Valley lakes: Major threats and strategies for conservation. In Ethiopian Rift Valley Lakes; Tudorancea, C., Taylor, W.D., Eds.; Backhuys: Leiden, The Netherlands, 2002; pp. 259–271. [Google Scholar]
- Lemma, A. Site Action Plan for the Conservation and Sustainable Use of Lake Awassa Biodiversity; Institute of Biodiversity Conservation: Addis Ababa, Ethiopia, 2005. [Google Scholar]
- Tilahun, N. Numerical Ground-Water Flow Modeling of the Awassa Catchment; Addis Ababa University: Adiss Ababa, Ethiopia, 2006. [Google Scholar]
- Shewangizaw, D.; Michael, Y. Assessing the Effect of Land Use Change on the Hydraulic Regime of Lake Awassa. Nile Basin Water Sci. Eng. J. 2010, 3, 110–118. [Google Scholar]
- Awulachew, S.B. Investigation of physical and bathymetric characteristics of Lakes Abaya and Chamo, Ethiopia, and their management implications. Lakes Reserv. Res. Manag. 2006, 11, 133–140. [Google Scholar] [CrossRef]
- Ayenew, T. Natural Lakes of Ethiopia; Addis Ababa University Press: Addis Ababa, Ethiopia, 2009. [Google Scholar]
- Awulachew, S.B.; Yilma, A.D.; Loulseged, M.; Loiskandl, W.; Ayana, M.; Alamirew, T. Water Resources and Irrigation Development in Ethiopia; Iwmi: Colombo, Sri Lanka, 2007; Volume 123. [Google Scholar]
- Gebreegziabher, Y. Assessment of the Water Balance of Lake Awassa Catchment, Ethiopia; ITC: Enschede, The Netherlands, 2005. [Google Scholar]
- USGS Earth Explorer Website. Available online: https://earthexplorer.usgs.gov/ (accessed on 15 July 2014).
- Dellepiane, S.; De Laurentiis, R.; Giordano, F. Coastline extraction from SAR images and a method for the evaluation of the coastline precision. Pattern Recognit. Lett. 2004, 25, 1461–1470. [Google Scholar] [CrossRef]
- Xu, H. Modification of normalised difference water index (NDWI) to enhance open water features in remotely sensed imagery. Int. J. Remote Sens. 2006, 27, 3025–3033. [Google Scholar] [CrossRef]
- Journel, A.G.; Huijbregts, C.J. Mining Geostatistics; Academic Press: Cambridge, MA, USA, 1978. [Google Scholar]
- Trangmar, B.B.; Yost, R.S.; Uehara, G. Application of geostatistics to spatial studies of soil properties. Adv. Agron. 1986, 38, 45–94. [Google Scholar]
- Webster, R.; Oliver, M.A. Geostatistics for Environmental Scientists; John Wiley & Sons Ltd.: West Sussex, UK, 2007. [Google Scholar]
- Gamma Design Software. GS+: Geostatistics for the Environmental Sciences, version 7.0; Gamma Design Software: Plainwell, MI, USA, 2004. [Google Scholar]
- Verfaillie, E.; Van Lancker, V.; Van Meirvenne, M. Multivariate geostatistics for the predictive modelling of the surficial sand distribution in shelf seas. Cont. Shelf Res. 2006, 26, 2454–2468. [Google Scholar] [CrossRef]
- Burrough, P.; McDonnell, R. Principles of Geographical Information Systems; Oxford University Press Inc.: Oxford, UK, 1998. [Google Scholar]
- Davidović, M.; Petrović, V.M.; Borisov, M. Analysis of the Display of Digital Terrain Models using Different Interpolation Methods. Geodetski List 2016, 70, 267–282. [Google Scholar]
- Ayenew, T.; Tilahun, N. Assessment of lake–groundwater interactions and anthropogenic stresses, using numerical groundwater flow model, for a Rift lake catchment in central Ethiopia. Lakes Reserv. Res. Manag. 2008, 13, 325–343. [Google Scholar] [CrossRef]
- Abrha, L. Assessing the Impact of Land Use and Land Cover Change on Ground Water Recharge Using RS and GIS: A Case of Awassa Catchment, South Ethiopia. Master’s Thesis, Addis Ababa University, Addis Ababa, Ethiopia, 2007. [Google Scholar]
- Wondrade, N.; Dick, Ø.B.; Tveite, H. GIS based mapping of land cover changes utilizing multi-temporal remotely sensed image data in Lake Hawassa Watershed, Ethiopia. Environ. Monit. Assess. 2014, 186, 1765–1780. [Google Scholar] [CrossRef] [PubMed]
- Ayenew, T.; Becht, R. Comparative study of the hydrology and hydrogeology of selected Ethio-Kenyan-rift lakes. Catch. Lake Res. LARS 2007, 144–147. [Google Scholar]
Figure 1.
Location map of Lake Hawassa and Lake Cheleleka.

Figure 2.
Water Works Design and Supervision Enterprise 1999 bathymetric map. (a) Original scanned map; (b) reconstructed map.
Figure 2.
Water Works Design and Supervision Enterprise 1999 bathymetric map. (a) Original scanned map; (b) reconstructed map.

Figure 3.
Normalized difference water index (NDWI) shoreline detection map.

Figure 4.
Spatial dataset. (a) Grid of sampling points; (b) cross-validation analysis graph.

Figure 5.
Bathymetric map of Lake Hawassa (January 2011).

Figure 6.
Vertical cross-section and 3D representation of Lake Hawassa.

Figure 7.
Lake Hawassa relative hypsographic curves.

Figure 8.
Lake Hawassa relative volume curve.

Figure 9.
Lake Hawassa erosion and sediment deposition areas.


Table 1.
Lake area and shore length from 1985, 1999 and 2011 Landsat images.
| Date | Lake Surface Area (SqKm) | Shore Length (Km) | ||
|---|---|---|---|---|
| Hawassa | Cheleleka | Hawassa | Cheleleka | |
| January 1985 | 90.13 | 7.25 | 54.683 | 42.309 |
| January 1999 | 96.85 | 1.34 | 54.606 | 37.281 |
| January 2011 | 93.01 | 0.0135 | 57.936 | 0.925 |
Table 2.
Morphometric characteristics of Lake Hawassa.
| No | Period | Elevation (masl) | Area (km2) | Volume (MCM) | Length L Max (km) | Width W Max (km) | Width Mean (km) | Shore Line SL (km) | Depth Mean (m) | Depth Max D (m) | Relative Depth Dr (m) |
|---|---|---|---|---|---|---|---|---|---|---|---|
| 1 | 1973 † | 1679.79 | 92.00 | 1152.16 | 15.75 | 8.75 | 5.841 | 46.75 | 12.52 | 21.09 | 0.195 |
| 2 | 1999 † | 1681.92 | 100.00 | 1356.12 | 17.12 | 9.51 | 5.841 | 52.84 | 13.56 | 23.22 | 0.206 |
| 3 | 1999 †† | 1681.92 | 97.25 | 1174.61 | 16.05 | 9.02 | 6.059 | 50.69 | 12.08 | 23.22 | 0.209 |
| 4 | 2011 | 1681.05 | 93.01 | 1123.87 | 15.94 | 8.55 | 5.835 | 54.68 | 12.08 | 23.34 | 0.215 |
† Adopted from the Study of Lake Hawassa Level Rise [14]. †† Reconstructed 1999 bathymetry.
© 2018 by the authors. Licensee MDPI, Basel, Switzerland. This article is an open access article distributed under the terms and conditions of the Creative Commons Attribution (CC BY) license (http://creativecommons.org/licenses/by/4.0/).
Share and Cite
MDPI and ACS Style
Abebe, Y.; Bitew, M.; Ayenew, T.; Alo, C.; Cherinet, A.; Dadi, M. Morphometric Change Detection of Lake Hawassa in the Ethiopian Rift Valley. Water 2018, 10, 625. https://doi.org/10.3390/w10050625
AMA Style
Abebe Y, Bitew M, Ayenew T, Alo C, Cherinet A, Dadi M. Morphometric Change Detection of Lake Hawassa in the Ethiopian Rift Valley. Water. 2018; 10(5):625. https://doi.org/10.3390/w10050625
Chicago/Turabian StyleAbebe, Yonas, Menberu Bitew, Tenalem Ayenew, Clement Alo, Assegid Cherinet, and Mulugeta Dadi. 2018. "Morphometric Change Detection of Lake Hawassa in the Ethiopian Rift Valley" Water 10, no. 5: 625. https://doi.org/10.3390/w10050625
Note that from the first issue of 2016, this journal uses article numbers instead of page numbers. See further details here.