Estimation of Future Probable Maximum Precipitation in Korea Using Multiple Regional Climate Models


1
Division of Earth Environmental System Science (Major of Environmental Engineering), Pukyong National University, Busan 48513, Korea
2
Department of Environmental Engineering, Pukyong National University, Busan 48513, Korea
*
Author to whom correspondence should be addressed.
Water 2018, 10(5), 637; https://doi.org/10.3390/w10050637
Submission received: 24 March 2018
/
Revised: 9 May 2018
/
Accepted: 10 May 2018
/
Published: 15 May 2018
(This article belongs to the Section Hydrology)
Abstract
:In this study, future probable maximum precipitations (PMPs) based on future meteorological variables produced from three regional climate models (RCMs) of 50-km spatial resolution provided by Coordinated Regional Climate Downscaling Experiment (CORDEX) are projected. In order to estimate future PMPs, the hydro-meteorological method is applied. The key future meteorological variable used to analyze the rate of change of future PMPs is the dew-point temperature. Future 12-h persistence 100-year return period extreme dew-point temperatures obtained from future daily dew-point temperature time series by using the scale-invariance method are applied to estimate future PMPs. As a result of estimating future PMPs using several RCMs and representative concentration pathways (RCPs) scenarios, the spatial distribution of future PMPs is expected to be similar to that of the present, but PMPs tend to increase in the future. In addition, it can be seen that the difference in PMPs estimated from various RCMs and RCP scenarios is getting bigger in the future. Especially after 2070, the difference has increased even more. In the short term, it is proposed to establish climate change adaptation policies with an 18% increase in PMPs, which is the ensemble average in the future year 2050.
1. Introduction
The possibility of a large storm event has recently increased. Hurricane “Harvey”, which has caused great damage to Texas in the United States, is said to be a weather phenomenon that can happen once every 1000 years by American media. The rise in sea surface temperature due to climate change has been analyzed as the reason for the hurricane “Harvey” being so intensified, and there is an analysis that it has entered the era of extreme flooding [1].
The Republic of Korea is also experiencing record rainfall events that far exceed the design standards of common urban facilities due to the impact of climate change. The storm event that occurred in the east coastal region of the Korean peninsula during the typhoon “Rusa” invasion in 2002 recorded a daily rainfall depth of 1000 mm corresponding to 75% of the average annual precipitation depth. The typhoon “Chaba”, which affected Korea in 2016, was the most powerful typhoon in October, and it also recorded a large rainfall depth that exceeded the design standards of urban drainage structures in a short period of time. There is also concern that the possibility of a super typhoon being landed on the Korean peninsula is increasing [2].
The concept of probable maximum precipitation (PMP) is used in the design and evaluation of large hydraulic structures in Korea and worldwide. The World Meteorological Organization (WMO) defines PMP as the maximum amount of precipitation that can occur meteorologically in any given time of year for a given area at any given location [3]. The concept of PMP has recently been used to develop a hypothetical scenario for the purpose of preparing for future catastrophic events [4]. Therefore, it is necessary to apply the PMP concept that considers climate change to the risk assessment of large hydraulic structures and national critical facilities, and to utilize it to prepare measures against major disasters.
WMO has published technical reports describing standardized methods and procedures for estimating PMPs since 1969. In WMO [3], two PMP estimation methods were described. The first is a hydro-meteorological method using moisture maximization and storm transposition, and the second is a statistical method using only annual maximum time series of rainfall data. Among the two estimation methods, the hydro-meteorological method has been used worldwide as an official method for estimating PMPs [5]. Although the concept of PMP has been criticized by many hydrologists [6,7,8], recent studies [9,10,11] have examined the effects of climate change on the estimation of PMPs using the hydro-meteorological method. Future PMPs are generally estimated using future meteorological variables produced from regional climate models (RCMs). Future ensemble of hydrological variables is also derived from future meteorological variables produced using as many global climate models (GCMs) or RCMs as possible. This is because the ensemble of future hydrological variables derived from numerous future meteorological variables produced from many climate models, rather than the single future hydrological variables derived from the future meteorological variables produced from a single climate model, is perceived as a reliable result that reflects the uncertainties that come from future projections [12,13,14,15]
There are two major sources of future meteorological variables in Korea. First, the Korea Meteorological Administration (KMA) provides future meteorological variables (12.5-km of spatial resolution and 1-day of temporal resolution) produced from Hadgem3-RA (RCM) that dynamically downscaled Hedgem2-AO (GCM). More information on this source can be found [16]. In addition, from Coordinated Regional Climate Downscaling Experiment (CORDEX) Project, there are several sets of future meteorological variables produced from five RCMs (Hadgem3-RA, RegCM-V4, YSU-RSM, SNU-MM5, SNU-WRF) that dynamically downscaled Hedgem2-AO. More information on CORDEX can be found [17].
In this study, future PMPs of Korea are projected using the hydro-meteorological method based on future meteorological variables produced from three CORDEX RCMs (Hadgem3-RA, RegCM-V4, YSU-RSM). The comparison with estimated future PMPs [18] based on the future meteorological variables produced from KMA Hadgem3-RA is also performed. The previous study [18] projected future PMPs using only one RCM, whereas future PMPs are projected by applying various RCMs in this study. Thus, the variability in an ensemble of future PMPs generated using various RCMs and RCPs (Representative concentration pathways) can be investigated.
2. Future PMPs Estimation Procedure
In this study, the dynamic factor influencing precipitation has been determined indirectly through data on observed extraordinary storms. Since such storms can be indicators of maximum rates of convergence and vertical motion in the atmosphere, the procedure including moisture adjustments, storm transposition and envelopment are used in this study to maximize observed storm rainfall for estimating PMPs.
PMP estimation method for mid-latitude non-orographic regions has been used as a standard in Korea [19]. Since wind maximization has been used infrequently in non-orographic regions, wind maximization is not applied in this study. However, the orographic transposition factor (OTF) is added in the process of storm transposition to reflect the effect of mountains.
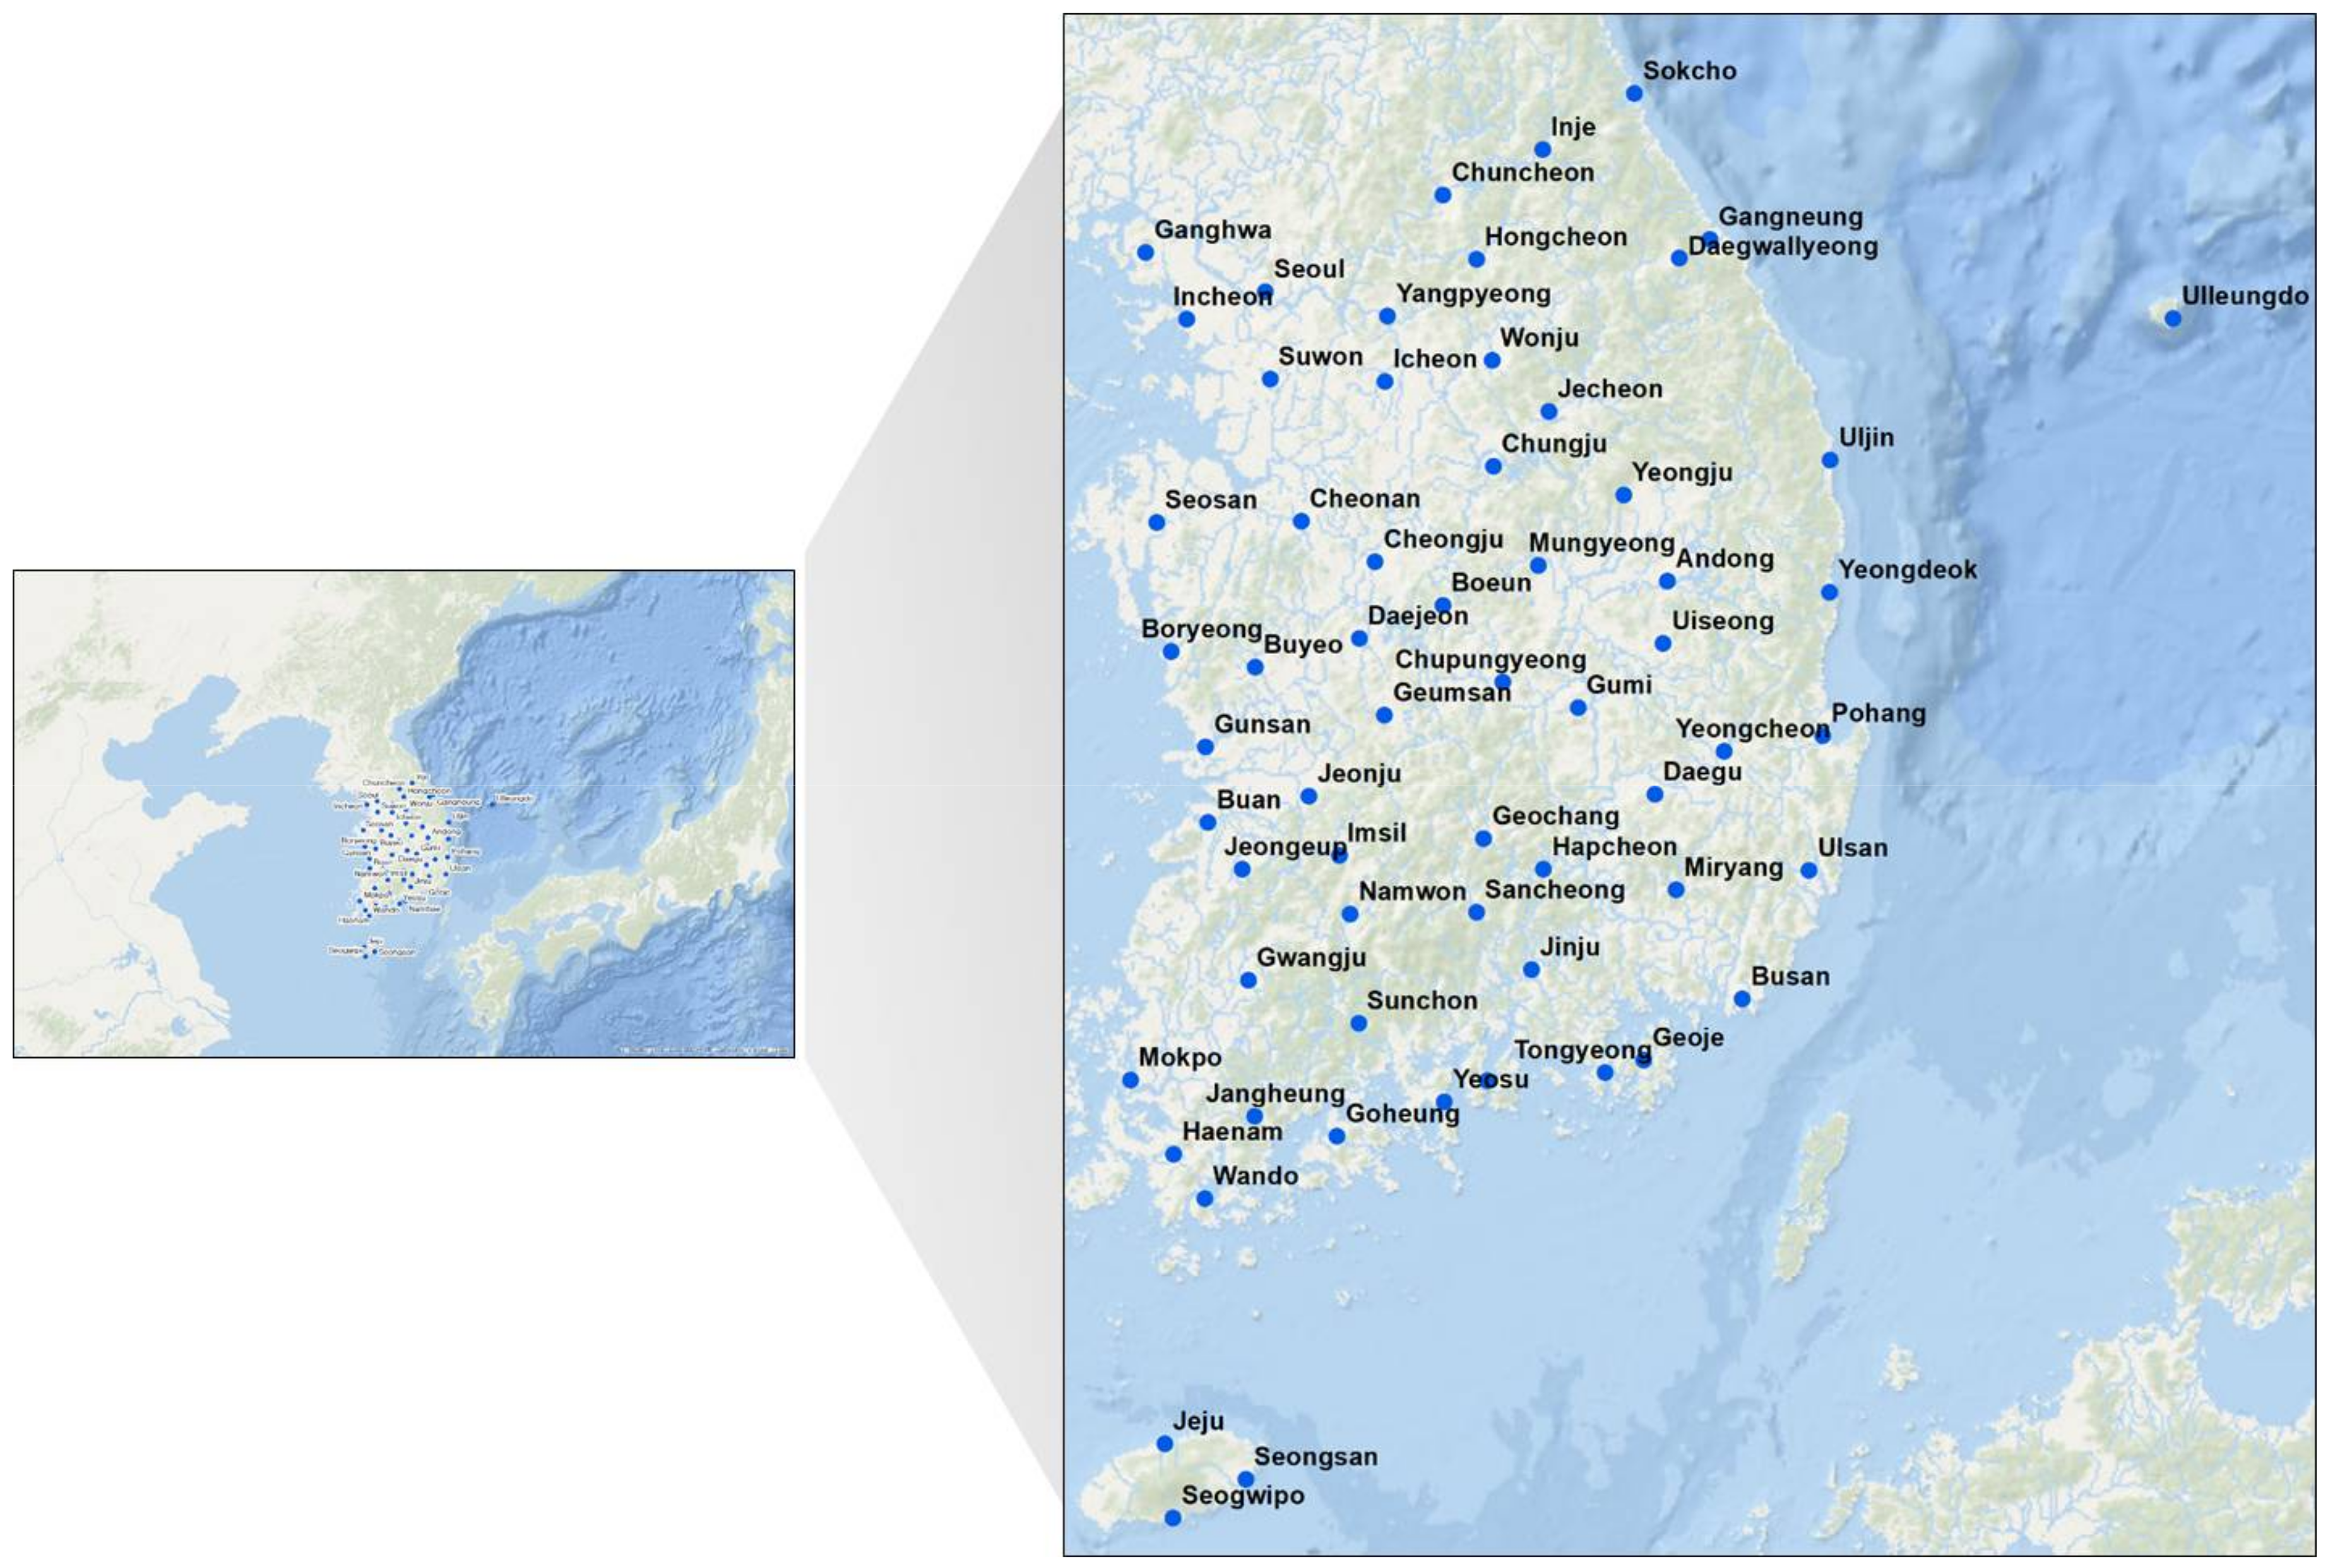
The study area is the entire region of Korea, and more than 40 years of meteorological data from 62 meteorological stations operating at KMA are used to estimate PMPs (Figure 1). The spatial resolution, which is the standard for estimating PMPs, is 5 km × 5 km, and PMPs are estimated at each grid. Observations of meteorological stations are extended to spatial grid data using the inverse distance method.
In this study, PMPs are estimated using the hydro-meteorological method presented in [20]. The basic concept of estimating PMPs using rainfall depths of observed major storm events is divided into moisture maximization, storm transposition to other regions, and envelope of Depth-Area-Duration (DAD) curves composed of transposed storms. DAD analysis was conducted on 162 major storms in Korea. The process of estimating future PMPs due to future dew-point temperature changes is summarized as follows:
- Derivation of a scale-invariance relationship by analyzing the scale characteristics of the observed hourly dew-point temperature (DPT).
- Future daily DPT calculation using future daily meteorological variables produced from RCMs.
- Production of future 12-h persistence 100-year return period extreme DPT using the scale-invariance relationship derived from observed DPT.
- Application of the hydro-meteorological method with future extreme DPT to estimate future PMPs.
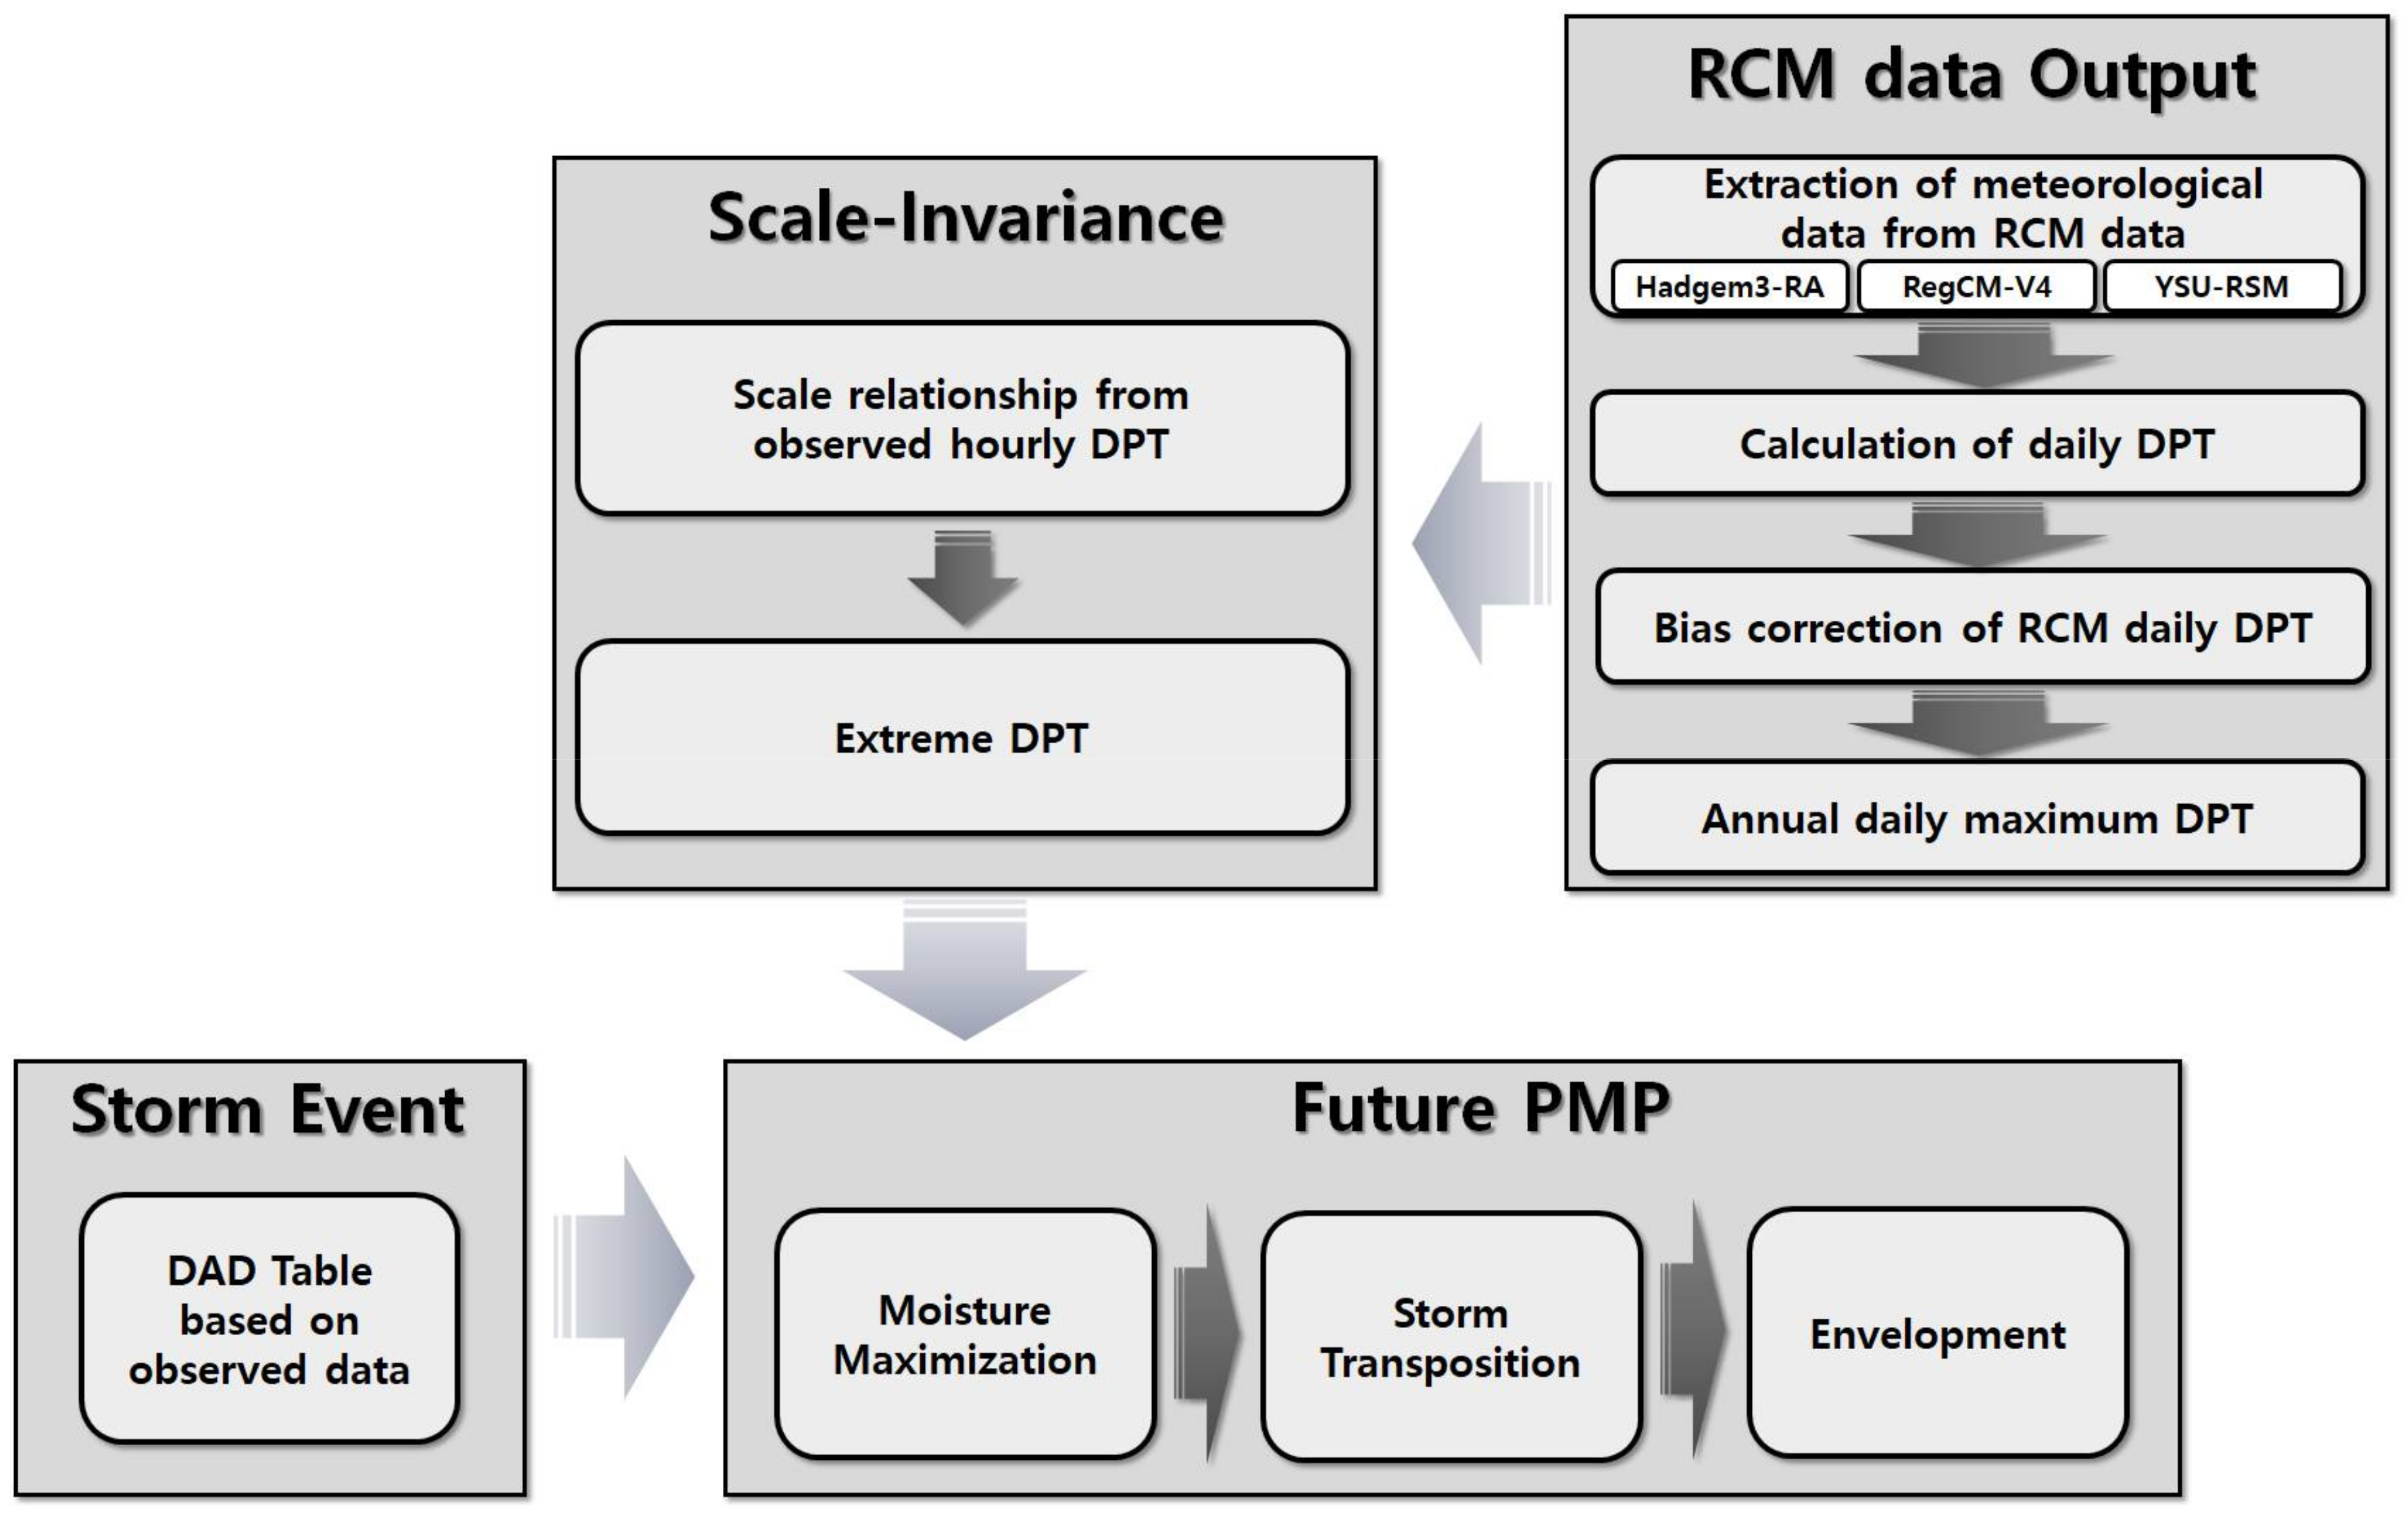
According to the above procedure, future PMPs are estimated to reflect future changes in extreme DPT. This is because the extreme DPT is a very important role in the moisture maximization and storm transposition processes required to estimate PMPs. The observed DAD curves derived the observed major storm events are used for future DAD curves, and the representative 12-h persistence DPT for each observed major storm event is also used. Since future rainfall time series is given as daily data at the current technology level in Korea, another study is needed to extract future major rainfall events to obtain future DAD curves. In addition, even though future major rainfall events could be extracted through such a separate study, many uncertainties could not but be included. Therefore, in this study, it was investigated how the future PMPs would be changed to reflect future DPT changes only. That is, the precipitation-producing efficiency will increase as the future DPT increases, which will change future PMPs. If all future meteorological data needed to estimate PMPs could be produced, it would be possible to estimate future PMPs based on them. However, as the amount of data produced increases, the uncertainty will also increase, so estimating future hydrological design variables will require appropriate and reasonable assumptions. In addition, studies on estimating future PMPs considering future DPT changes are not the first in this study, and studies such as [10,18,21] have already been conducted. The procedure for future PMPs estimation in this study is illustrated in Figure 2.
3. Future Extreme Dew-Point Temperature
3.1. Future Meteorological Variables Produced from CORDEX RCMs and Daily Dew-Point Temperature
Among the many meteorological variables produced from CORDEX RCMs, there is no DPT, but it is possible to reproduce daily DPT using surface specific humidity, surface air pressure and surface air temperature. However, since the DPT could not be reproduced using the meteorological variables produced from SNU-MM5 and SNU-WRF among the CORDEX RCMs, the two RCMs were forced to be excluded from this study.
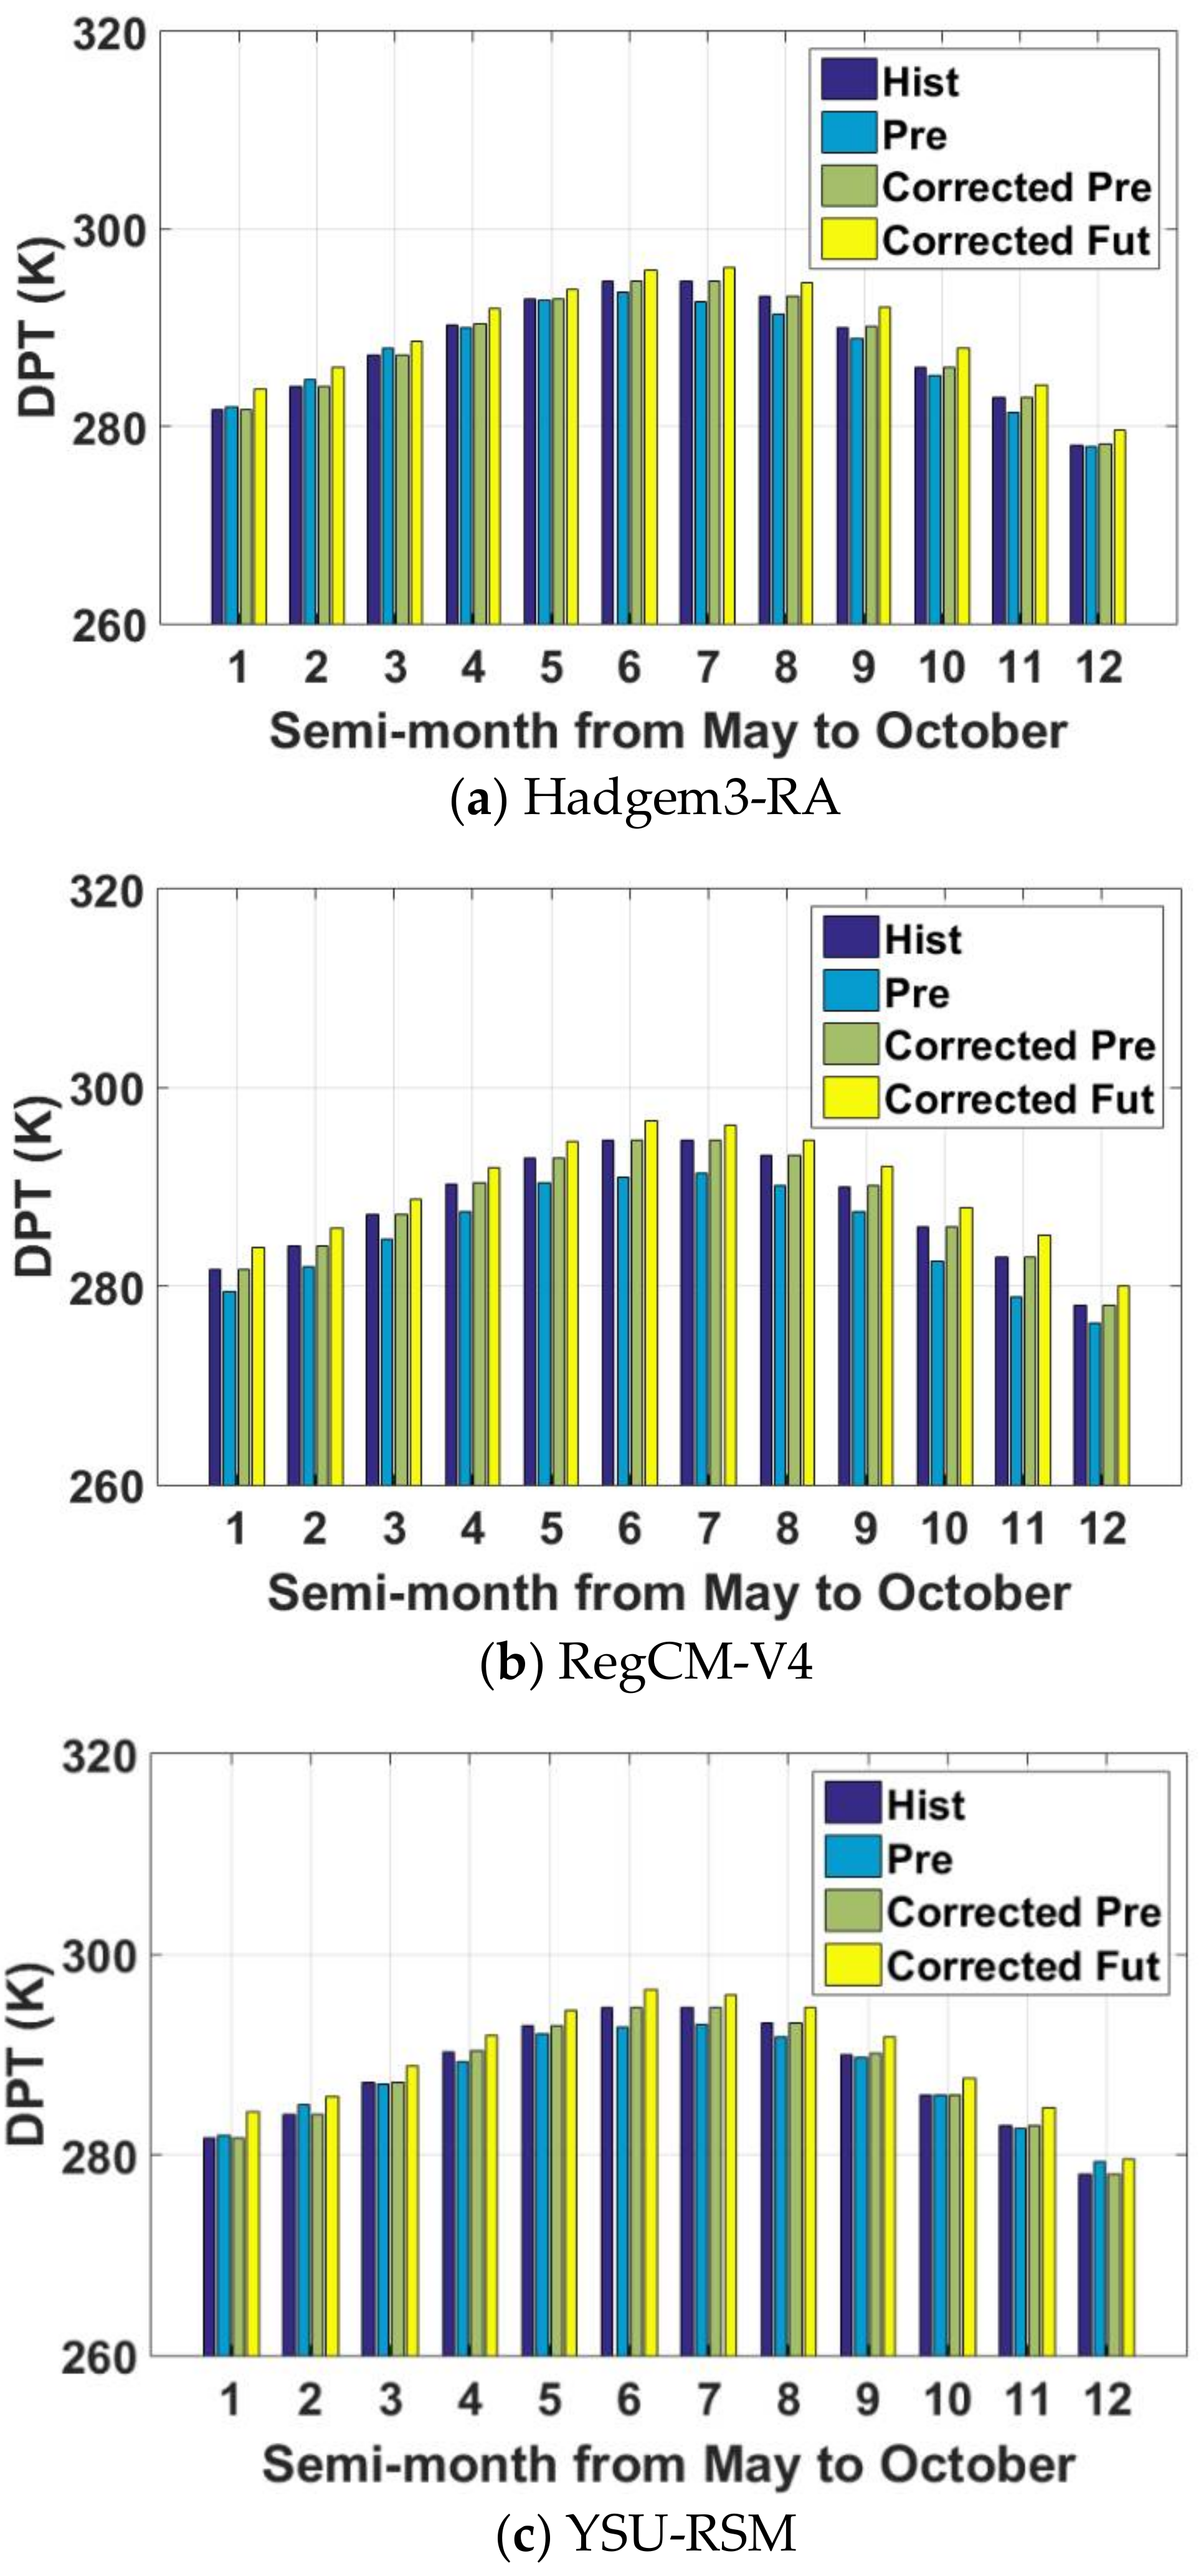
Daily DPTs produced from RCMs require a bias correction procedure due to various limitations of climate models. In this study, biases of daily DPTs were corrected using quantile mapping. The non-parametric probability distribution was used as the probability distribution of daily DPT. The daily DPT from May to October was divided into the first half of the month and the second half of the month, and biases were corrected for each meteorological station and each period. The reason for analyzing DPT from May to October is that most of the rainfall in Korea is concentrated in summer rainy season. Figure 3 shows the bias-correction results for daily DPT at Seoul station acquired from three RCMs. In Figure 3, ‘Hist’ is the daily DPT observed from 1981 to 2005, and ‘Pre’ is the daily DPT simulated in the reference period (1981 to 2005) using the RCM. ‘Corrected Pre’ is the bias-corrected result of ‘Pre’. ‘Corrected Fut’ is the bias-corrected result of the daily DPT simulated in the future period (2006 to 2050). As can be seen in Figure 3, the bias to the mean was well corrected. In addition, Figure 3 shows that Hadgem3-RA and RegCM-V4 underestimated the DPT, while YSU-RSM overestimates the DPT in some periods. It can be also seen that the future DPT is very likely to increase above the present DPT. In this way, future corrected daily DPT time series were acquired and used to perform subsequent analysis.
3.2. Future 12-Hour Persistence 100-Year Return Period Dew-Point Temperature
To estimate PMPs, the maximum precipitable water during the major storm is required, which is calculated from the 12-h persistence extreme DPT. Here, “extreme” is mainly applied to a 100-year return period [20]. The moist adiabat corresponding to the DPT for a return period of 100-year is considered sufficiently close to the probable warmest saturated pseudo-adiabatic atmosphere for extreme storms. In the RCMs used in this study, since only the daily DPT is obtainable, the extreme DPT for calculating the maximum precipitable water cannot be obtained directly. In this study, the scale-invariance method proposed by Burlando and Rosso [22] was used to calculate extreme DPT from daily DPT. In other words, sub-daily extreme DPT was derived from future daily DPT time series using the scale-invariance method, assuming that the probability distribution of the data has invariant characteristics irrespective of the scale of the data. In fact, the scale-invariance method has been applied to extreme rainfall [23,24,25]. In this study, the scale-invariance method combined with the hydro-meteorological framework for estimating future PMPs was applied to DPT time series.
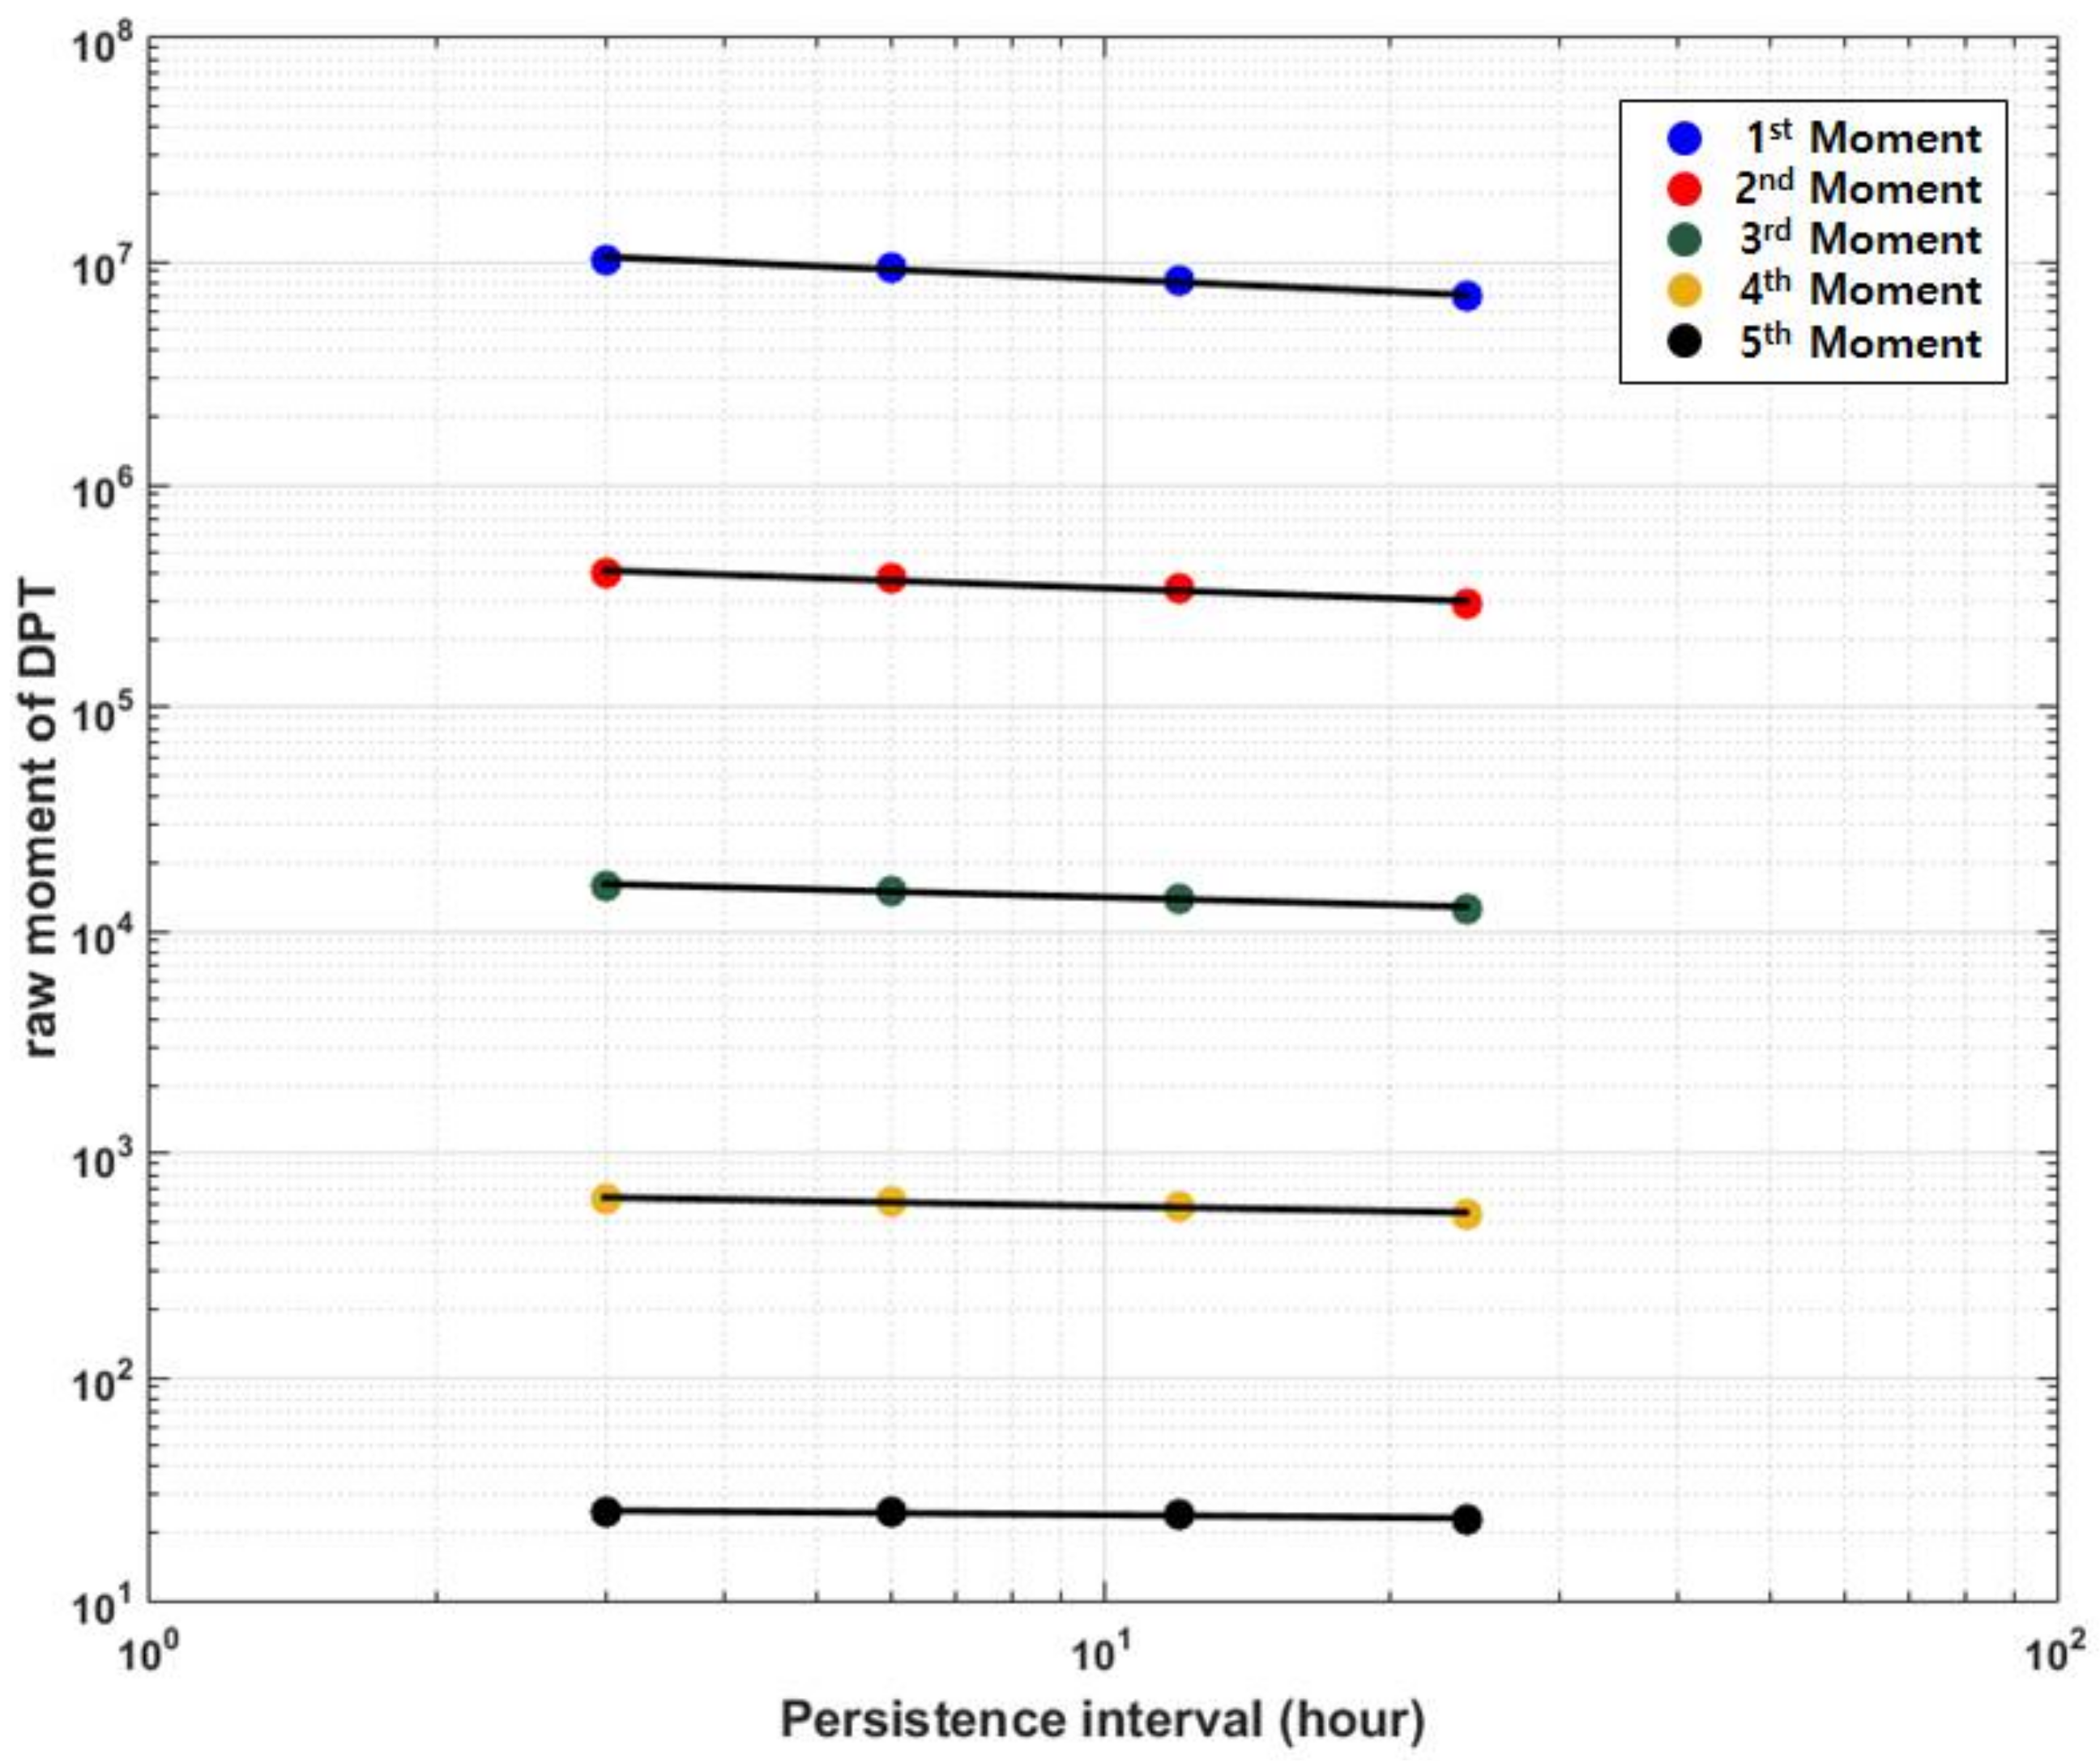
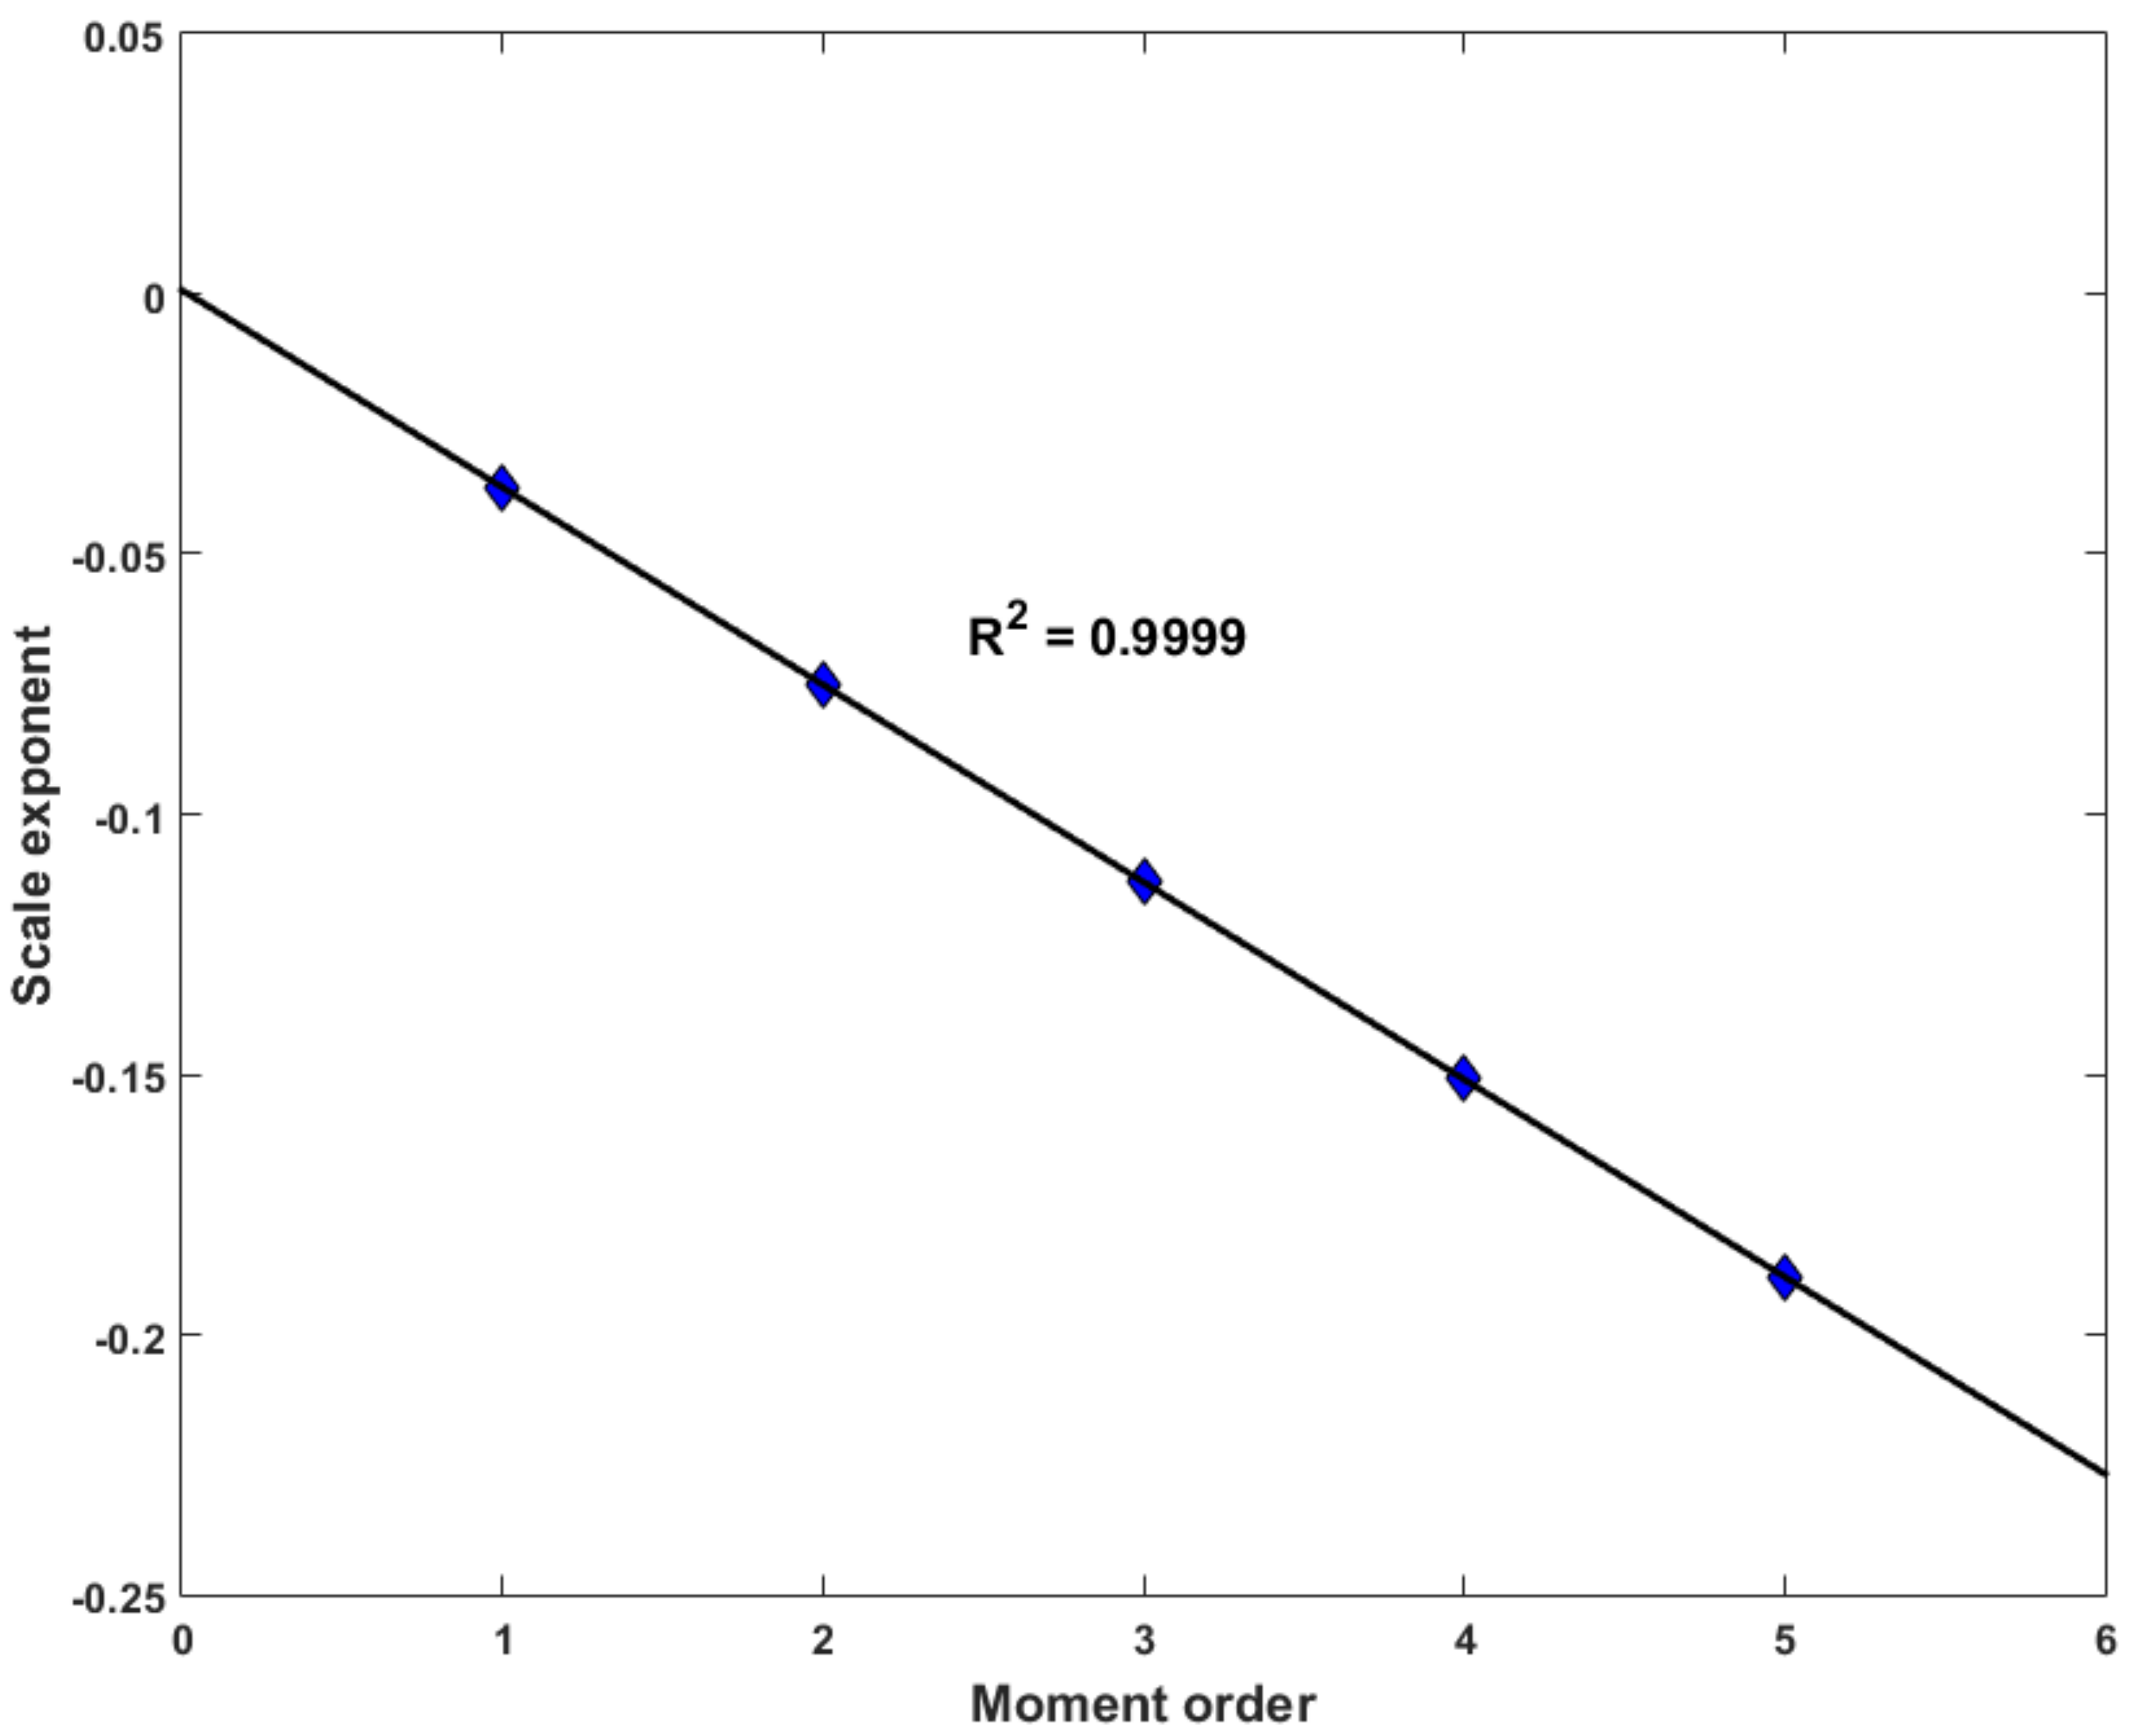
Before applying the scale-invariance method, the scale characteristics of the observed DPTs should be examined first. By plotting the sampling estimates of the raw moments against the corresponding persistence interval on a double logarithmic plane, Figure 4 shows that the DPT of Seoul station has a linear relationship with respect to the persistence interval. Straight lines indicating scale-invariance have been fitted by linear regression. Figure 5 shows that the slope (i.e., scale-exponent) of Figure 4 for the moment order also has a linear relationship, from which wide sense simple scaling to hold for the investigated process can be identified. Since the DPT of Seoul station as well as the DPTs of all meteorological stations applied in this study show similar results as in Figure 4 and Figure 5, it can be seen that the DPT of Korea clearly has simple scale characteristics. Note that, since 12-h persistence extreme DPT for each semi-month is generally advisable, all analyses were performed based on the annual maximum time series acquired for each semi-month.
The extreme DPT of persistence interval -h ( = 12-h in this study) and return period -year ( = 100-year in this study) using the scale-invariance method was constructed as follows:
where is the mean of the annual maximum DPT time series of persistence interval 24 h. In addition, is the scale-exponent corresponding to return period -year, and denotes the frequency factor introduced by [26]. The representative coefficient of variation of the annual maximum time series is calculated as follows:
where is the total number of persistence intervals ( is 4 in this study, i.e., 3-h, 6-h, 12-h, 24-h) and is the coefficient of variation (the ratio of the standard deviation to the mean) for the applied persistence interval. Figure 6 shows the extreme DPT calculated using the observed hourly DPT and the corresponding extreme DPT calculated using the scale-invariance method from the observed daily DPT. It is shown that extreme DPT can be reproduced well by using the scale-invariance method.
After calculating future persistence interval 24-h annual maximum DPT time series from future daily annual maximum DPT time series obtained from the RCMs using the observed linear relationship between daily annual maximum DPT time series and persistence interval 24-h annual maximum DPT time series, in future years can be obtained by deriving a parabolic trend line of (see Figure 7) as follows:
where = mean of present ; = mean of future in the future year ; = the future year; = the last year of present annual maximum time series (=2005), and and = regression coefficients. Future extreme DPT is calculated using Equation (1), and , , and are all assumed to have the same values as the present value in the future [27]. In other words, the potential effects of climate change may be considered by modifying the parameter of the Equation (1) according to the expected change. Figure 8 shows the future trend lines of the future extreme DPT for the RCMs and RCP scenarios applied (six thin solid lines). In Figure 8, the thick solid line represents the median of the six future trend lines. As can be seen in Figure 8, future extreme DPTs projected from YSU-RSM and RegCM-V4 under RCP 4.5 scenario are expected to initially increase and then decrease after approximately 2040, while future extreme DPTs projected from other RCMs and RCP scenarios show a consistently increasing tendency.
4. Future PMPs
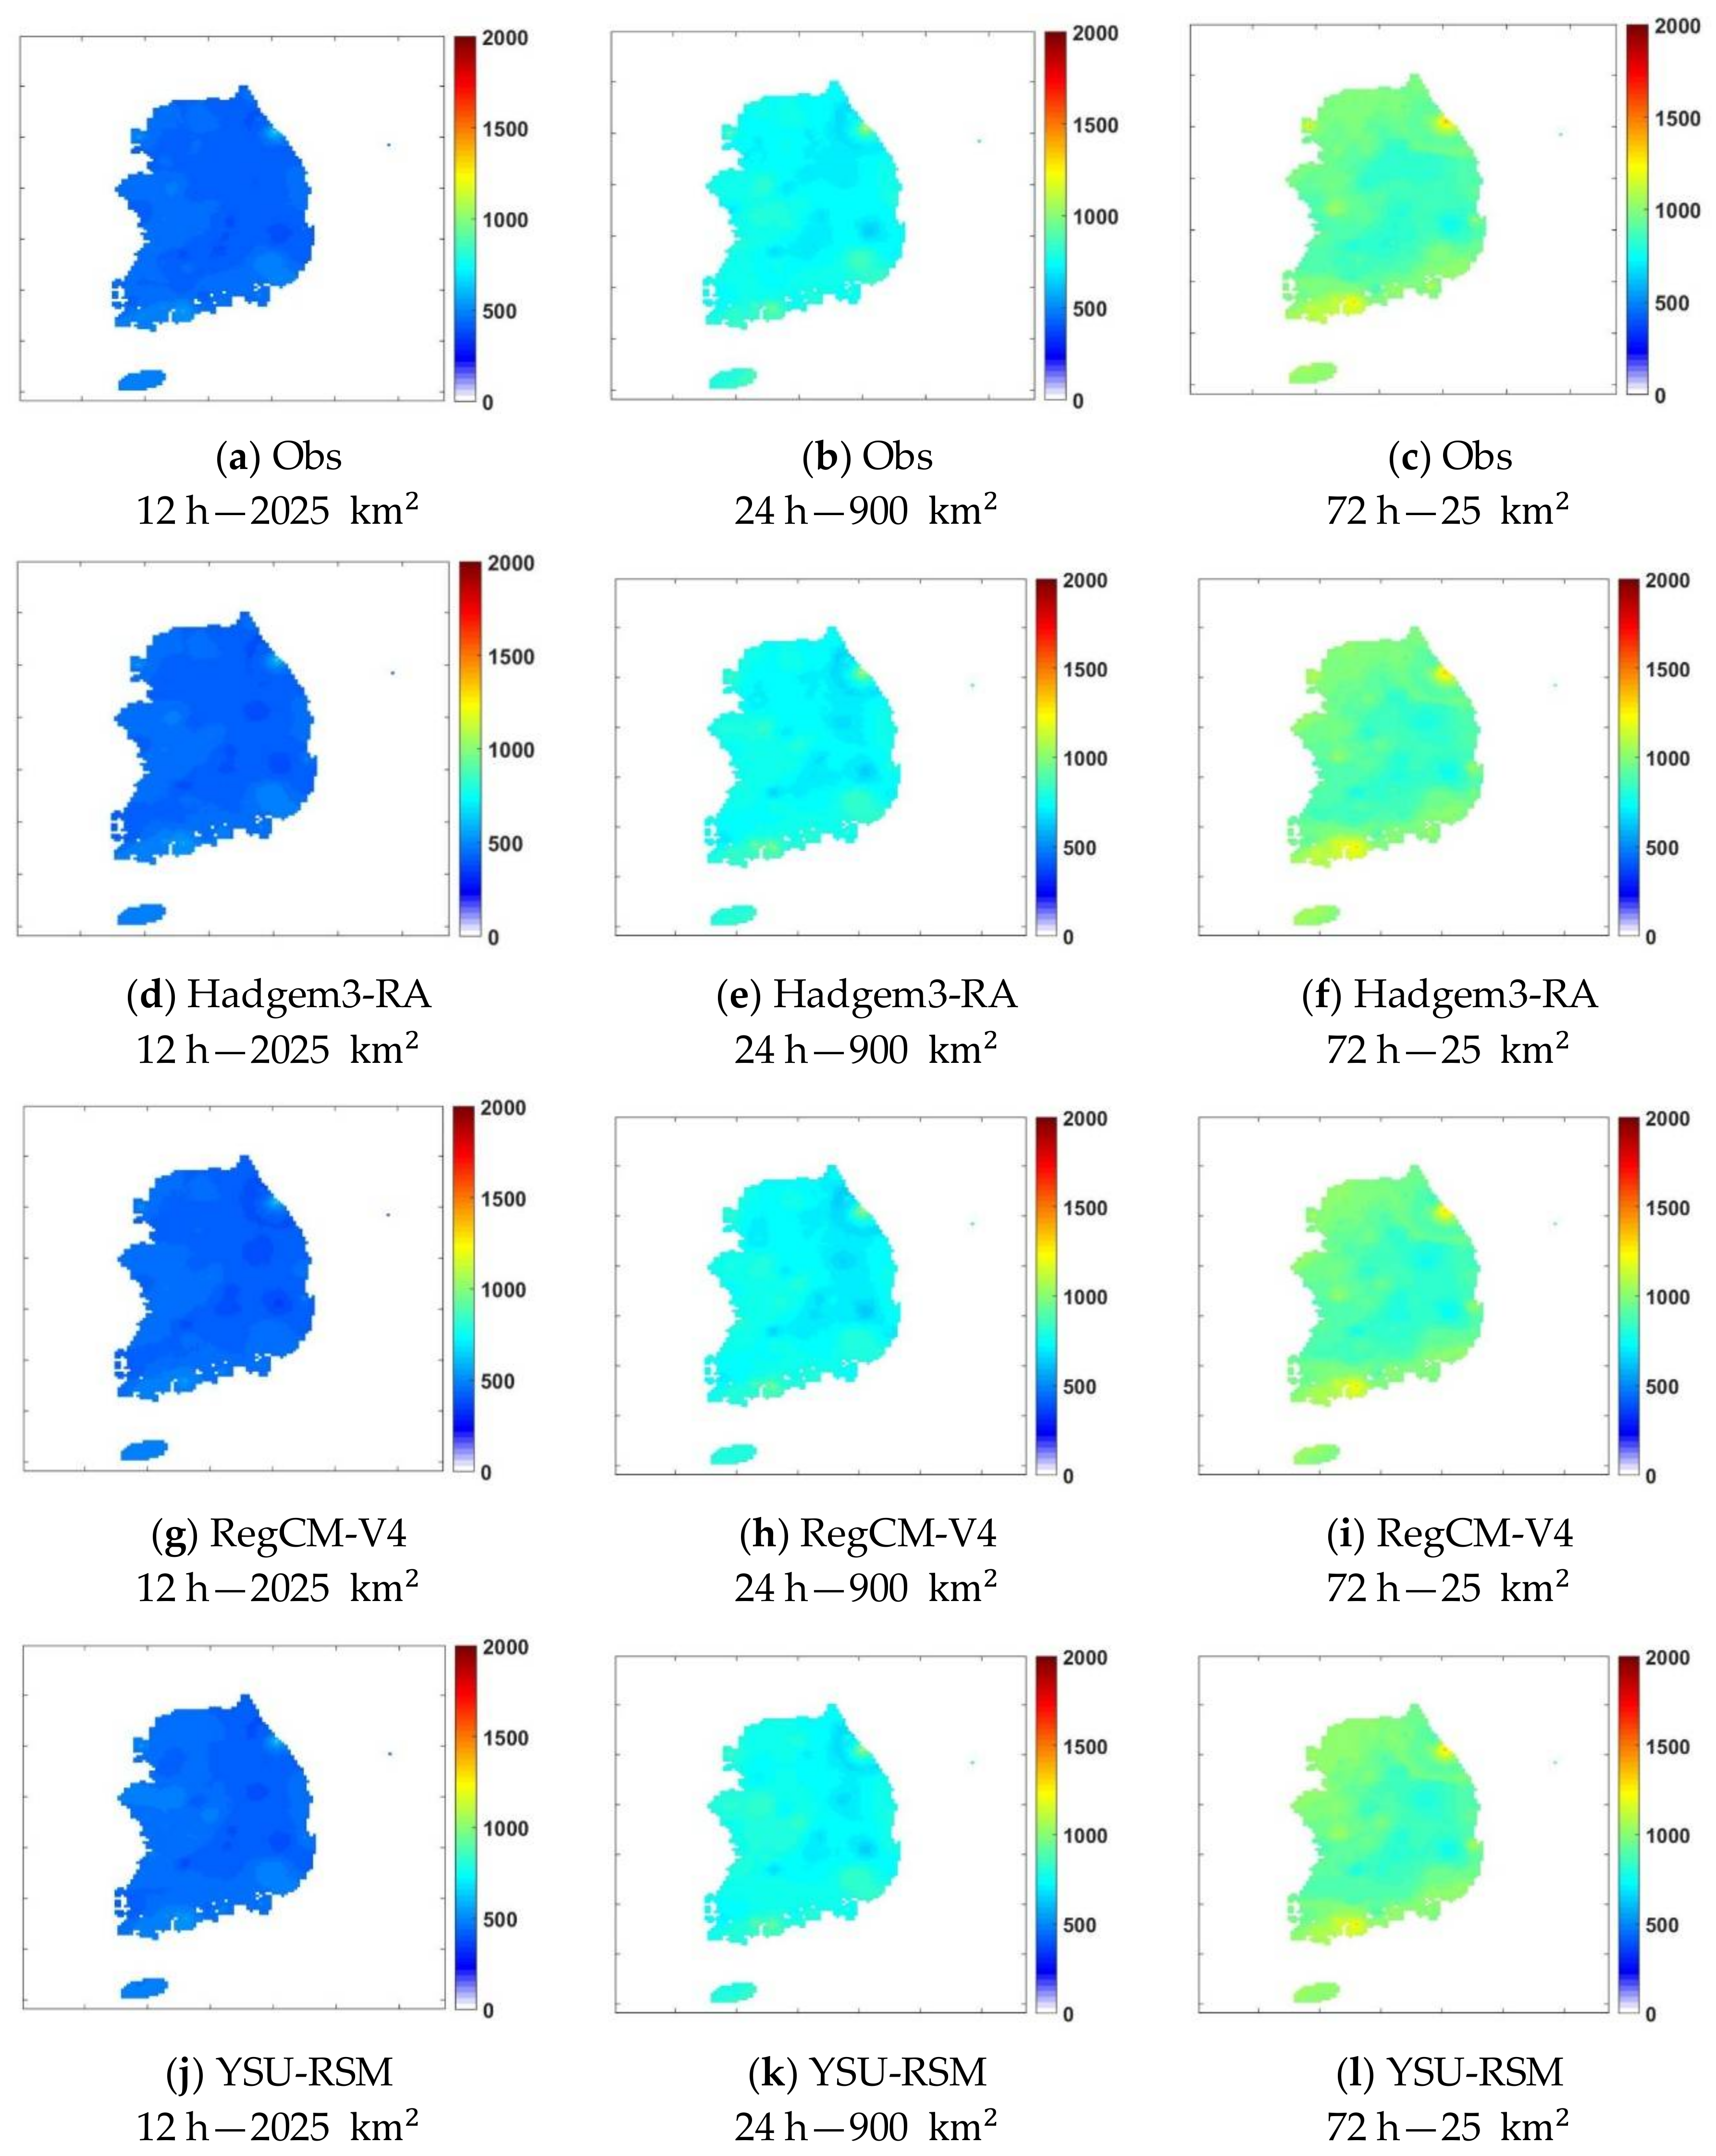
Figure 9 shows the spatial distribution of PMPs (obs-PMPs) estimated using observed climate data and the spatial distributions of PMPs (present-PMPs) estimated using present climate data simulated from RCMs. It can be seen that the present-PMPs reproduce the obs-PMPs well. The cross-correlation coefficients between obs-PMPs and present-PMPs for all duration and areas were 0.97[0.93 0.99] for Hadgem3-RA, 0.95[0.87 0.98] for RegCM-V4 and 0.94[0.87 0.98] for YSU-RSM. Therefore, the extreme DPT estimation procedure using the bias-correction method and the scale-invariance method applied in this study can be considered as suitable for estimating PMPs from the simulated meteorological variables from RCMs.
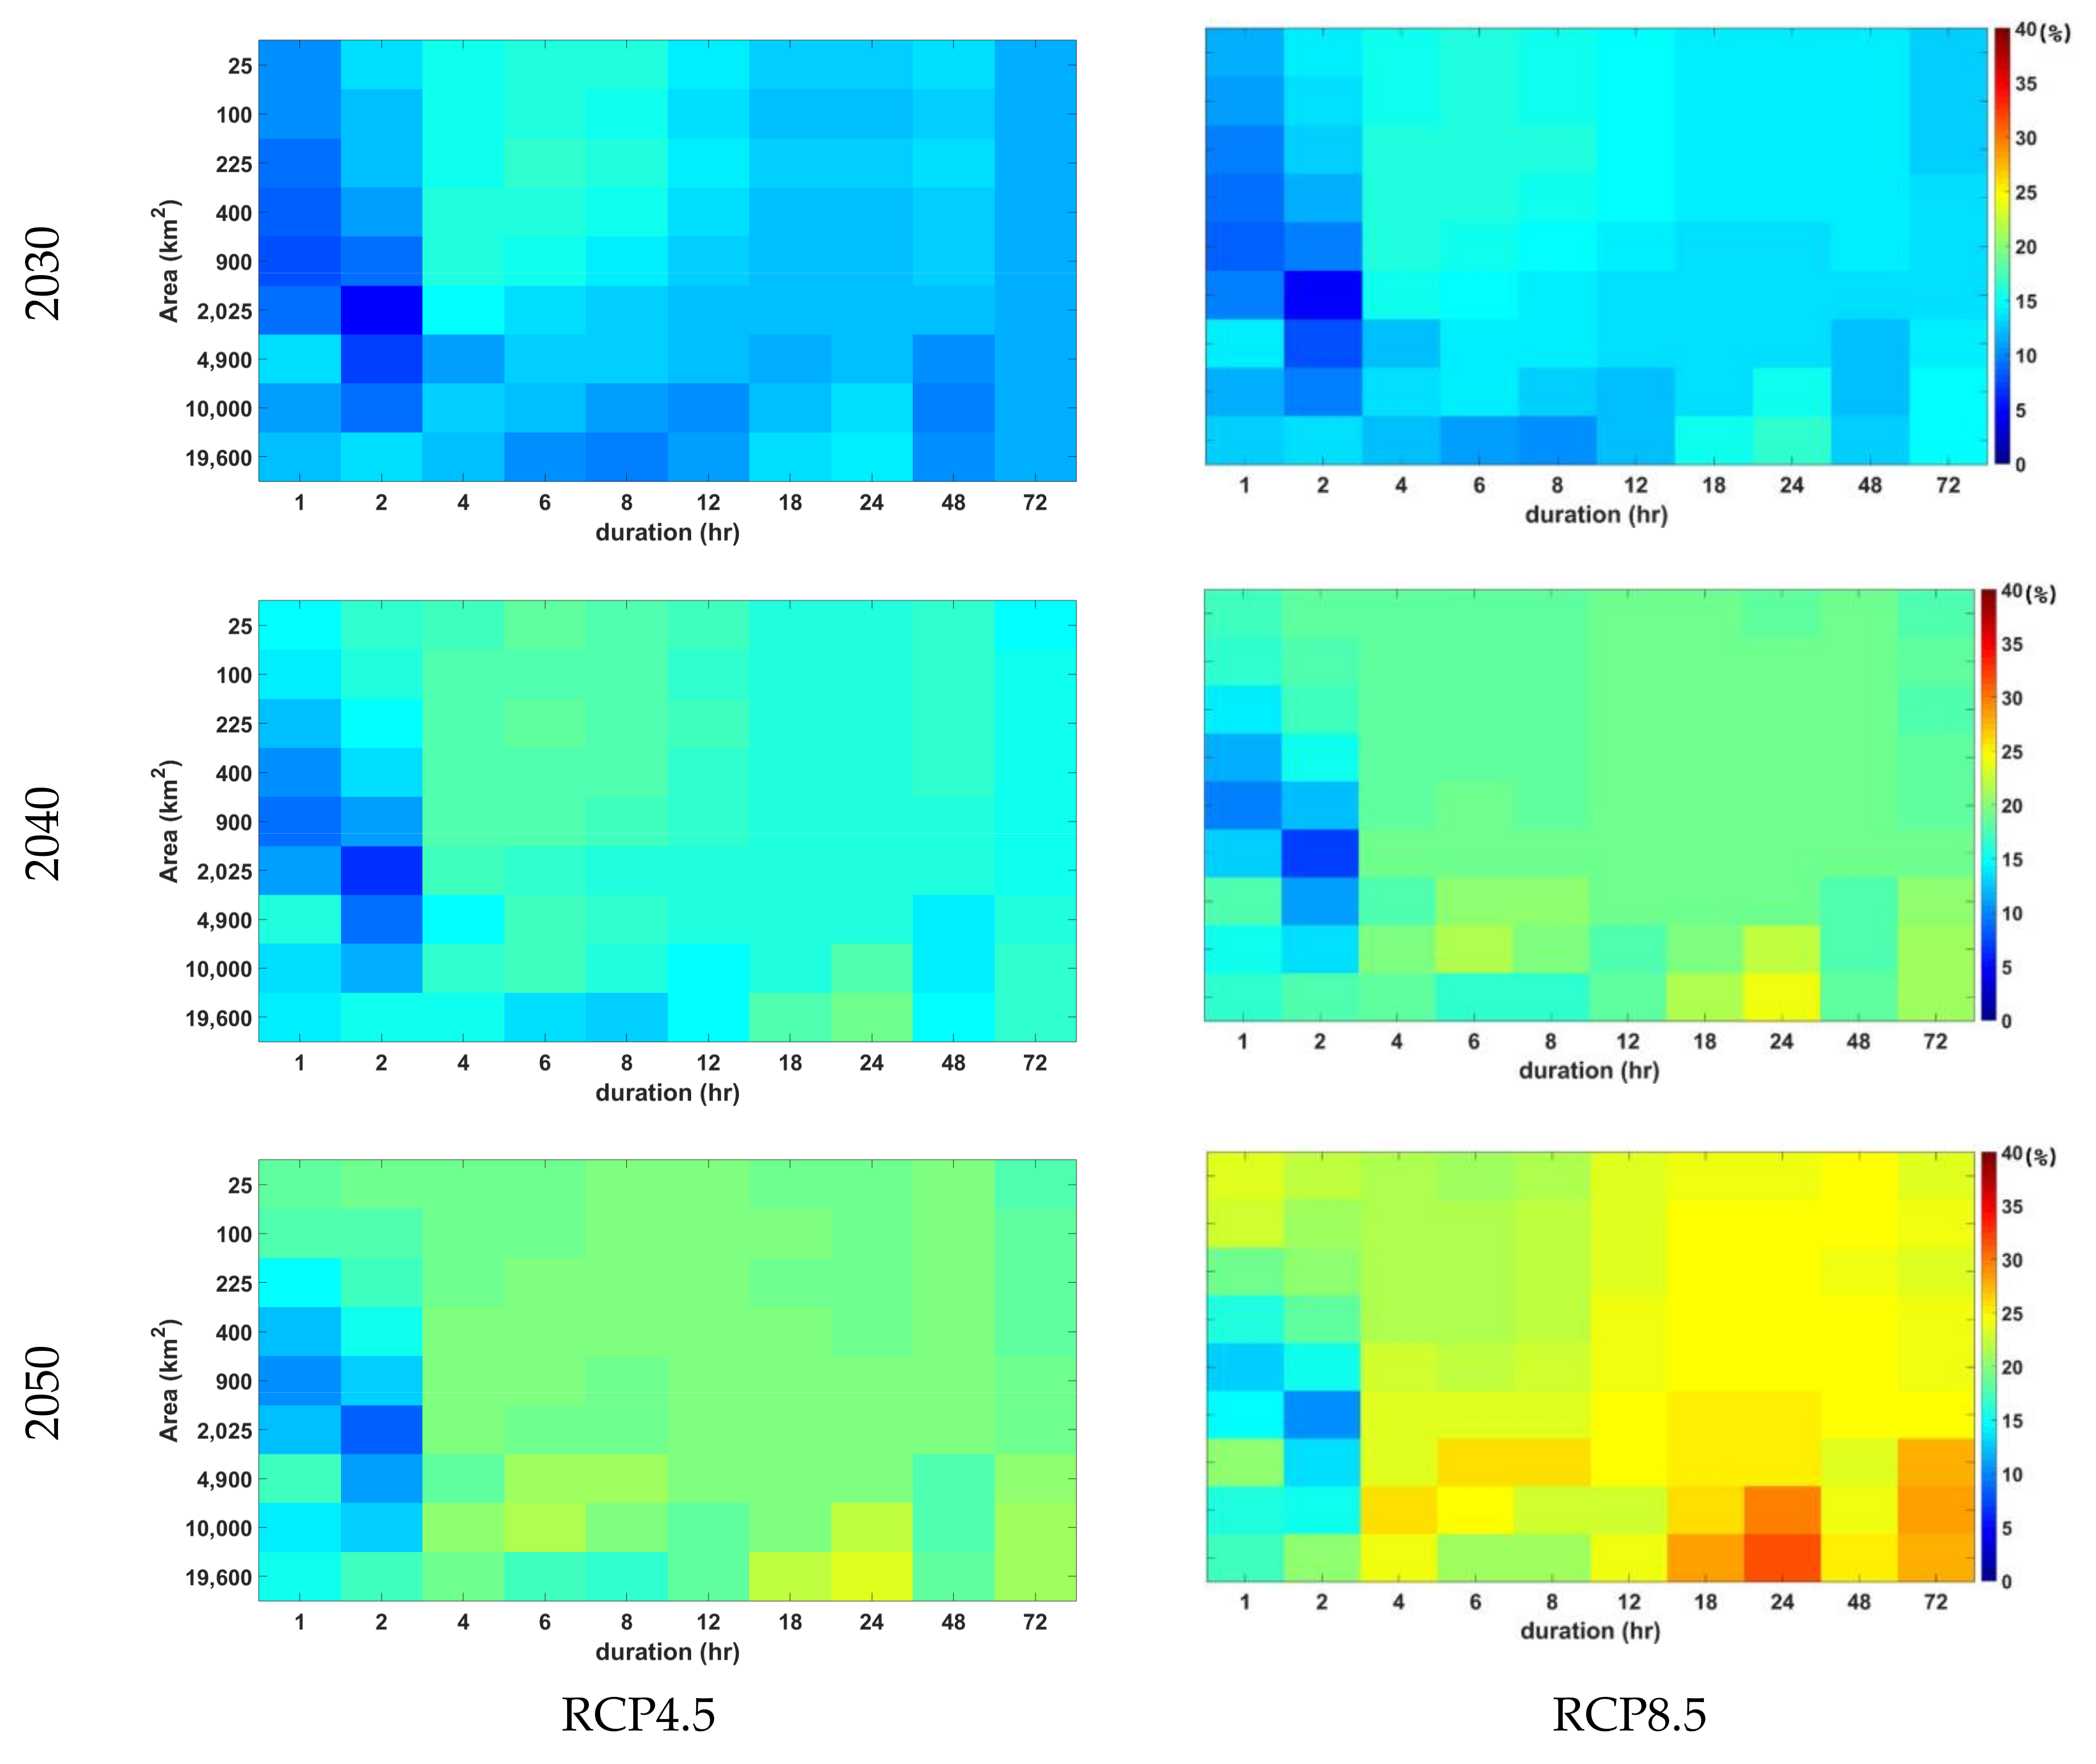
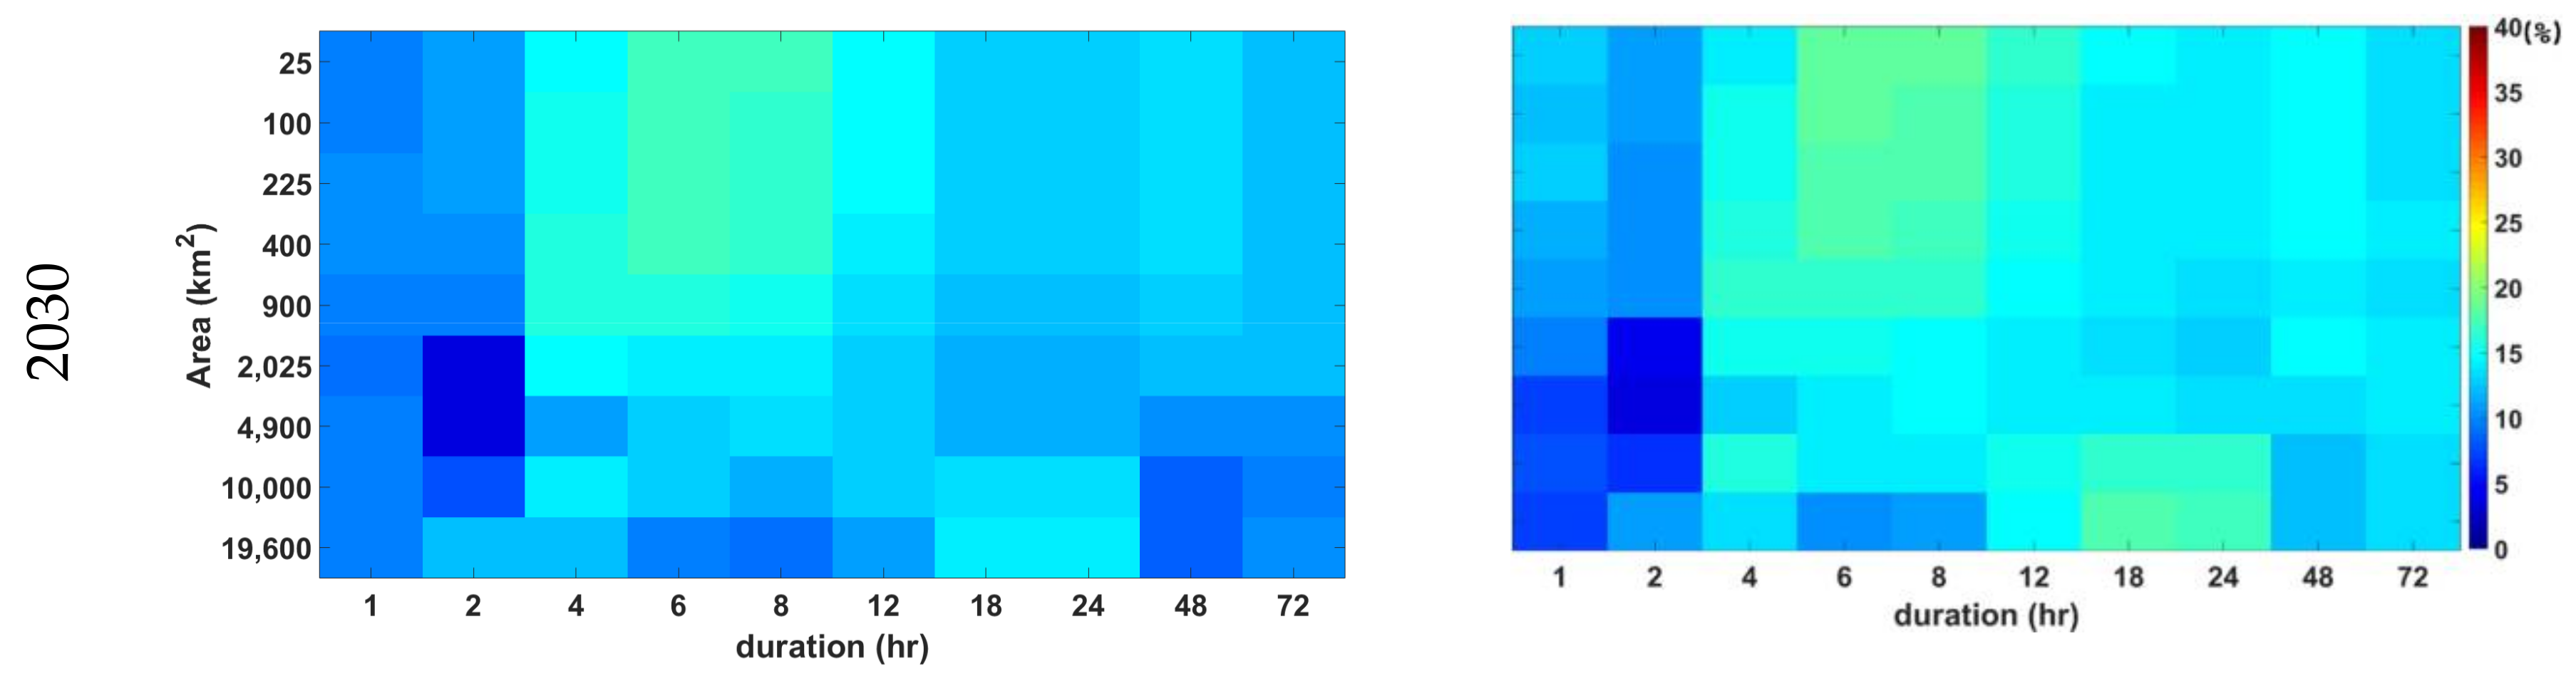
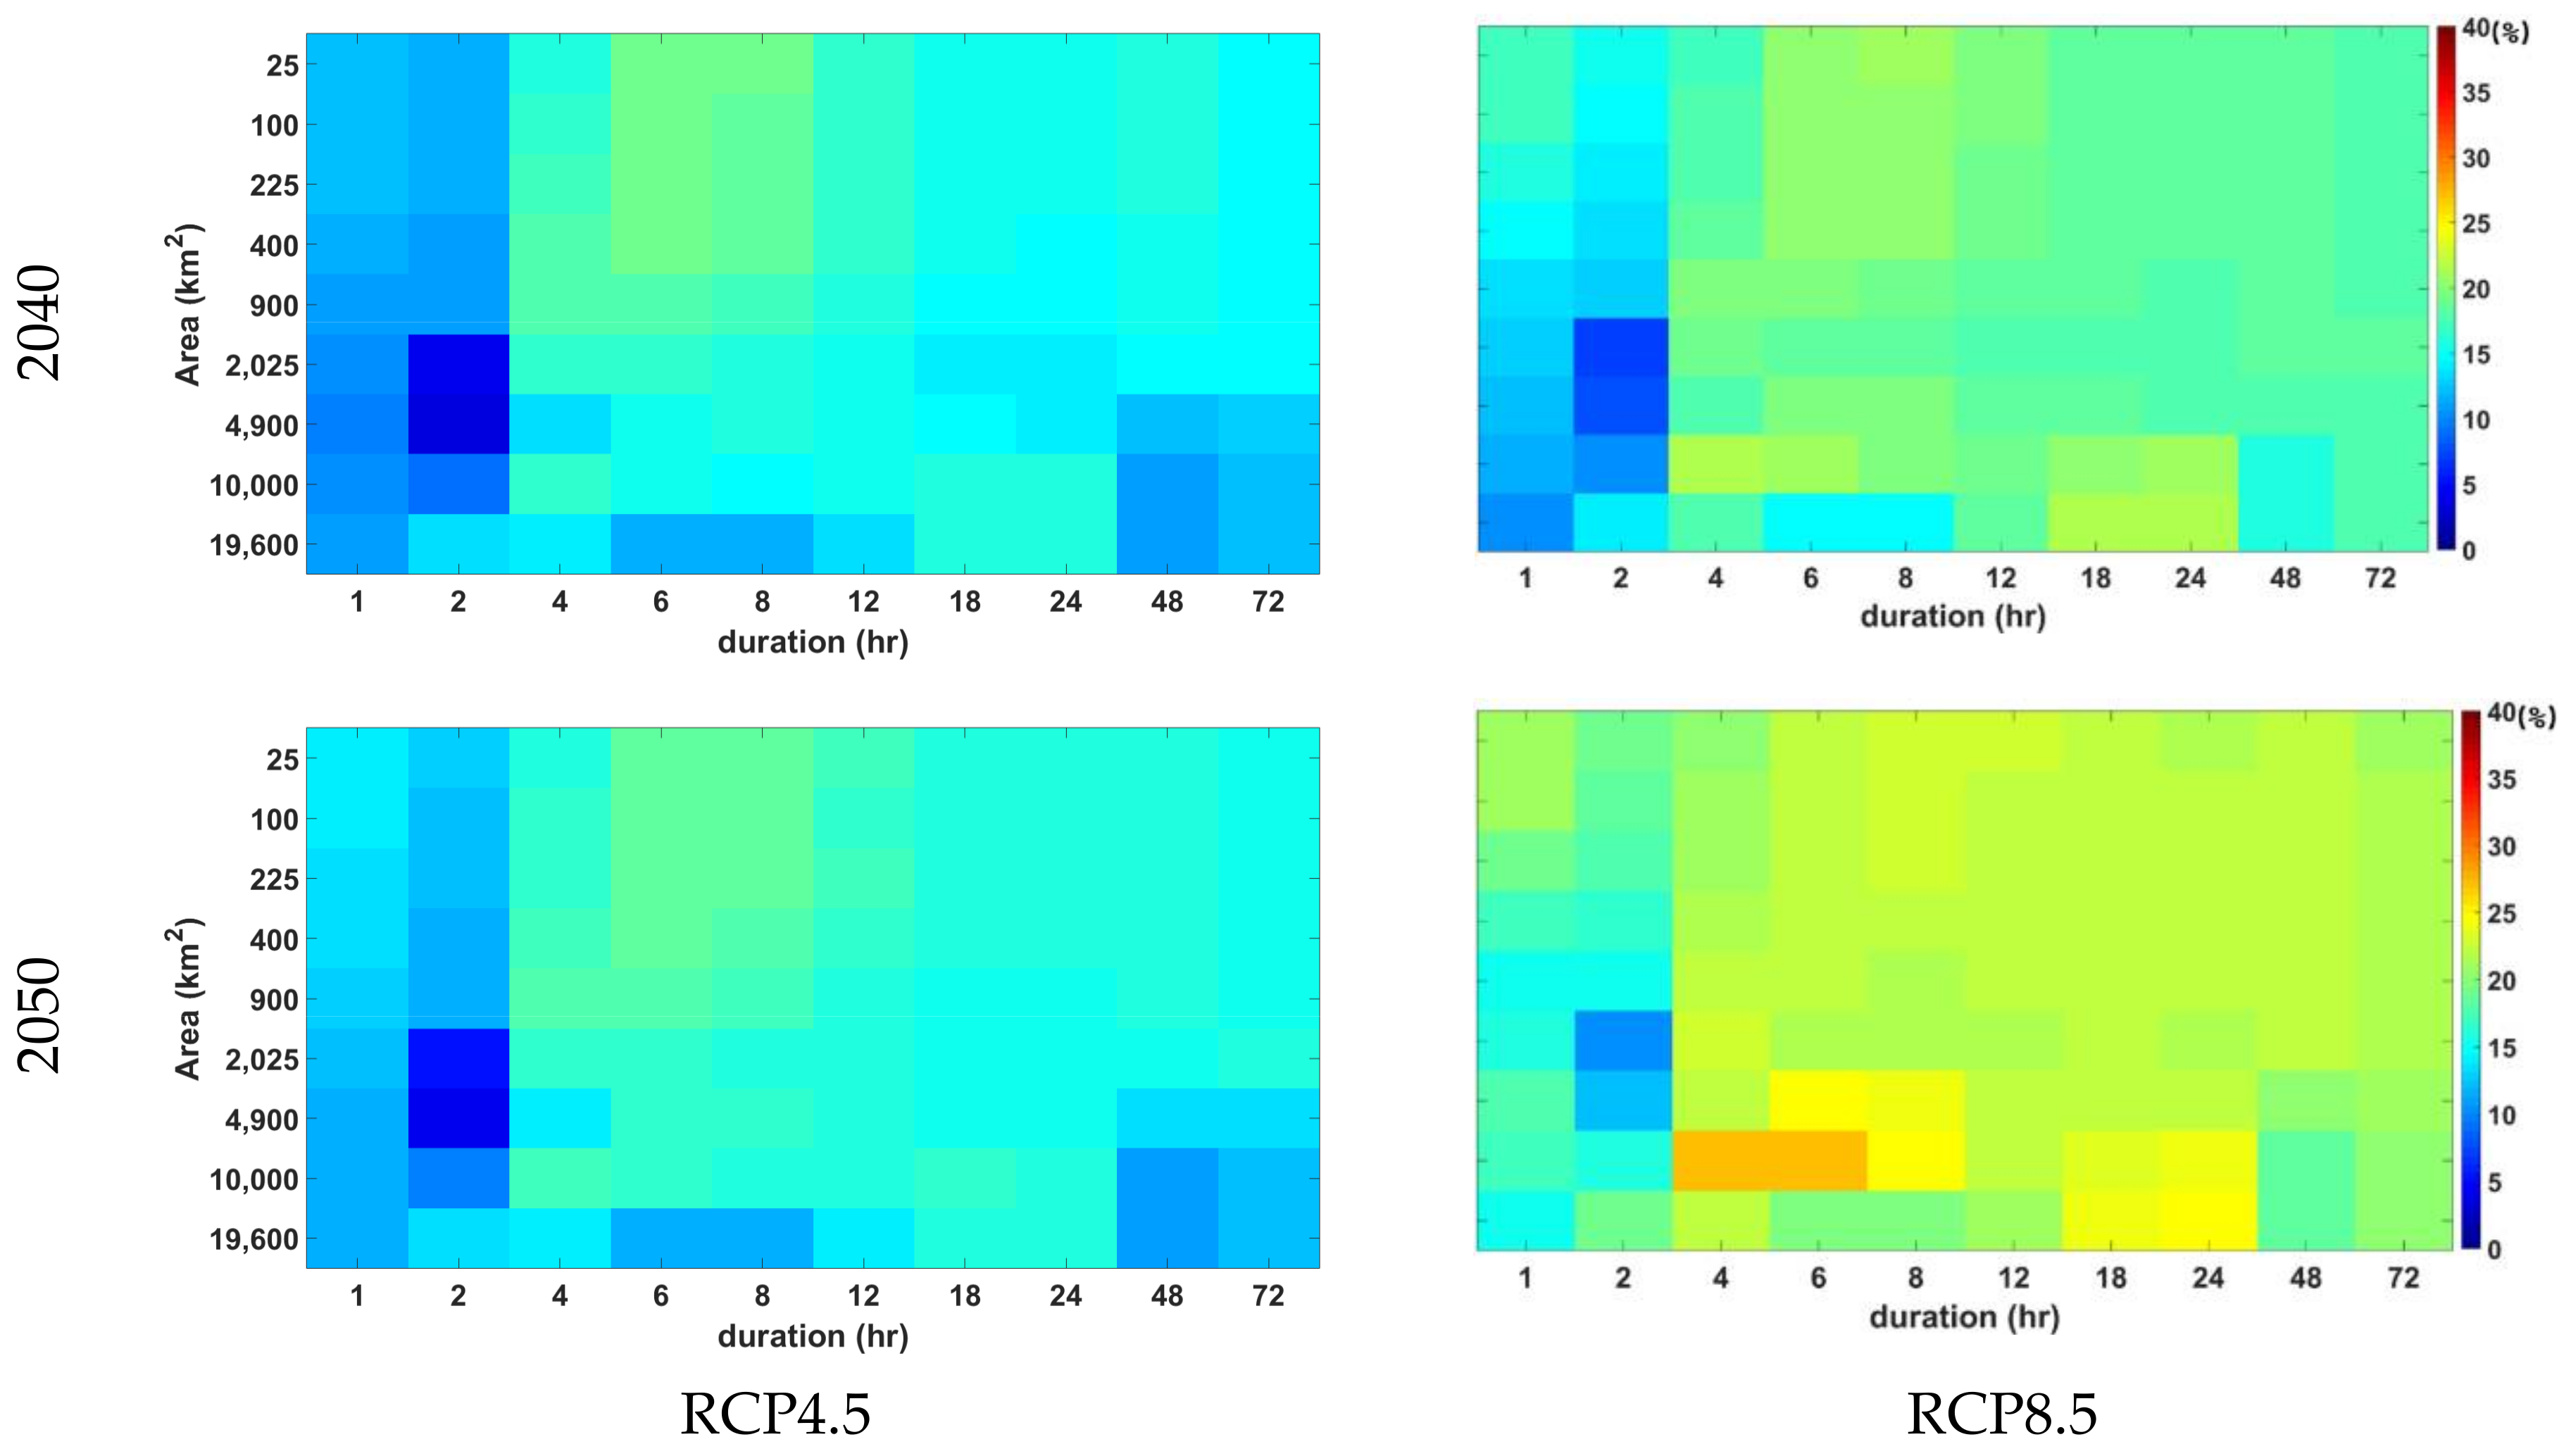
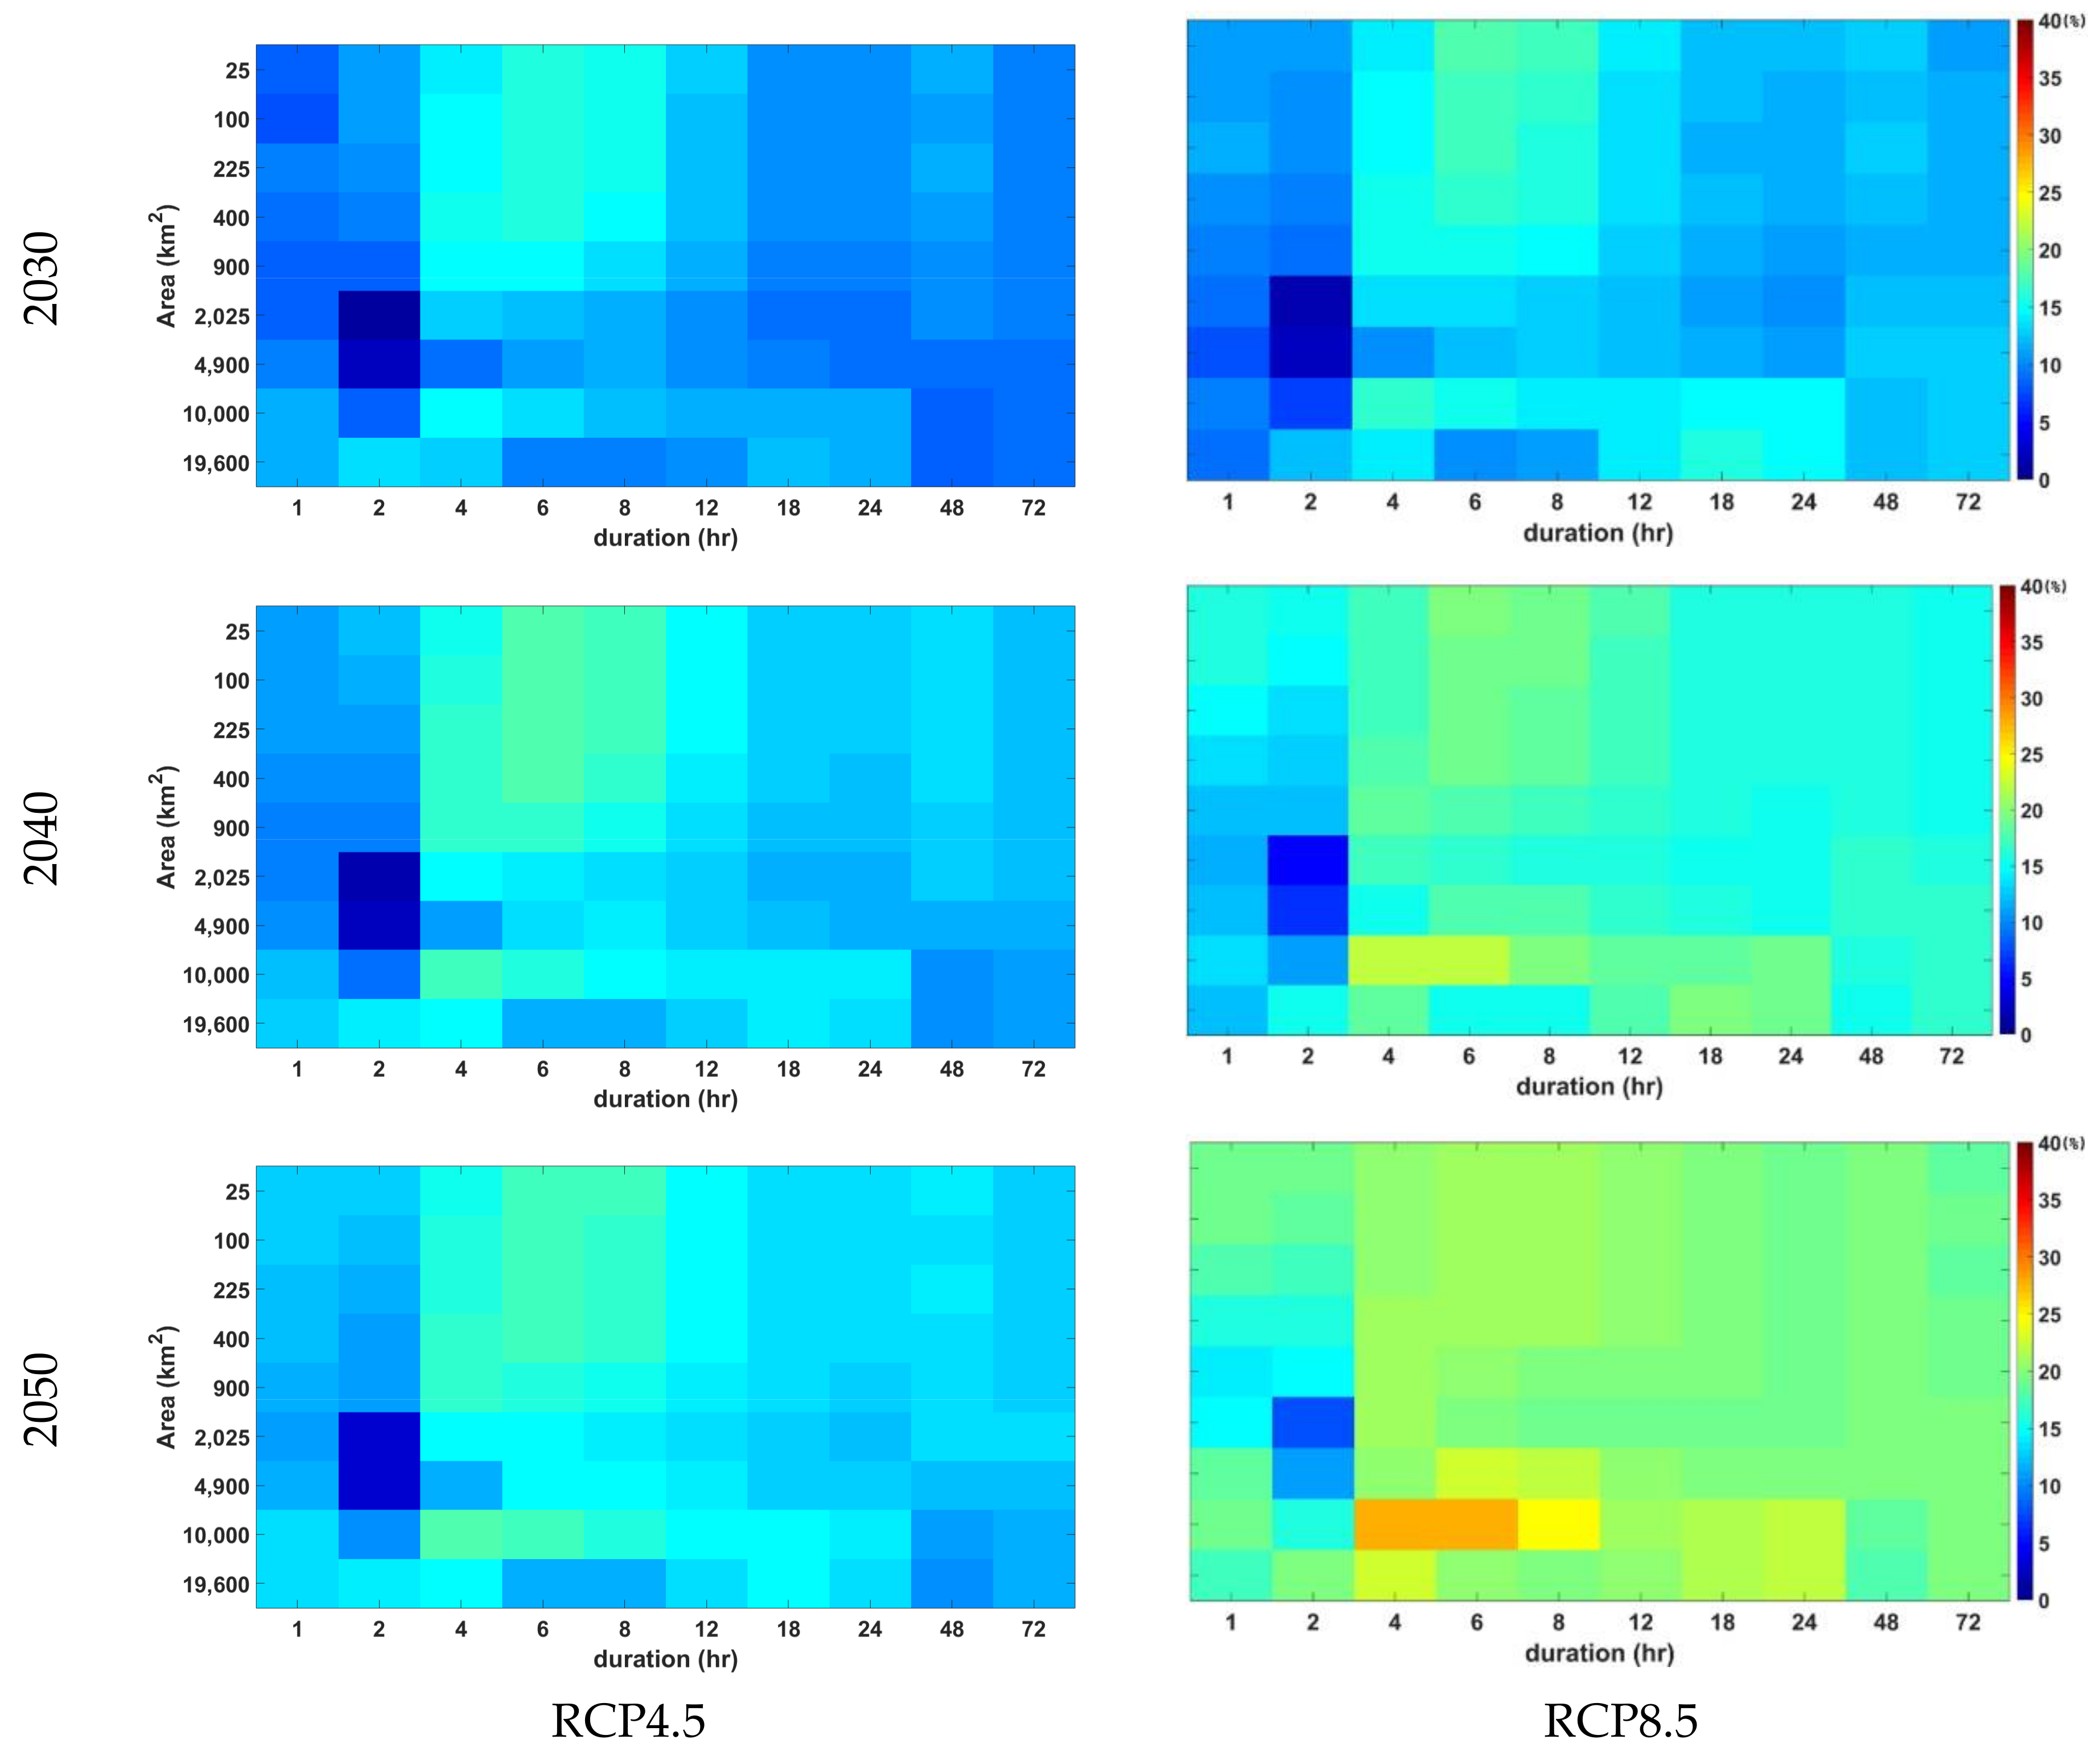
Figure 10, Figure 11 and Figure 12 show the rate of change (%) of future PMPs relative to present PMPs for various RCMs and RCP scenarios in future years (2030, 2040, and 2050). For reference, the rate of change shown in Figure 10, Figure 11 and Figure 12 is the mean value of the rate of change of PMPs for all durations and areas, so the rate of change of PMPs at a specific location has a rate of change greater or smaller than the value shown.
Looking at the rate of change of future PMPs estimated from Hadgem3-RA, the difference between RCP 4.5 and RCP 8.5 in the future year 2030 is not large, and shows an average increase of about 10%. The difference between RCP scenarios increases with the future, and the rate of change of future PMPs estimated under RCP 8.5 scenario in the future year 2050 increases dramatically when the duration exceeds 4-h. The longer the future, the longer the duration, and the larger the area, the greater the rate of change of future PMPs. On the other hand, it is found that the rate of change of future PMPs estimated from RegCM-V4 and YSU-RSM increases in a similar pattern. Future PMPs estimated from RegCM-V4 in the future year 2040 increase by an average of 14%, and future PMPs estimated from YSU-RSM increase by an average of 13%. As with Hadgem3-RA, the longer the duration, the greater the rate of change of future PMPs.
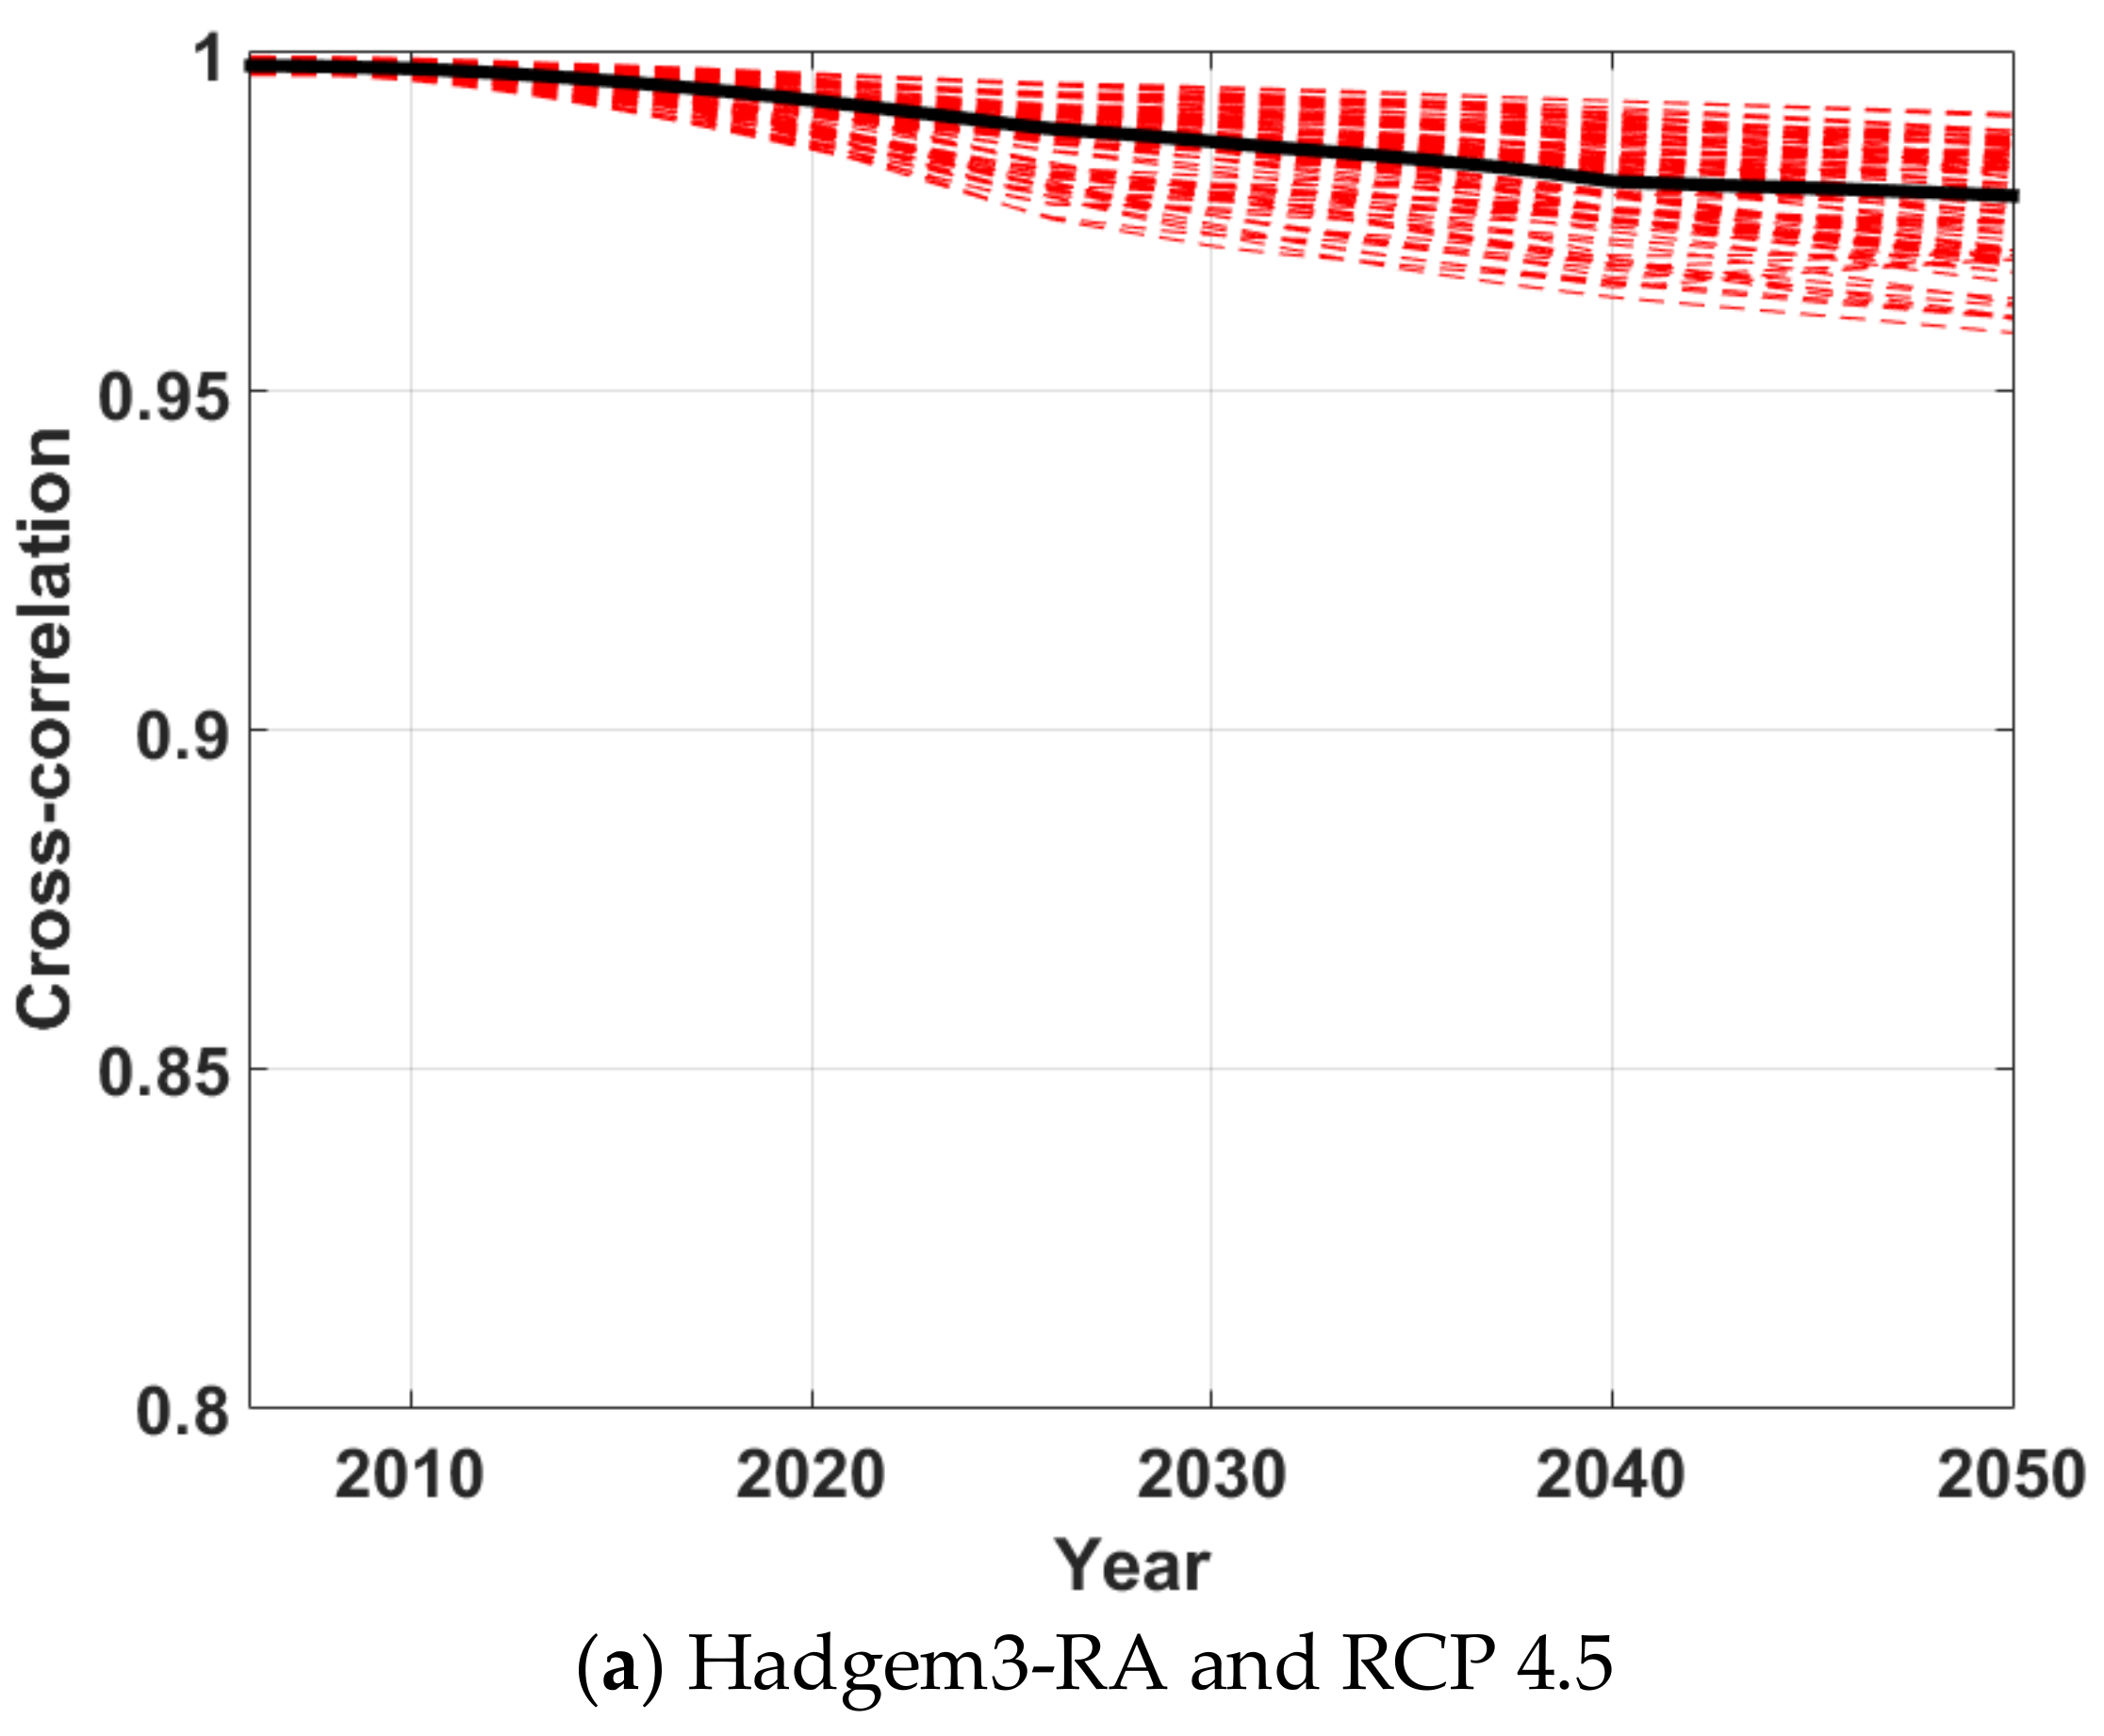
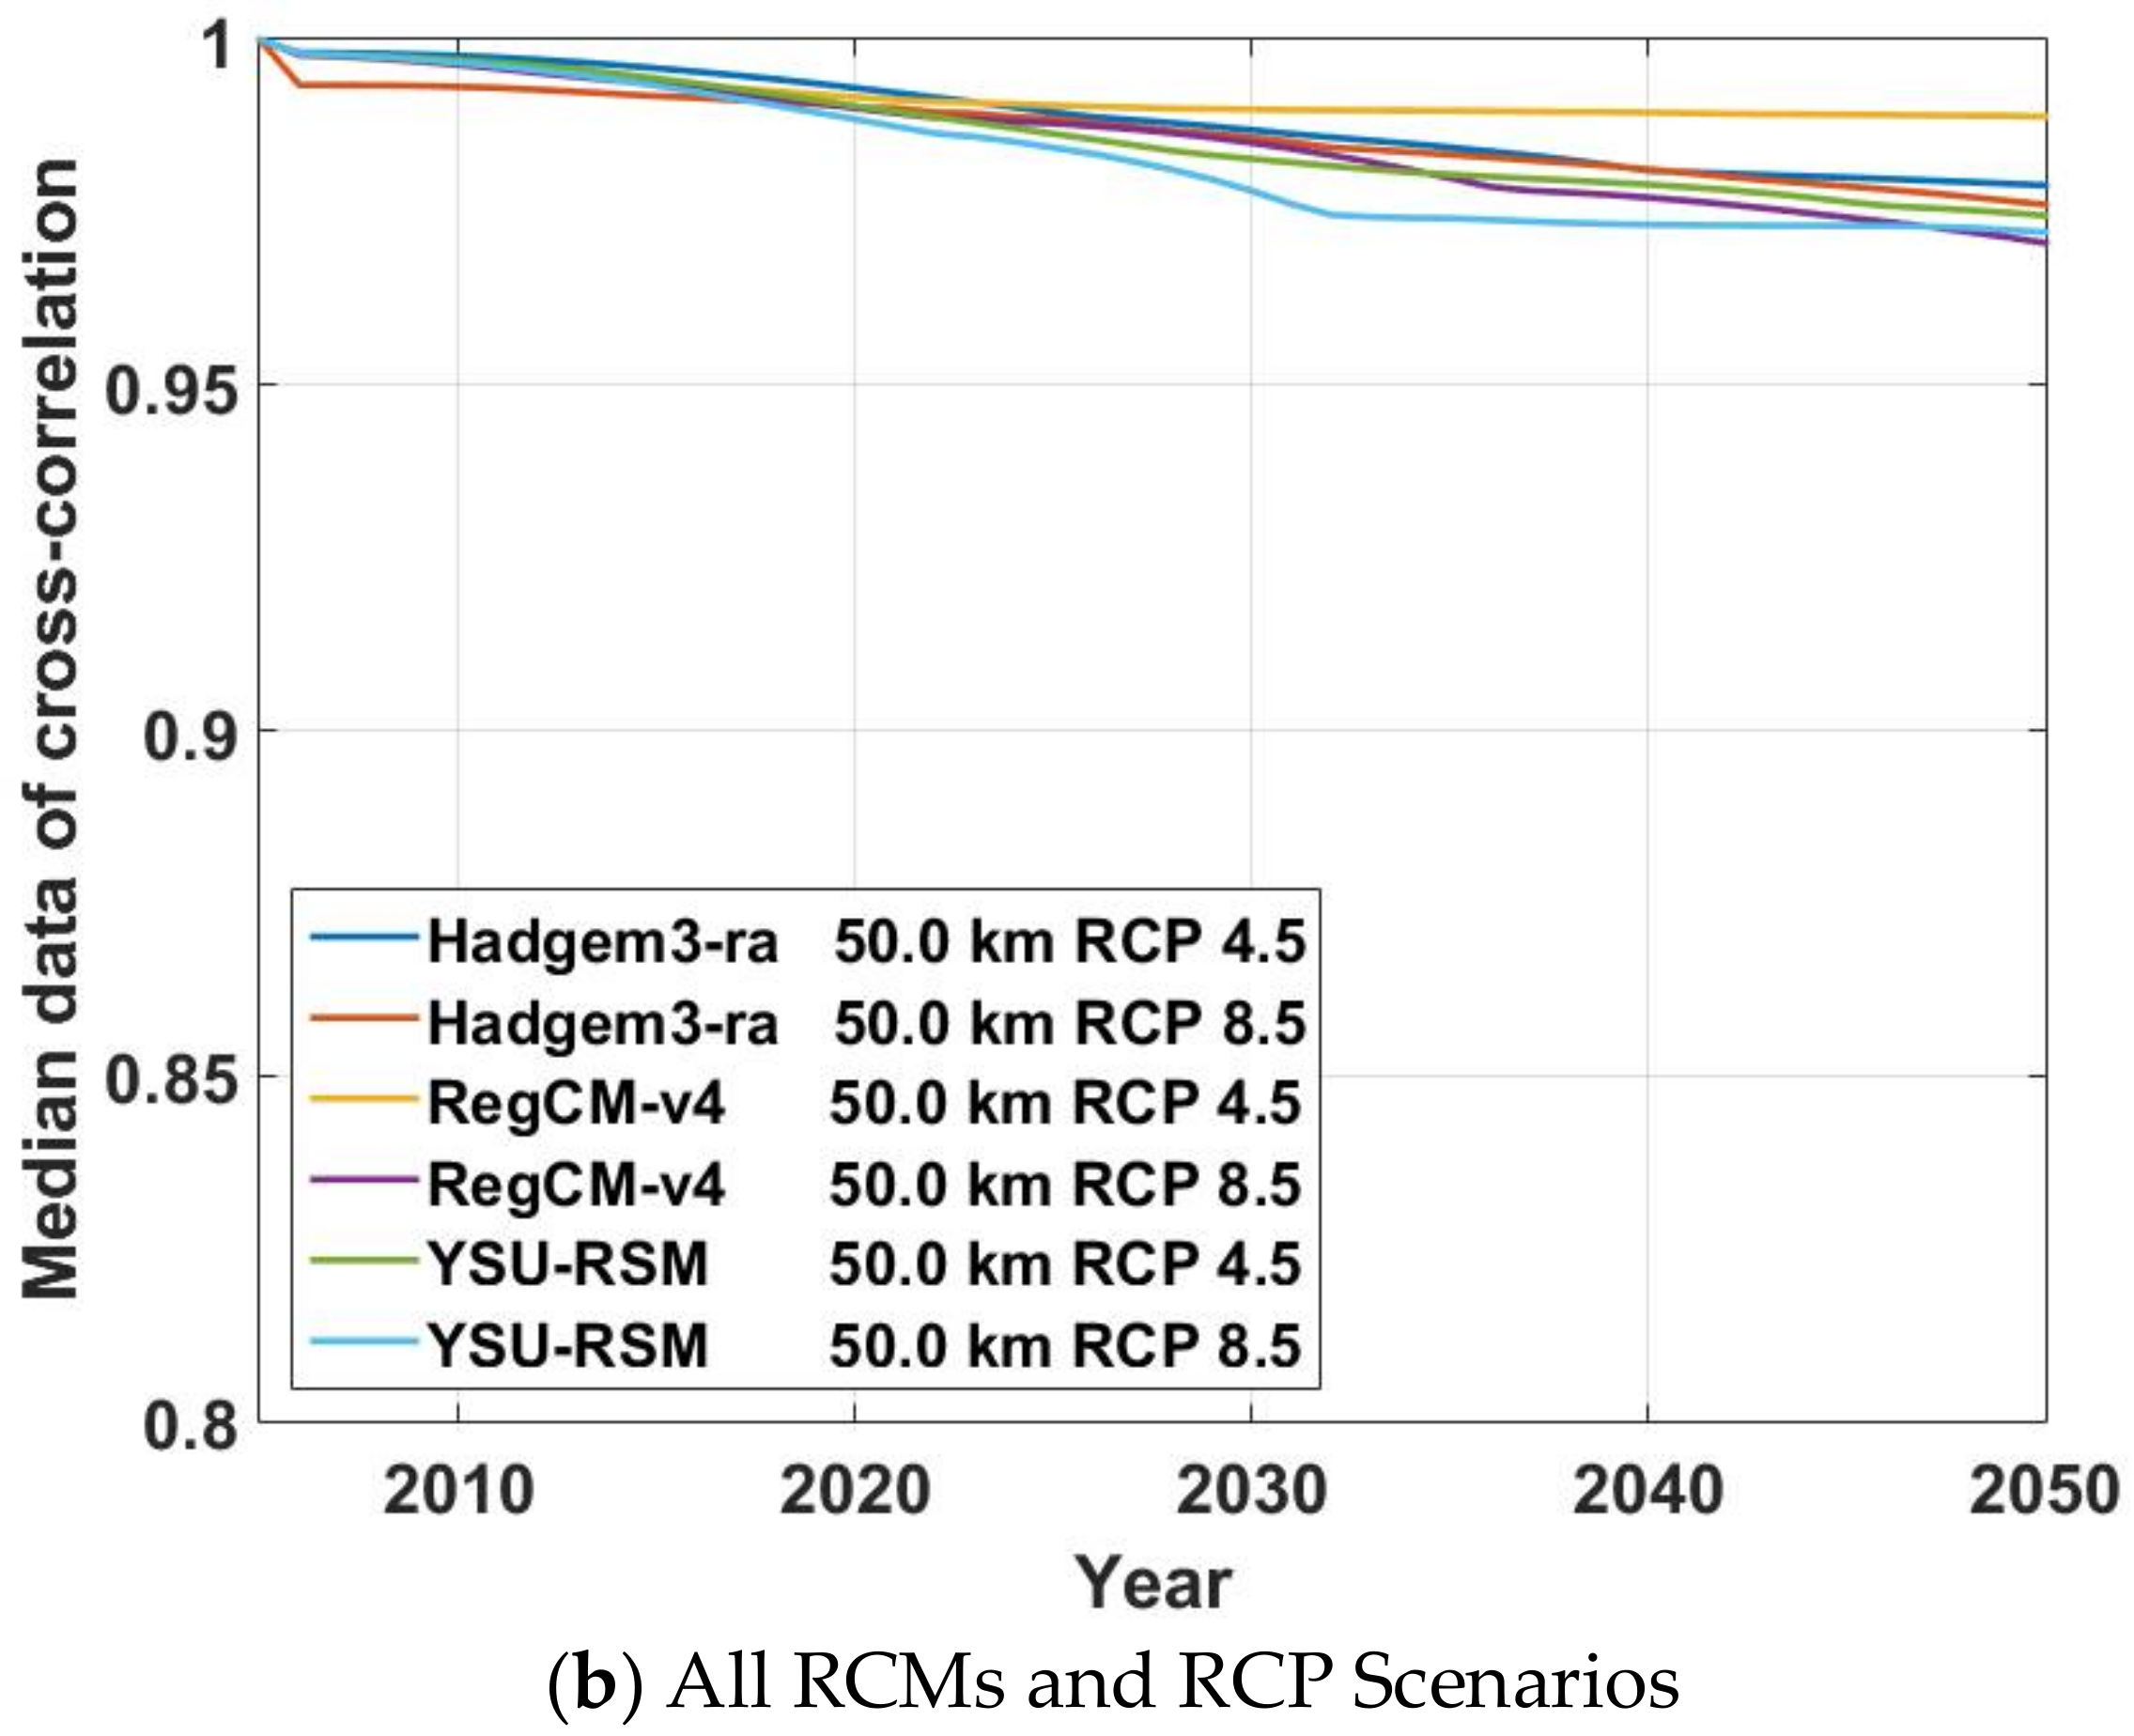
It will be necessary to analyze not only the overall future PMPs change, but also how the spatial patterns of PMPs will change in the future. The change of the spatial pattern can be examined by calculating the cross-correlation coefficient between present PMPs and future PMPs. The degree of change of the cross-correlation coefficient between present PMPs and future PMPs for various durations and areas is shown in Figure 13. Figure 13a shows the temporal variation of the cross-correlation coefficient between present PMPs and future PMPs derived from Hadgem3-RA under an RCP 4.5 scenario. In Figure 13a, red dotted lines show the temporal change of the cross-correlation coefficient between future PMPs (total 90 PMPs of the duration-area combination at a particular future year) and the corresponding present PMPs. The solid black line represents the median of the above results. The cross-correlation coefficient is getting smaller in the future, but the degree of change is not large. Figure 13b shows the temporal variation of the average cross-correlation coefficient between present PMPs and future PMPs derived from all RCMs and RCPs scenarios. The spatial pattern change is larger under an RCP 8.5 scenario than under RCP 4.5 scenarios, but the difference in quantitative values of the cross-correlation coefficient is not significant. Therefore, the spatial patterns of future PMPs are likely to be similar to the spatial patterns of present PMPs.
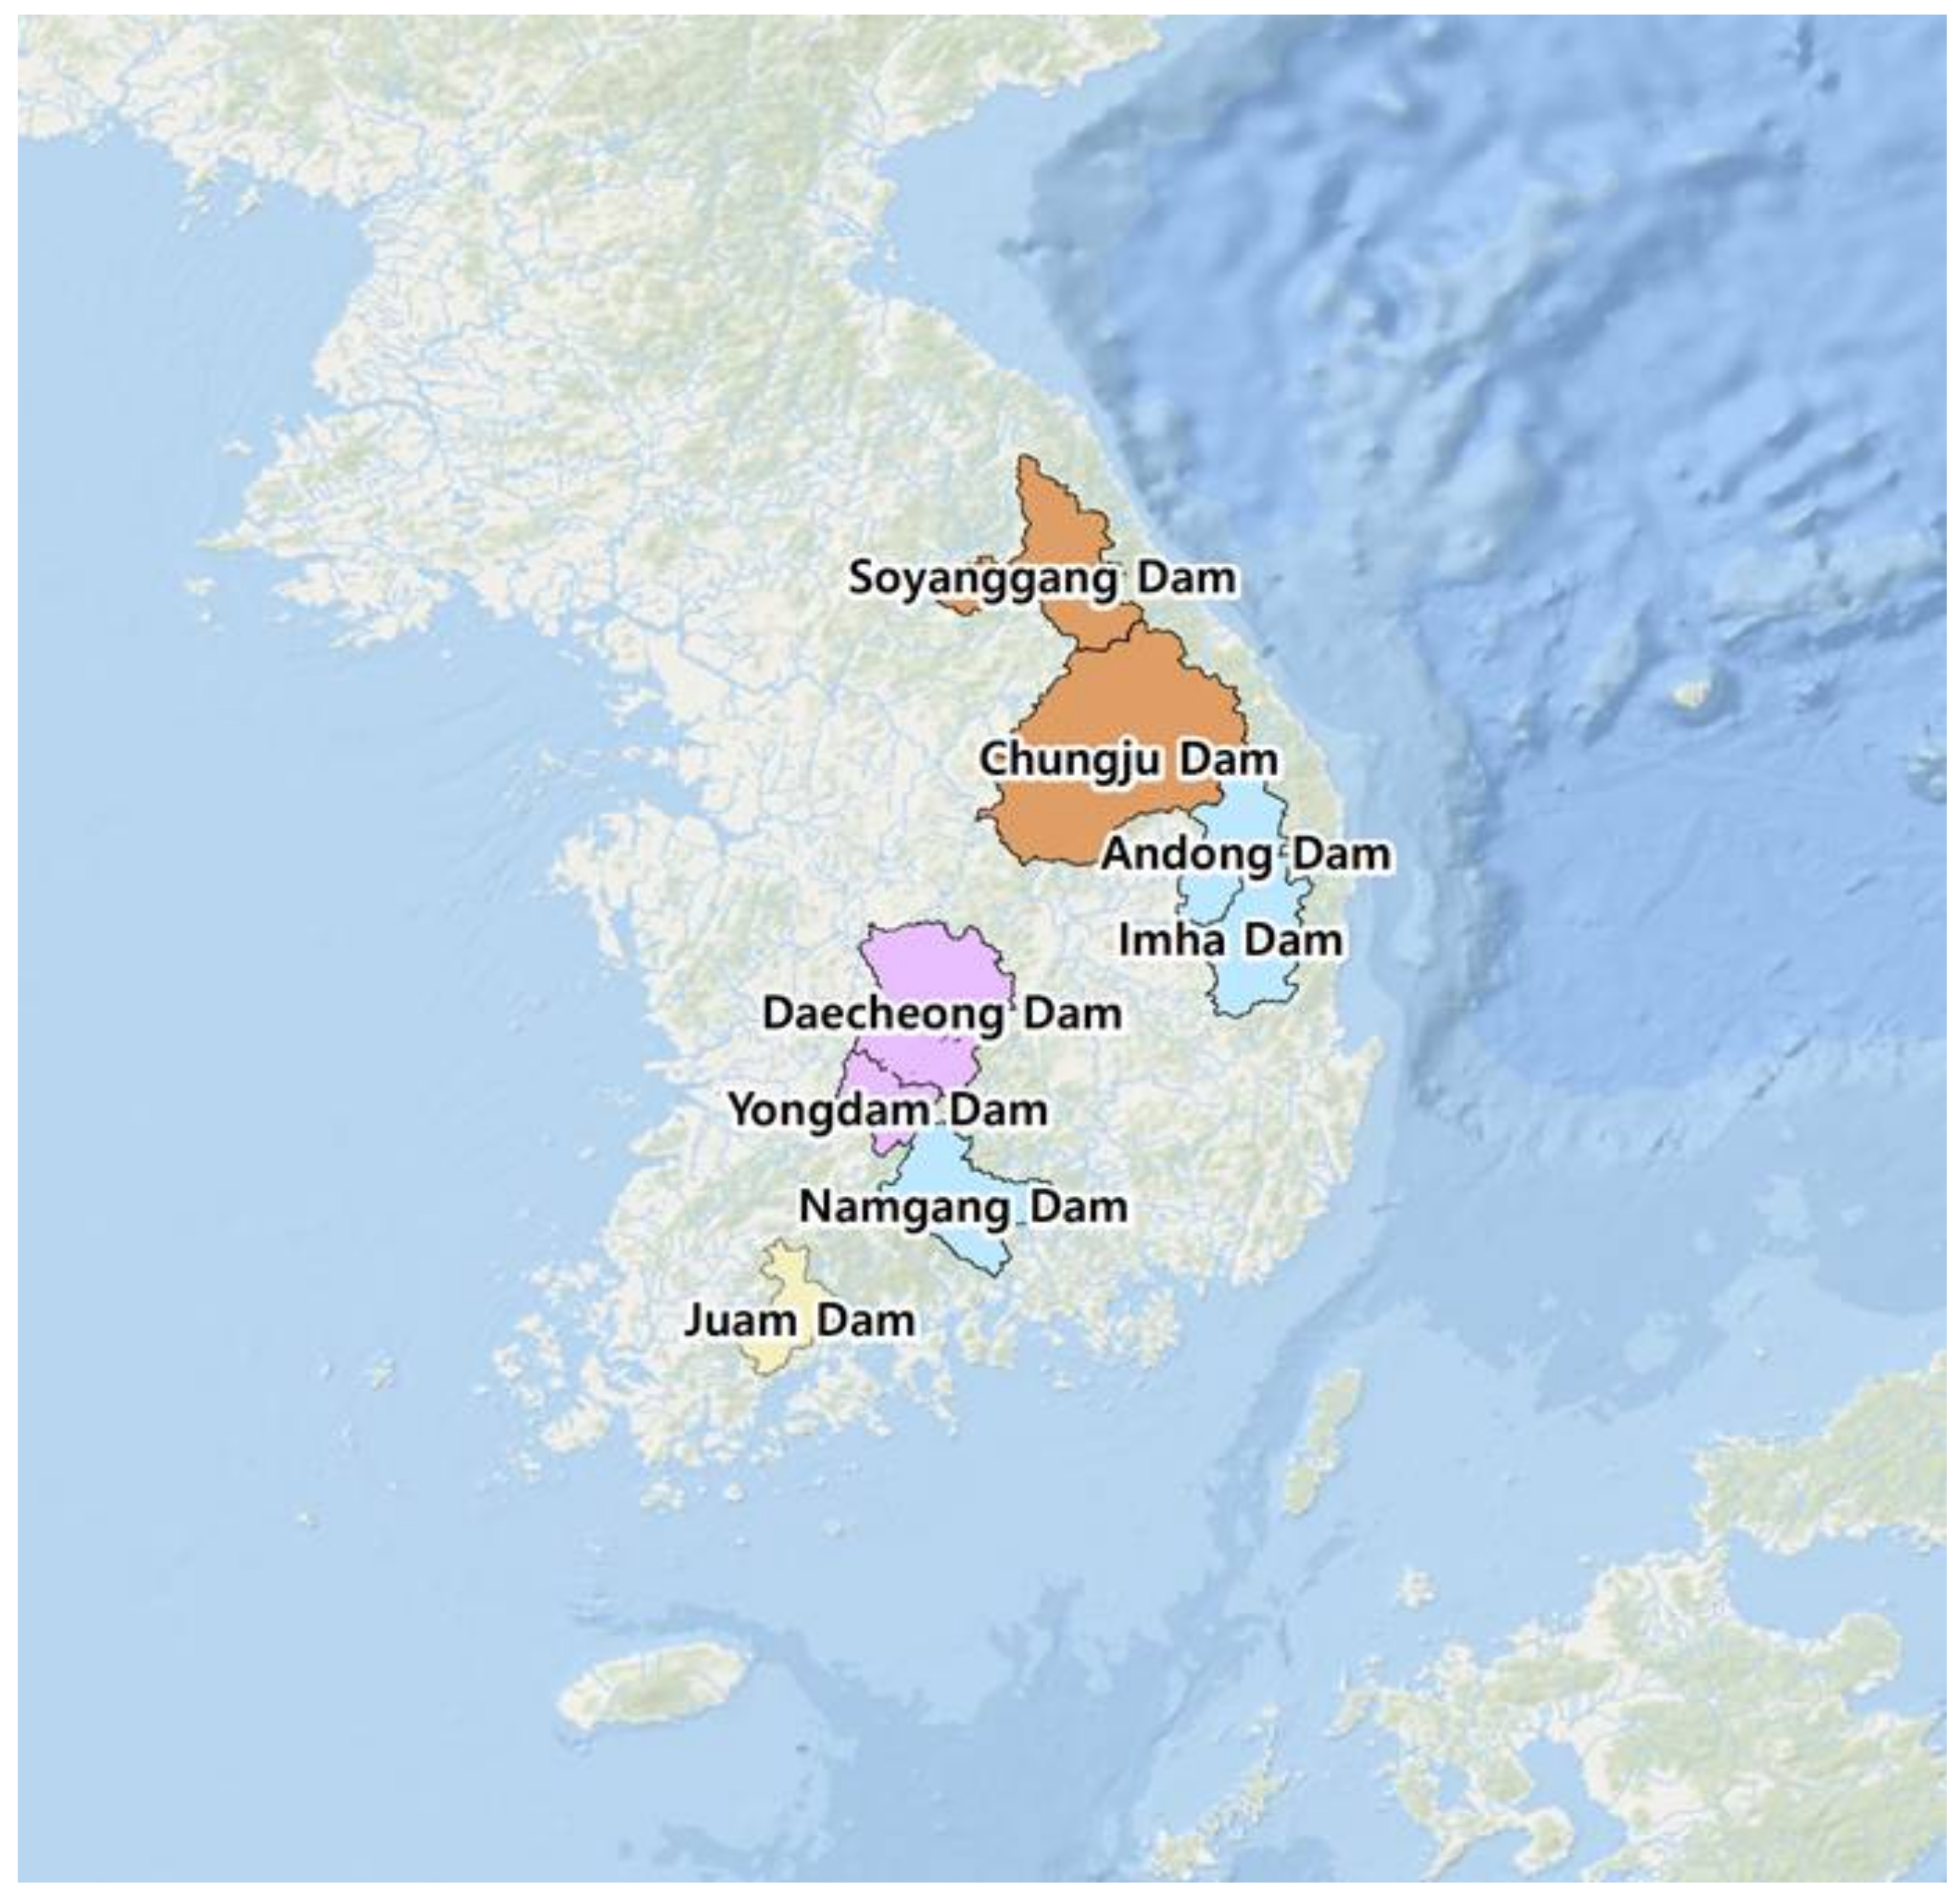
The Korean PMPs are characterized by very large spatial variability due to geographical complexity. Therefore, the analysis of how future PMPs behave in each major basin is very important for the actual climate change adaptation plan. In this study, after selecting large multi-purpose dams in major basins, the rate of change of future PMPs in each dam watershed was compared in the future year 2050. Hadgem3-RA of 12.5-km spatial resolution [18] and three CORDEX RCMs were used for the comparison. The area used for estimating PMPs was the watershed area of each dam, and the duration was 24 h. The location of dam watersheds is shown in Figure 14. Table 1 shows the information on the dams.
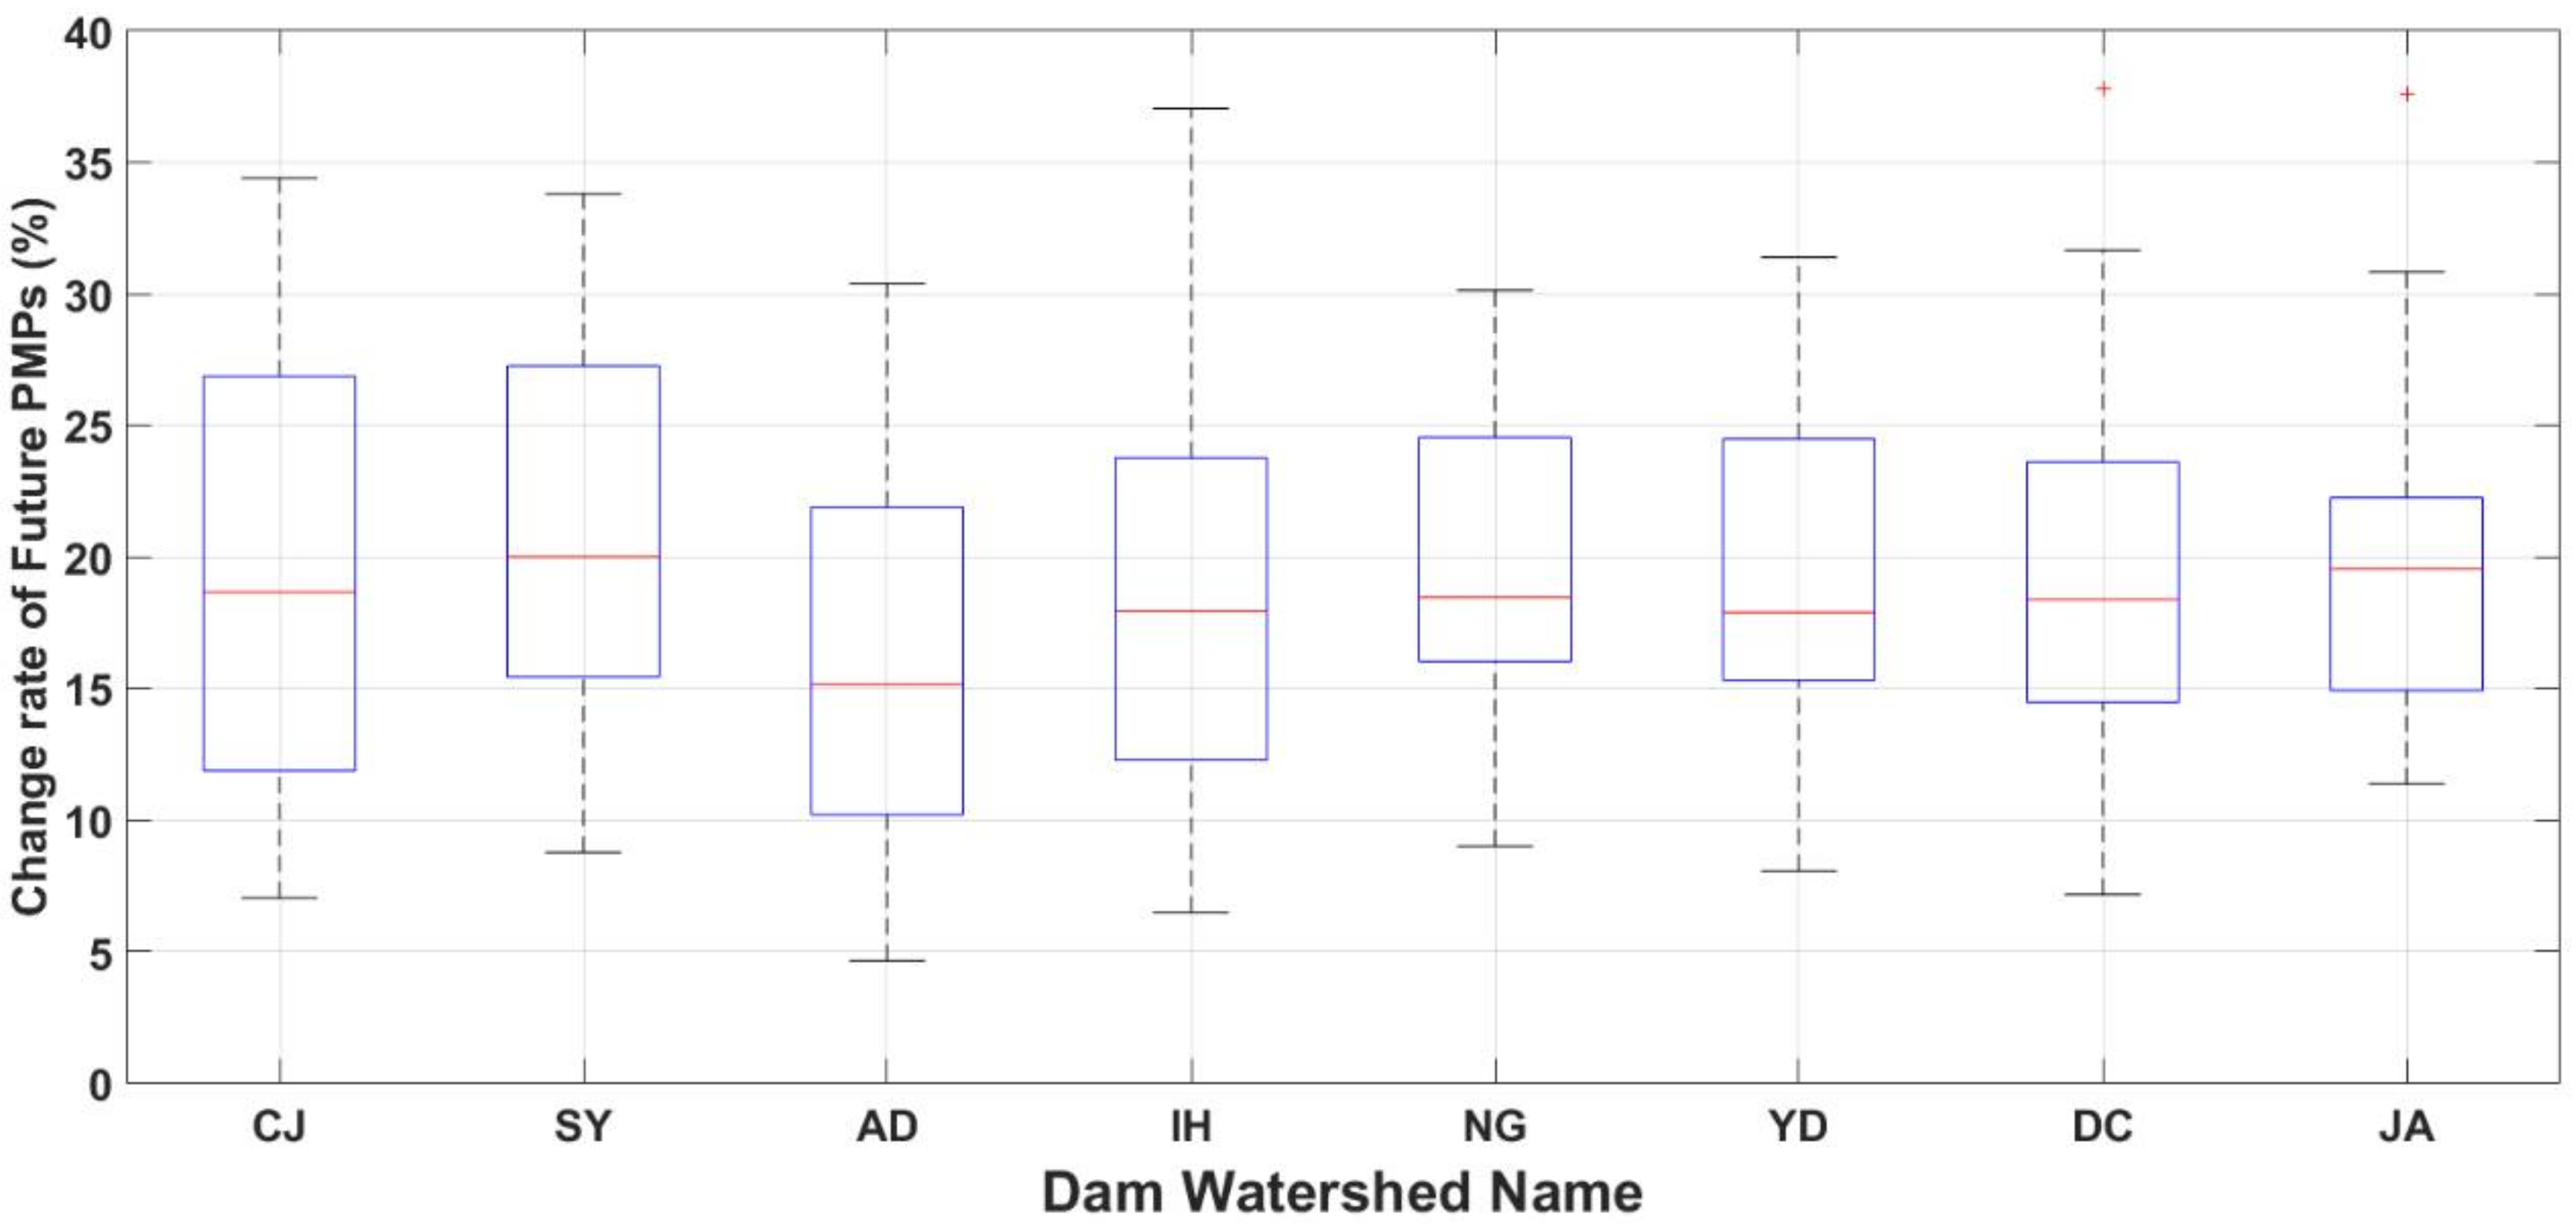
Figure 15 shows the rate of change of future PMPs estimated in the future year 2050 for each dam watershed. Depending on which RCMs and RCP scenarios are applied, even in the same dam watershed, it can be found that the rate of change varies from a minimum of 9% to maximum of 35%. Based on the ensemble average of all analyzed future results, the greatest rate of change is found in the Soyanggang Dam located in the Han River basin. However, when the maximum possible rate of change of future results is taken into consideration, the largest rate of change can be seen in the Imha Dam located in the Nakdong River basin. It can be seen that the rate of change of future PMPs of dams located in the Han River basin (i.e., Soyanggang Dam and Chungju Dam) where Seoul, the largest city in Korea, is located is more likely to be larger than the rate of change of future PMPs in the dams located in other major basins.
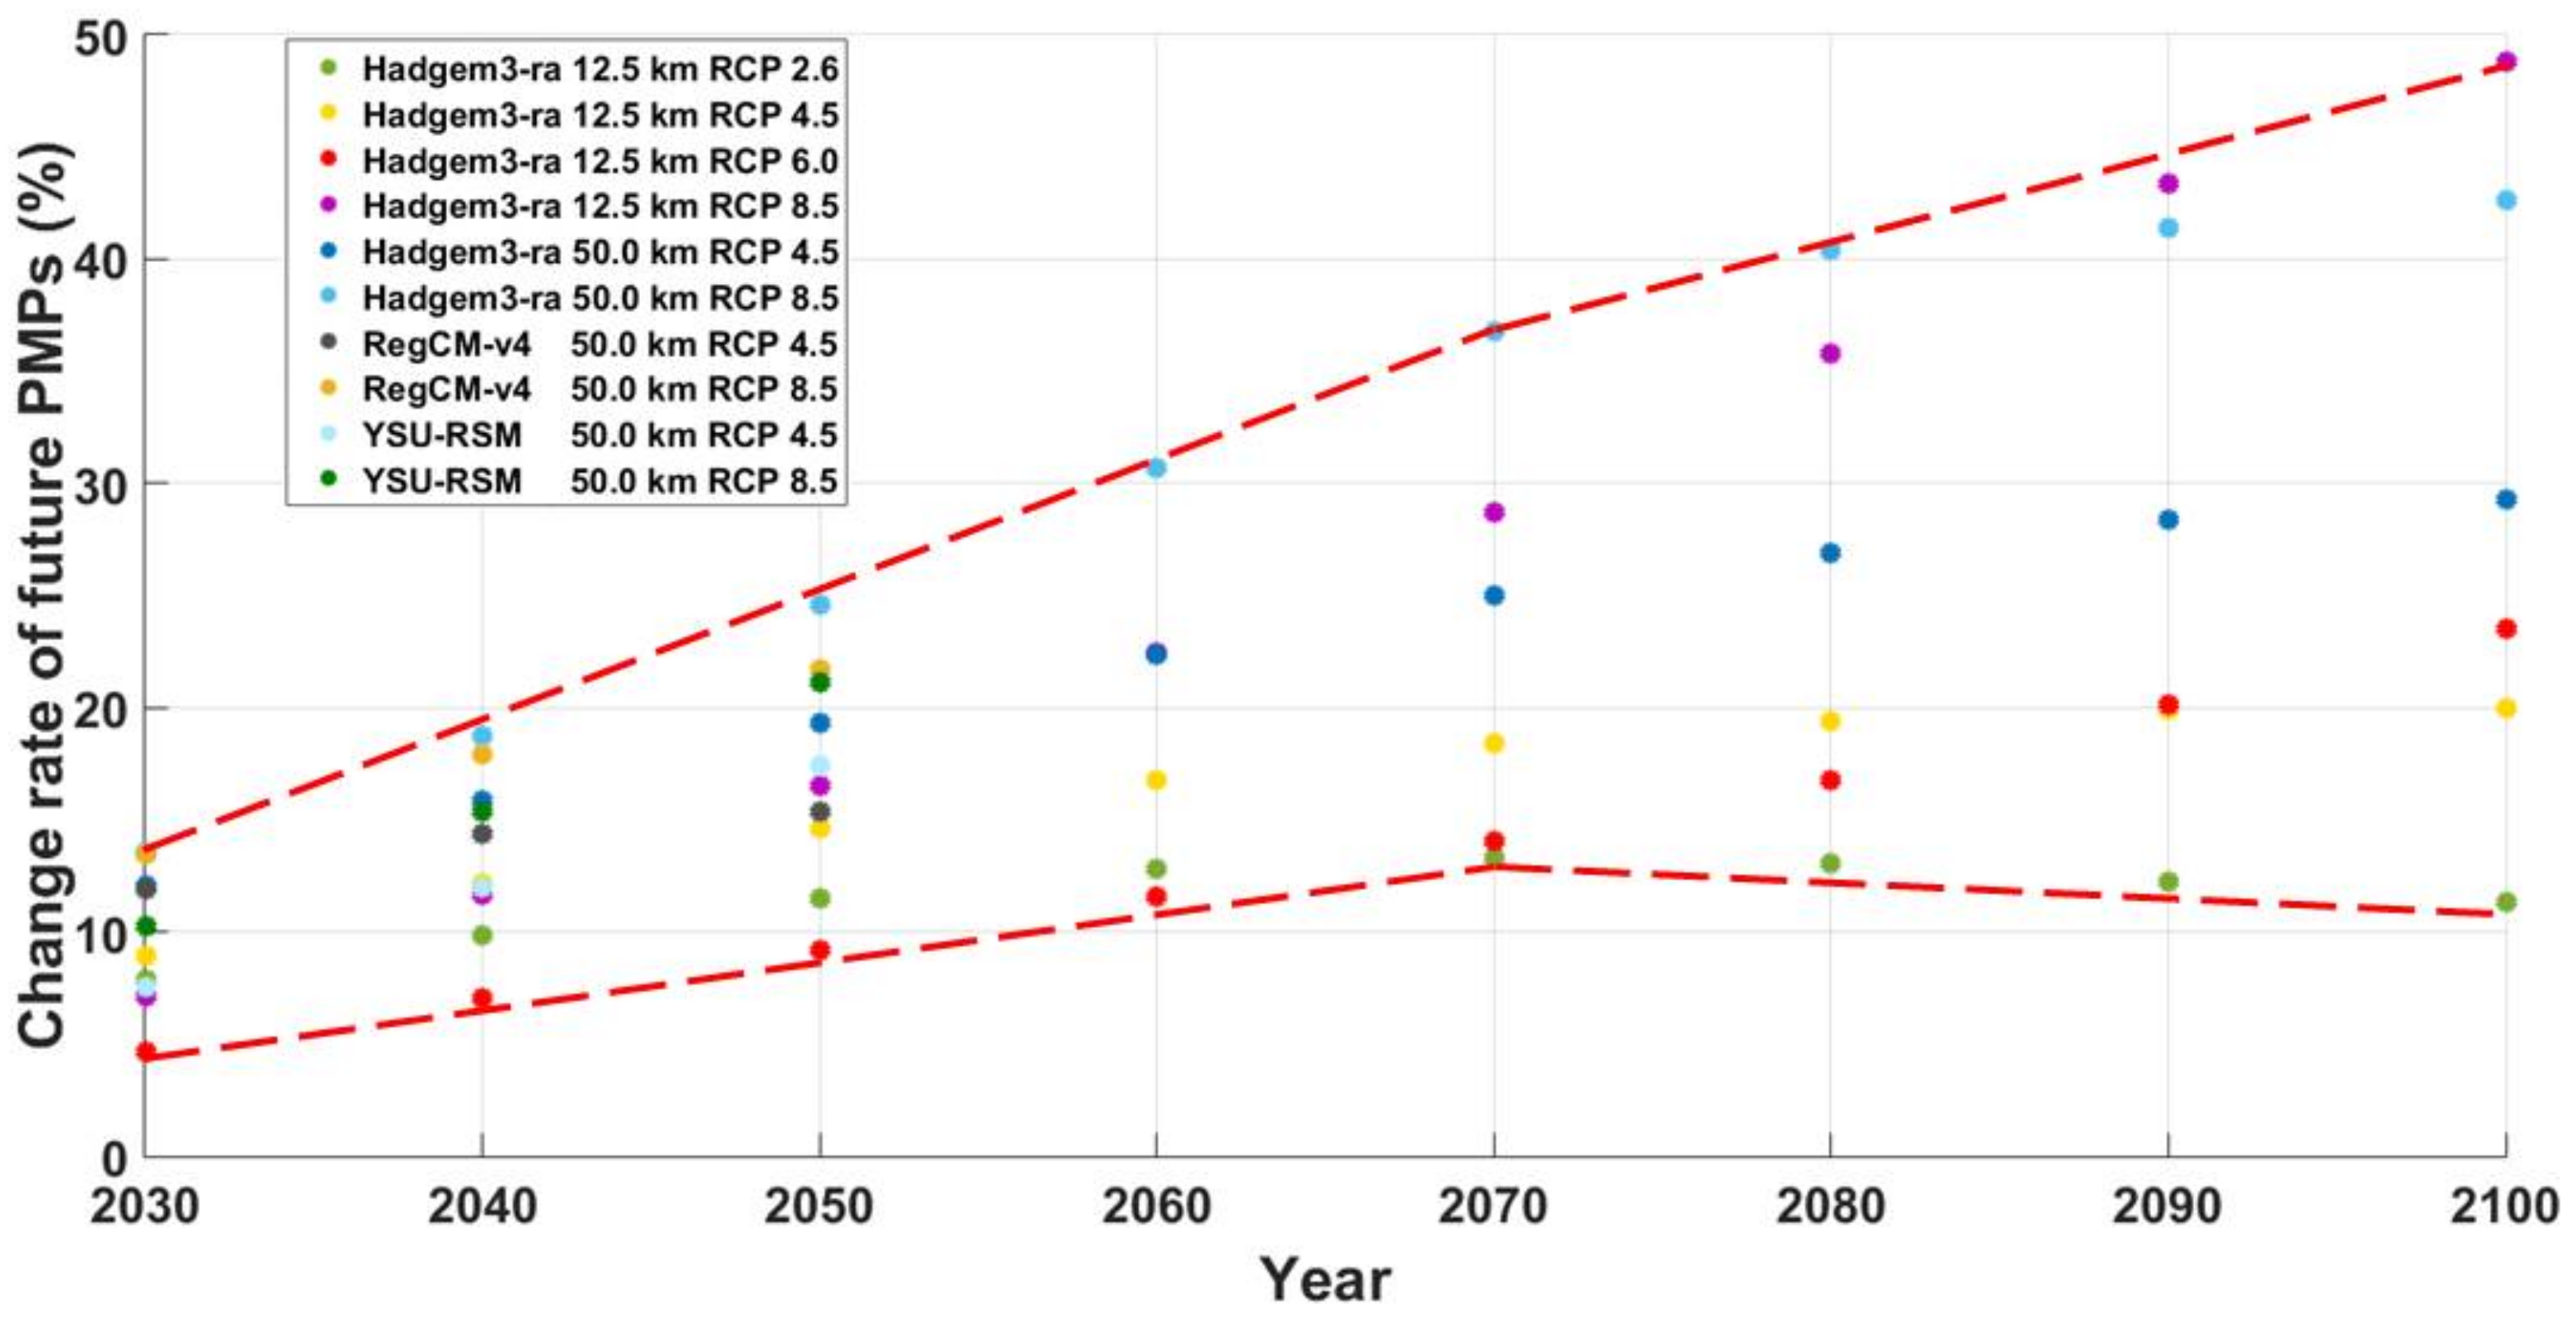
The temporal behavior of the rate of change of future PMPs estimated from Hadgem3-RA with 12.5-km spatial resolution [18] and 3 CORDEX RCMs is shown in Figure 16. The rate of change of future PMPs shown in Figure 16 was calculated on the basis of the spatial mean values of PMPs with a duration of 24 h and an area of 900 km2. Due to the uncertainty of future projections, it can be seen that the rate of change of future PMPs varies depending on which RCM and RCP scenario are applied, and the difference in the rate of change of future PMPs is increasing with the future. Meanwhile, the rate of change of all future PMPs except for future PMPs produced from Hadgem3-RA (12.5-km) under the RCP 6.0 scenario is more than 10% in the future year 2050. The change rate of future PMPs in the future year 2050 is expected to increase by 11–23%, and its median is estimated to be 17.7%. Therefore, although it is short-term, at least 18% increase in PMPs should be reflected when establishing national adaptation policies for climate change. However, as can be seen in Figure 15, since the rate of change of future PMPs may vary locally, large hydraulic structures or nationally very important infra-structures may need to be re-evaluated or re-designed to reflect regional characteristics. The projection in the future year 2070 and beyond is likely to be unreliable due to the large difference in future PMPs estimation depending on which RCMs or RCP scenarios is applied.
One interesting point is the difference in the spatial resolution of Hadgem3-RA. Lee et al. [18] estimated future PMPs from Hadgem3-RA of 12.5-km spatial resolution provided by KMA, while future PMPs were estimated from Hadgem3-RA of 50-km spatial resolution provided by CODEX in this study. In both studies, the applied RCM is the same, but the spatial resolution of the RCM is different. Looking at the rate of change of future PMPs under the RCP 8.5 scenario in the future year 2050, it is expected to increase by 18.2% for Hadgem3-RA (12.5-km) and by 22.8% for Hadgem3-RA (50-km). For RCP 4.5 scenarios, the rate of change of future PMPs estimated from Hadgem3-RA (12.5-km) and Hadgem3-RA (50-km) was projected to increase by 17.1% and 18.5%, respectively. Since 400-year control run for Hadgem3-RA (12.5-km) was applied and 200-year control run for the Hadgem3-RA (50-km) was applied, it is difficult to say that such a difference of the rate of change of future PMPs is caused only by the difference in spatial resolution, but it is probable that the spatial resolution difference of RCMs may have influenced the difference in future PMPs.
5. Conclusions
In this study, future PMPs were estimated by the hydro-meteorological method using future meteorological variables produced from three RCMs (Hadgem3-RA, RegCM-V4, and YSU-RSM) of 50-km spatial resolution provided by CORDEX.
The future meteorological variable used to look at changes in future PMPs is the dew-point temperature, a key meteorological variable for calculating maximum precipitable water. Since CORDEX RCMs do not provide dew-point temperature directly, the dew-point temperature was calculated using various meteorological variables provided. Since the meteorological variables produced from CORDEX RCMs are all daily units, the time resolution of the calculated future dew-point temperature time series is also the daily unit. Since estimating PMPs requires a future 12-h persistence 100-year return period extreme dew-point temperature, it is not possible to use the given daily data directly for PMPs estimation. Since the hourly dew-point temperature time series observed at a number of meteorological stations in Korea are analyzed to have simple scale characteristics, the future 12-h persistence 100-year return period extreme dew-point temperature is derived using the scale-invariance method, and then PMPs were estimated.
As a result of estimating future PMP using several RCMs and RCP scenarios, the spatial pattern of future PMPs is expected to be similar to that of present PMPs, but PMPs tend to increase with the future. In addition, the difference in PMPs estimation results by RCMs and by RCP scenarios is increased as the future progresses. Especially, after the future year 2070, the difference of PMPs by RCP scenarios and by RCMs is significantly increased.
As a result of analyzing the patterns of future PMPs changes with respect to duration and area, the increase rate of future PMPs was larger as the duration was longer, but the increase rate of future PMPs in area did not show a big difference. The increase rate of future PMPs for RCMs and RCP scenarios is more sensitive than the increase rate of future PMPs for duration and area. The spatial resolution of RCMs may also affect future PMPs increase rate.
In conclusion, considering the realistic conditions, it would be desirable to apply the 18% PMPs increase rate, which is the median of the ensemble increase rate in the future year 2050, to the national climate change adaptation policy formulation.
In this study, future PMP values had been projected as a table, or enveloping DAD curves. Therefore, an appropriate temporal distribution of rainfall increments should be determined to produce maximum runoff for the amounts of rainfall involved. In addition, since future PMP values for a particular location were presented in tabular form or by DAD curves, spatial distribution over the project basin should be determined.
Author Contributions
Conceptualization, O.L. and S.K.; Methodology, O.L. and S.K.; Validation, O.L. and S.K.; Formal Analysis, O.L.; Investigation, O.L.; Resources, S.K.; Data Curation, O.L.; Writing-Original Draft Preparation, O.L.; Writing-Review & Editing, O.L., S.K.; Visualization, O.L.; Supervision, S.K.; Project Administration, S.K.; Funding Acquisition, S.K.
Funding
This work is supported by the Korea Agency for Infrastructure Technology Advancement (KAIA) grant funded by the Ministry of Land, Infrastructure and Transport (Grant 18AWMP-B083066-05).
Acknowledgments
This work is supported by the Korea Agency for Infrastructure Technology Advancement (KAIA) grant funded by the Ministry of Land, Infrastructure and Transport (Grant 18AWMP-B083066-05).
Conflicts of Interest
The authors declare no conflicts of interest.
References
- Huston Is Experiencing Its Third ‘500-Year’ Flood Is 3 Years. How Is That Possible? The Washington Post. 29 August 2017. Available online: www.washingtonpost.com (accessed on 1 September 2017).
- A Super-Typhoon North of 34 Degrees North, the Korean Peninsula Is Also an ‘Alarm Situation’. The Hankyoreh. 10 October 2017. Available online: m.hani.co.kr (accessed on 1 September 2017).
- World Meteorological Organization. Manual for Estimation of Probable Maximum Precipitation, 2nd ed.; Operational Hydrology Report No. 1, WMO No. 332; World Meteorological Organization: Geneva, Switzerland, 1986. [Google Scholar]
- Lee, J.; Choi, J.; Lee, O.; Yoon, J.; Kim, S. Estimation of Probable Maximum Precipitation in Korea using a Regional Climate Model. Water 2017, 4, 240. [Google Scholar] [CrossRef]
- Casas, M.C.; Rodríguez, R.; Prohom, M.; Gázquez, A.; Redaño, A. Estimation of the probable maximum precipitation in Barcelona (Spain). Int. J. Climatol. 2011, 31, 1322–1327. [Google Scholar] [CrossRef] [Green Version]
- Benson, M.A. Thoughts on the design of design floods. In Floods and Droughts (Proc. Second Int. Symp. In Hydrology); Water Resources Publications: Fort Collins, CO, USA, 1973; pp. 27–33. [Google Scholar]
- Dingman, S.L. Physical Hydrology; Prentice Hall: Upper Saddle River, NJ, USA, 1994. [Google Scholar]
- Koutsoyiannis, D. A probabilistic view of Hershfield’s method for estimating probable maximum precipitation. Water Resour. Res. 1999, 4, 1313–1322. [Google Scholar] [CrossRef]
- Beauchamp, J.; Leconte, R.; Trudel, M.; Brissette, F. Estimation of the summer-fall PMP and PMF of a northern watershed under a changed climate. Water Resour. Res. 2013, 6, 3852–3862. [Google Scholar] [CrossRef]
- Rousseau, A.N.; Klein, I.M.; Freudiger, D.; Gagnon, P.; Frigon, A.; Ratté-Fortin, C. Development of a methodology to evaluate probable maximum precipitation (PMP) under changing climate conditions: Application to southern Quebec, Canada. J. Hydrol. 2014, 519, 3094–3109. [Google Scholar] [CrossRef]
- Rouhani, H.; Leconte, R. A novel method to estimate the maximization ratio of the Probable Maximum Precipitation (PMP) using regional climate model output. Water Resour. Res. 2016, 9, 7347–7365. [Google Scholar] [CrossRef]
- Tebaldi, C.; Knutti, R. The use of the multi-model ensemble in probabilistic climate projections. Philos. Trans. R. Soc. Lond. A Math. Phys. Eng. Sci. 2007, 1857, 2053–2075. [Google Scholar] [CrossRef] [PubMed]
- Fowler, H.J.; Ekström, M. Multi-model ensemble estimates of climate change impacts on UK seasonal precipitation extremes. Int. J. Climatol. 2009, 3, 385–416. [Google Scholar] [CrossRef]
- Kim, J.; Waliser, D.E.; Mattmann, C.A.; Goodale, C.E.; Hart, A.F.; Zimdars, P.A.; Jack, C. Evaluation of the CORDEX-Africa multi-RCM hindcast: Systematic model errors. Clim. Dyn. 2014, 5, 1189–1202. [Google Scholar] [CrossRef]
- Lee, A.; Cho, S.; Kang, D.K.; Kim, S. Analysis of the effect of climate change on the Nakdong river stream flow using indicators of hydrological alteration. J. Hydro-Environ. Res. 2014, 8, 234–247. [Google Scholar] [CrossRef]
- KGAWC. Available online: http://www.climate.go.kr/home (accessed on 1 September 2017).
- CORDEX. Available online: http://cordex-ea.climate.go.kr/cordex/mainPage.do (accessed on 31 January 2017).
- Lee, O.; Park, Y.; Kim, E.S.; Kim, S. Projection of Korean probable maximum precipitation under future climate change scenarios. Adv. Meteorol. 2016, 2016, 3818236. [Google Scholar] [CrossRef]
- Ministry of Construction and Transportation. Estimation of Probable Maximum Precipitation in Korea; Study on the Water Resources Management Technique: II; Korea Institute of Civil Engineering and Building Technology: Gangneung, Korea, 2000. (In Korean) [Google Scholar]
- World Meteorological Organization. Manual on Estimation of Probable Maximum Precipitation (PMP); WMO No. 1045; World Meteorological Organization: Geneva, Switzerland, 2009; p. 257. [Google Scholar]
- Kunkel, K.E.; Karl, T.R.; Easterling, D.R.; Redmond, K.; Young, J.; Yin, X.; Hennon, P. Probable maximum precipitation and climate change. Geophys. Res. Lett. 2013, 7, 1402–1408. [Google Scholar] [CrossRef]
- Burlando, P.; Rosso, R. Extreme storm rainfall and climatic change. Atmos. Res. 1991, 1, 169–189. [Google Scholar] [CrossRef]
- Ghanmi, A.; Saoudi, K. A multiplicity results for a singular problem involving the fractional p-Laplacian operator. Complex Var. Elliptic Equ. 2016, 61, 1199–1216. [Google Scholar] [CrossRef]
- Blanchet, J.; Gallego, G.; Goyal, V. A markov chain approximation to choice modeling. Oper. Res. 2016, 4, 886–905. [Google Scholar] [CrossRef]
- Rodríguez-Solà, R.; Casas-Castillo, M.C.; Navarro, X.; Redaño, Á. A study of the scaling properties of rainfall in Spain and its appropriateness to generate intensity-duration-frequency curves from daily records. Int. J. Climatol. 2017, 2, 770–780. [Google Scholar] [CrossRef]
- Chow, V.T. A general formula for hydrologic frequency analysis. EOS Trans. Am. Geophys. Union 1951, 2, 231–237. [Google Scholar] [CrossRef]
- Liuzzo, L.; Freni, G. Analysis of extreme rainfall trends in sicily for the evaluation of depth-duration-frequency curves in climate change scenarios. J. Hydrol. Eng. 2015, 12, 04015036. [Google Scholar] [CrossRef]
Figure 1.
Location of selected meteorological stations.

Figure 2.
Procedure for future PMPs using the hydro-meteorological method with future meteorological data produced from RCMs.
Figure 2.
Procedure for future PMPs using the hydro-meteorological method with future meteorological data produced from RCMs.

Figure 3.
Bias-correction of daily dew-point temperature driven by CORDEX RCMs (Seoul station).

Figure 4.
The relationship between the values of moment and dew-point temperature persistence interval at Seoul station in the first half of August.
Figure 4.
The relationship between the values of moment and dew-point temperature persistence interval at Seoul station in the first half of August.

Figure 5.
Scale exponents with respect to various orders of moment at Seoul station in the first half of August.
Figure 5.
Scale exponents with respect to various orders of moment at Seoul station in the first half of August.

Figure 6.
Comparison of extreme dew-point temperature established by the method of simple scaling and sample quantiles’ estimates for return period of 100-year and persistence interval of 12-h at Seoul station in the first half of August.
Figure 6.
Comparison of extreme dew-point temperature established by the method of simple scaling and sample quantiles’ estimates for return period of 100-year and persistence interval of 12-h at Seoul station in the first half of August.

Figure 7.
Future annual maximum persistence interval 24-h dew-point temperature for Hadgem3-RA and RCP 8.5 at Seoul station in the first half of August.
Figure 7.
Future annual maximum persistence interval 24-h dew-point temperature for Hadgem3-RA and RCP 8.5 at Seoul station in the first half of August.

Figure 8.
Trend of future extreme dew-point temperature for return period of 100-year and persistence interval of 12-h at Seoul station in the first half of August.
Figure 8.
Trend of future extreme dew-point temperature for return period of 100-year and persistence interval of 12-h at Seoul station in the first half of August.

Figure 9.
Comparison between PMPs estimated from observed data and PMPs estimated from present-climate data simulated by various RCMs.
Figure 9.
Comparison between PMPs estimated from observed data and PMPs estimated from present-climate data simulated by various RCMs.

Figure 10.
PMPs change rate (%) driven by Hadgem3-RA.

Figure 11.
PMPs change rate (%) driven by RegCM-V4.


Figure 12.
PMPs change rate (%) driven by YSU-RSM.

Figure 13.
Cross-correlation between present and future PMPs.


Figure 14.
Location of major dam watersheds.

Figure 15.
Rate of change of future PMPs at major dam watersheds in the future year 2050.

Figure 16.
Temporal evolution of the rate of change of future PMPs.


Table 1.
Major dam information.
| Dam | Major River Basin | Area of Dam Watershed (km2) | Total Water Storage Capacity (Million m3) | Flood Control Capacity (Million m3) |
|---|---|---|---|---|
| Chungju Dam (CJ) | Han River | 6705 | 2900 | 770 |
| Soyanggang dam (SY) | Han River | 2783 | 2750 | 616 |
| Andong Dam (AD) | Nakdong River | 1629 | 1248 | 110 |
| Imha Dam (IH) | Nakdong River | 1976 | 595 | 244 |
| Namgang Dam (NG) | Nakdong River | 2282 | 309 | 270 |
| Yongdam Dam (YD) | Geum River | 930 | 815 | 137 |
| Daecheong Dam (DC) | Geum River | 3305 | 1490 | 250 |
| Juam Dam (JA) | Seomjin River | 1030 | 457.0 | 60.0 |
© 2018 by the authors. Licensee MDPI, Basel, Switzerland. This article is an open access article distributed under the terms and conditions of the Creative Commons Attribution (CC BY) license (http://creativecommons.org/licenses/by/4.0/).
Share and Cite
MDPI and ACS Style
Lee, O.; Kim, S. Estimation of Future Probable Maximum Precipitation in Korea Using Multiple Regional Climate Models. Water 2018, 10, 637. https://doi.org/10.3390/w10050637
AMA Style
Lee O, Kim S. Estimation of Future Probable Maximum Precipitation in Korea Using Multiple Regional Climate Models. Water. 2018; 10(5):637. https://doi.org/10.3390/w10050637
Chicago/Turabian StyleLee, Okjeong, and Sangdan Kim. 2018. "Estimation of Future Probable Maximum Precipitation in Korea Using Multiple Regional Climate Models" Water 10, no. 5: 637. https://doi.org/10.3390/w10050637
Note that from the first issue of 2016, this journal uses article numbers instead of page numbers. See further details here.