New Screening tool for Obtaining Concentration Statistics of Pollution Generated by Rivers in Estuaries †


1
Faculty of Civil Engineering, Architecture and Geodesy, University of Split, Split 21000, Croatia
2
School of Energy, Geoscience, Infrastructure and Environment, Institute for Infrastructure and Environment, Heriot-Watt University, Edinburgh EH14 4AS, UK
*
Author to whom correspondence should be addressed.
†
This paper is an extended version of our paper published in Proceedings of the 15th International Conference on Environmental Science and Technology, 31 August–2 September 2017, Athens, Greece.
Water 2018, 10(5), 639; https://doi.org/10.3390/w10050639
Submission received: 29 March 2018
/
Revised: 8 May 2018
/
Accepted: 11 May 2018
/
Published: 15 May 2018
(This article belongs to the Special Issue Hydrology, Water Resources Management and Protection of the Marine Environment–Selected Papers from the 15th International Conference on Environmental Science And Technology (CEST2017))
Abstract
:Rivers represent an essential pathway for waterborne transport, and therefore estuaries are critical coastal areas for a pollution hazard that might lead to eutrophication and general water quality deterioration. When addressing these problems, the decision makers and coastal managers often need additional skills and specialists, so they engage consultants in developing models and providing potential solutions. Different stakeholders’ interests present a challenge in the implementation process of proposed solutions. Nevertheless, if the relevant institutions were presented with a screening tool, enabling them with a certain level of solution ownership, potentially more involvement would occur. There are numerous intertwined physical processes present in the estuary ecosystem, including river discharge, tidal forces, wind-induced stress and water density variations. This research utilizes an analytical model based on ensemble averaging and near-field approximation of the advective-diffusion equation for the case of continuous, steady, conservative solute transport in a stratified, river-dominated estuary. Such an approach significantly reduces the costs and time needed to obtain enough measured data required for common statistical analysis or the need for a more complex numerical model. The developed methodology is implemented into a simple software named CPoRT (Coastal Pollution Risk Tool) within a recently conducted research project funded by European Social Fund.
1. Introduction and Problem Formulation
Estuaries and coastal waters present complex ecosystems characterized by the interdependence of hydrodynamic and ecological processes [1,2]. They are among the most productive environments on Earth and are considered to be coastal marine areas [3], since they have predominately marine features. The excessive nutrient loading generated by rivers collecting the products of agriculture, industry and population in the upstream area [4], often causes water quality deterioration. A water body that is exposed to nutrient loading is susceptible to the process of eutrophication which causes undesirable changes in ecosystem structure and function [5]. Hence, the nutrient concentration statistics are crucial data when analyzing and making decisions for a coastal water body near an estuary. European directives use limit concentrations as indicators of the health of a water body [6,7]. Management of coastal systems is an ongoing competition of the overlapping economic interests for the same resources, which makes decision making a significant challenge. Among numerous integrated coastal zone management focus areas (e.g., transportation, leisure, aquaculture), decision makers and stakeholders are under pressure to address and solve the water quality problems at different levels starting from local estuaries to larger areas of the coastal zone [8]. However, as these problems are inherently intertwined and require a holistic approach for finding a solution, the common practice is to engage consultants and engineers to suggest potential solutions. Such practice generates several alternative approaches which are then presented to decision and policy makers who are not necessarily experts in the area, which can possibly lead to the lack of solution ownership. However, following some of the latest advancements toward public inclusion in the area of IWRM (Integrated Water Resources Management) as described by [9,10,11], or specifically for community-based ecosystem management [12], some ideas of participatory modeling and solution co-design have been attempted. The aim of this manuscript is to describe an existing tool and showcase how stakeholders of interest informed its further development. The presented tool is based on the analytical model developed in [13] and it was tested by a group of students and a group of local coastal management stakeholders. The former occurred within the project Risk Assessment of the pollution caused by rivers and discharges in the coastal area, or the Coastal Pollution Risk Tool (CPoRT), based in Split, Croatia. An illustrative example is given for a local estuary to show the potential use for the developed application. Finally, we discuss the response of a tested group of stakeholders who were given the CPoRT to check its applicability, usefulness, and more requirements to be met in the future development.
2. Three-Step Strategy
The implementation of Water Framework Directive [6] guidelines establishes the Drivers-Pressures-Status-Impacts-Responses (DPSIR) approach [14] as common practice when addressing the issues of an estuarine complex system. A detailed holistic approach demands a vast amount of measurements and monitoring systems along with complex numerical modelling to predict scenarios and assess the potential solutions. We propose the methodology which would enable key stakeholders to get not detailed, but quick screening insight into pressure-status-impact relations in an estuary. The model predicts the concentration statistics for conservative pollutant entering via a river by using few input data.
2.1. Theoretical Background
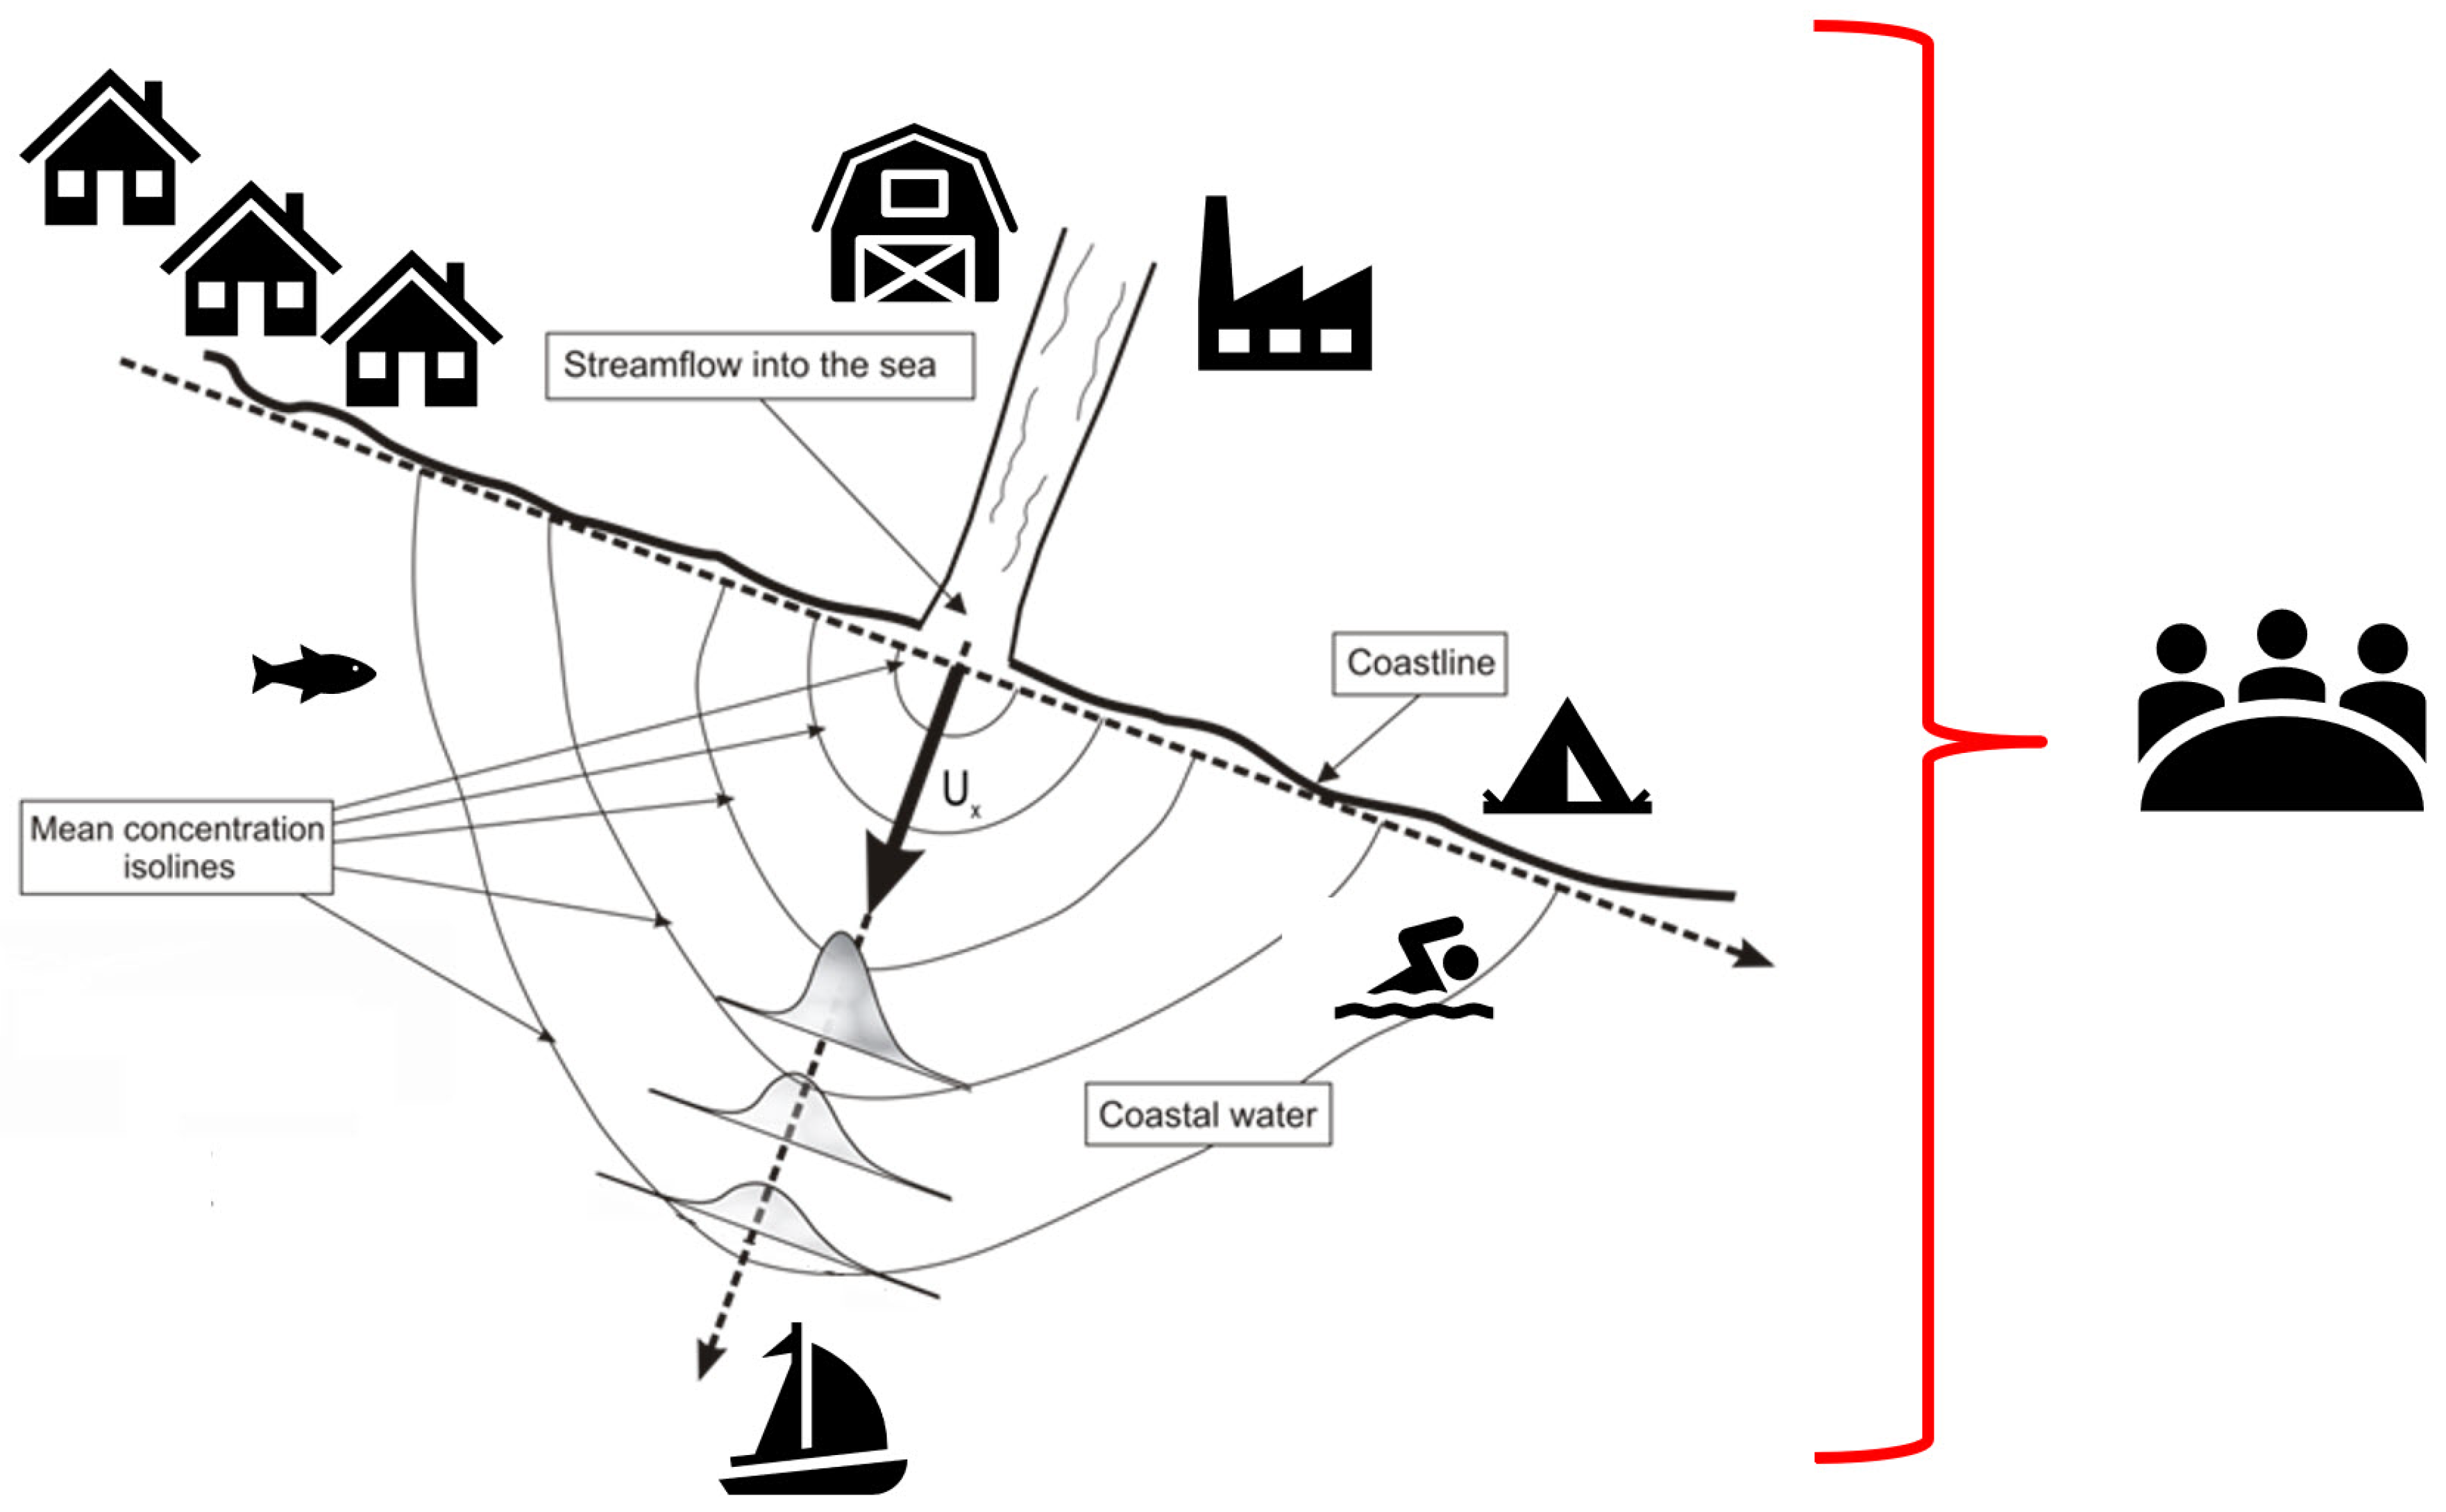
The analytical setup for the calculation and prediction of concentration statistics in environmental flow was already introduced by several authors in different media [15,16,17]. The similar methodology is used by [13], but implemented in surface water systems, more precisely in an estuary as presented in Figure 1. In this manuscript, the problem is emphasized within the broader framework by taking into account all the potential stakeholders and decision makers (Figure 1).
We consider the problem of mixing in the near field zone of an estuary where steady and continuous river plume is entering coastal sea. For a conservative pollutant concentration, the fundamental advection diffusion equation is given:
where is the scalar concentration in units of mass per unit volume, is the flow velocity located by vector at time t and is the coefficient of molecular diffusion. Furthermore, Equation (1) is transformed into:
where is the absolute concentration moment of order.
Absolute concentration moments are generally defined by , where is the pollutant concentration point probability density function (PDF), and PDF can be obtained by moment inversion [18]. In other words, if we are to solve Equation (2) for different orders and obtain an arbitrary number of concentration moments, we can reconstruct the PDF at the chosen point of certain pollution plume. This approach for obtaining concentration moments was previously implemented in contaminant cloud problems in the atmosphere [16] and in the groundwater medium [17,19]. However, it can also be applied to estimate concentration statistics in steady flows, such as those produced by contaminant jets, wakes, and plumes. The application in steady flows was demonstrated in the atmosphere [20,21] and in the groundwater environment [22]. Following that analogy, the focus of this work is on the 2D near field area of an estuary with the steady river plume and conservative pollutant discharging into the sea. For a continuous steady source in a steady flow, the turbulent flux of the flow is approximated by the advective term , where is the source concentration [16] and is the mean concentration. This approximation is obtained when the coefficient of molecular diffusion in Equation (2) is set to zero, and it may be applied in the near field zone. Furthermore, the governing equation for concentration standard moments of order becomes:
where , , and is a background threshold concentration such that for and for . The parameter defines the micro-scale at which the concentration gradient, , occurs. The mean velocity field of the plume is considered to be steady and defined by , where is the cross-sectionally averaged velocity at the river mouth and m−1 is an attenuation coefficient representing all existing mechanisms that, when combined, concur to progressively reduce U in the x direction, including bathymetry, tides, wind, sea currents, and salinity stratification. The proposed exponential form of mean velocity attenuation as a function of the x resulted from measured velocities, and it was also tested and compared to the hydrodynamic model MOHID [23], as well as to the existing theoretical model for jet flow [24] in [13]. It was shown to be a suitable assumption since it delivered a solution similar to MOHID results and measurements while obtaining a simple expression to be easily used within the recursive equation for standard concentration moments. When such a non-uniform mean velocity field is introduced in Equation (3), the general recursive solution of concentration moments is obtained:
As a part of the methodology development (in [13]), the presented solution was numerically verified for the first two concentration moments which are used in this manuscript, and furthermore tested against field measurements and the results from MOHID model simulations [25]. The conducted field works included several campaigns of velocity and salinity measurements where velocity was obtained in the surface layer with the hydrometric wing (SEBA-Mini Current Meter M1 with start velocity of 0.025 m/s). The salinity, measured by the SBE37-MicroCAT probe, was at first used to define the vertical profile (salt wedge) at several points, and later mostly in the surface layer to be used as a concentration proxy.
The obtained concentration moments evaluation enabled the retrieval of the PDF at an arbitrary point. In this work, a simple moment matching method is applied to obtain the PDF. Following the previous research [26,27,28] for other environmental flows, a Beta distribution is used, and both PDF and CDF were calculated. Finally, the application of the presented statistical tools is the probability of exceeding, , for an arbitrary concentration, , as defined:
delivers important information for the evaluation of the state of a water body. Depending on a chosen point, a user of the CPoRT application (Section 2.2) may gain insight into how long or far away from the source it takes to achieve acceptable levels of pollutant concentration (see Figure 5).
2.2. The Model—CPoRT
Within the project, Risk assessment of the pollution caused by rivers and discharges in coastal areas, the methodology described in the previous chapter was further tested and implemented in a simple tool—the CPoRT. The CPoRT application (Figure 2) aims to raise awareness of the importance of preserving water resources with a thematic emphasis on coastal waters that are burdened by pollution from rivers.
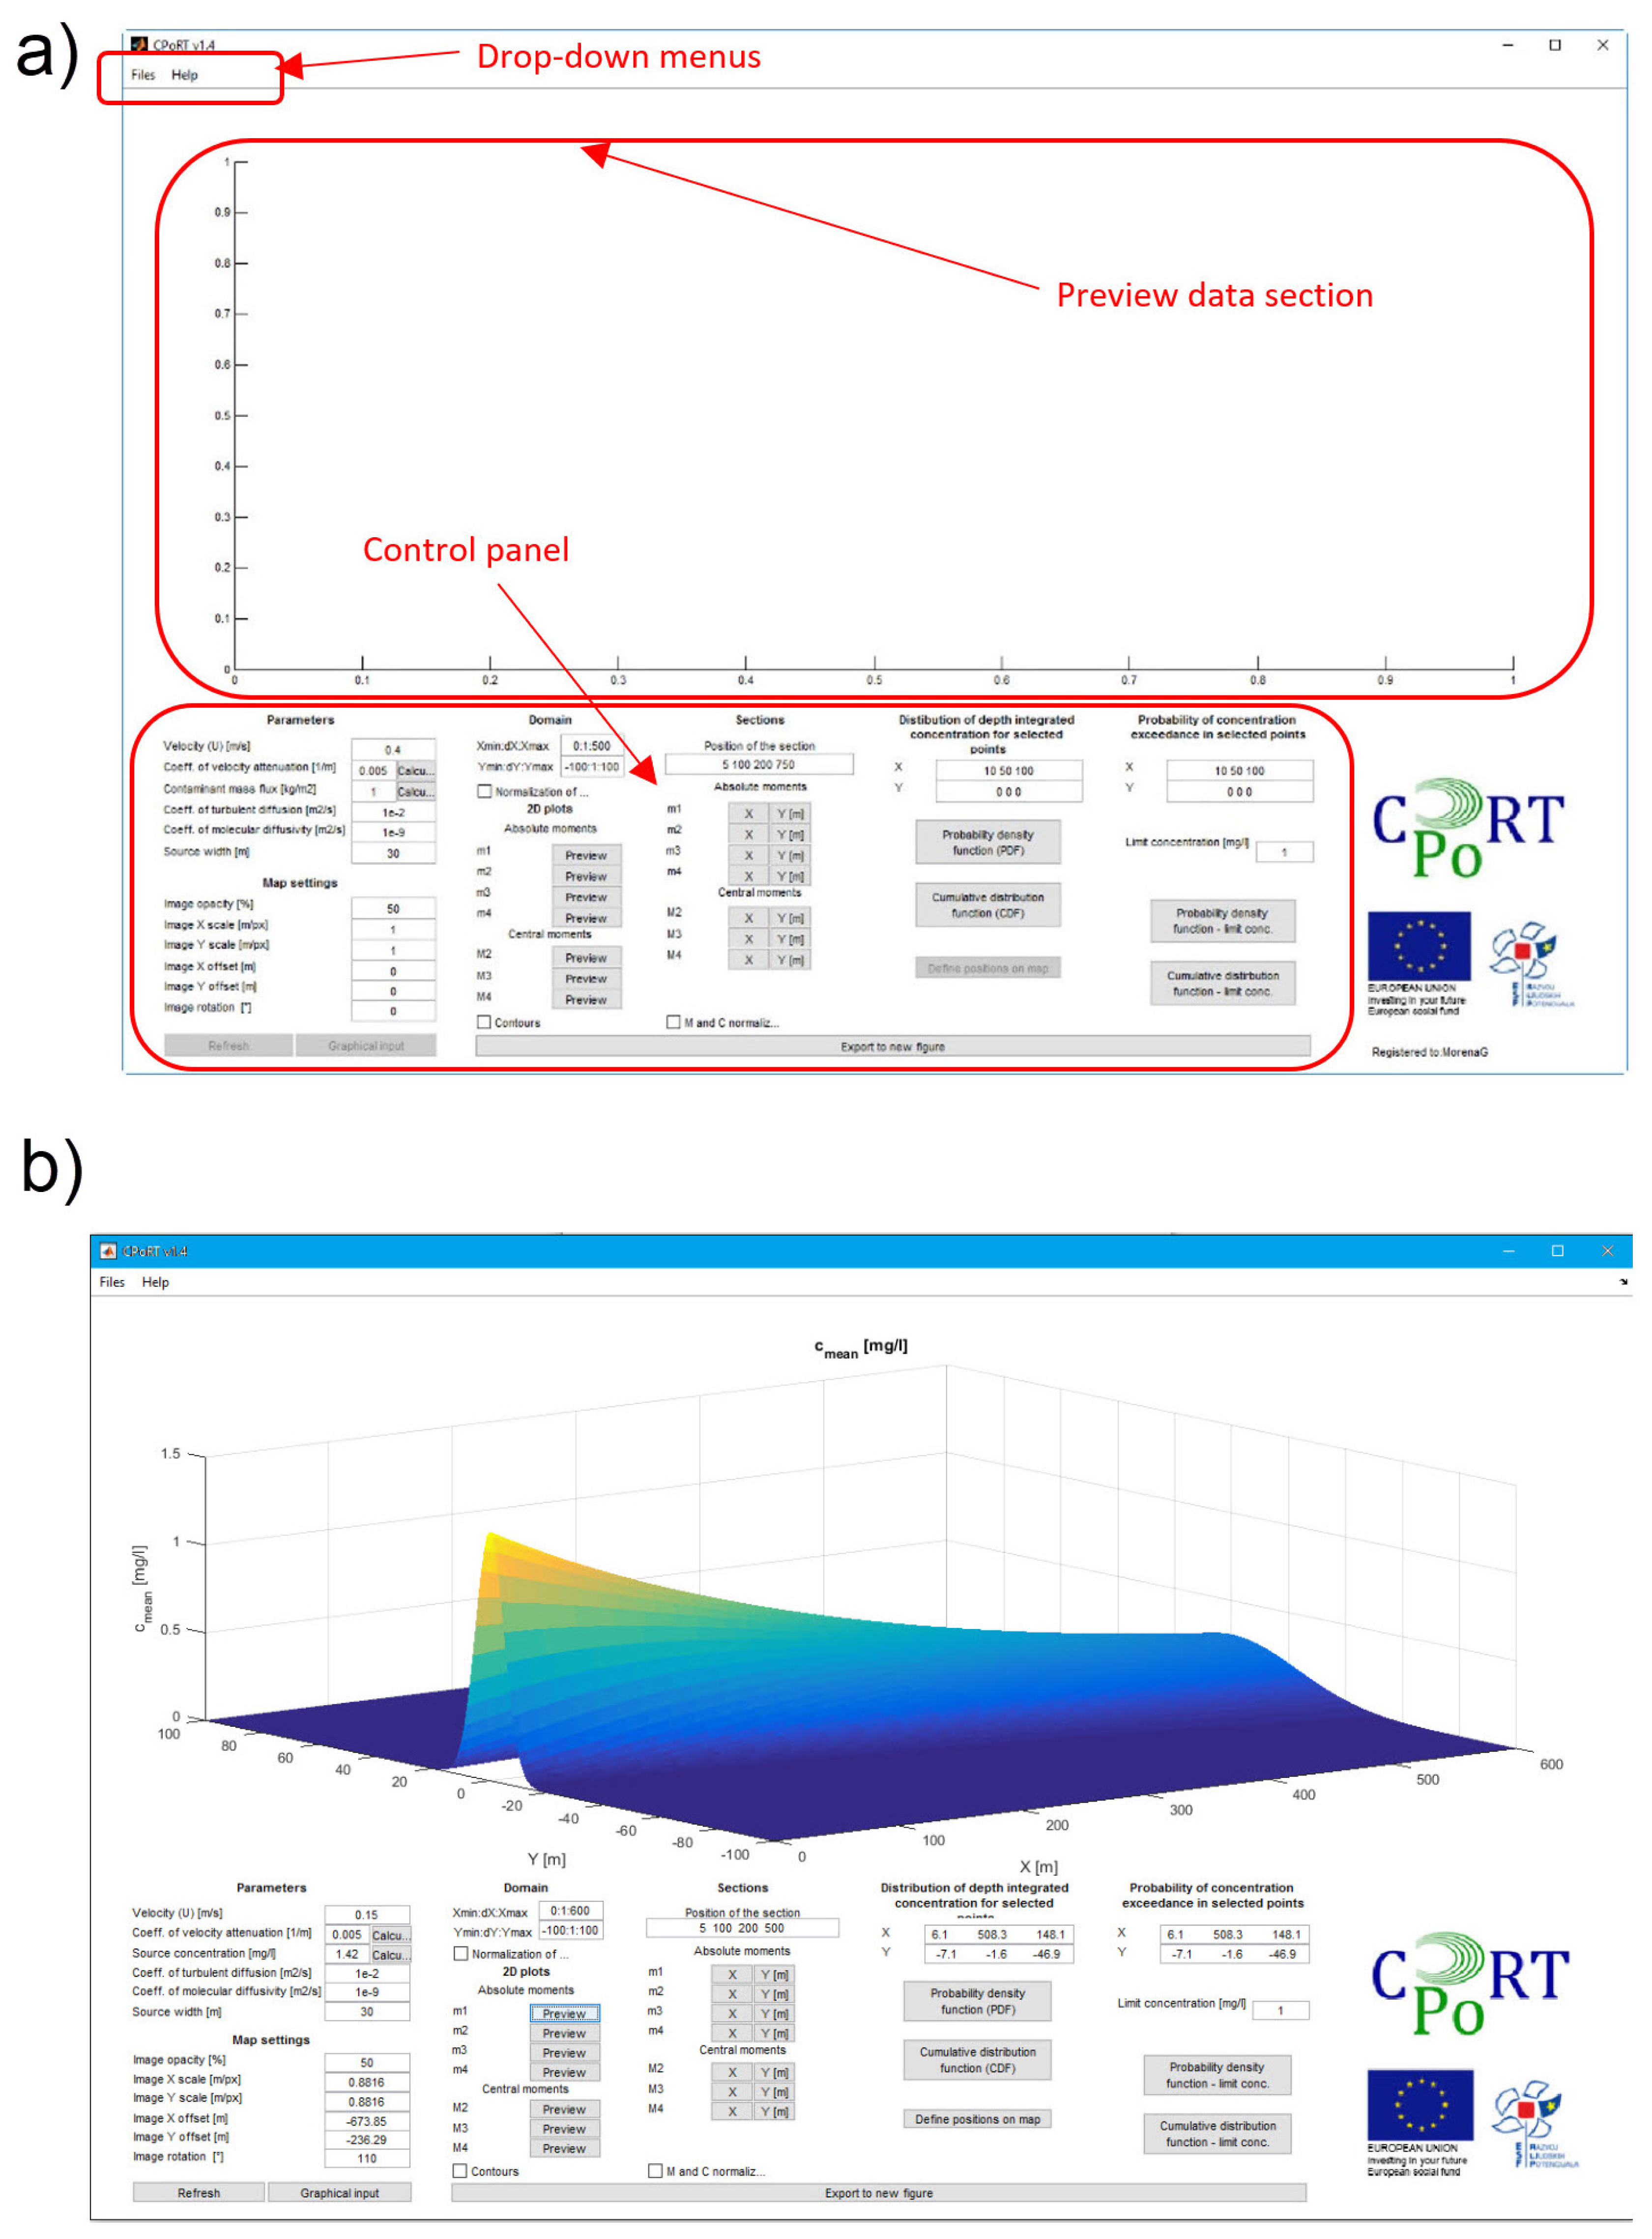
One of the main outcomes of the projects was the development of a tool for the quick assessment of the probability of exceeding the limit concentration. Due to its simplicity, it is supposed to be user-friendly and available to different stakeholders. The coding and the application were developed in the Matlab-integrated development environment [29]. In Figure 2, we present the main working interface, along with an example of mean concentration visualization (surface plot). The application has a fully graphical interface, implemented as a single main tab and series of secondary tabs for the calculation and visualization of data. To get better spatial reference, there is an option to upload the map which may, in fact, be a screenshot of Google Earth or from any other freely available open spatial data service. However, the scaling and rotation factors within the working interface need to be adjusted in order to ensure a good spatial fit. In general, a very limited amount of input data is required, which makes the CPoRT quick and practical. Those data are organized into two blocks: parameters and domain. An arbitrary rectangular domain may be set in accordance with the user’s interest when analyzing an area, and it is defined by the initial and final value of X or Y, and an increment. The parameters block requires more data, some of which are measured data, but when testing different scenarios, a user may obtain outcomes for different values. However, it is necessary to have the initial riverine velocity (m/s) at the source, contaminant source concentration g/m3, and the source width (m). The source concentration may be calculated in an additional dialog box if the contaminant mass flux is known ( kg/day).
The molecular diffusion coefficient is set to 10−9 m/s by default, which is a regular value for surface waters [30], but it is user-editable. As previously discussed, molecular diffusion does not have a significant impact in the near field zone, and therefore it may be conservatively kept at a default value unless the user has performed some additional measurements to change it accordingly. The turbulent diffusion coefficient (m/s) should be measured and assessed for the estuarine system in question. However, if no data is available, different values can be tested to assess its potential effect on the pollution plume spreading, especially for the worst-case scenario. Depending on the case scenario, lower values of (e.g., less than 10−4 m/s) may indicate the longer distance from the river mouth where an acceptable level of concentration may be expected since the plume is narrower as opposed to higher values (e.g., more than 10−2 m/s). A higher turbulent diffusion coefficient implies greater lateral spreading of the plume which may indicate unwanted concentration at bay sides, but shorter downstream impact. Velocity attenuation may be set to a measured value or calculated within a dialog box if downstream centerline velocity data is known.
2.3. Stakeholders’ Involvement
Two workshops were arranged during different phases of the tool development process to inform further development of the CPoRT screening tool and incorporate end-user perspectives. In the early development stage (late spring of 2016), a group of 30 graduate civil engineering students at University of Split tested the application. The initial assumption was that the participants had no significant knowledge of river-generated pollution in coastal seas. Nevertheless, the workshop was organized with the aim of gathering initial feedback, which would then be implemented in subsequent application development.
The second and more important test was the workshop (September 2016) which was part of project dissemination to which relevant stakeholders (i.e., end users of the screening tool) were invited. The group consisted of 44 participants from NGOs, universities (departments of science and technology, naval technology, institute for oceanography), SMEs, local water and sewerage companies, the banking sector, local government, and consulting agencies. The feedback from participants was received through both a written survey and spontaneous discussion during the workshop. The survey questions covered the topics of the participants’ background knowledge, their effective daily usage of computers, the functionality and the design of the CPoRT application, and finally the impact of the CPoRT on their understanding and potential decision-making in estuaries and coastal waters.
3. Results
In this section, particular results were given following the steps of the aforementioned methodology. A theoretical illustrative case and its solution by the developed application are presented, along with the stakeholders’ feedback.
3.1. Illustrative Example
As an illustrative example, we used the setup of the local Žrnovnica River (Figure 3), for which we obtained the required parameters from a previous analysis [13]. The Žrnovnica River is a relatively small river which flows into Stobreč Bay, near the city of Split, the second largest city in Croatia. The geological background of this area is mostly karstic, occasionally with flysch layers. A large uncontrolled landfill is located less than 2 km away from the Žrnovnica River. The local municipality has implemented a wastewater power plant which only works on primary treatment. Possible contaminant influx from different sources and riverine pollutants represent a severe hazard for the Žrnovnica estuary, especially given a rather small river outflow (annual average 2 m/s) and a limited depth of the bay. This area already has records of pollution [31] as a result of anthropogenic activity creating a vulnerable ecosystem. Nevertheless, the nearby communities of Stobreč, Žrnovnica, and Podstrana have a highly-developed tourist industry, which ensures that even more pressure will be put on the estuary and the bay. Even the initial water quality at the Žrnovnica spring is compromised by inadequate sewage systems in the region [32].
By analyzing the current anthropogenic activity, we estimated the mass flux of total nitrogen delivered by Žrnovnica River to be around 20 grams per second (g/s) which causes the source concentration of 1.42 mg/L (using the guidelines from [33]). The observed initial velocity for summer is 0.15 m/s with an attenuation coefficient () of 0.002 m, and the effective river mouth width is 14 m. The limit value of total nitrogen for the best water quality in Croatian regulation based on WFD is 1.0 mg/L; this is used in the further calculation. Nevertheless, one may set the arbitrary value of limit concentration in the CPoRT workspace.
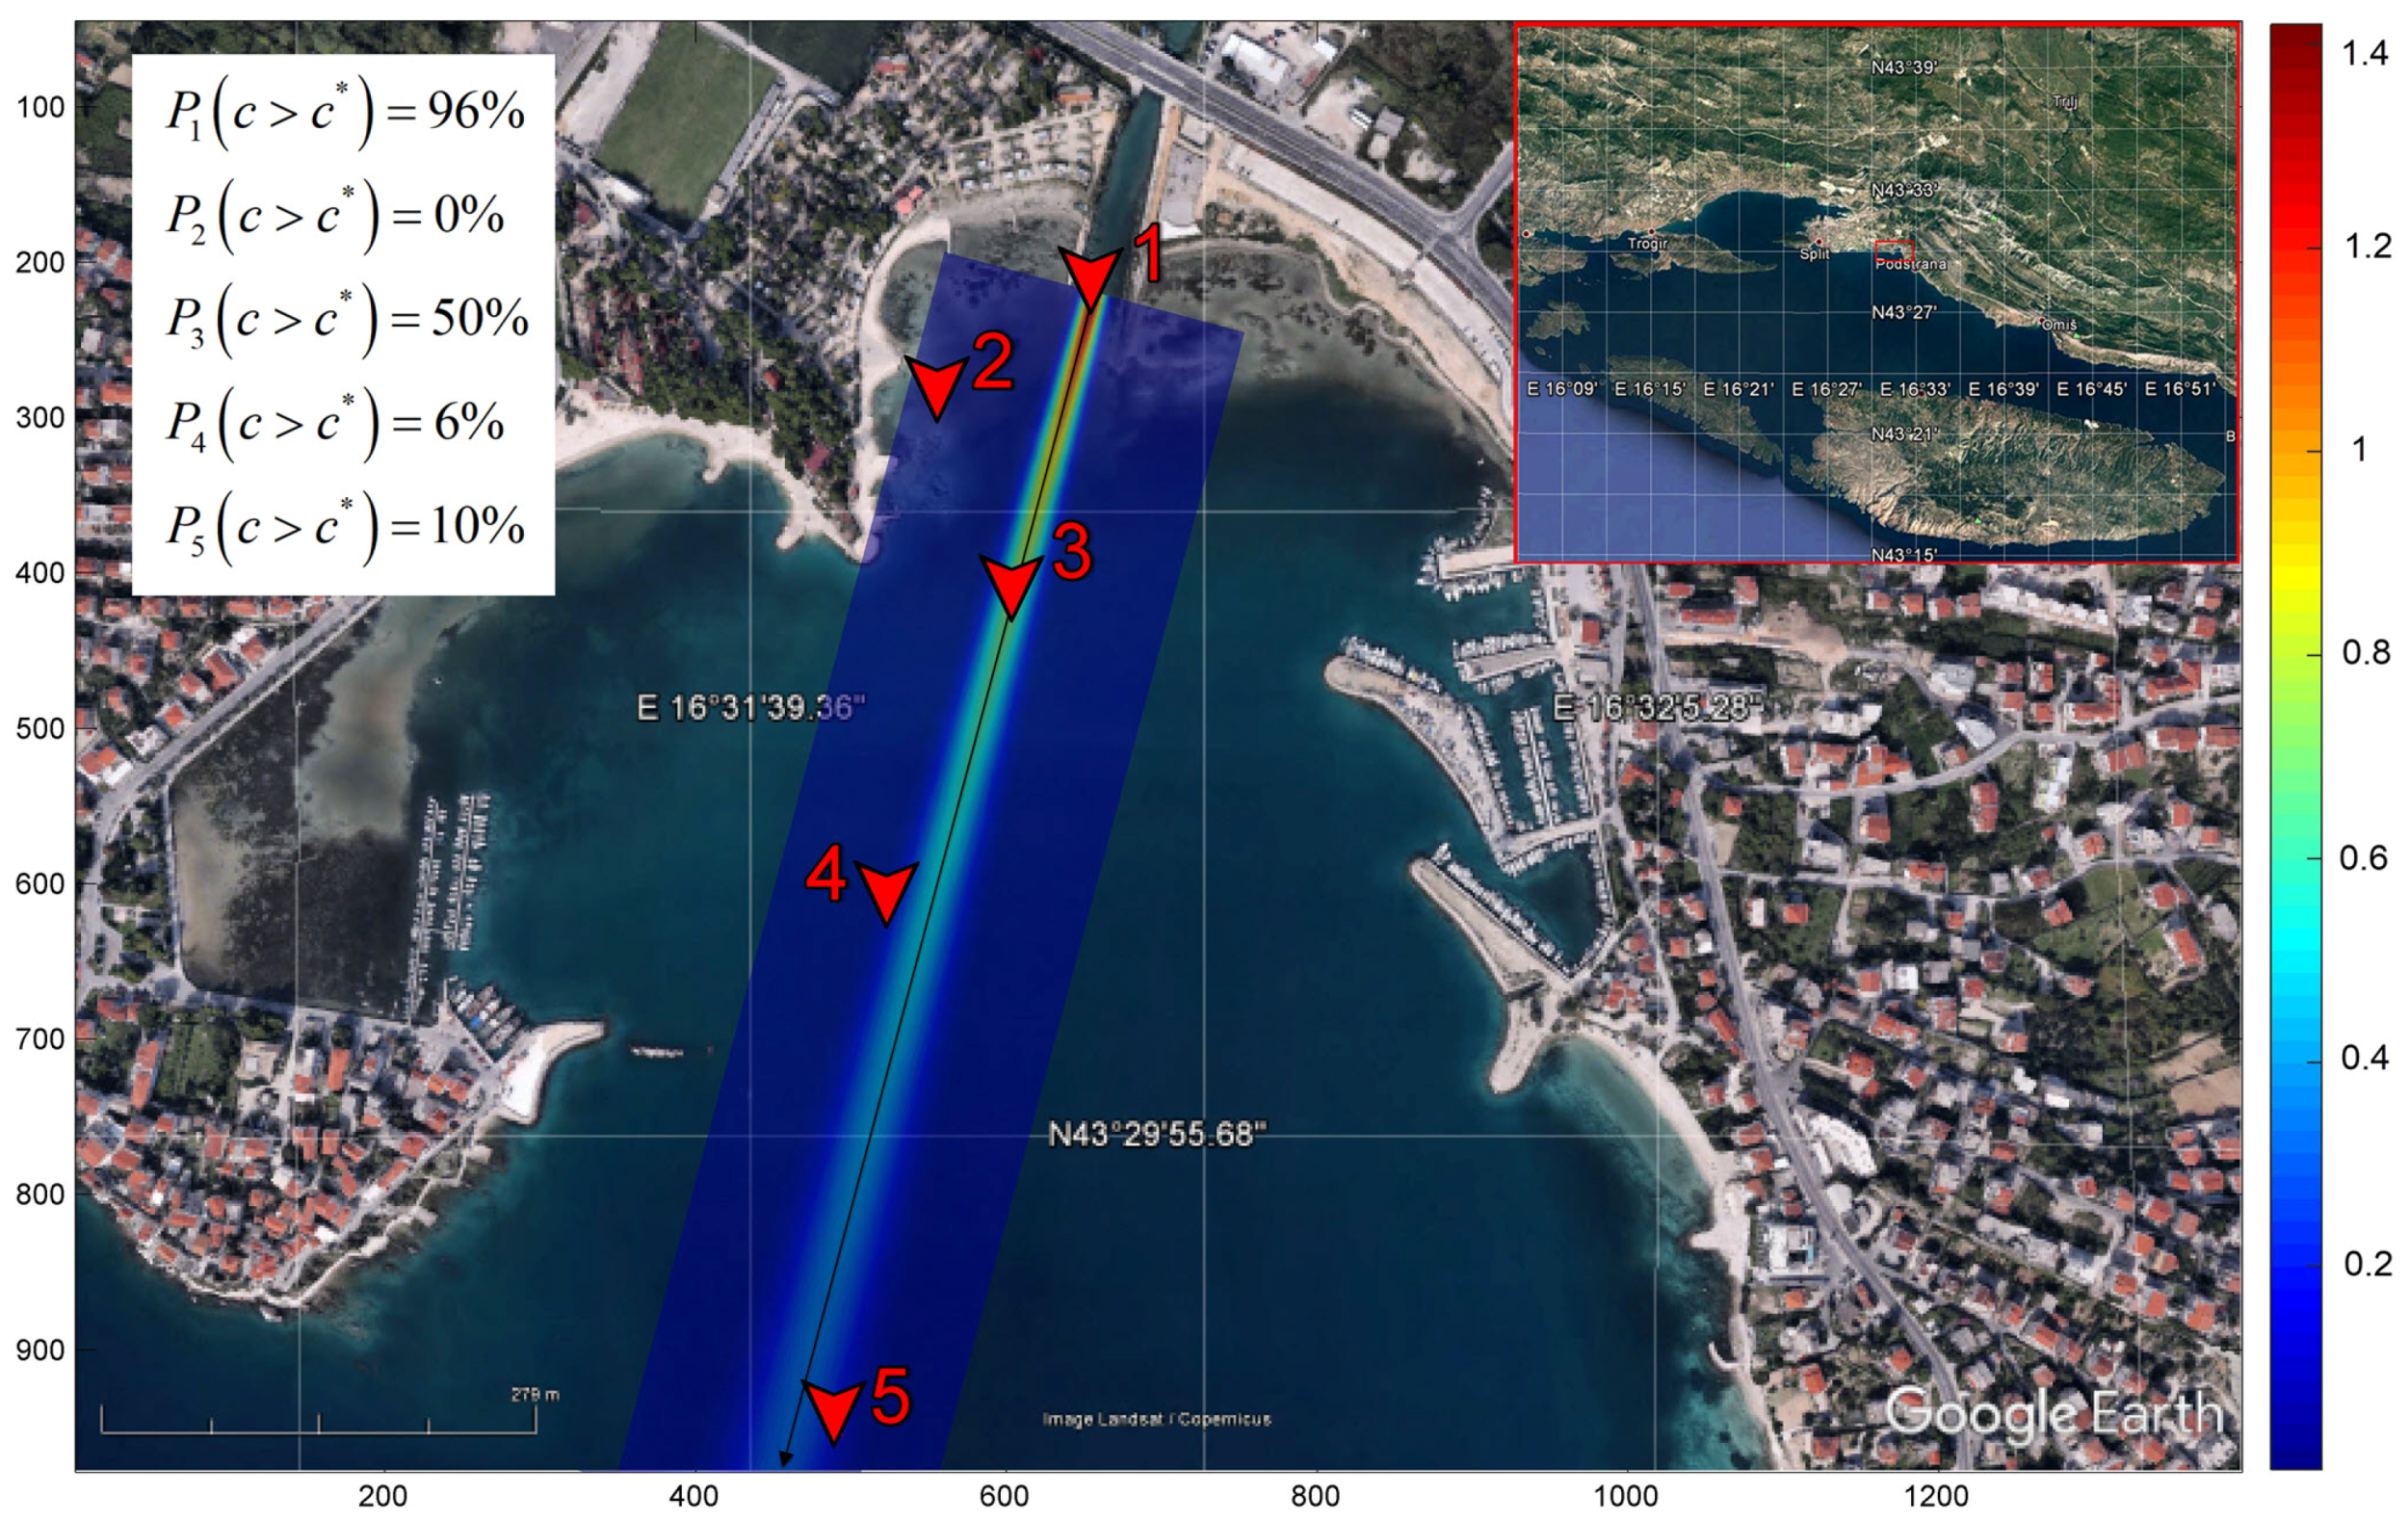
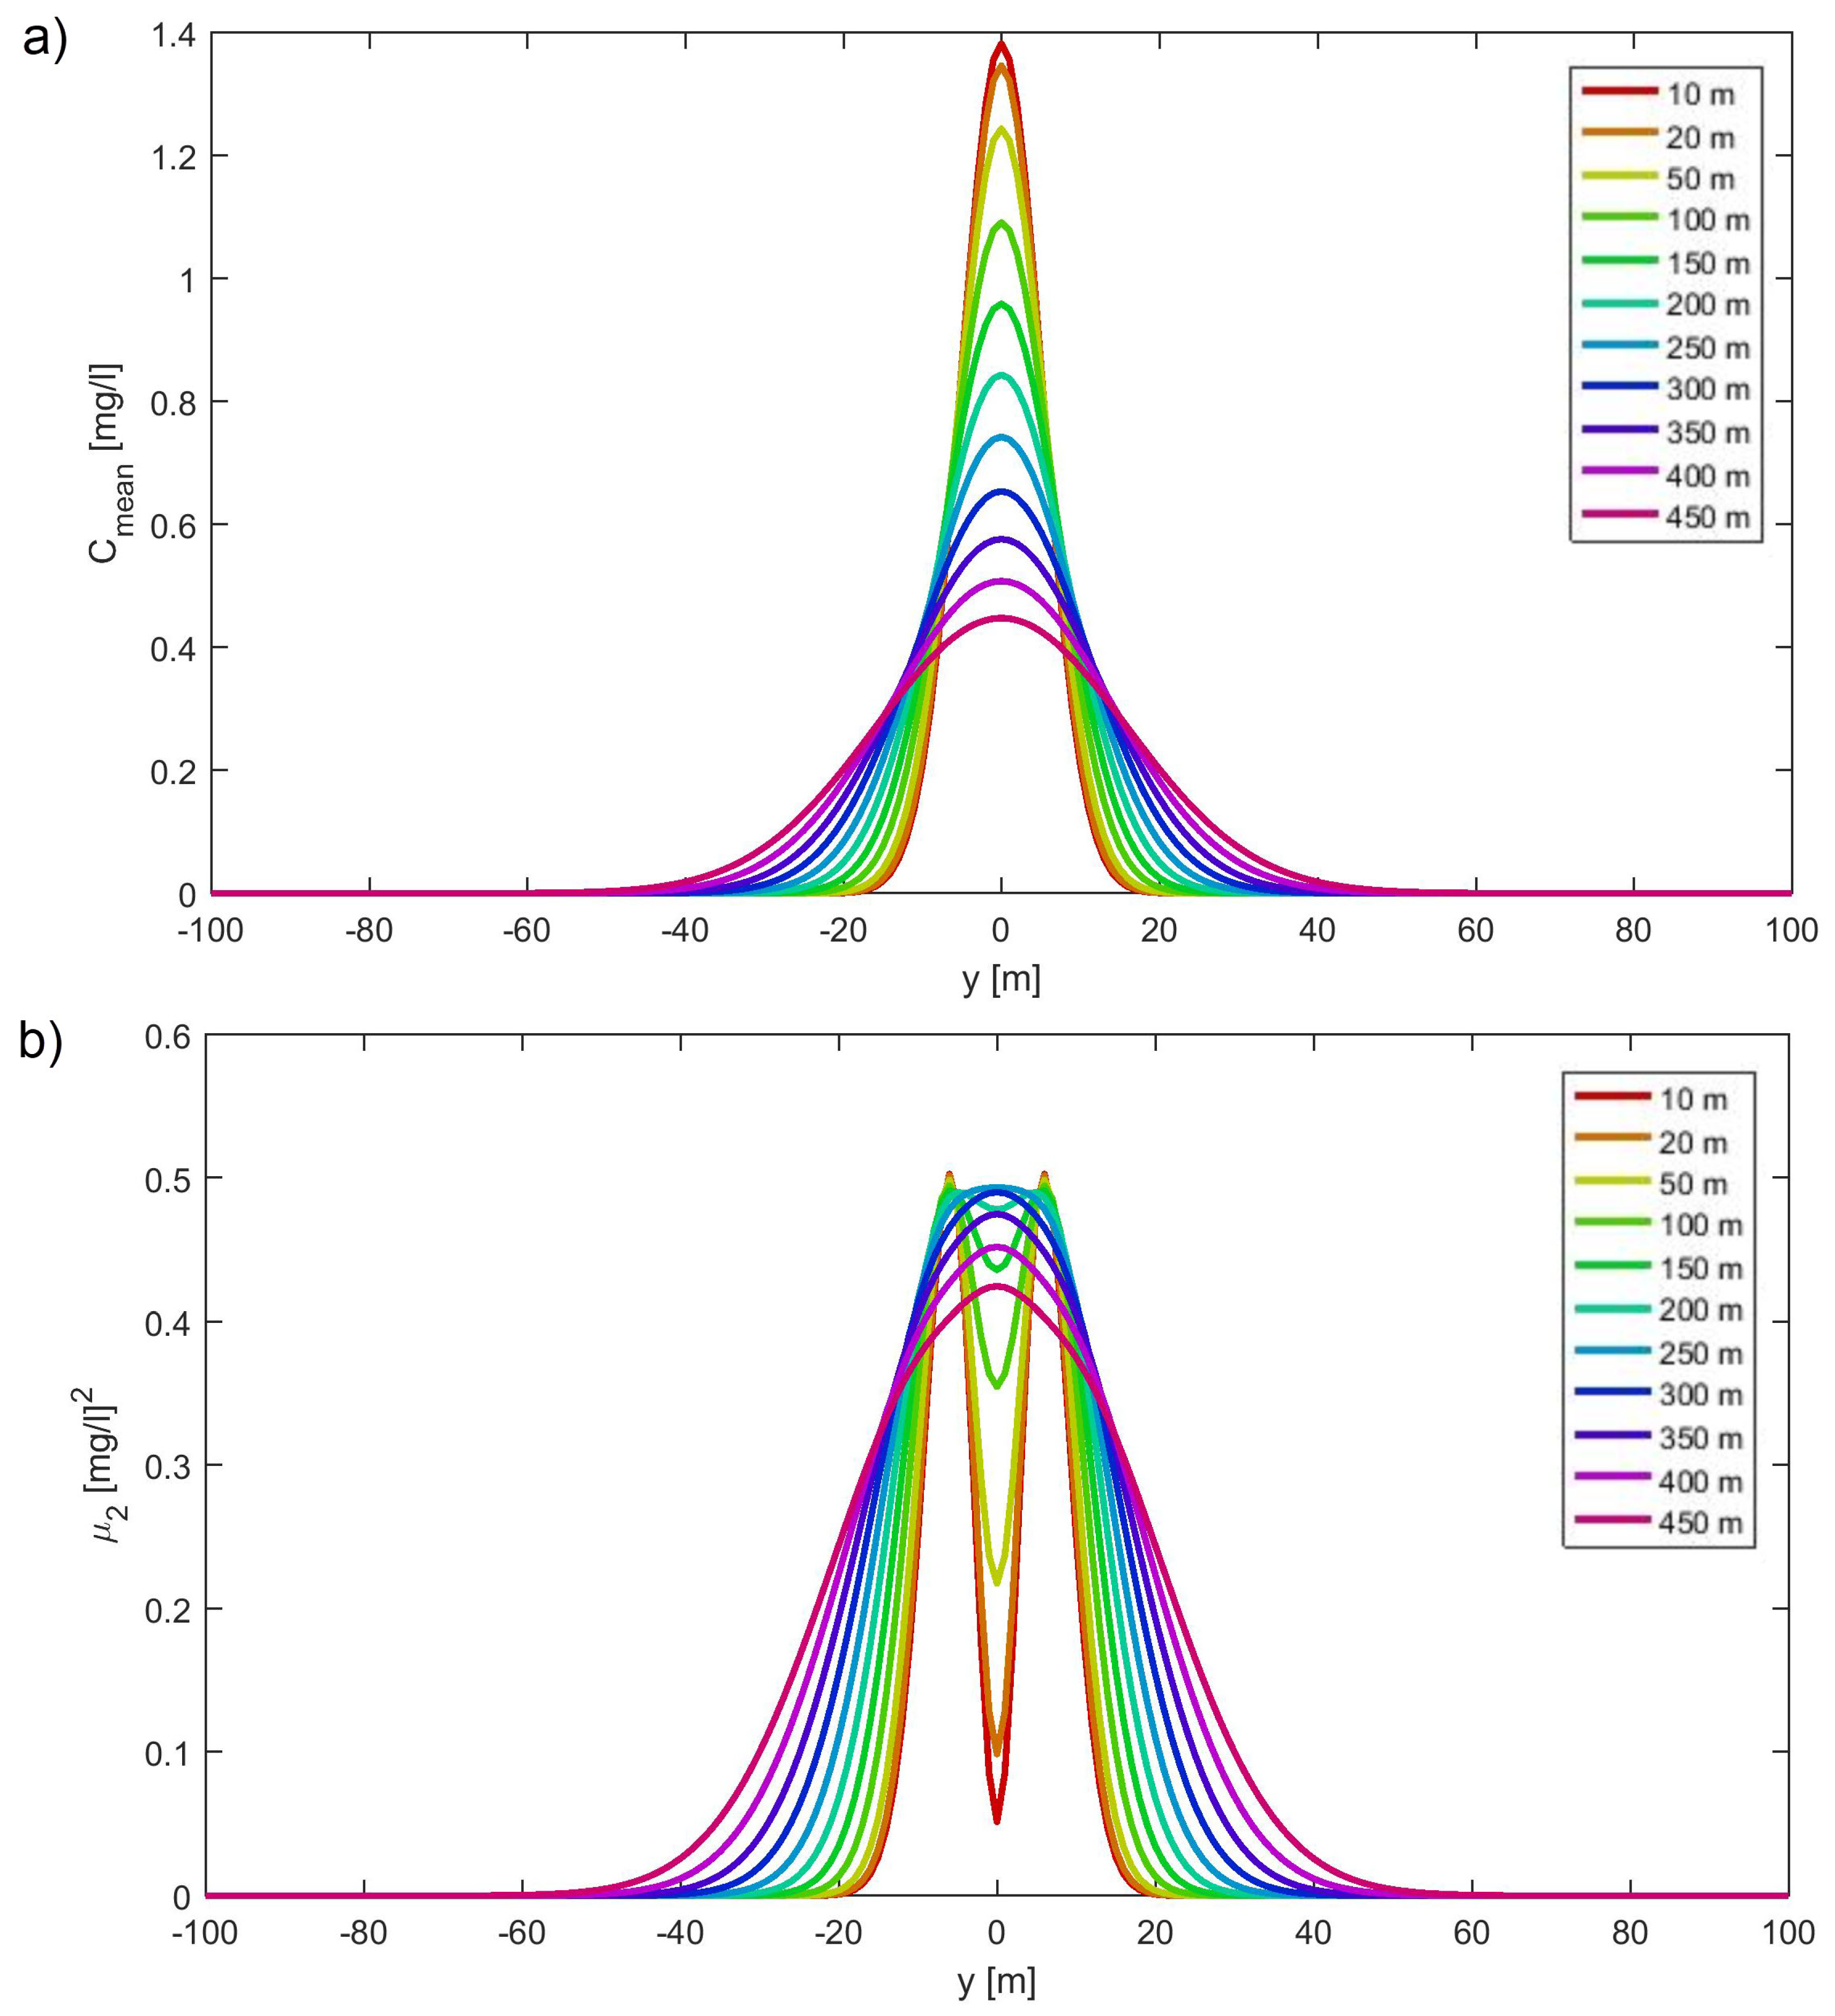
In Figure 3, we present the map (courtesy of Google Earth) of Žrnovnica estuary which was imported into the CPoRT application. The plot is modified to emphasize the location of the case study and the positions of three arbitrary chosen points where the probabilities of exceeding the limit concentration were calculated. The developed methodology is based on the calculation of the conservative pollution concentration moments, hence we present the evolution of the mean value and variance along the downstream sections in Figure 4a,b.
Finally, the CPoRT uses Equation (5) to evaluate the probabilities of exceeding the limit concentration (1 mg/L), , at the chosen points from corresponding PDF. Five points are selected at substantially different locations to see the extents of the solution (see Figure 3).
The first and third points represent the longitudinal evolution of expected concentration. The value of the probability at the location of the second point is significant when considering the water quality at the beach of the local auto camp. Since the probability at the beach location is near zero, the area may be regarded as not in threat of water quality reduction. Such a result is the consequence of the river plume domination in the near field area where the beach is located, and the lateral spreading of the plume is not so intense. The fourth and fifth points are chosen at further distances and shifted from the centerline, thus exhibiting lower concentrations, as expected.
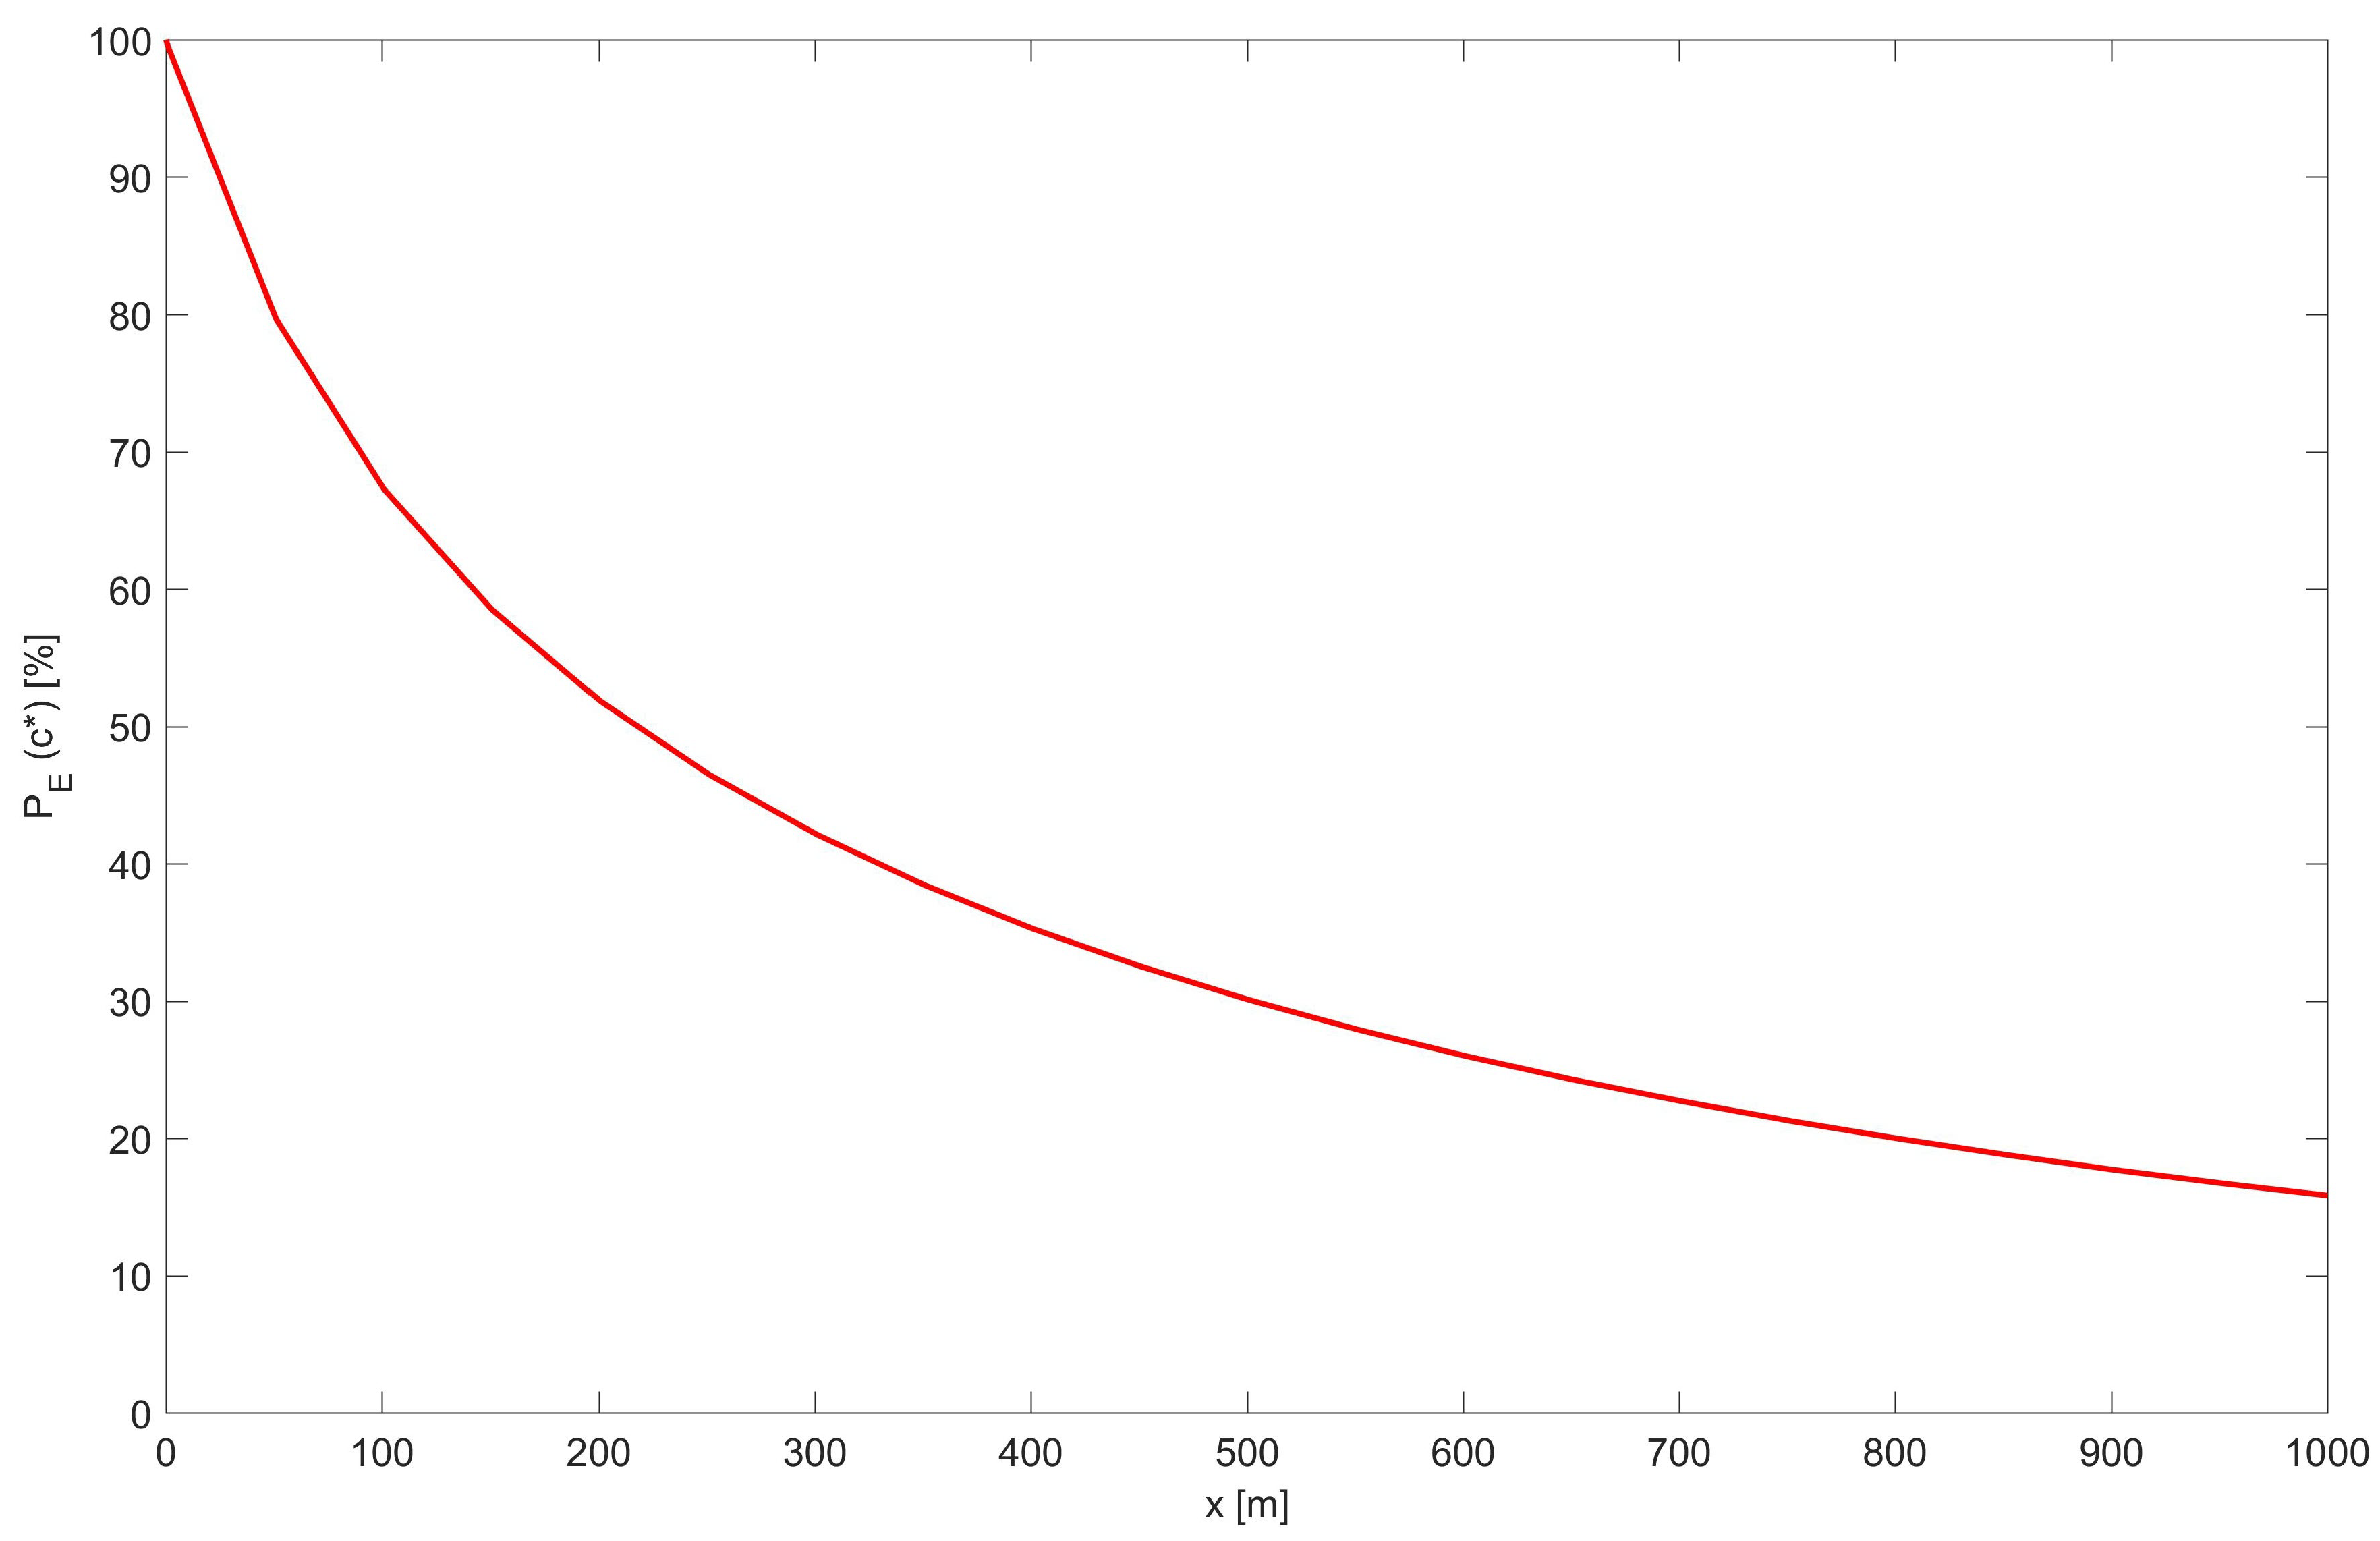
One may be interested in the evolution of the probabilities along the centerline of the plume (black arrow in Figure 3); therefore, the behavior of is given in Figure 5.
The crucial application of the CPoRT is presented by Figure 5, since the behavior of along the centerline may indicate the level of dilution of pollutant concentration in the downstream area. It delivers an estimate of the distance where an acceptable probability of exceeding the limit concentration is achieved.
3.2. User’s Feedback
Both of the organized workshops delivered invaluable feedback regarding application functionality and its potential usefulness. For students, this was their first interaction with the issue of pollution in coastal zones.
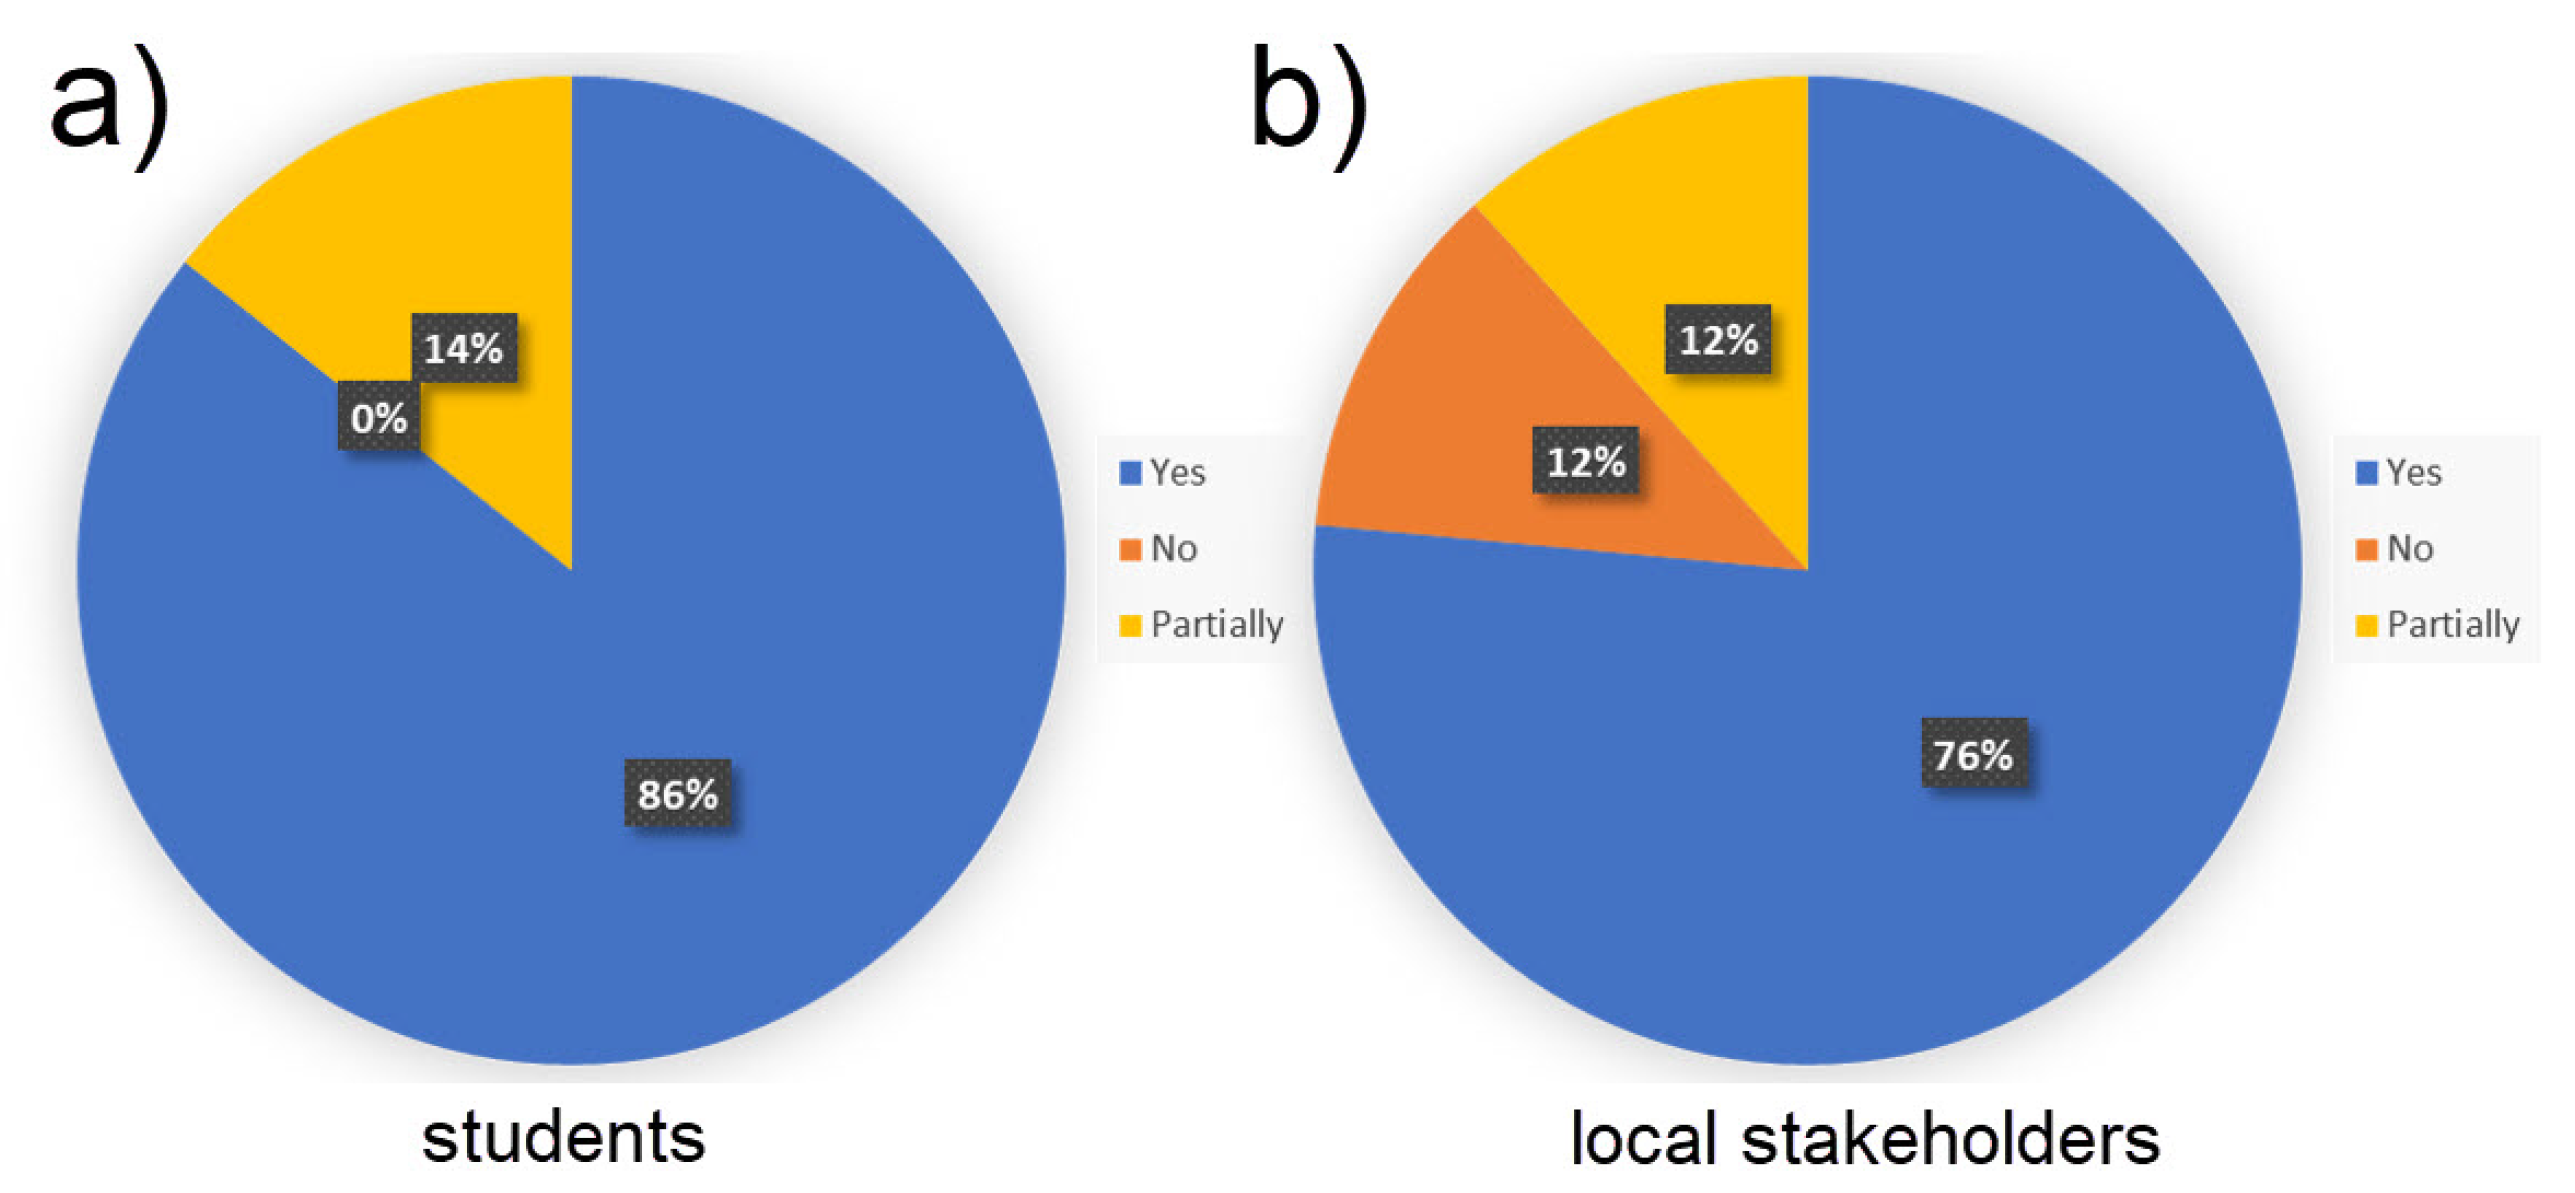
However, the survey results indicate that they grasped the basic principles of the physical processes happening at the river–coastal sea interface in less than two hours. The students provided feedback regarding the functionality of application by detecting bugs and requesting a better explanation of the input parameters. In the stakeholders’ workshop, most of the participants (30 out of 44) reported having achieved a better understanding of the issue. More than 50% (25 out of 44) said that the application would be more user-friendly if it were web-based and GIS-integrated. Furthermore, most of them agreed that the CPoRT may be fully or partially helpful at decision making as a quick screening tool (Figure 6). The key difference from these two groups is the level of the experience in the practice which is presented by negative answers in the group of local stakeholders. They are obviously more acquainted with the problems of decision making in coastal management, thus are more aware of the potential limitations of the CPoRT application.
4. Conclusions and Future Work
The CPoRT implements a previously developed methodology to evaluate concentration statistics for conservative pollutant transported by the river into an estuary. Due to its low requirements of input data and background knowledge, it represents a simplified screening tool which can serve as a platform for raising awareness and better decision making through grasping the idea of an estuarine ecosystem’s resilience. Furthermore, it may be used to obtain better inferences for relevant water resources management and more specific analysis at certain locations (e.g., indicating potential “hot spots” for additional monitoring activities or more complex numerical modelling). The 2D solution is based on a few approximations: near field zone, steady and continuous river plume and conservative pollutant, and it lacks the details and calculation possibilities of common hydrodynamic numerical models. However, due to its simplicity, it generates the results within seconds and the pre-processing can be done in a few minutes when possessing the few required data. This simplicity provides an advantage when compared to more complex models. The CPoRT has its place as the tool for educational purposes, raising awareness, and helping stakeholders and decision makers to grasp a more general overview, while detailed analyses and integrated complex scenarios are still to be done by more sophisticated numerical models and more extensive measurements. Since the CPoRT represents a simple tool for a decision support system, it may reveal additional application when interfaced with the marine spatial data infrastructure [34] in its future development. Once such a service is put into operation under European INSPIRE Directive [35], there is great potential for developing the databases of estuaries and their characteristics along the Adriatic coast. This approach would engage monitoring services and, when connected to the CPoRT application, it would provide screening tools for various estuaries and coastal areas. An interesting idea is built on the users’ feedback and input by opening the door to a collaborative model with stakeholders for future CPoRT versions. This approach [36] would facilitate a learning process through which stakeholders would inform the development and be part of the application co-production, continuously in an interdependent communication and collaboration, in a joint effort to develop sustainable estuarine and coastal management. Several minor points (e.g., the “look” of the graphical interface, the choice of colors, the parameter’s description) were easily applied after the workshops, while more extensive work regarding the implementation of web-based and GIS-integrated service will form part of ongoing and future work. Since continuous research is being conducted on the additional properties of concentration statistics in coastal areas, these outcomes are to become part of new upgraded versions of CPoRT application. Nevertheless, close cooperation with stakeholders, which was initiated during this project, is going to be the guiding tool in this development process.
Author Contributions
The paper was written by M.G. based on the results obtained from her PhD research which was done under the close supervision of R.A., who initiated the research subject. The presented results are part of the CPoRT project led by M.G. with an important role of V.D. who contributed directly to the development of the software. Specific collaboration with co-author R.Š.T. was engaged due to his expertise in the field of stakeholder’s management. Finally, all co-authors gave ideas for the specific parts of the manuscript and helped to review and improve the paper.
Funding
This research was partially funded by CPoRT project, Contract number HR.3.2.01-0262, co-funded by European Social Fund. Additional funding was partially provided by STIM - REI project, funded by the European Structural and Investment Funds 2014–2020, Contract Number: KK.01.1.1.01.0003.
Acknowledgments
We acknowledge the support of a student research grant co-funded by the European Social Fund for the Project HR.3.2.01-0262, Risk assessment of the pollution caused by rivers and discharges in coastal area (project CPoRT- Coastal Pollution Risk Tool). This research was partially supported by the STIM - REI project, funded by the European Structural and Investment Funds 2014–2020, Contract Number: KK.01.1.1.01.0003.
Conflicts of Interest
The authors declare no conflict of interest.
References
- Savenije, H.H. Salinity and Tides in Alluvial Estuaries; Elsevier: Amsterdam, The Netherlands, 2005; p. 194. [Google Scholar]
- Saraiva, S.; Pina, P.; Martins, F.; Santos, M.; Braunschweig, F.; Neves, R.J. Modelling the influence of nutrient loads on Portuguese estuaries. Hydrobiologia 2007, 587, 5–18. [Google Scholar] [CrossRef]
- Ascione Kenov, I.; Campuzano, F.; Franz, G.; Fernandes, R.; Viegas, C.; Sobrinho, J.; de Pablo, H.; Amaral, A.; Pinto, L.; Mateus, M.; et al. Advances in Modeling of Water Quality in Estuaries. In Remote Sensing and Modeling: Advances in Coastal and Marine Resources; Finkl, C.W., Makowski, C., Eds.; Springer: Basel, Switzerland, 2014; pp. 237–276. [Google Scholar]
- Rabalais, N.N.; Turner, R.E.; Díaz, R.J.; Justić, D. Global change and eutrophication of coastal waters. ICES J. Mar. Sci. 2009, 66, 1528–1537. [Google Scholar] [CrossRef]
- Smith, V.; Tilman, G.; Nekola, J. Eutrophication: impacts of excess nutrient inputs on freshwater, marine, and terrestrial ecosystems. Environ. Poll. 1999, 100, 179–196. [Google Scholar] [CrossRef]
- European, C. Water Framework Directive 2000/60/EC. Off. J. Eur. Commun. 2000, 1, 1–33. [Google Scholar]
- Piroddi, C.; Teixeira, H.; Lynam, C.P.; Smith, C.; Alvarez, M.C.; Mazik, K.; Andonegi, E.; Churilova, T.; Tedesco, L.; Chifflet, M.; et al. Using ecological models to assess ecosystem status in support of the European Marine Strategy Framework Directive. Ecol. Ind. 2015, 58, 175–191. [Google Scholar] [CrossRef] [Green Version]
- Pinto, R.; de Jonge, V.N.; Neto, J.M.; Domingos, T.; Marques, J.C.; Patrício, J. Towards a DPSIR driven integration of ecological value, water uses and ecosystem services for estuarine systems. Ocean Coast. Manag. 2013, 72, 64–79. [Google Scholar] [CrossRef]
- Borowski, I.; Hare, M. Exploring the Gap Between Water Managers and Researchers: Difficulties of Model-Based Tools to Support Practical Water Management. Water Resour. Manag. 2007, 21, 1049–1074. [Google Scholar] [CrossRef]
- Smajgl, A.; Ward, J. Evaluating participatory research: Framework, methods and implementation results. J. Environ. Manag. 2015, 157, 311–319. [Google Scholar] [CrossRef] [PubMed]
- Hassenforder, E.; Smajgl, A.; Ward, J. Towards understanding participatory processes: Framework, application and results. J. Environ. Manag. 2015, 157, 84–95. [Google Scholar] [CrossRef] [PubMed]
- Feurt, C.B. Collaborative Learning Guide for Ecosystem Management; University of New England: Biddeford, ME, USA, 2008. [Google Scholar]
- Galesic, M.; Andricevic, R.; Gotovac, H.; Srzic, V. Concentration statistics of solute transport for the near field zone of an estuary. Adv. Water Resour. 2016, 94, 424–440. [Google Scholar] [CrossRef]
- OECD. Core Set of Indicators for Environmental Performance Reviews: A Synthesis Report by the Group on the State of the Enviroment; Organisation for Economic Co-Operation and Development: Paris, France, 1993; pp. 1–39. [Google Scholar]
- Sawford, B.; Sullivan, P. A simple representation of a developing contaminant concentration field. J. Fluid Mech. 1995, 289, 141–157. [Google Scholar] [CrossRef]
- Sullivan, P. The influence of molecular diffusion on the distributed moments of a scalar PDF. Environmetrics 2004, 15, 173–191. [Google Scholar] [CrossRef]
- Andricevic, R. Exposure concentration statistics in the subsurface transport. Adv. Water Resour. 2008, 31, 714–725. [Google Scholar] [CrossRef]
- Sullivan, P.; Ye, H. Moment inversion for contaminant concentration in turbulent flows. Can. Appl. Math. Q. 1996, 4, 301–310. [Google Scholar]
- Andricevic, R. Effects of local dispersion and sampling volume on the evolution of concentration fluctuations in aquifers. Water Resour. Res. 1998, 34, 1115–1129. [Google Scholar] [CrossRef]
- Sarathi, P.; Gurka, R.; Sullivan, P.; Kopp, G.A. Experimental Measurements of Expected Mass Fraction in a Contaminant Plume. Bound. Layer Meteorol. 2010, 137, 167–185. [Google Scholar] [CrossRef]
- Sarathi, P.; Gurka, R.; Kopp, G.; Sullivan, P. A calibration scheme for quantitative concentration measurements using simultaneous PIV and PLIF. Exp. Fluid. 2012, 52, 247–259. [Google Scholar] [CrossRef]
- De Barros, F.; Fiori, A.; Boso, F.; Bellin, A. A theoretical framework for modeling dilution enhancement of non-reactive solutes in heterogeneous porous media. J. Contam. Hydrol. 2015, 175–176, 72–83. [Google Scholar] [CrossRef] [PubMed]
- Marcos, M.; Neves, R.J. (Eds.) Ocean Modelling for Coastal Management-Case Studies with MOHID; IST Press: Lisbon, Portugal, 2013; Volume 68, pp. 88–105. [Google Scholar]
- Ozsoy, E.; Unluata, U. Ebb-tidal flow characteristics near inlets. Estuar. Coast. Shelf Sci. 1982, 14, 251–263. [Google Scholar] [CrossRef]
- Galesic, M.; Andricevic, R.; Divic, V.; Mateus, M.; Pinto, L. Potential data used for validation of concentration statistics obtained using analytical model for conservative transport in an estuary. Water Resour. 2016, 31, 714–725. [Google Scholar]
- Chatwin, P.; Lewis, D.; Sullivan, P. Turbulent dispersion and the beta distribution. Environmetrics 1995, 6, 395–402. [Google Scholar] [CrossRef]
- Schwede, R.L.; Cirpka, O.A.; Nowak, W.; Neuweiler, I. Impact of sampling volume on the probability density function of steady state concentration. Water Resour. Res. 2008, 44, 1–16. [Google Scholar] [CrossRef]
- De Barros, F.P.J.; Fiori, A. First-order based cumulative distribution function for solute concentration in heterogeneous aquifers: Theoretical analysis and implications for human health risk assessment. Water Resour. Res. 2014, 50, 4018–4037. [Google Scholar] [CrossRef]
- MATLAB. Version 9.10.0 (R2016b); The MathWorks Inc.: Natick, MA, USA, 2016. [Google Scholar]
- Rutherford, J. River Mixing; John Wiley & Sons Ltd.: Chichester, UK, 1994. [Google Scholar]
- Margeta, J.; Barić, A. Rational approach to the solution of the problem of wastewaters management—The Kaštela Bay case. Glob. Nest Int. J. 2001, 3, 117–130. [Google Scholar]
- Loborec, J.; Kapelj, S.; Novak, H.; Loborec, J.; Kapelj, S.; Novak, H. Analiza opasnosti od onečišćenja podzemnih voda u kršu na primjeru sliva izvora Jadro i Žrnovnica. J. Croat. Assoc. Civ. Eng. 2015, 67, 1093–1103. [Google Scholar]
- Grizzeti, B.; Bouraoui, F. Assessment of Nitrogen and Phosphorus Environmental Pressure at European Scale; Technical Report; Institute for Environment and Sustainability: Ispra, Italy, 2006. [Google Scholar]
- Tavra, M.; Jajac, N.; Cetl, V. Marine Spatial Data Infrastructure Development Framework: Croatia Case Study. ISPRS Int. J. Geo Inf. 2017, 6, 117. [Google Scholar] [CrossRef]
- European, C. INSPIRE Directive 2007/2/EC. Off. J. Eur. Commun. 2007, 108, 1–14. [Google Scholar]
- Basco-Carrera, L.; Warren, A.; van Beek, E.; Jonoski, A.; Giardino, A. Collaborative modelling or participatory modelling? A framework for water resources management. Environ. Model. Softw. 2017, 91, 95–110. [Google Scholar] [CrossRef]
Figure 1.
Problem description within a broader framework (adapted from Galešić et al. [13]).
Figure 1.
Problem description within a broader framework (adapted from Galešić et al. [13]).

Figure 2.
Coastal Pollution Risk Tool (CPoRT) application graphical interface in general (a) and an example of the mean surface plot in the CPoRT (b).
Figure 2.
Coastal Pollution Risk Tool (CPoRT) application graphical interface in general (a) and an example of the mean surface plot in the CPoRT (b).

Figure 3.
Illustrative results: the Žrnovnica estuary map with surface plot of mean concentration and the probability of exceeding the limit concentration ( mg/L) in chosen points.
Figure 3.
Illustrative results: the Žrnovnica estuary map with surface plot of mean concentration and the probability of exceeding the limit concentration ( mg/L) in chosen points.

Figure 4.
The cross-sectional results for total nitrogen from the CPoRT: (a) mean concentration; (b) concentration variance.
Figure 4.
The cross-sectional results for total nitrogen from the CPoRT: (a) mean concentration; (b) concentration variance.

Figure 5.
Probability of exceeding the limit concentration of 1 mg/L along the centerline of the plume.
Figure 5.
Probability of exceeding the limit concentration of 1 mg/L along the centerline of the plume.

Figure 6.
The participants’ statements regarding the applicability of the CPoRT in the decision-making process for coastal water management from students (a) and local stakeholders (b).
Figure 6.
The participants’ statements regarding the applicability of the CPoRT in the decision-making process for coastal water management from students (a) and local stakeholders (b).

© 2018 by the authors. Licensee MDPI, Basel, Switzerland. This article is an open access article distributed under the terms and conditions of the Creative Commons Attribution (CC BY) license (http://creativecommons.org/licenses/by/4.0/).
Share and Cite
MDPI and ACS Style
Galešić, M.; Andričević, R.; Divić, V.; Šakić Trogrlić, R. New Screening tool for Obtaining Concentration Statistics of Pollution Generated by Rivers in Estuaries. Water 2018, 10, 639. https://doi.org/10.3390/w10050639
AMA Style
Galešić M, Andričević R, Divić V, Šakić Trogrlić R. New Screening tool for Obtaining Concentration Statistics of Pollution Generated by Rivers in Estuaries. Water. 2018; 10(5):639. https://doi.org/10.3390/w10050639
Chicago/Turabian StyleGalešić, Morena, Roko Andričević, Vladimir Divić, and Robert Šakić Trogrlić. 2018. "New Screening tool for Obtaining Concentration Statistics of Pollution Generated by Rivers in Estuaries" Water 10, no. 5: 639. https://doi.org/10.3390/w10050639
Note that from the first issue of 2016, this journal uses article numbers instead of page numbers. See further details here.