Article

Daily Evapotranspiration Estimation at the Field Scale: Using the Modified SEBS Model and HJ-1 Data in a Desert-Oasis Area, Northwestern China

1
Department of Water Resources, China Institute of Water Resources and Hydropower Research, Beijing 100038, China
2
School of Surveying and Mapping Geographic Information, Lanzhou Jiaotong University, Lanzhou 730070, China
3
College of Environmental Science and Engineering, State Environmental Protection Engineering Center for Pollution Treatment and Control in Textile Industry, Donghua University, Shanghai 200051, China
4
School of Hydraulic Engineering, Dalian University of Technology, Dalian 116024, China
*
Author to whom correspondence should be addressed.
Water 2018, 10(5), 640; https://doi.org/10.3390/w10050640
Submission received: 11 April 2018 / Revised: 8 May 2018 / Accepted: 9 May 2018 / Published: 15 May 2018
(This article belongs to the Special Issue Applications of Remote Sensing and GIS in Hydrology)

Abstract

:
Accurate continuous daily evapotranspiration (ET) at the field scale is crucial for allocating and managing water resources in irrigation areas, particularly in arid and semi-arid regions. The authors integrated the modified perpendicular drought index (MPDI) as an indicator of water stress into surface energy balance system (SEBS) to improve ET estimation under water-limited conditions. The new approach fed with Chinese satellite HJ-1 (environmental and disaster monitoring and forecasting with a small satellite constellation) images was used to map daily ET on the desert-oasis irrigation fields in the middle of the Heihe River Basin. The outputs, including instantaneous sensible heat flux (H) and daily ET from the MPDI-integrated SEBS and the original SEBS model, were compared with the eddy covariance observations. The results indicate that the MPDI-integrated SEBS significantly improved the surface turbulent fluxes in water-limited regions, especially for sparsely vegetated areas. The new approach only uses one optical satellite data and meteorological data as inputs, providing a considerable operational improvement for ET mapping. Moreover, HJ-1 high-resolution data promised continuous daily ET at the field scale, which helps in understanding the corresponding relationships among field, crop, and water consumption. Such detailed ET information can greatly serve water resources management in the study area as well as other arid and semi-arid regions.

1. Introduction

Evapotranspiration (ET), the total amount of water evaporation from land and water surface and transpiration by vegetation, is considered to be the most active process in the terrestrial hydrological cycle and the major component of energy and water balance in agricultural systems [1]. It is a major consumptive use of precipitation and irrigation water on farmland. Agricultural water in the arid and semi-arid regions of China accounts for about 70% of total water use, more than 90% of which is consumed via evapotranspiration [2]. Any attempt to improve water use efficiency in water management must be based on reliable estimates of ET. Hence, understanding spatiotemporal variations in water use via evapotranspiration on irrigated fields is vital for facilitating the optimization of water use and allocation among different competing uses, especially in arid and semi-arid regions where water resources are scarce.
Accurate ET can be measured in the field by different types of instruments including lysimeters, eddy covariance (EC), surface renewal, and flux variance systems [3,4]. However, in situ observations are costly and only obtain the turbulent fluxes over small and homogeneous regions [5]. Remote sensing (RS) technology provides a cost-effective way to estimate ET at a variety of spatial and temporal scales [6]. Over the past few decades, many RS-based methods have been developed to estimate land surface flux and ET. These approaches can be broadly grouped into four categories: (1) empirical and semi-empirical methods [7,8]; (2) surface energy balance models (SEB) (e.g., the surface energy balance algorithm for land (SEBAL), the surface energy balance system (SEBS) and mapping ET with internalized calibration (METRIC), the two-source energy balance model (TSEB), and the simplified two-source energy balance model (STSEB) [9,10,11,12,13,14]; (3) vegetation index approaches (e.g., vegetation index combined with the Penman-Monteith (PM) method and the Priestley-Taylor (PT) method) [15,16]; (4) data assimilation combined with land surface models and observations [17,18]. RS-based models have been developed and applied over a wide range of spatial scales from local to global, performing consistently with ground measurements by the relative error of 10–30% for daily ET and 5% for seasonal and annual ET [19,20,21,22,23].
The focus of this study is on the physically-based SEBS model, which calculates the sensible heat flux (H) using a single-source bulk transfer equation and derives the evapotranspiration from the evaporative fraction [10]. It is less site-specific compared to a dual-source model such as TSEB and does not require subjective intervention by the model user, such as in SEBAL and METRIC techniques, where selecting hot and cold endmembers within the scene is required [24]. The SEBS model has been extensively applied and validated with a variety of methods in different regions and climates, having a good utility to create multi-scale high spatial and temporal resolution ET datasets [25,26,27,28,29]. However, many studies have reported that the SEBS model overestimates ET in the range of 0.5–3.0 mm d−1 due to the underestimation of sensible heat flux in semi-arid and arid regions where water limiting situations prevail [30,31,32]. Gokmen et al. (2012) adapted heat transfer additional damping (kB−1) in SEBS by a scaling factor retrieved from passive microwave soil moisture products (Advanced Microwave Scanning Radiometer-Earth Observing System, AMSE-R, 0.25°), with an overall improvement on sensible heat flux of 40 W m−2 under water-limited conditions [33]. The passive microwave soil moisture data has a coarser spatial resolution (~25 km) compared to the MODIS (moderate resolution imaging spectroradiometer) thermal bands with 1 km resolution, which would induce error and uncertainty from multiple-resolution data [34]. Li et al. (2015) applied this approach using soil moisture data with a higher spatial resolution retrieved from airborne PLMR (a dual polarization L-band (1.4 GHz) passive microwave radiometer, 700 m) in the irrigated oases of arid regions in Northwest China and obviously overcame the ET overestimation [35]. However, the expensive airborne radar could not become a conventional data source to support irrigation management. Hence, inexpensive and readily available RS data should be considered to solve the problem of consistency in the process of calculating ET.
High spatial resolution imagery (<100 m) is commonly considered necessary to distinguish the differences in ET among agricultural fields. However, some high spatial resolution imagery (e.g., Landsat 30 m, ASTER (the advanced spaceborne thermal emission and reflection radiometer) 15 m) is only available at two weeks or greater temporal resolution, which makes its application problematic in areas with high cloud cover and dynamic land cover [36]. The Chinese HJ-1 (the environmental and disaster monitoring and forecasting with a small satellite constellation) can provide global coverage every two days with a spatial resolution of 30 m. The characteristics of short repeat interval and high spatial resolution are very useful for monitoring the regional land surface variables, such as vegetation indexes (VI), drought indexes, land surface temperature (LST), and ET [37,38,39,40,41]. The authors integrated the modified perpendicular drought index (MPDI) as a soil moisture indicator into the SEBS fed with HJ-1 images to obtain accurate ET estimation at the field scale in Ganzhou irrigation districts. The principal objectives of this study were to: (1) provide an effective way to overcome the shortage of overestimation of ET under water-limited conditions by integrating MPDI into the SEBS model only using HJ-1 and meteorological data as inputs; (2) evaluate the performance of the MPDI-integrated SEBS model for irrigated oases in Northwestern China; (3) analyze the spatiotemporal variability of daily ET for different crops during the crop growing season to gain an understanding of the irrigation water requirement in the studied region.

2. Materials and Methods

2.1. Experimental Region and Data
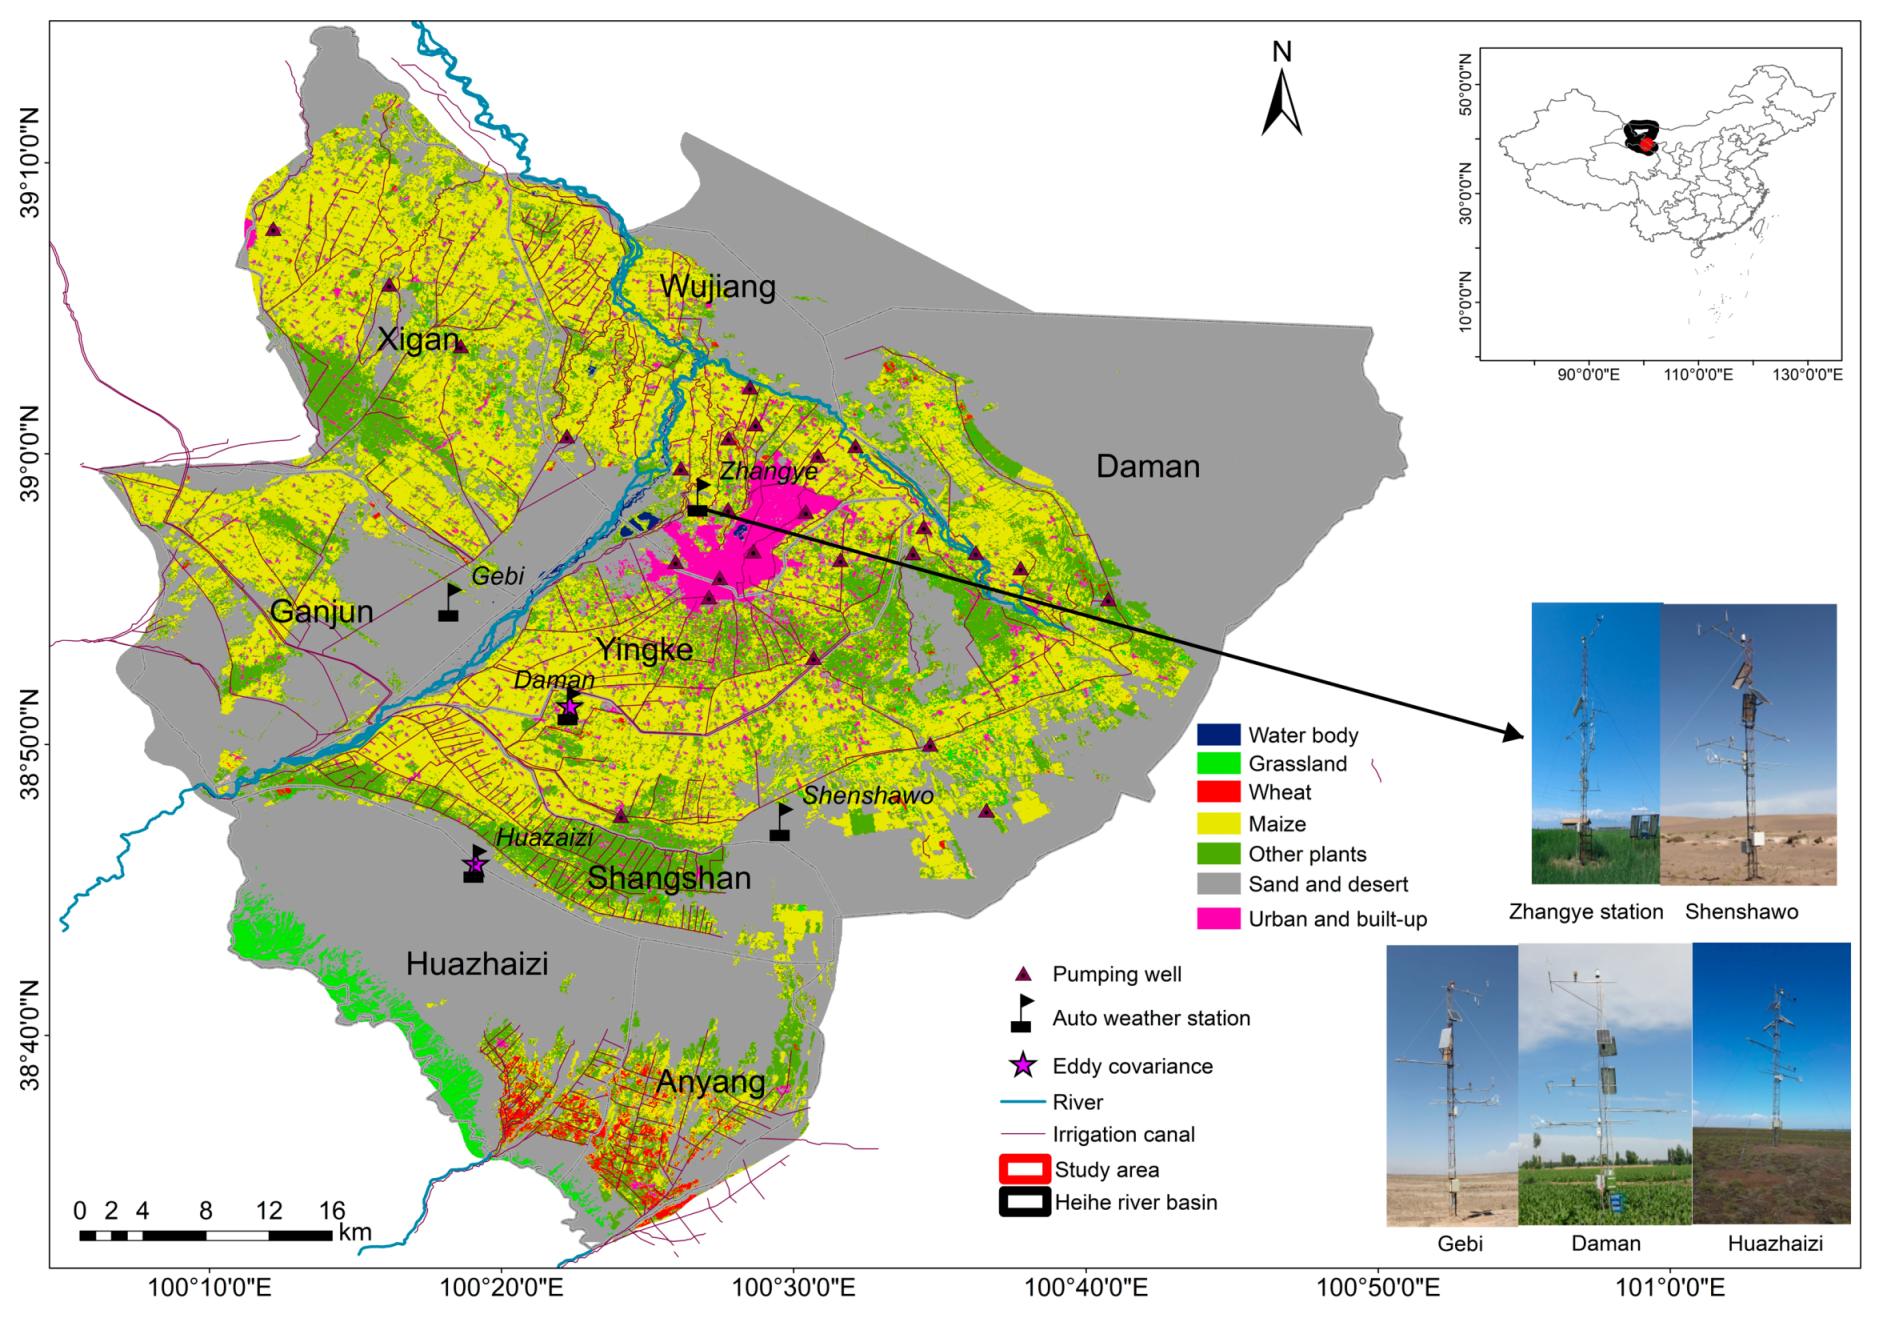
2.1.1. Study Area

The Ganzhou Districts (100.03°–100.68° E, 38.33°–39.20° N) are located in a desert-oasis zone in the middle reaches of the Heihe River Basin (HRB), Northwestern China (Figure 1). This is a main agricultural county in the HRB including eight irrigation districts named Daman, Yingke, Ganjun, Shangshan, Wujiang, Xigan, Huazhaizi, and Anyang. The climate is continental, with an annual average temperature of 7.5 °C. Annual rainfall and annual evaporation capacities are about 136.8 mm and 1840.1 mm, respectively [42].
The artificial oasis, the Gobi Desert, and the transitional zones between the oasis and desert are the dominant landscapes in the region. The Ganzhou districts are an important maize seed production base in Northwestern China. Maize is a predominant crop in these areas, covering more than 70% of the irrigated fields. Other plants include winter wheat, orchards, vegetables, alfalfa, cotton, and woods. During the growing season (from April to September), crops needs much water, but the rainfall is relatively small. The agriculture of this region depends heavily on irrigation water extracted from the Heihe River or from the aquifer. In the period of crop growth, the croplands are irrigated using flood irrigation at an interval of 20 days to one month. In 2012, the irrigation used 10.61 × 10⁸ m3 of surface water diverted from the Heihe River and 5.36 × 10⁸ m3 from pumping ground water in the middle reach oasis of the HRB [43].

2.1.2. Field Experimental Site

The field measurements used in this study were collected during HiWATER (Heihe Watershed Allied Telemetry Experimental Research), which was conducted in 2015 [44]. There were five ground observation stations in the study area: Daman, Huazhaizi, Shenshawo, Zhangye, and Gebi stations. The underlying surface and geographic information at the five sites are described in Figure 1 and Table 1.
An automatic weather station (AWS) was equipped with sensors for collecting data including temperature, wind speed and direction, air pressure, humidity, precipitation, soil moisture profile, solar radiation, four-component radiation, soil heat flux, and infrared temperature every 10 min over the whole year of 2015. All variables every 10 min were cumulated into the data of one day, then the daily data were interpolated into a map at a resolution of 30 m covering the study area with Kriging Interpolation.
Fluxes of sensible and latent heat used in the model evaluation were measured at Daman and Huazhaizi stations. The eddy covariance (EC) sensors were installed at the height 4.5 m above the ground. EC data were sampled at a frequency of 10 Hz and turbulent fluxes were recorded every 30 min. The Gaussian fitting method was used to interpolate the missing data [45]. The closure error of the EC measurements at the daily scale, in the case of the energy imbalance of EC system, was calculated based on the energy balance ratio (EBR) to correct the daily flux data [46].

2.1.3. Satellite Data

The HJ-1 which includes three satellites (HJ-1A, HJ-1B and HJ-1C) was launched by the China Center for Resources Satellite Data and Applications (CRESDA) on 6 September 2008 (http://www.cresda.com/CN/). There were two optical charge coupled devices (CCDs) and a hyper-spectrum image (HIS) loaded on HJ-1A, and there were two CCDs and an infrared scanner (IRS) on HJ-1B. HJ-1A/B had a short revisit period (two days), high spatial resolution (30 m), and large cover area (700 km), which made it applicable to monitor the regional environment. The satellite sensor parameters of HJ-1 are provided in Table 2. Considering the quality of remote sensing over the study area, the available satellite images obtained in the growth season of 2015 from April to October were selected (Table 3). All of the images were subjected to geometric correction and atmospheric correction.
Cropping planting structure was derived from HJ-1 CCDs data with a support vector machine (SVM), object-based method, and time-series analysis, with the overall accuracy for the crop classification reaching 84.09% [47]. The green (0.52–0.62 μm), red (0.63–0.69 μm), and near infrared (0.76–0.9 μm) bands of HJ-1 CCDs data were used to calculate the leaf area index (LAI) through a vegetation canopy radiation model developed by Jin et al. (2007) [48].

2.2. Method

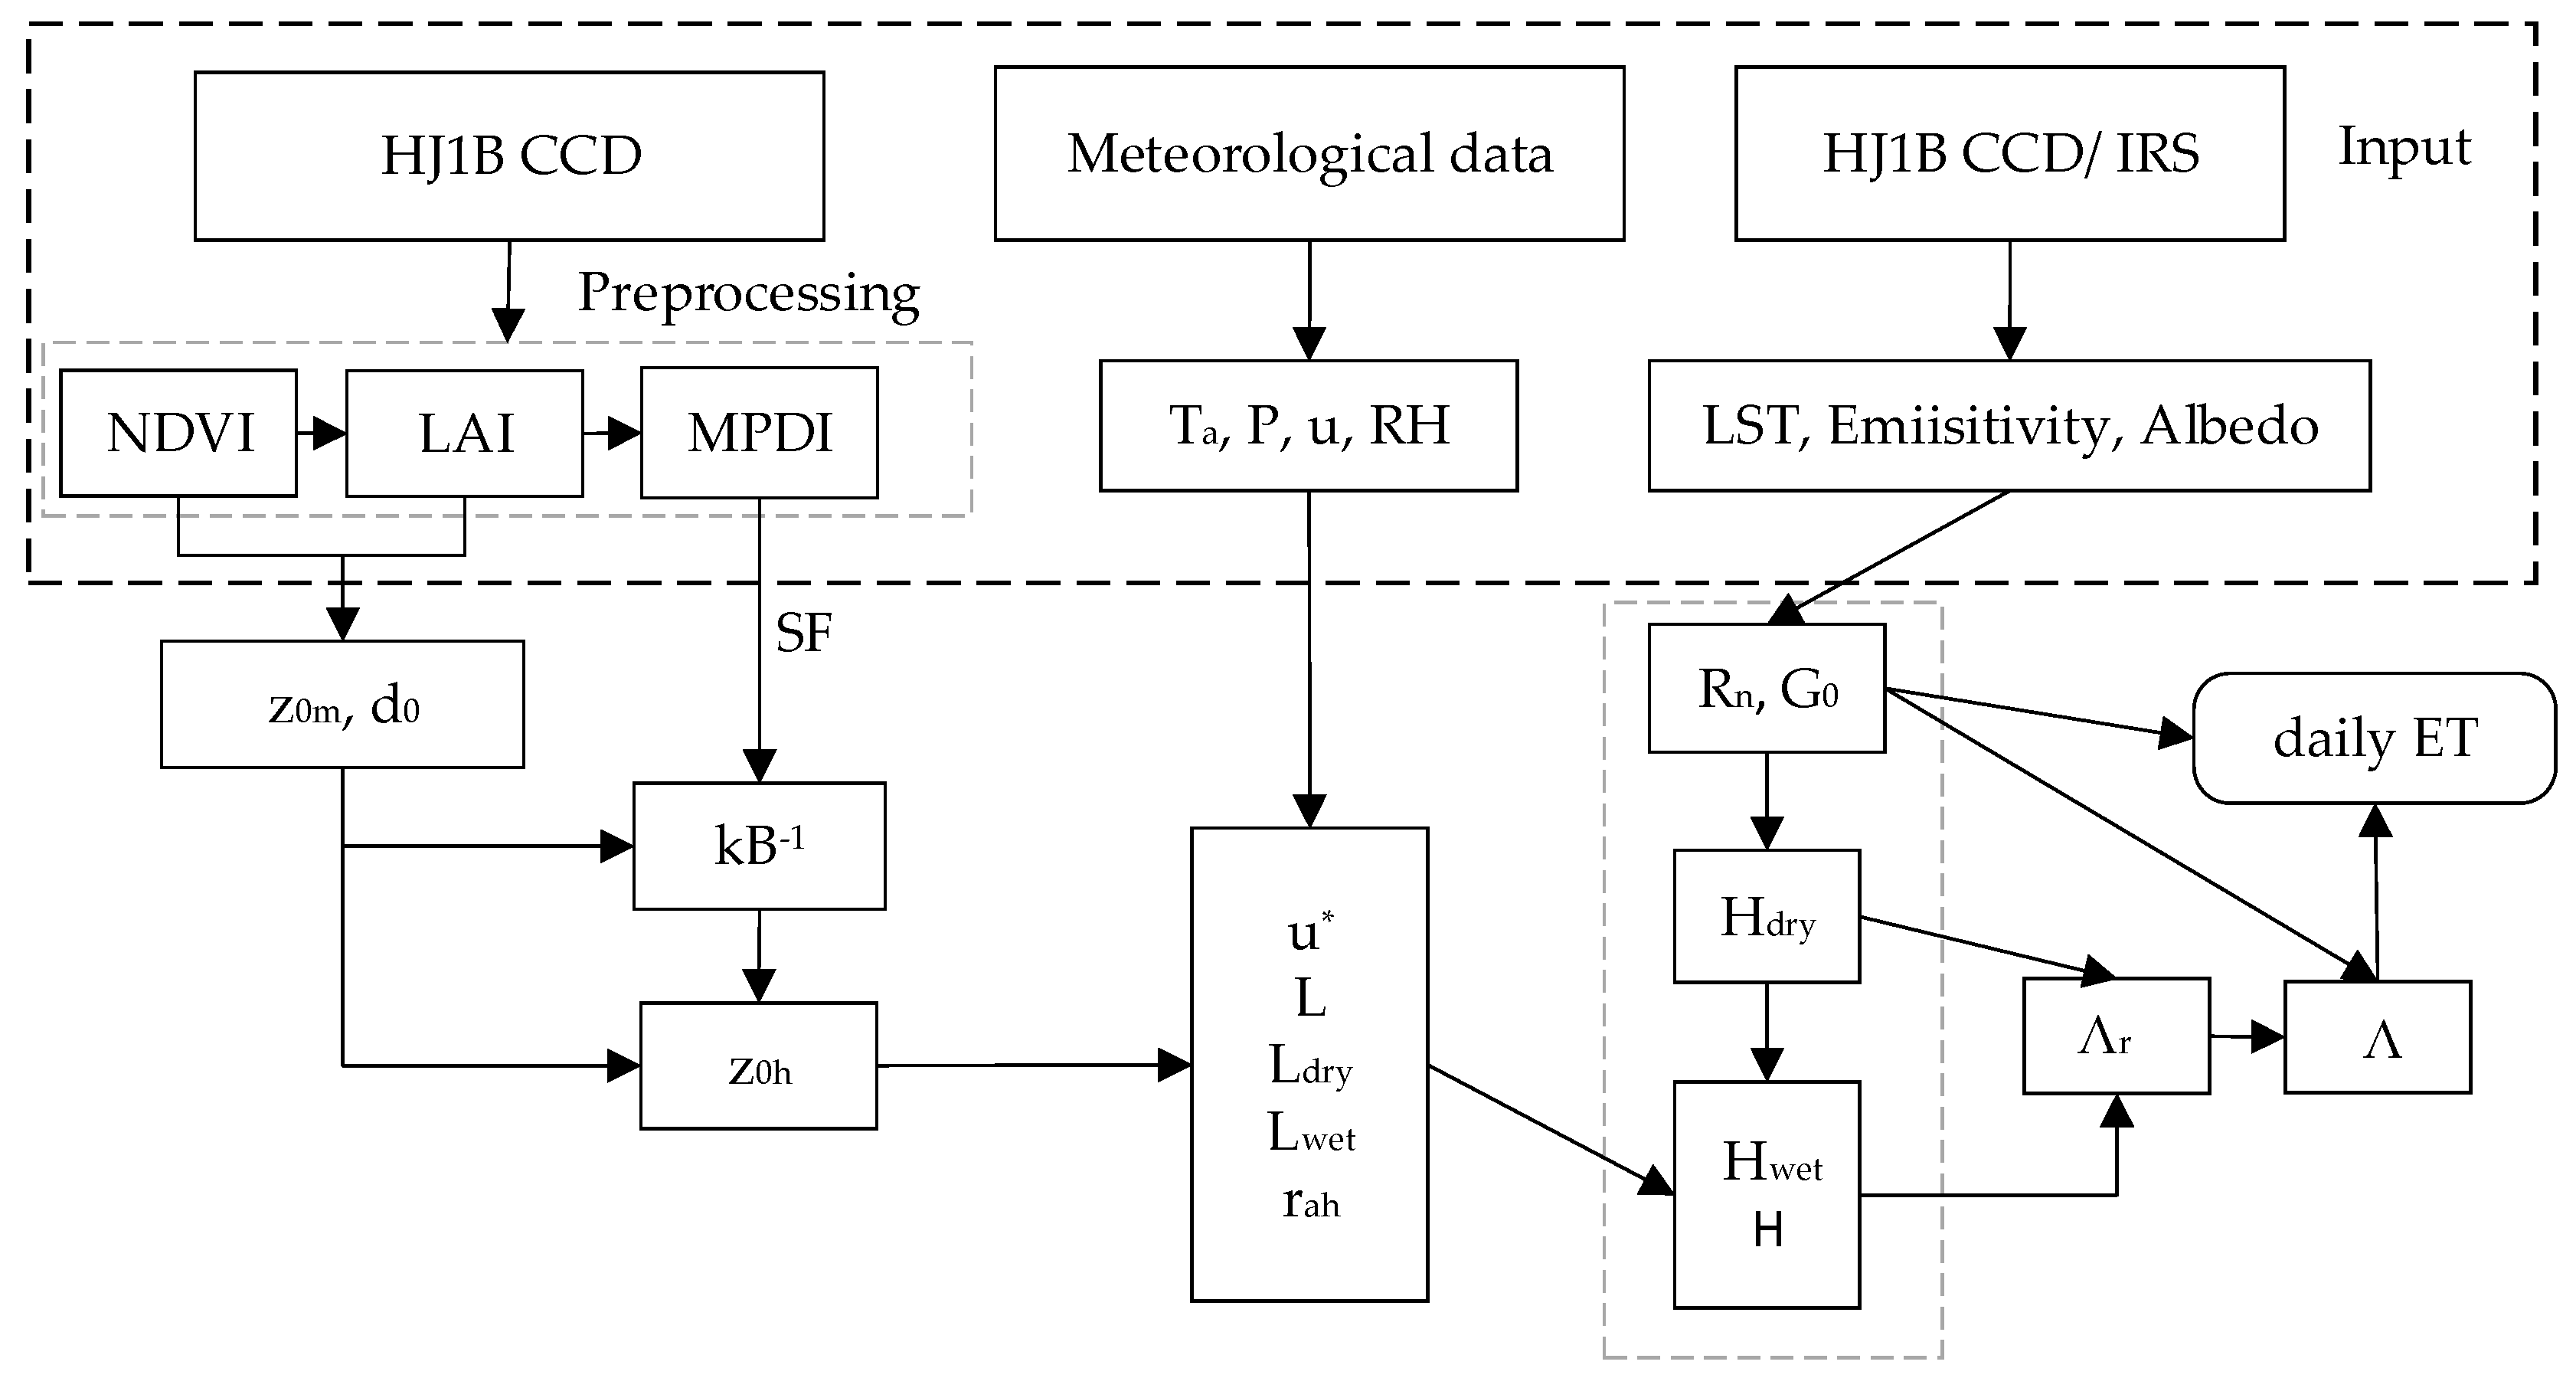
2.2.1. A Brief Description of SEBS

The surface energy balance model (SEBS) is a single source model and takes latent heat flux (λET) as the residual of the surface energy balance. It is proposed for the estimation of atmospheric turbulent fluxes and evaporative fraction using satellite earth observation data and meteorological information at proper scales [10]. The surface energy balance is normally written as:
λ ET = R n G H
where Rn, G, H, and λET are the net radiation flux, soil surface heat flux, sensible heat flux, and latent heat flux, respectively. The units of these variables are W m−2. Su et al. (2001) and Su (2002) detailed a set of equations for the estimation of the land surface physical parameters and variables, such as albedo, emissivity, vegetation coverage, land surface temperature, etc. [10,49].
Sensible heat flux is derived from the similarity theory along with a dynamic roughness height formulation for the heat transfer. In the atmospheric surface layer (ASL), the similarity relationship for the profiles of the mean wind speed (u) and the mean temperature (T0 − Ta) are usually described as:
u = u * k [ ln   ( z d 0 z 0 m ) Ψ m ( z d 0 L ) + Ψ m ( z 0 m L ) ]
T 0 T a = H ku * ρ C p [ ln   ( z d 0 z 0 h ) Ψ h ( z d 0 L ) + Ψ h ( z 0 h L ) ]
L = ρ C p u *   3 θ v kgH
where u is the mean wind speed; u* is the friction velocity (m s−1); k is the von Karman constant (0.4); z is the height above the land surface where the meteorological observations were made (m); Cp is the specific heat of air at constant pressure (J kg−1 K−1); d0 is the zero plane displacement height (m); and z0h and z0m are the surface roughness heights for heat and momentum transport (m); Ψh and Ψm are the stability correction functions for heat and momentum transport; g is the acceleration due to gravity (m s−2); θv is the virtual temperature (K); L is the Obukhov length (m); T0 and Ta are the temperature of the land surface and air, respectively (K); and ρ is the density of air (kg m−3). More details about the SEBS model can be found in Su (2002) [10].

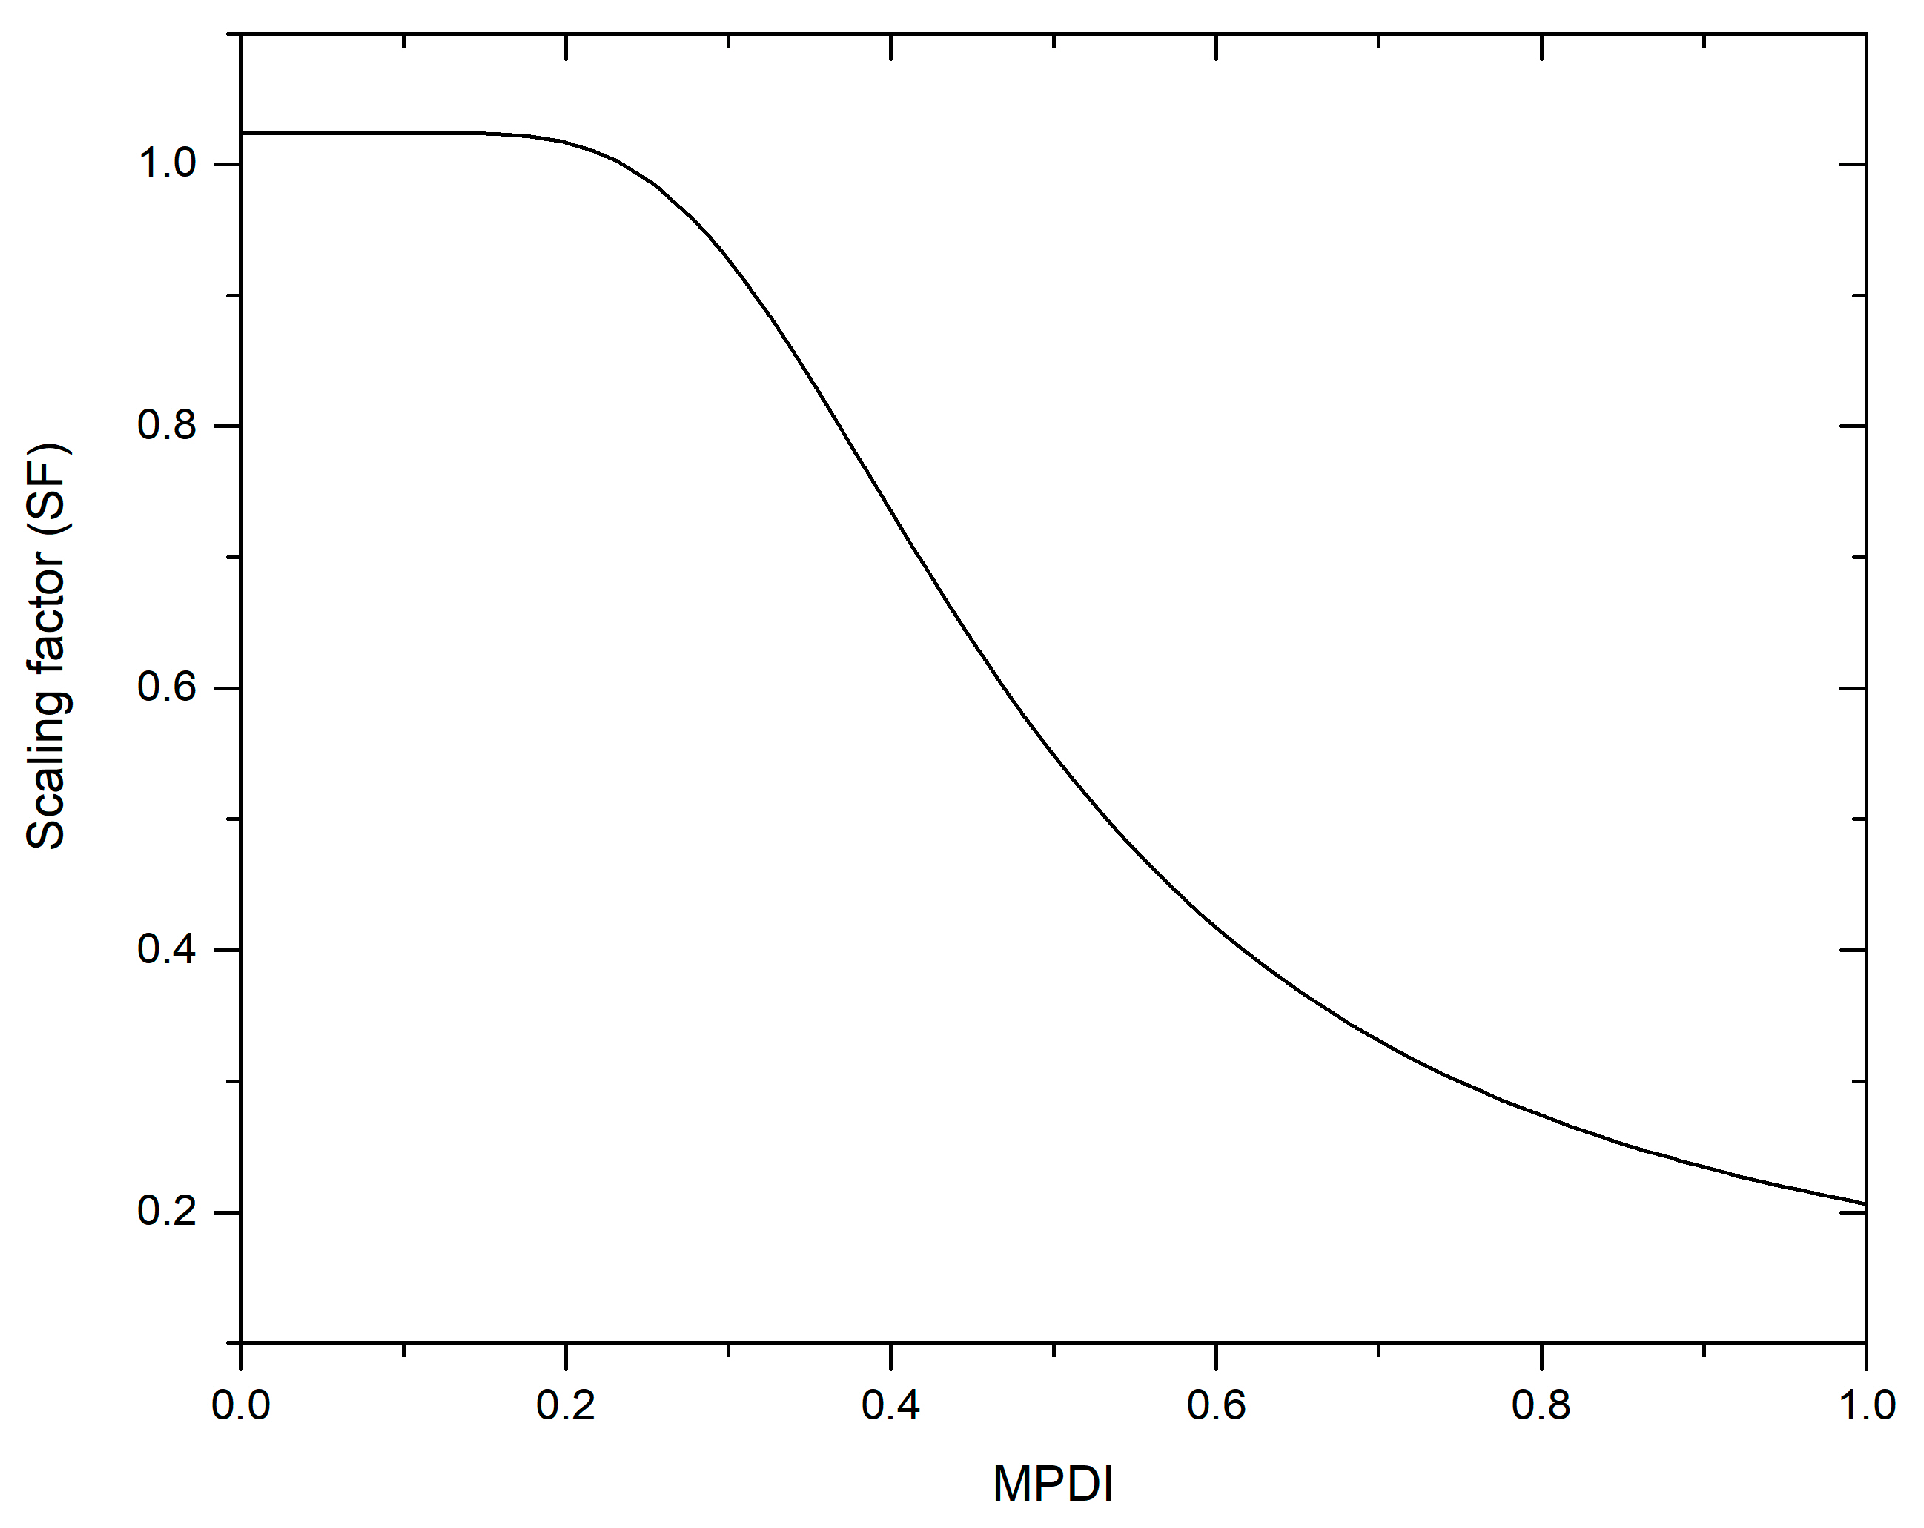
2.2.2. The MPDI-Integrated SEBS Model

Theoretically, d0 + z0h defines the level where the canopy exchanges sensible and latent heat with the atmosphere [50,51]. Hence, z0h constitutes one of the most crucial parameters for the accurate calculation of H [52]. The surface roughness height for heat (z0h) can be derived from:
z 0 h = z 0   m exp   ( kB 1 )
ET, in arid and semi-arid regions, is limited not only by the available energy, but also by the available water [53]. When plants suffer from water stress, the leaf stomata on the top of the canopy gradually close, thus the air temperature on the top of the canopy increases due to solar radiation. However, the temperature fluctuation at the bottom of the canopy is relatively small due to the effect of leaf covers. This means the surface roughness height for heat transport moves to the canopy top, thereby z0h rises, which induces sensible heat flux to increase, in turn reducing crop transpiration derived from soil moisture [33]. Therefore, adapting z0h (via kB−1) by introducing soil moisture correction can remedy the shortcoming of the overestimation of ET using the SEBS model. Here, the modified perpendicular drought index (MPDI) proposed by Ghulam et al. (2007) was integrated into the SEBS bulk transfer equation for H (via kB−1). MPDI is based on the spatial distribution features of soil moisture in NIR-Red spectral space, taking into account both soil moisture and vegetation growth [54]. It provides a simple method to detect soil moisture condition and crop drought and has been extensively tested and verified over different climate and hydrologic regimes in China, Iran, and Thailand [55,56,57]. It is written as follows:
MPDI = R Red + MR NIR f v ( R v , Red + MR v , NIR ) ( 1 f v ) M 2 + 1
where RRed and RNIR refer to the atmospherically corrected reflectance of the red and near-infrared bands, respectively; M is the slope of the soil line; Rv, Red and Rv, NIR are the vegetation reflectance in the red and near-infrared bands, respectively; and fv represents fraction of vegetation. More details about MPDI can be found in Ghulam et al. (2007) [54].
The kB−1 value is modified using a scaling factor (f) represented by a reverse sigmoid function:
kB u 1 = SF × kB 1
where
SF = [ a + 1 ( 1 + exp ( b c   /   MPDI rel ) ) ]
Here, kB u 1 is the updated kB−1; a, b, and c are the coefficients of the reverse sigmoid function. A reverse sigmoid function for SF was selected because it considerably lowers the kB−1 value for relatively dry conditions (high MPDI values), while soil moisture influence on the value of kB−1 is not significant for wet conditions (low MPDI values). Hence, it better fits the conceptual framework for a water-limited evapotranspiration regime [53]. The new calculation process for daily ET with the MPDI-integrated SEBS model is shown in Figure 2.
To obtain the coefficients of the reverse sigmoid function, the authors calibrated the MPDI-integrated SEBS using EC flux observations at Daman station. Cloud-free HJ-1 data from 2015 were used to determine the coefficients (a, b, and c) of sigmoid function through an optimization by reducing the error between the observed and modeled sensible heat flux values from EC and SEBS. The parameters a, b, and c were determined as 0.024, 3.1, and 1.6, respectively. The reverse sigmoid function for SF-MPDI availably decreased the kB−1 value, thereby increasing z0h at water stress conditions. Figure 3 shows that the upper boundary is slightly above 1. That might be because the initial effect of soil evaporation before water stress slightly lowers rather than increase z0h when taking into account the plant physiological discussion [58].

3. Results and Discussion

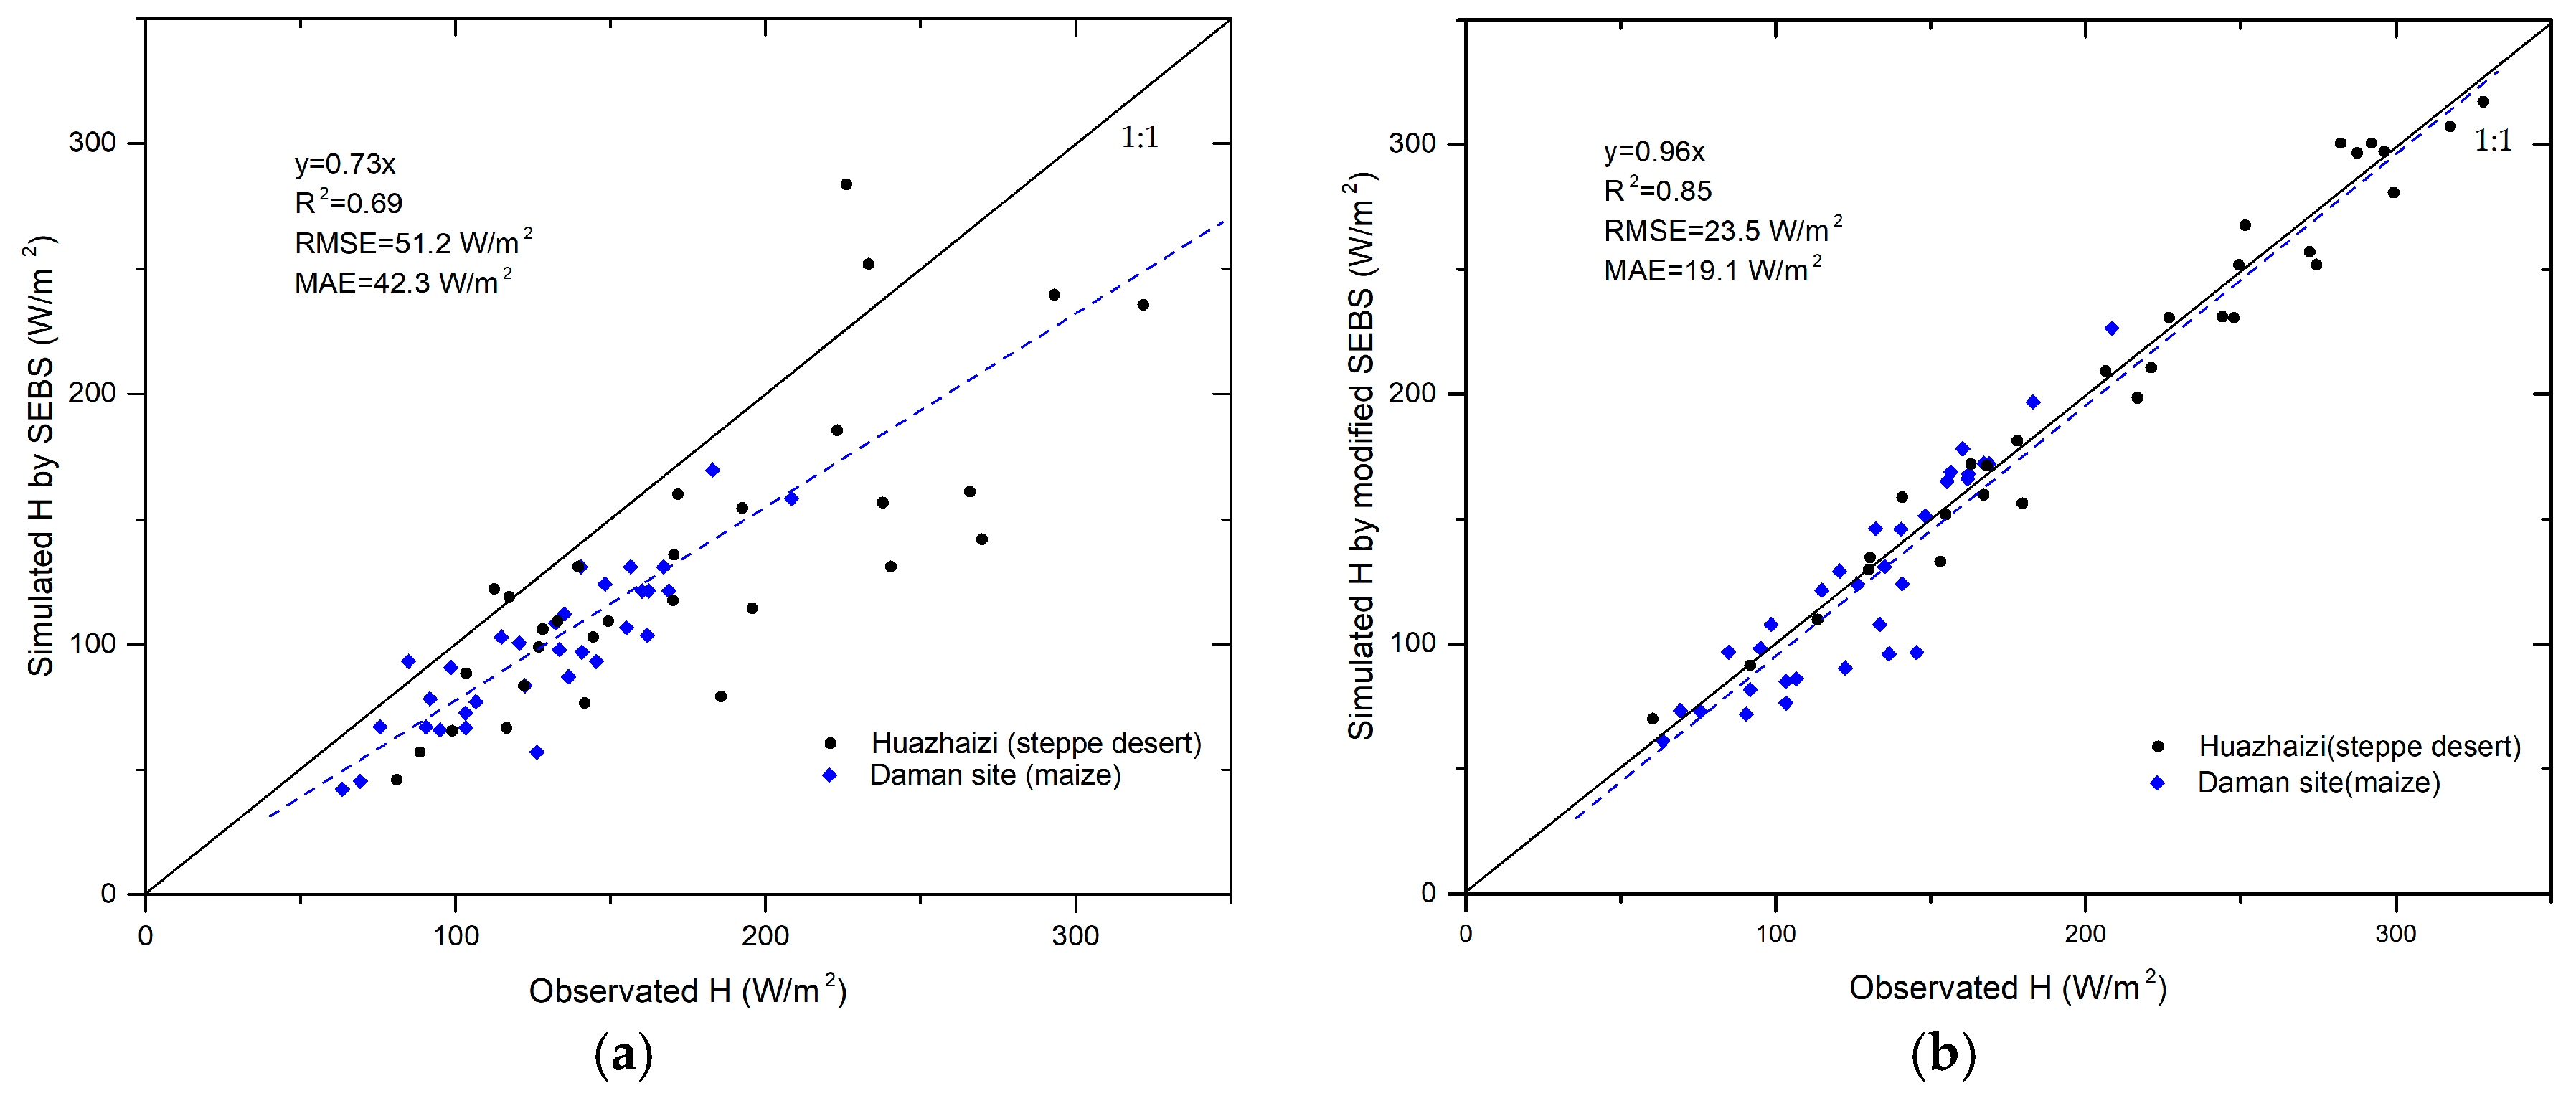
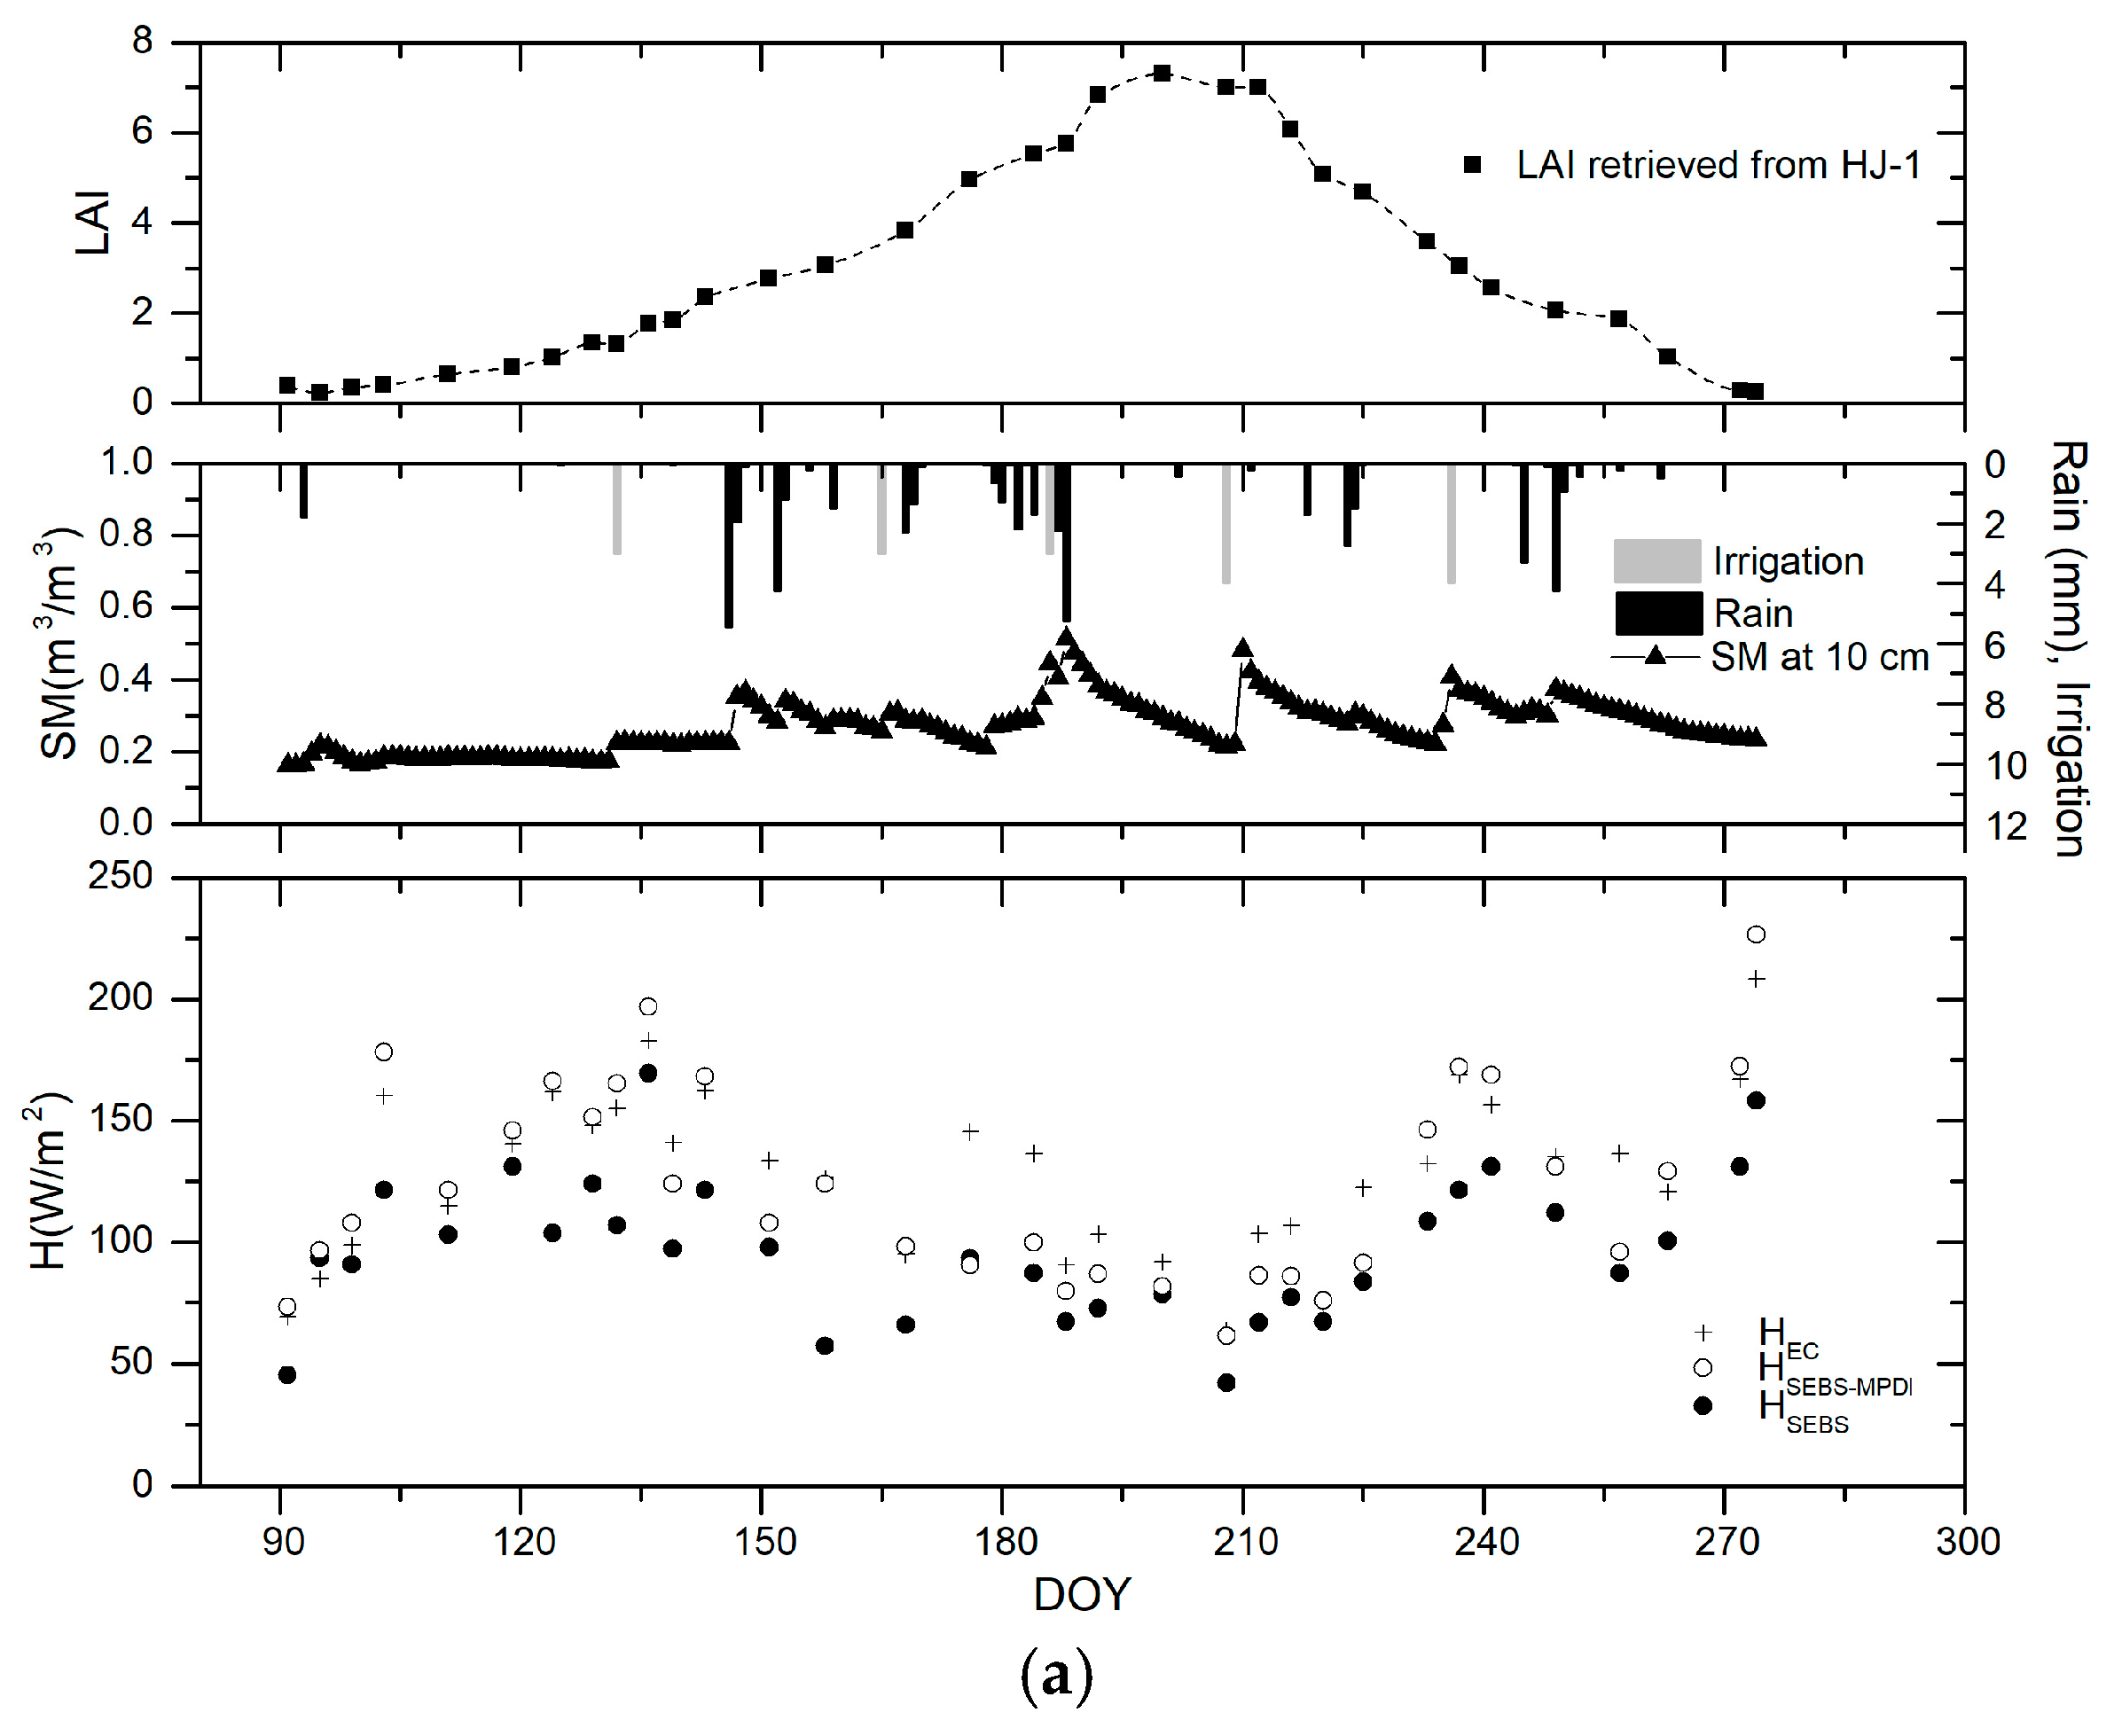
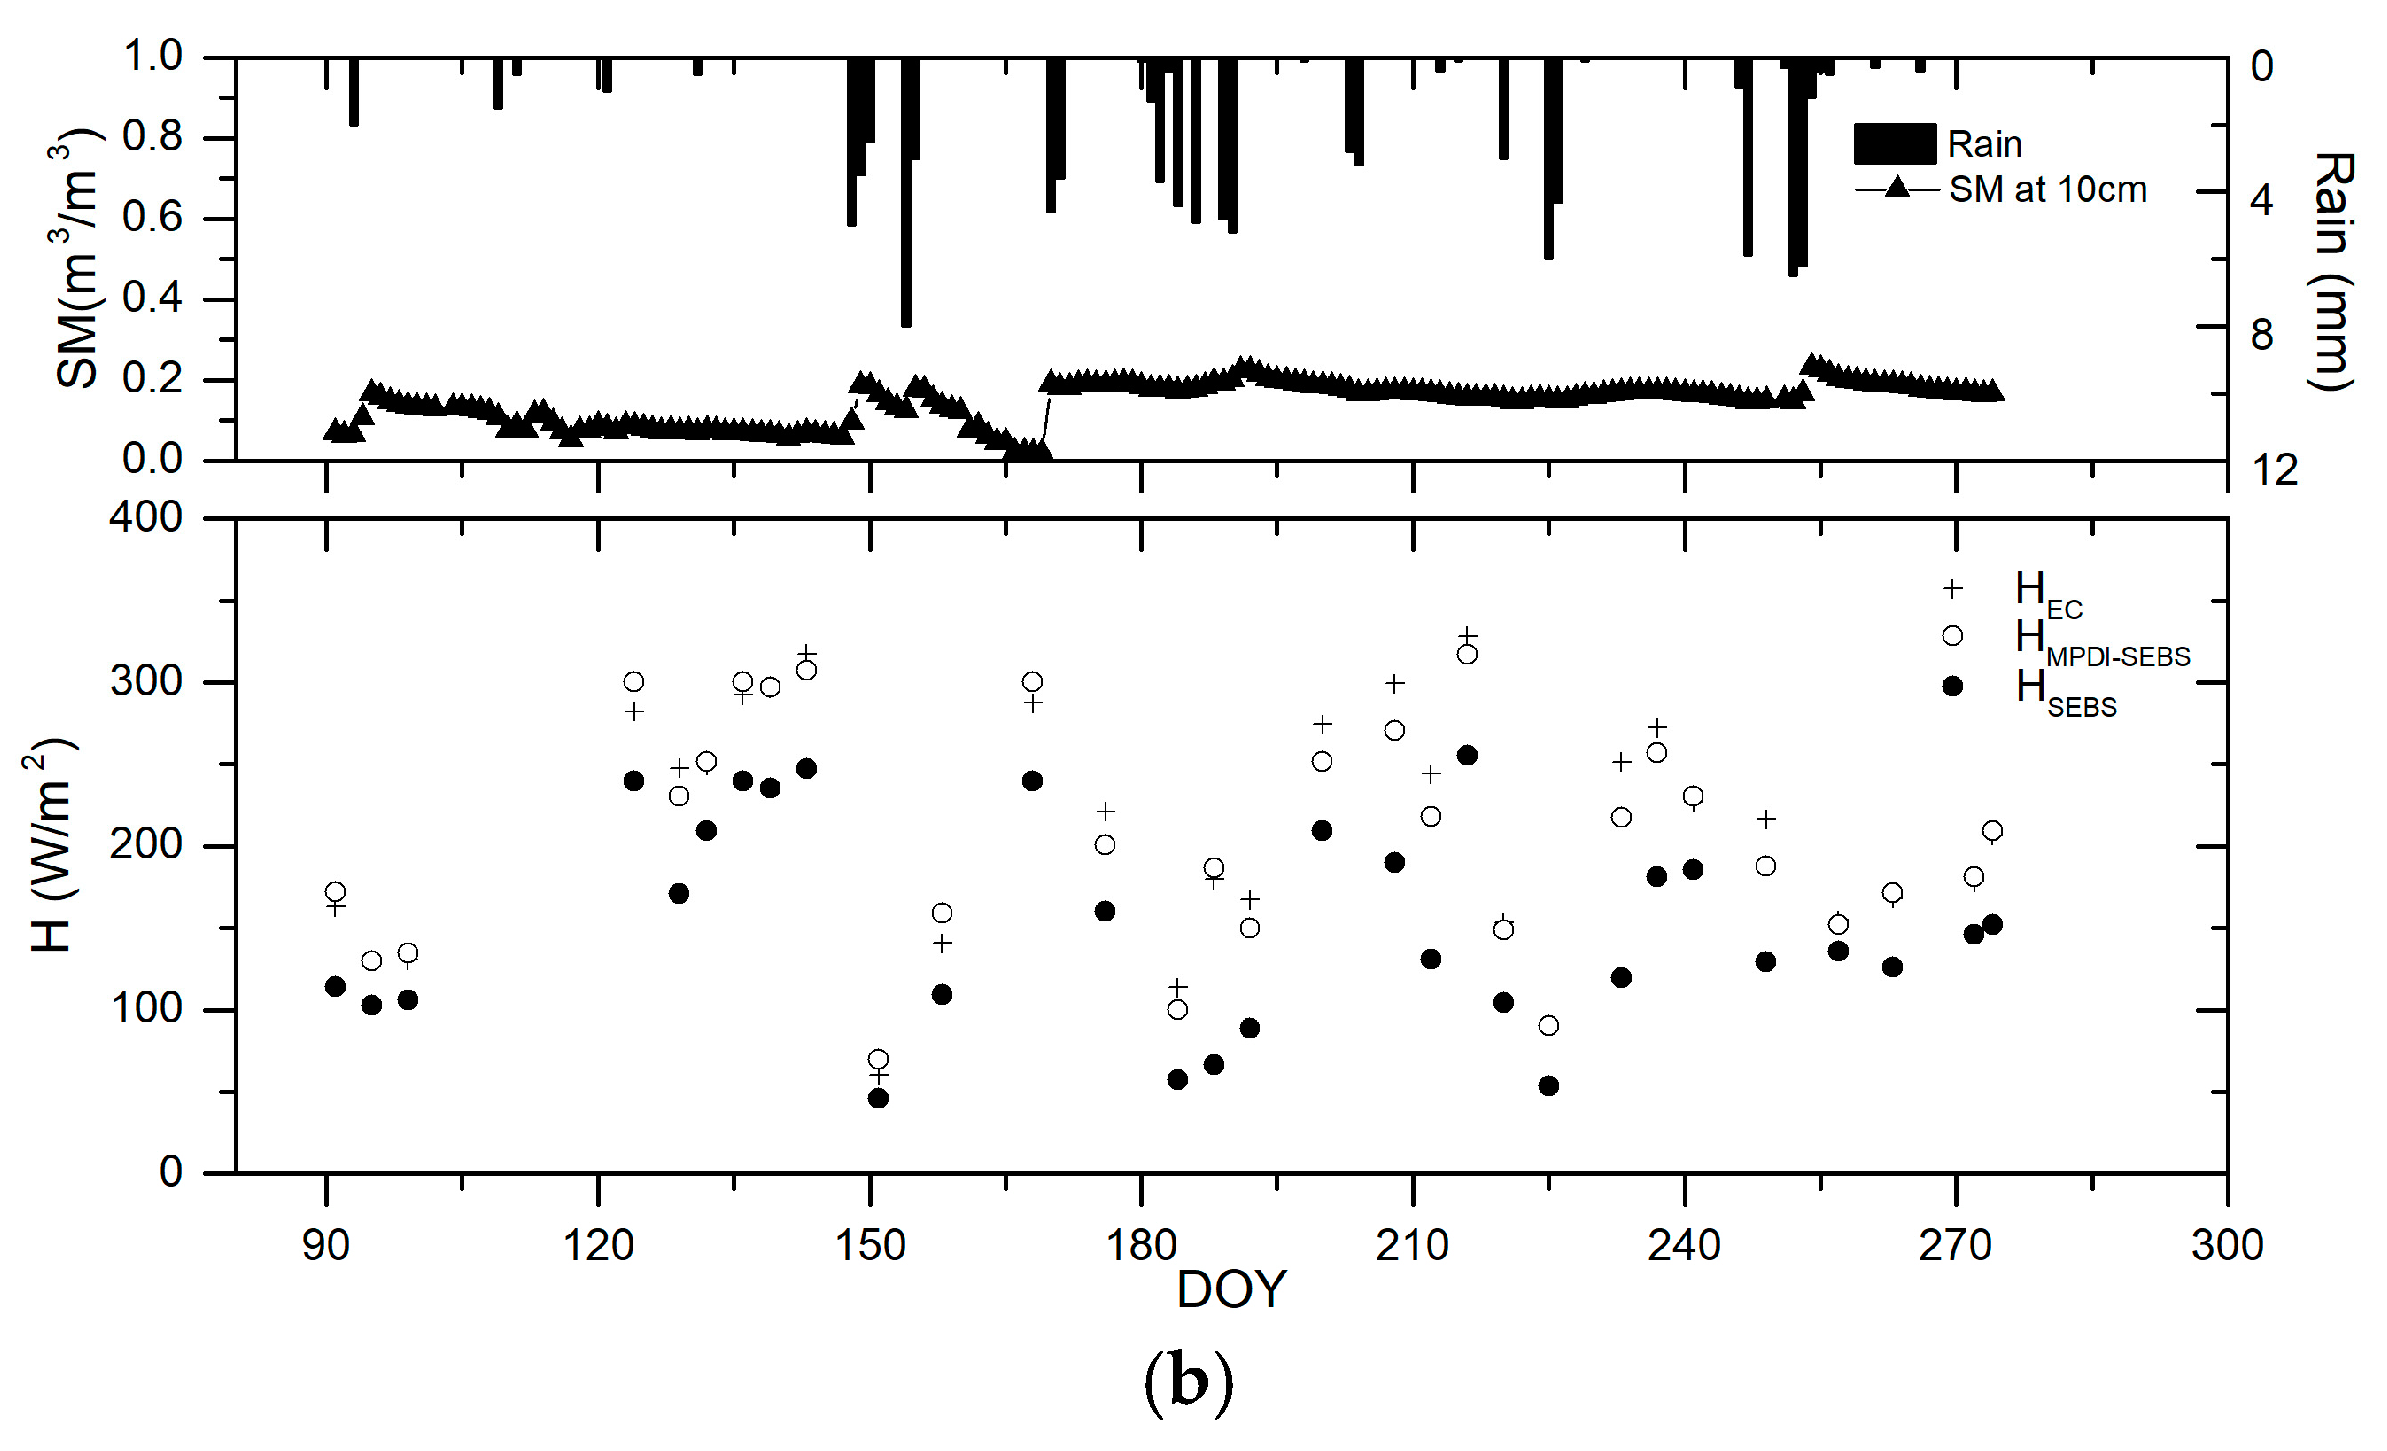
3.1. Comparison of Observed H with SEBS and MPDI-Integrated SEBS

To be able to analyze whether integrating MPDI into SEBS via kB−1 improves the sensible heat (H) estimates in the study region, the H observations from EC (HEC) at the HJ-1 transit time were compared with H calculated by SEBS (HSEBS) and MPDI-integrated SEBS (HSEBS-MPDI). Figure 4a indicates an obvious underestimation of H by the original SEBS, with most scatter points below the 1:1 line, and the slope for the linear regressions was 0.73. A better agreement was obtained between the observed and modeled H in Figure 4b, with more scatter points around the 1:1 line, and the slope for the linear regressions was 0.96. When soil moisture information was incorporated in the calculation of H by SEBS, the coefficient of determination (R2) was 0.85, indicating a strong correlation between the observed H and simulated H by the MPDI-integrated SEBS model.
To further study the behavior of the two methods under low soil moisture and high soil moisture, the time series of soil moisture and the sensible heat fluxes of HEC, HSEBS, and HSEBS-MPDI in the Daman station and the Huazhaizi station were plotted in Figure 5. At Daman station, from late May to August, intensive rainfall or irrigation led the soil moisture to maintain a relatively high level (>0.30 m3/m3) sometimes. Although rain caused soil moisture to fluctuate during growing season, the values for soil moisture mostly stayed low (<0.20 m3/m3) at Huazhaizi station. Table 4 shows the error evaluation of HSEBS and HSEBS-MPDI based on EC observations under low soil moisture and high soil moisture conditions. When soil moisture was less than or equal to 0.30 m3/m3, a large reduction in the root mean square error (RMSE) occurred and the mean absolute error (MAE) leapt from 58.17 W m−2 to 7.06 W m−2, which indicated that the MPDI-integrated SEBS significantly improved the underestimation of H for the SEBS model. When soil moisture was greater than 0.30 m3/m3, the RMSEs and MAEs between HSEBS and HSEBS-MPDI were close, which implied that the MPDI-integrated SEBS model slightly refined the SEBS model when adequate soil water was available. Seneviratne et al. revealed in 2010 that the process of evapotranspiration is controlled by the available energy rather than the soil moisture when the area is under saturated moisture conditions [54]. This is the reason why the MPDI-integrated SEBS cannot significantly improve the performance of the SEBS model under high soil moisture conditions.
The specific comparison of instantaneous H estimated by SEBS with and without the integration of MPDI on an early dry summer day of 4 May, 2015 (day of year (DOY) 124) is plotted in Figure 6. At this time of year, maize was still in the seedling stage. The high MPDI (MPDI > 0.5) and bare to very sparse conditions (LAI < 2) observed in most of the study region confirmed water-limited conditions with sparse vegetation (e.g., purple circles in Figure 6). Accordingly, the instantaneous H estimated by the MPDI-integrated SEBS had the largest increase with about 42.5 W m−2 in these areas. The red circles in Figure 6 represent samples with relatively high vegetation (LAI > 4) but low soil moisture conditions (MPDI > 0.5), where the pixels are wheat parcels, orchard, and vegetables, which is consistent with the planting structure as shown in Figure 1. There was a moderate increase in these areas, with about 22.5 W m−2 of H. Regarding the wetland or open water area (e.g., river) where adequate water was available (MPDI < 0.2), the MPDI-integrated SEBS model showed little impact on H. The implementation of the MPDI-integrated SEBS better depicts H rising under water stress conditions through an increase in z0h. As explained in Section 2.2., in areas under water stress, low soil moisture availability decreases the kB−1 value, thereby increasing the surface roughness of heat transport (z0h).

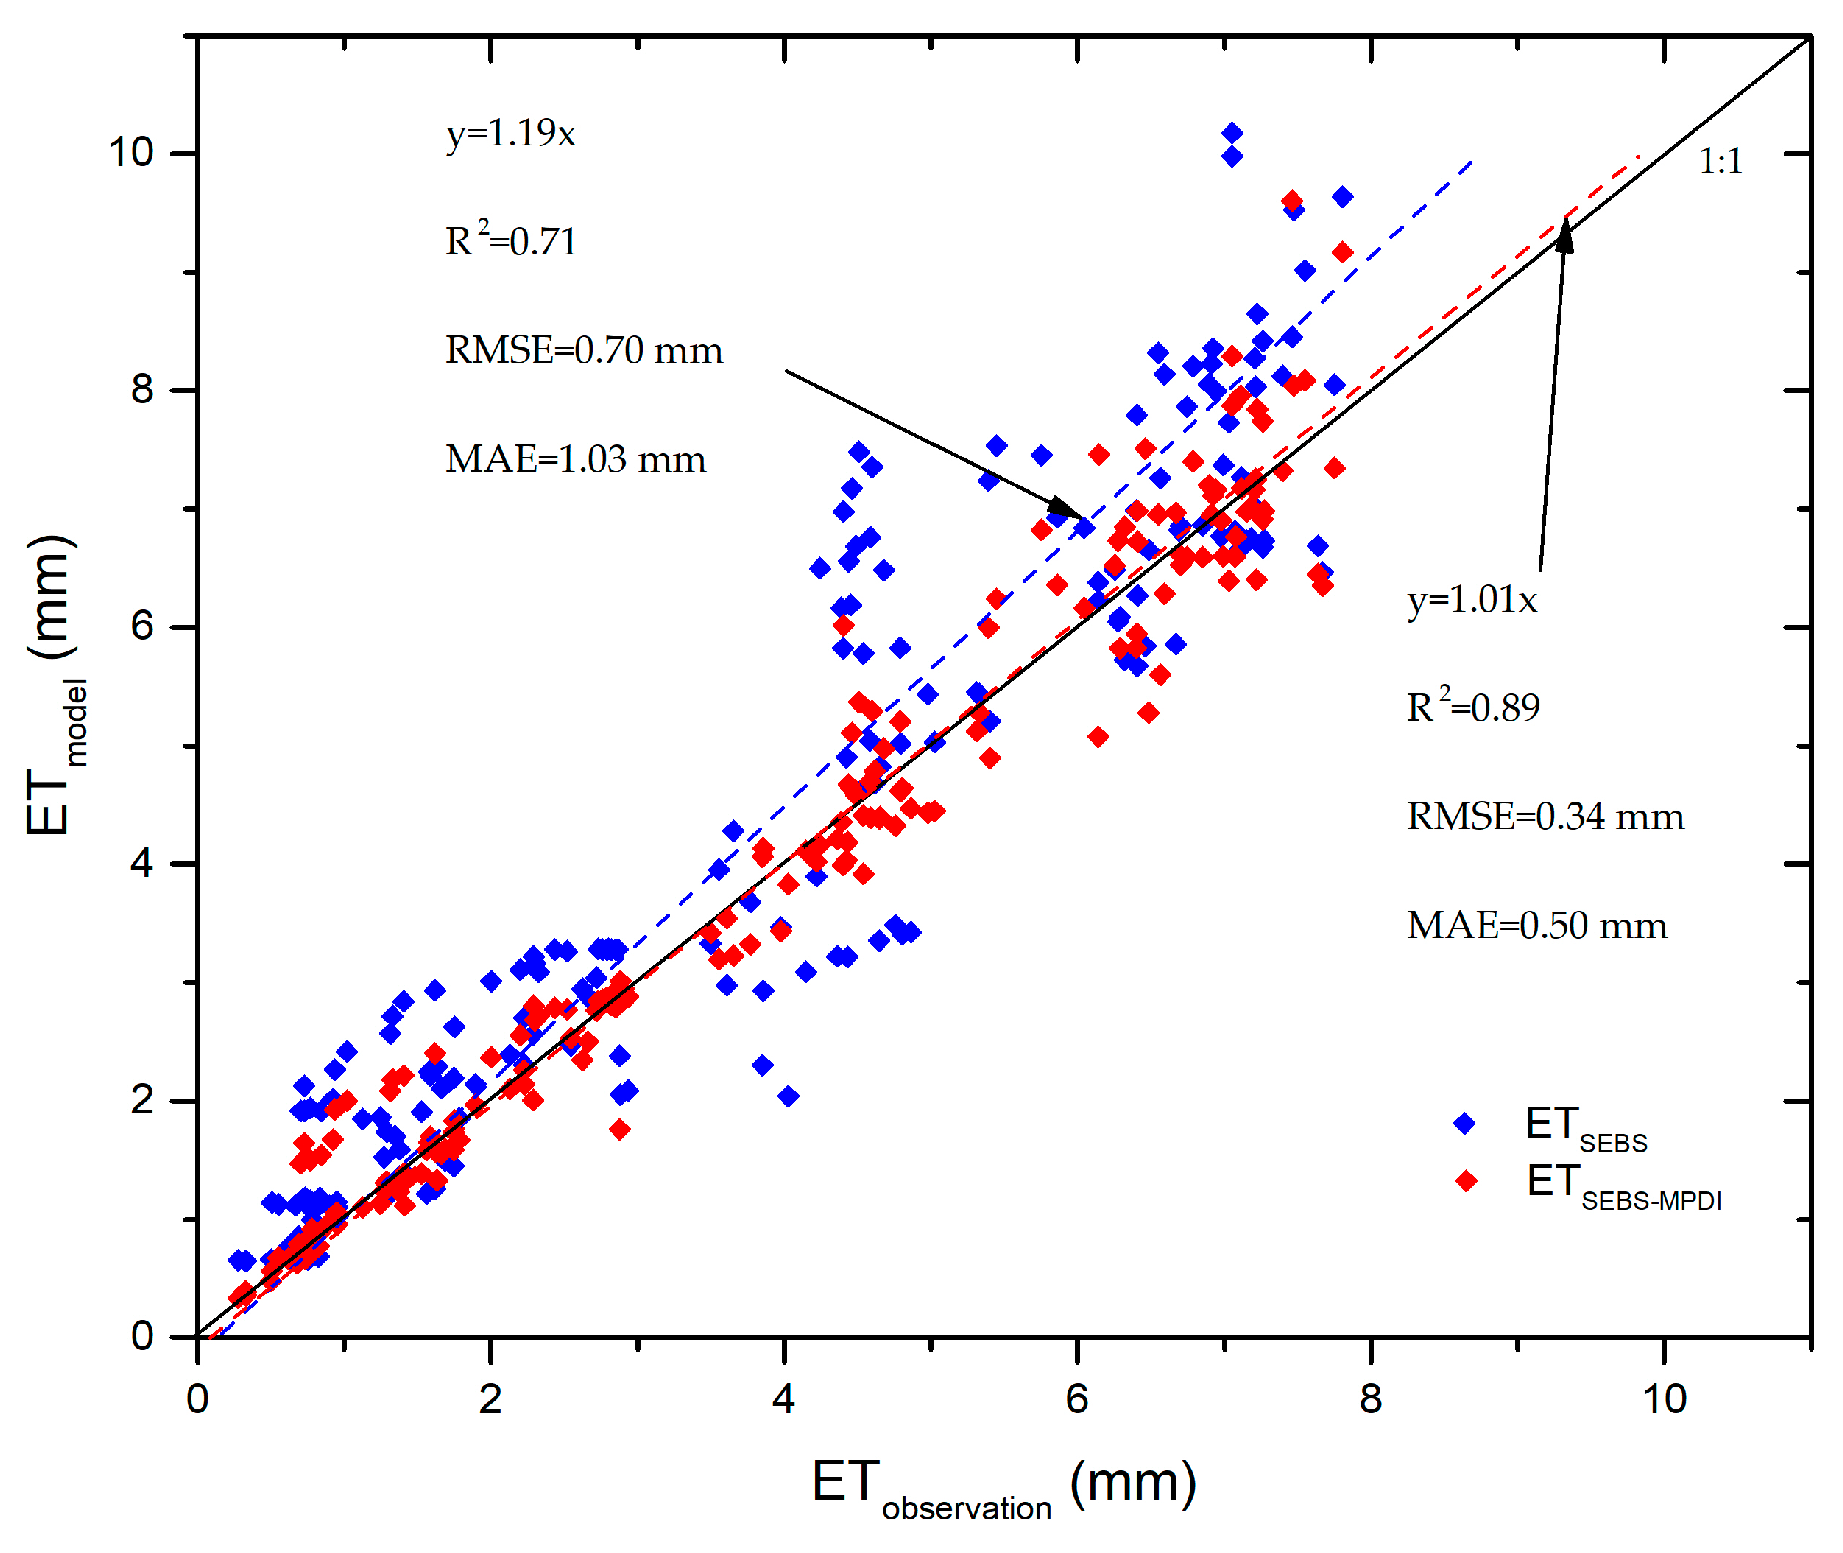
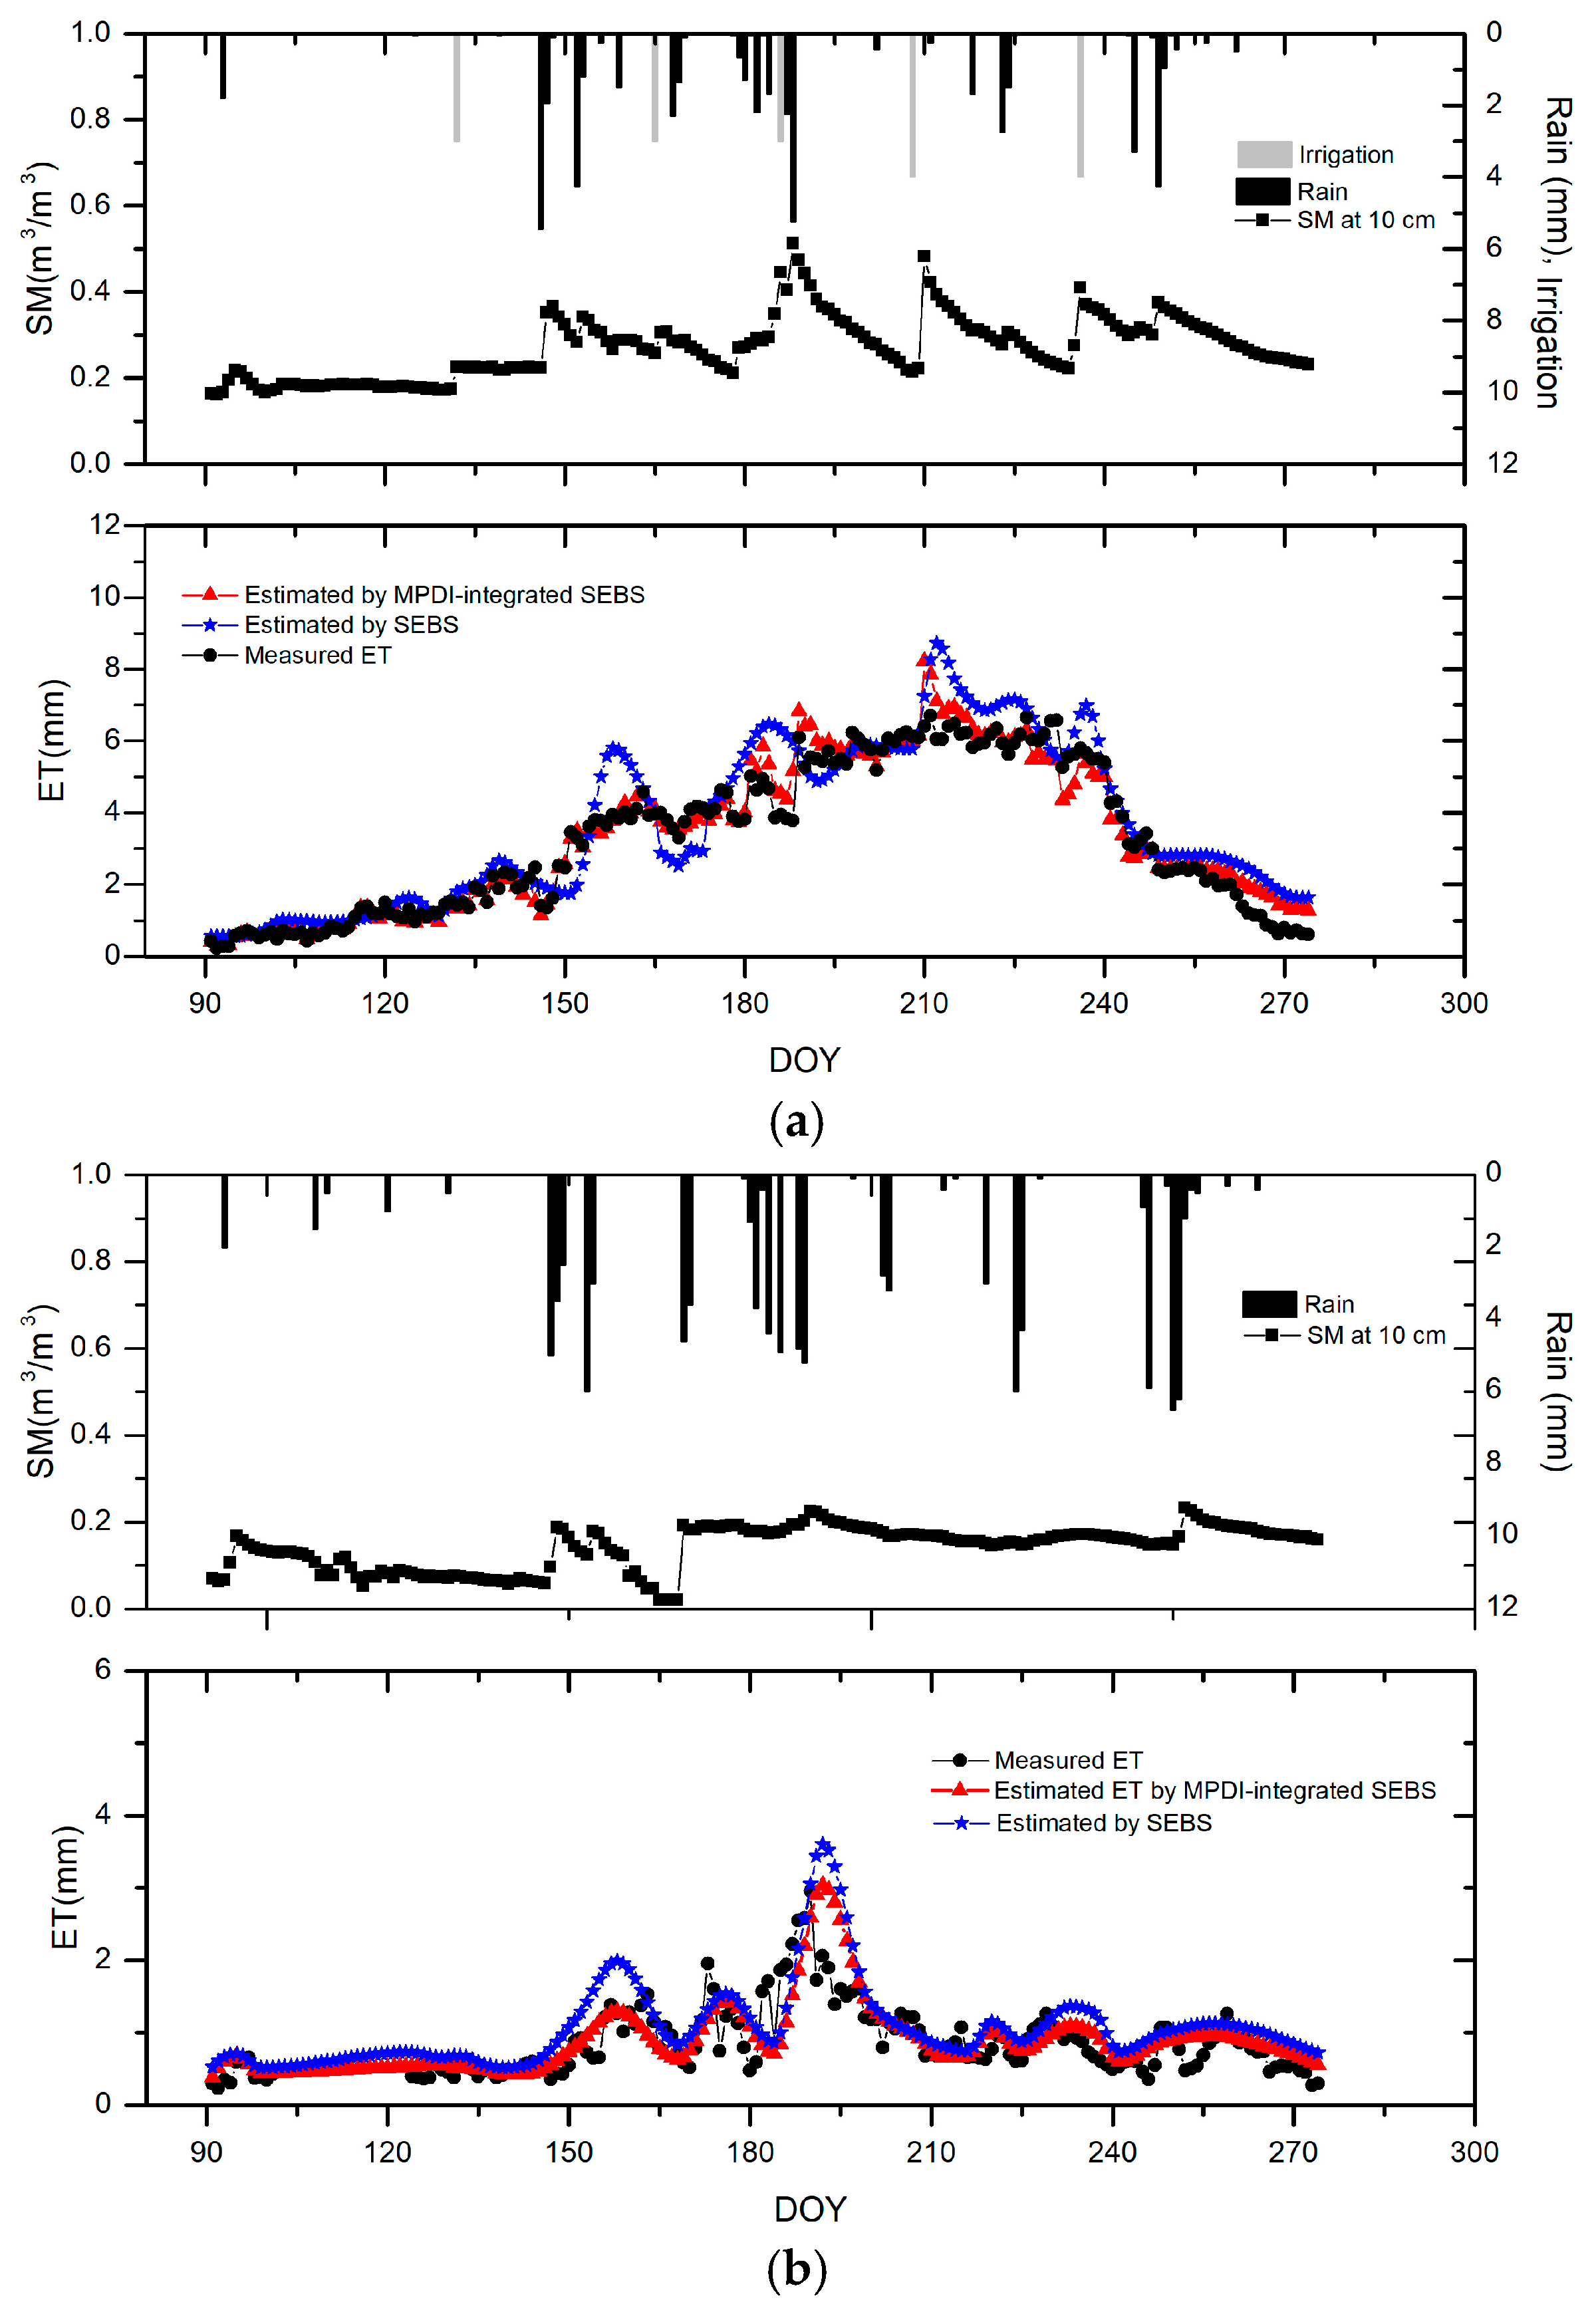
3.2. Assesing the Performance of Daily ET Estimated by MPDI-Integrated SEBS Using HJ-1 Data

The continuous daily ET (ETd) through the whole growing season estimated by the MPDI-integrated SEBS (ETSEBS-MPDI) and the original SEBS (ETSEBS) using HJ-1 data are compared with EC measurements in Figure 7. The results exhibit a clear overestimation in the ETd produced by the original SEBS, with scatter points above the 1:1 line, and the slope for the linear regressions was 1.19. A better agreement was obtained between measured ET and ETSEBS-MPDI, with scatter points around the 1:1 line, and the slope for the linear regressions was 1.01. Regarding results from the MPDI-integrated SEBS model, R2 was 0.89, which indicated a strong correlation between measured ET and ETSEBS-MPDI. MAE and lower RMSE demonstrated that the modified SEBS model made a good improvement in ETd estimation for the irrigated oasis. Corresponding to Section 3.1., the modeled ET clearly was improved when the MPDI was integrated into SEBS under low soil moisture condition (SM ≤ 0.30 m3/m3); the RMSE and MAE decreased by 0.93 mm and 0.70 mm, respectively (Table 5). When soil moisture was greater than 0.30 m3/m3, the RMSEs and MAEs between ET estimated by the SEBS and that estimated by the MPDI-integrated SEBS were close. This indicated that the MPDI-integrated SEBS model slightly improved the overestimation of the SEBS model when adequate soil moisture was available. In addition, we found that the simulated ET was always overestimated compared with EC measurements since September when the field was covered by maize residue (see Figure 8a). Similar overestimation results of ET due to crop residues have been reported by Odhiambo and Irmak (2012) [59].
Figure 9 shows the spatial distributions and frequencies of ETd generated by SEBS with and without the integration of MPDI on 3 July 2015 (DOY 185). Although it rained the day before, an obvious improvement of ETd estimates after integrating MPDI occurred. The difference of the spatial mean of ETd estimates from the original SEBS and the MPDI-integrated SEBS reached 0.8 mm d−1. The low ET values presented dry sandy land and wheat parcels while spring wheat had matured and soil moisture was low due to less irrigation. The ET for these parcels mostly declined to 1 mm. The high ET values presented at well-irrigated, densely planted maize plots and water surfaces, where the difference of ET values given by the original SEBS and the SM-integrated SEBS was very small. The pixel numbers of ET above 5.0 mm d−1 decreased from 2.8% to less than 1% for the study region.

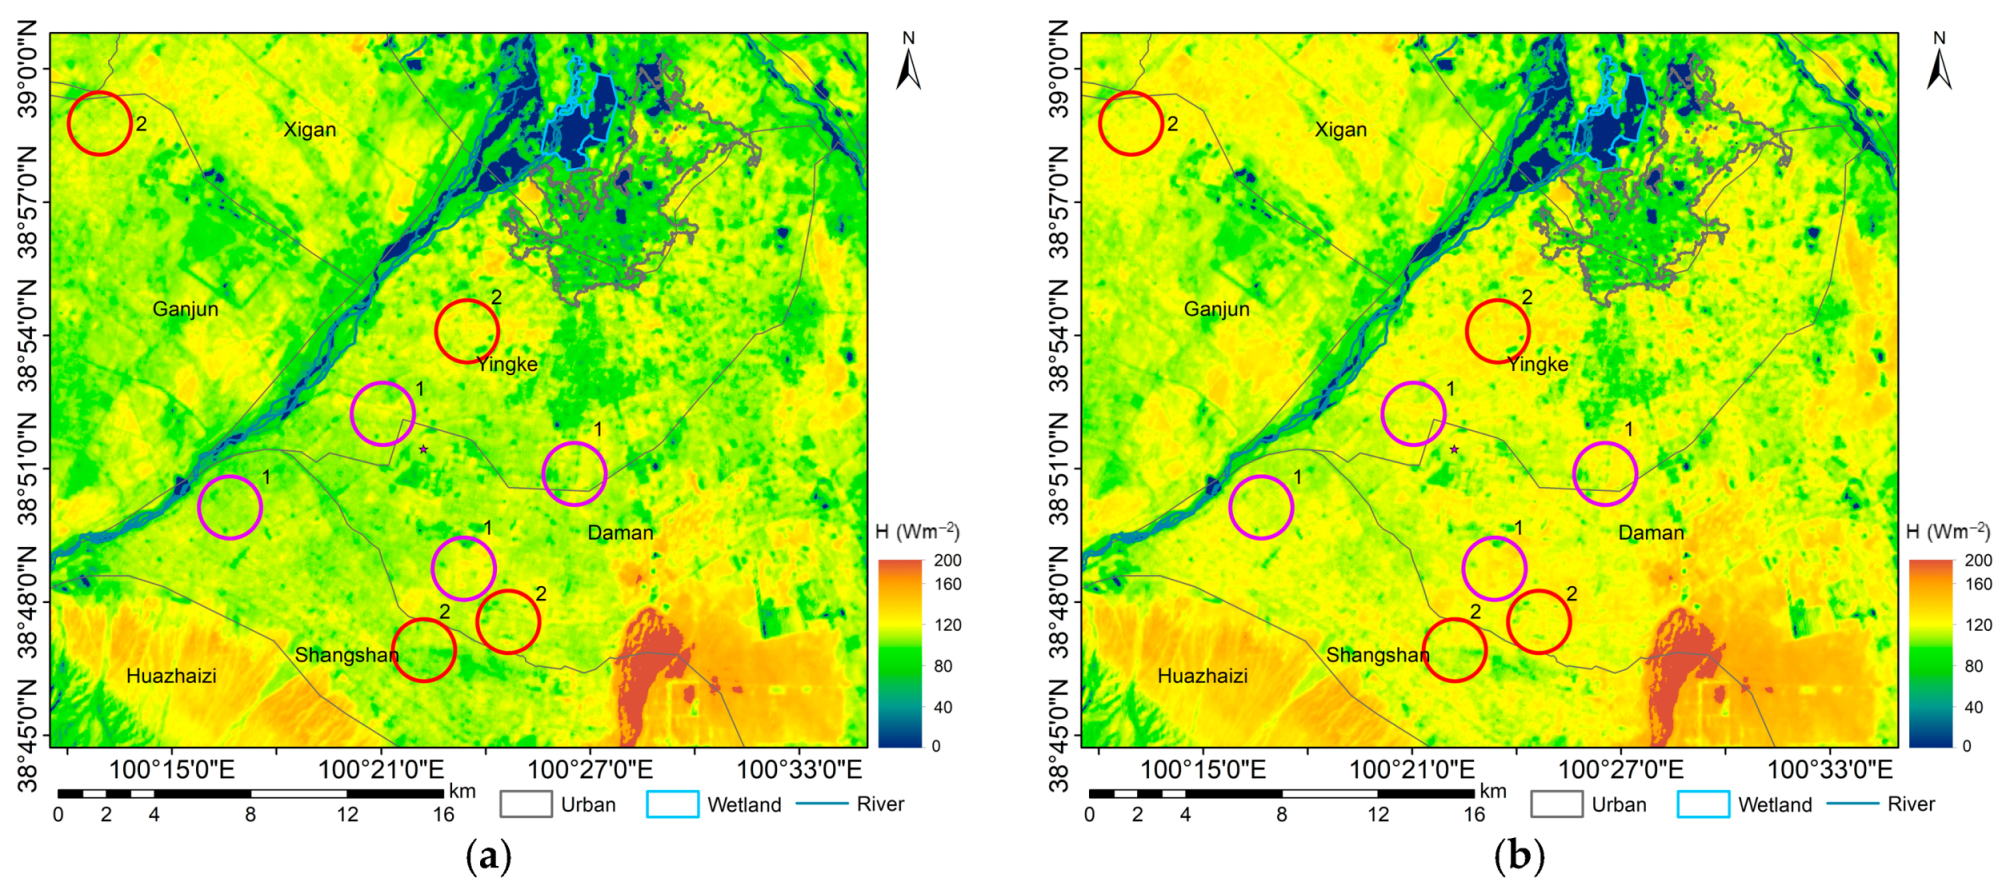
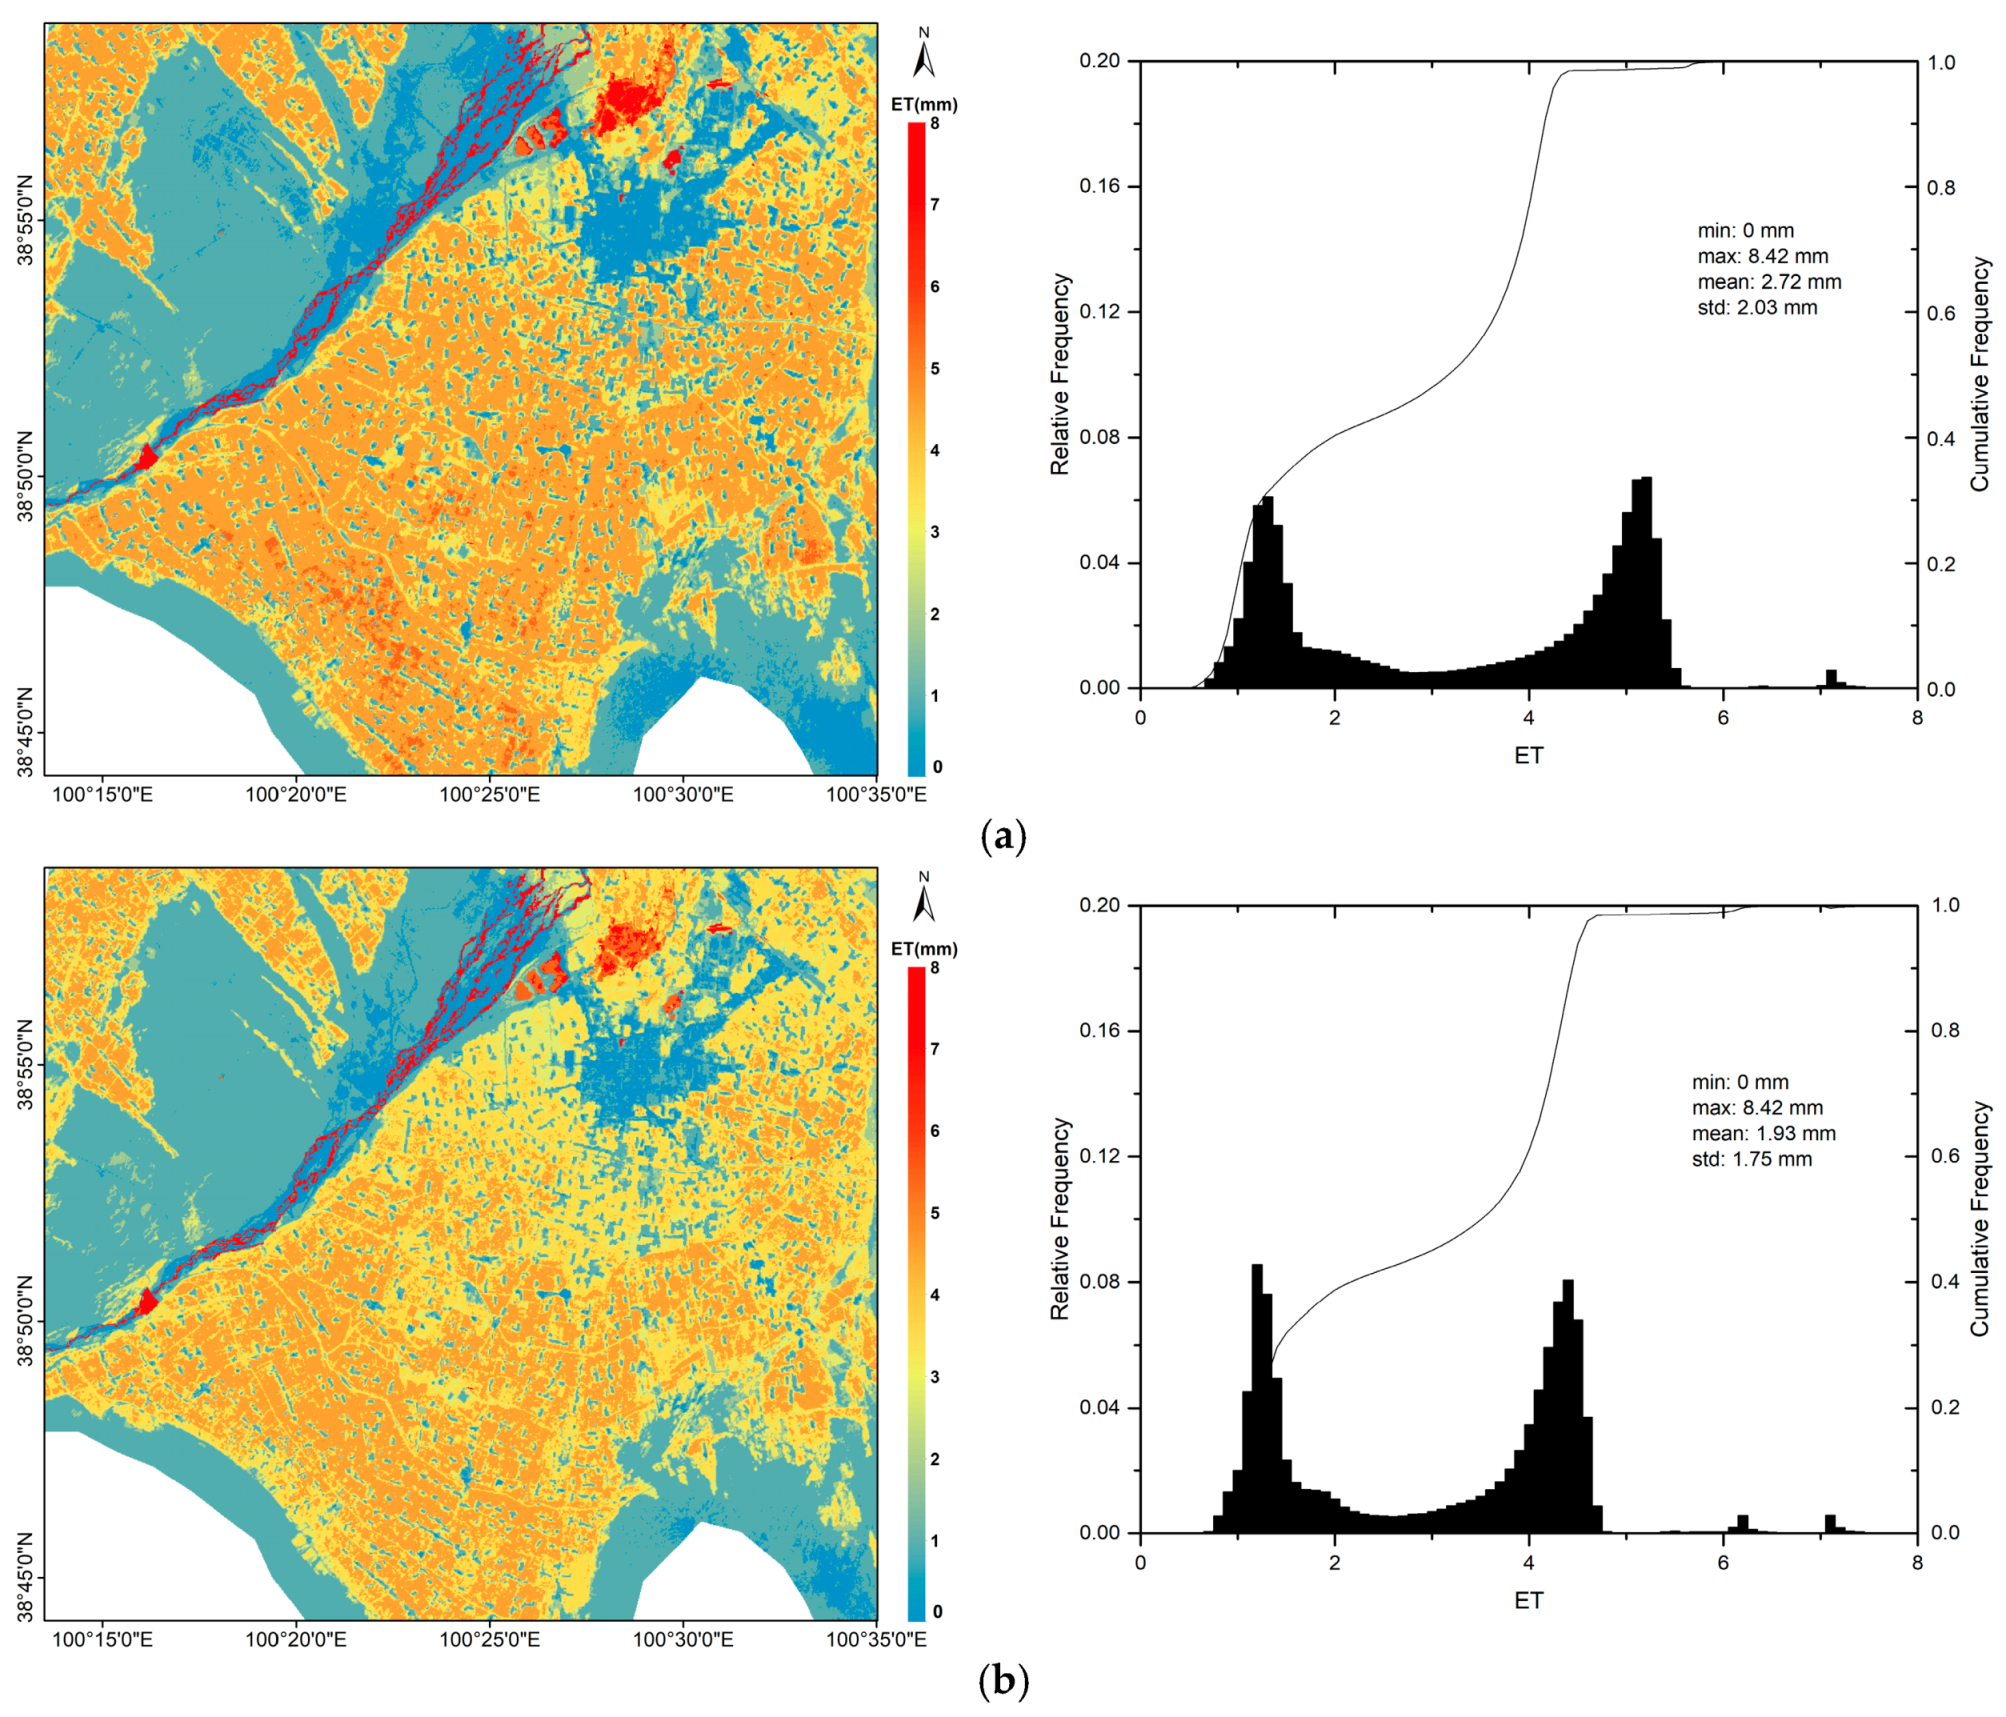
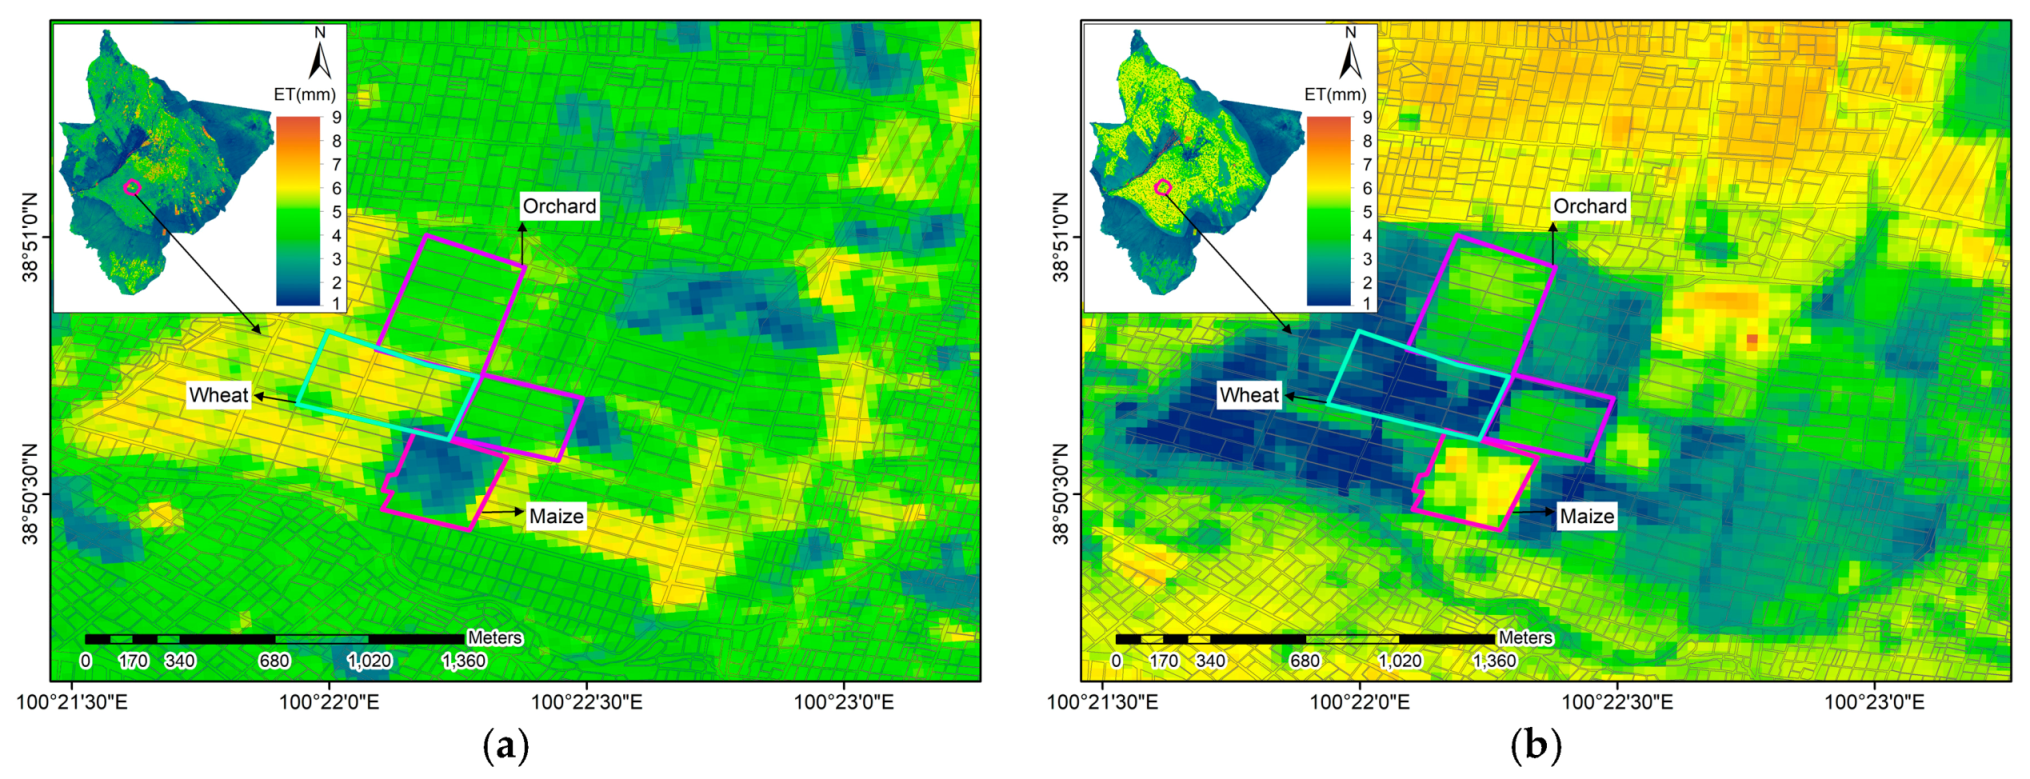
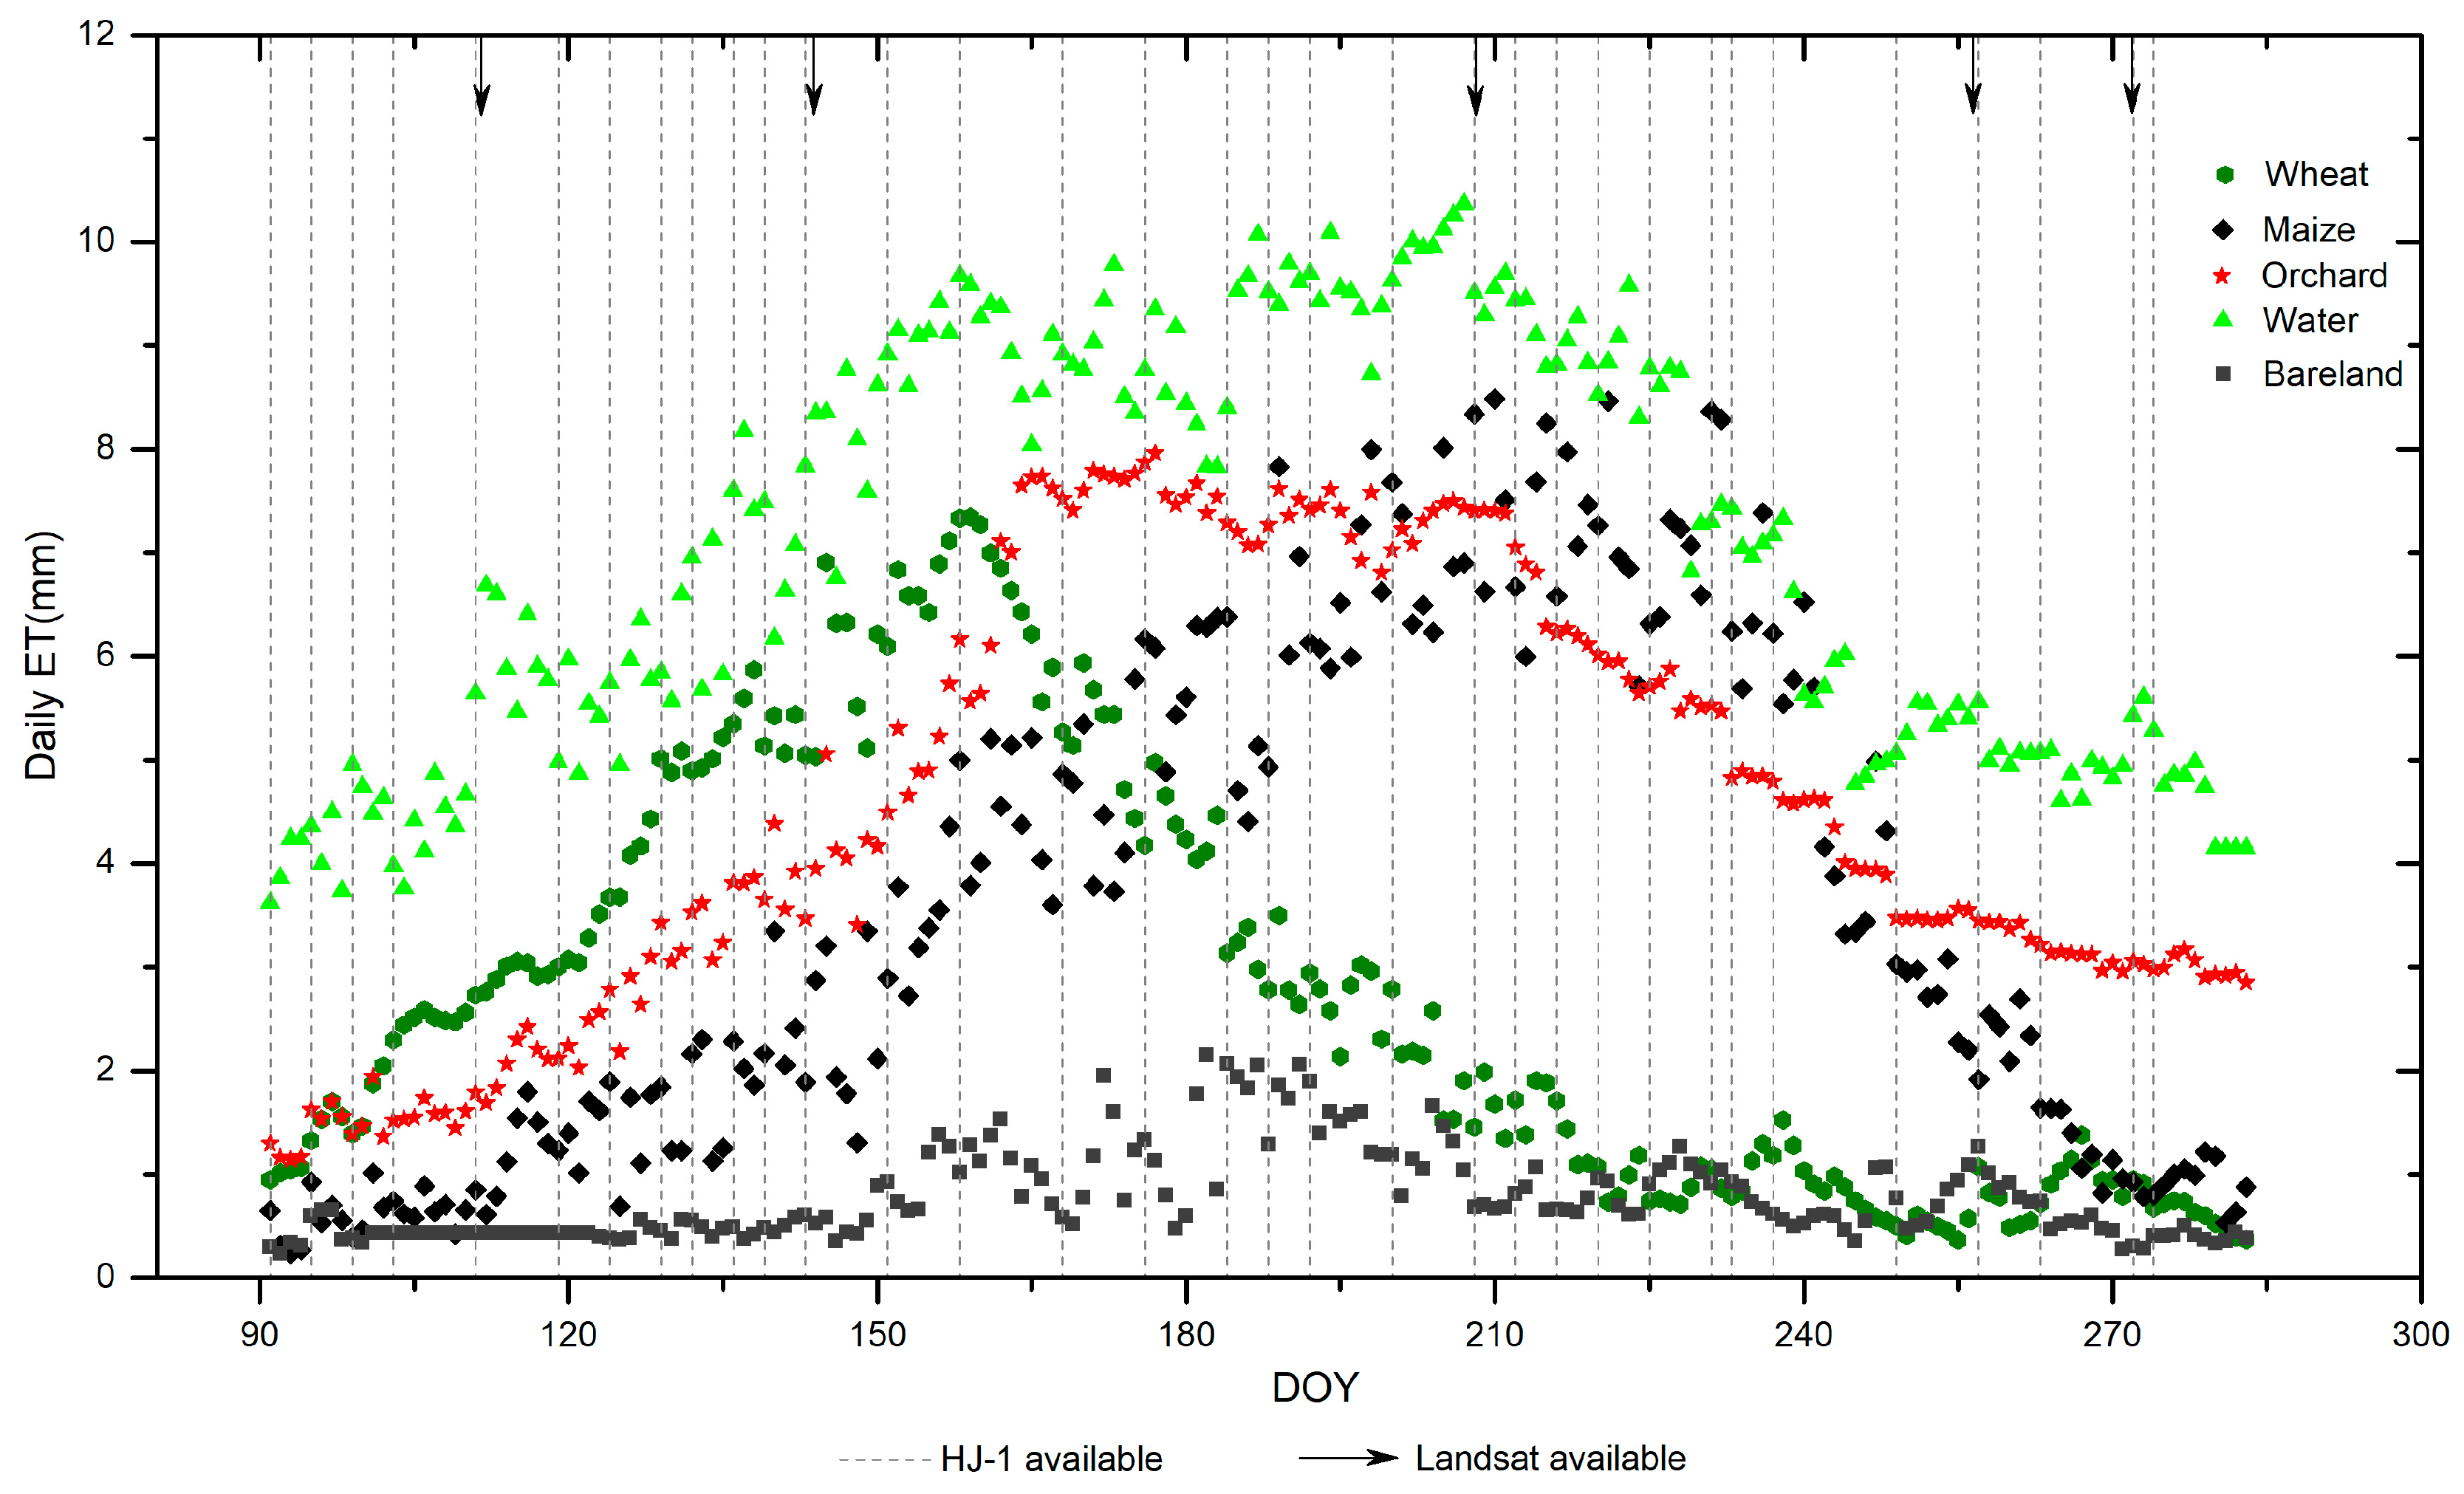
3.3. Spatial and Temporal Variability of Evapotranspiration at the Field Scale

Spatial distribution of daily ET at the field-scale is essential to understand the water consumption pattern over a whole field region to irrigate rationally. Figure 10a,b show the distribution of irrigated fields in Daman, where plants mainly include maize, winter wheat, and orchards. Water consumption via the ET of individual fields was captured by the MPDI-integrated model using HJ-1 images on 24 May and 3 July 2015 (DOY 144). To understand the variability of water consumption via ET for a specific crop, we overlaid the field boundaries of cropland provided by “Heihe Plan Science Data Center, National Natural Science Foundation of China” (http://www.heihedata.org). There was high variability of evapotranspiration over agricultural fields, which was strongly linked to the crop planting structure. Most of the pixels of high ET value (ET > 4 mm d−1) presented well-irrigated wheat parcels when winter wheat was in the heading stage, with LAI > 3 on 24 May 2015. The maize pixels maintained a low ET value of less than 2 mm, which was still in the tillering stage with LAI < 2. When it came to 3 July, the high ET values (ET > 5 mm d1) occurred at well-irrigated maize parcels in the heading stages with LAI > 4. Wheat harvesting in July caused the field’s ET to decline to less than 2 mm. Meanwhile, the orchard field maintained a relatively high daily ET through the growing season. Based on the high spatial variability of ET at the field scale, an individual farmer could use water consumption information for his/her field to understand the relationship between water application and yield for improved water management.
Irrigation management requires continuous daily ET, especially during growth seasons, so ET losses can be compensated for by applying the proper quantity of water at the right time to meet the plant water demands. Here, based on HJ-1 data, the complete daily time series of ET estimates were obtained by using the cubic spline interpolation method to fill in the gaps of daily ET during the 33 cloudless days [54]. The areal statistical means of daily ET for the main land-cover types in Ganzhou through the whole growing season in 2015 are presented in Figure 9. Obviously, the high temporal resolution of HJ-1 promised more satellite images to capture the dynamic changes of the daily ET. These dynamic traits of daily ET included the day-to-day fluctuations related to changes in meteorological forcing (i.e., solar radiation, air temperature, and humidity) and sporadic peaks due to the increase in soil evaporation fluxes after rainfall or irrigation events (i.e., such as the peak values on DOY 132, 158, 176, 184 188, 208, 235, see Figure 6b).
Moreover, the modeling of ET at such detailed temporal resolution allows the ability to capture long-term (weekly/monthly) trends, primarily dictated by plant growth (see Figure 11). The mean daily ET for different land-cover types showed similar seasonality with an increasing trend since the beginning of the growing season (late April) and a decreasing trend since September. Peak values of daily ET for most land-cover types appeared in July, while the winter wheat reached its highest ET value (7.2 mm d−1) in mid-June. The ET of wheat fields was obviously lower than that of the other vegetation types when the winter wheat was in its maturity period in summer. Among the vegetation classes, the ET values of maize fields were found to be always higher than those of the other land-cover types in June and July, when maize was in the jointing stage. Abundant water supply to the maize field from frequent flooding irrigation was the most general way to ensure the growth of seed maize under no-stress conditions for better seed production in Ganzhou. This apparently resulted in soil water content reaching its field capacity and, in turn, large daily ET. Other types of crops (maize, wheat, and soybean) were intercropped in the orchard field in different seasons. Frequent irrigation to these crops led to the orchard maintain a relatively high daily ET during the growing season.

4. Conclusions

To solve the problem of the overestimation of ET for vegetation in water stress conditions, this study proposed an approach to improve the accuracy of ET estimates through integrating MPDI as an indicator of soil moisture into the SEBS model through a modified definition of kB−1. The new approach was tested by comparing it with observations from the EC tower. The results indicated a clear improvement of H with 42.5 W m−2 for the case of sparse vegetation with low soil moisture. Regarding the agricultural crops with relatively high soil moisture, there was a moderate improvement with 22.5 W m−2. Accordingly, the MPDI-integrated SEBS approach significantly remedied the shortcoming of overestimating evapotranspiration under water-limited conditions. The daily ET map generated by the MPDI-integrated SEBS had a higher spatial variability compared to the original SEBS and was able to better distinguish between the irrigated fields and the neighboring dry areas in arid and semi-arid regions.
The authors carried out crop evapotranspiration estimation at the field scale in the Ganzhou irrigation districts in 2015 using the MPDI-integrated SEBS model and HJ-1 images. The results showed that the spatial resolution of HJ-1 provided valuable information regarding the spatial variability of ET within fields. Furthermore, the relatively short revisit period permitted the capture of the dynamic change of crop daily ET, especially of a few peak values after rainfall or irrigation events. Based on the day-by-day dynamics of ET, the temporal variation of crop ET changed with clear seasonality, which was closely related to the crops’ phenophase. The field to field and crop to crop variability in evapotranspiration provide substantial information about crop consumption via ET for agricultural water management in arid and semi-arid regions. The authors were able to successfully leverage the capacity of HJ-1 satellite images in a way that can provide both integrative and quantitative visual and analytical components for the study of water use and availability.
The MPDI-integrated SEBS model only requires HJ-1 data and meteorological data as inputs, providing an effective way to obtain high spatial resolution soil moisture information for the SEBS model under water-limited conditions, especially for sparsely vegetated surfaces. The scheme effectively resolves the overestimation of ET in areas with sparsely vegetated surfaces under water stress conditions. However, the estimation of ET in dense vegetation areas still need to be improved. On the one hand, there are uncertainties in the parameterization schemes of the land surface parameters and daily net radiation, which are usually related to the study region and the selected sensors. On the other hand, MPDI is not sensitive to soil moisture variation for dense vegetation. When the leaf area index is more than 5 (see Figure 5a), the function of MPDI in regulating kB¹ will be reduced as the canopy density increases. In fact, MPDI present a strong correlation with the normalized difference vegetation index (NDVI) related to canopy density [55]. Future study will consider the removal of this correlation in order to capture the vegetation stress.

Author Contributions

Z.Y., H.Z., and Y.J. conceived and designed research; Z.Y., Y.C., H.Y., and Z.H. performed the satellite data analysis; Z.Y. analyzed the results; Z.Y wrote the paper; and Z.Y., H.Z., and H.Y. contributed to analysis and discussion.

Funding

This research was funded by [National Key Research and Development Program of China-National Water Resources Stereo Monitoring System and Application of Remote Sensing Technology] grant number [2017YFC0405803]; [National Monthly Water Storage and Water Demand Dynamic Assessment and Prediction] grant number [WR0145B012017]; [National Intelligent Water Network Engineering Framework Design] grant number [WR0145B272016]; [Special Fund for the Commercialization of Research Findings from China Institute of Water Resources and Hydropower Research-Actual Irrigated Area Estimation Using Remote Sensing] grant number [WR1003A112016]

Acknowledgments

In this section you can acknowledge any support given which is not covered by the author contribution or funding sections. This may include administrative and technical support, or donations in kind (e.g., materials used for experiments).

Conflicts of Interest

The authors declare no conflict of interest.

References

  1. Katul, G.G.; Oren, R.; Manzoni, S.; Higgins, C.; Parlange, M.B. Evapotranspiration: A process driving mass transport and energy exchange in the soil-plant-atmosphere-climate system. Rev. Geophys. 2012, 50, RG3002. [Google Scholar] [CrossRef]
  2. Yang, Y.T. Evapotranspiration Over Heterogeneous Vegetated Surfaces; Springer Theses Recognizing Outstanding Ph.D. Research; Tsinghua University: Beijing, China, 2015. [Google Scholar]
  3. French, A.N.; Alferi, J.G.; Kustas, W.P.; Prueger, J.H.; Hipps, L.E.; Chávez, J.L.; Evett, S.R.; Howell, T.A.; Gowda, P.H.; Hunsaker, D.J.; et al. Estimation of surface energy fluxes using surface renewal and fluxes variance techniques over an advective irrigated agricultural site. Adv. Water Resour. 2012, 50, 91–105. [Google Scholar] [CrossRef]
  4. Bai, J.; Jia, L.; Liu, S.; Xu, Z.; Hu, G.; Zhu, M.; Song, L. Characterizing the footprint of eddy covariance system and large aperture scintillometer measurements to validate satellite-based surface fluxes. IEEE Geosci. Remote Sens. Lett. 2015, 12, 943–947. [Google Scholar] [CrossRef]
  5. Ershadi, A.; McCabe, M.F.; Evans, J.P.; Walker, J.P. Effects of spatial aggregation on the multi-scale estimation of evapotranspiration. Remote Sens. Environ. 2012, 131, 51–62. [Google Scholar] [CrossRef]
  6. Anderson, M.C.; Allen, R.G.; Morse, A.; Kustas, W. Use of Landsat thermal imagery in monitoring evapotranspiration and managing water resources. Remote Sens. Environ. 2012, 122, 50–65. [Google Scholar] [CrossRef]
  7. Glenn, E.P.; Nagler, P.L.; Huete, A.R. Vegetation index methods for estimating evapotranspiration by remote sensing. Surv. Geophys. 2010, 31, 531–555. [Google Scholar] [CrossRef]
  8. Nagler, P.L.; Morino, K.; Murray, R.S.; Osterberg, J.; Glenn, E.P. An empirical algorithm for estimating agricultural and riparian evapotranspiration using MODIS enhanced vegetation index and ground measurements of ET. I. Description of method. Remote Sens. 2009, 1273–1297. [Google Scholar] [CrossRef]
  9. Bastiaanssen, W.G.M.; Menenti, M.; Feddes, R.A.; Holtslag, A.A.M. A remote sensing surface energy balance algorithm for land (SEBAL)1. Formulation. J. Hydrol. 1998, 212–213, 198–212. [Google Scholar] [CrossRef]
  10. Su, Z. The Surface Energy Balance System (SEBS) for estimation of turbulent heat fluxes. Hydrol. Earth Syst. Sci. 2002, 6, 85–99. [Google Scholar] [CrossRef]
  11. Allen, R.G.; Tasumi, M.; Trezza, R. Satellite-based energy balance for mapping evapotranspiration with internalized calibration (METRIC)-model. J. Irrig. Drain. Eng. 2007, 133, 380–394. [Google Scholar] [CrossRef]
  12. Kustas, W.P.; Norman, J.M. A two-source approach for estimating turbulent fluxes using multiple angle thermal infrared observations. Water Resour. Res. 1997, 33, 1495–1508. [Google Scholar] [CrossRef]
  13. Zhuang, Q.F.; Wu, B.F. Estimating evapotranspiration from an improved two-source energy balance model using ASTER satellite Imagery. Water 2015, 7, 6673–6688. [Google Scholar] [CrossRef]
  14. Sánchez, J.M.; Kustas, W.P.; Caselles, V.; Anderson, M.C. Modelling surface energy fluxes over maize using a two-source patch model and radiometric soil and canopy temperature observations. Remote Sens. Environ. 2008, 112, 1130–1143. [Google Scholar] [CrossRef]
  15. Leuning, R.; Zhang, Y.Q.; Rajaud, A.; Cleugh, H.; Tu, K. A simple surface conductance model to estimate regional evaporation using MODIS leaf area index and the Penman-Monteith equation. Water Resour. Res. 2008, 44, 652–655. [Google Scholar] [CrossRef]
  16. Yao, Y.J.; Liang, S.L.; Li, X.L.; Chen, J.Q.; Wang, K.C.; Jia, K. A satellite-based hybrid algorithm to determine the Priestley-Taylor parameter for global terrestrial latent heat flux estimation across multiple biomes. Remote Sens. Environ. 2015, 165, 216–233. [Google Scholar] [CrossRef]
  17. Jang, K.C.; Kang, S.K.; Kim, J.C.; Lee, C.B.; Kim, T.H.; Kim, J.; Hirata, R.; Saigus, N. Mapping evapotranspiration using MODIS and MM5 Four-Dimensional Data Assimilation. Remote Sens. Environ. 2010, 114, 657–673. [Google Scholar] [CrossRef]
  18. Huang, C.L.; Chen, W.J.; Li, Y.; Shen, H.F.; Li, X. Assimilating multi-source data into land surface model to simultaneously improve estimations of soil moisture, soil temperature, and surface turbulent fluxes in irrigated fields. Agric. Forest Meteorol. 2016, 230–231, 142–156. [Google Scholar] [CrossRef]
  19. Gowda, P.H.; Chavez, J.L.; Colaizzi, P.D.; Evett, S.R.; Howell, T.A.; Howell, T.A. ET mapping for agricultural water management: Present status and challenges. Irrig. Sci. 2008, 26, 223–237. [Google Scholar] [CrossRef]
  20. Li, Z.L.; Tang, R.L.; Wan, Z.M.; Bi, Y.; Zhou, C.; Tang, B.; Yan, G.; Zhang, X. A review of current methodologies for regional evapotranspiration estimation from remotely sensed data. Sensors 2009, 9, 3801–3853. [Google Scholar] [CrossRef] [PubMed]
  21. Scavone, G.; Sánchez, J.M.; Telesca, V.; Caselles, V.; Copertino, V.A.; Pastore, V.; Valor, E. Pixel-oriented land use classification in energy balance modelling. Hydrol. Process. 2014, 28, 25–36. [Google Scholar] [CrossRef]
  22. Sánchez, J.M.; Scavone, G.; Caselles, V.; Valor, E.; Copertino, V.A.; Telesca, V. Monitoring daily evapotranspiration at a regional scale from Landsat-TM and ETM+ data: Application to the Basilicata region. J. Hydrol. 2008, 351, 58–70. [Google Scholar] [CrossRef]
  23. Anderson, M.C.; Kustas, W.P.; Norman, J.M.; Hain, C.R.; Mecikalski, J.R.; Schultz, L.; Gonzalez-Dugo, M.P.; Cammalleri, C.; d’Urso, G.; Pimstein, A.; et al. Mapping daily evapotranspiration at field to continental scales using geostationary and polar orbiting satellite imagery. Hydrol. Earth Syst. Sci. 2011, 15, 223–239. [Google Scholar] [CrossRef] [Green Version]
  24. Kwast, J.V.D.; Timmermans, W.; Gieske, A.; Su, Z.H.; Olioso, A.; Jia, L.; Elbers, J.; et al. Evaluation of the Surface Energy Balance System (SEBS) applied to ASTER imagery with flux-measurements at the SPARC 2004 site (Barrax, Spain). Hydrol. Earth Syst. Sci. Discuss. 2009, 6, 1165–1196. [Google Scholar] [CrossRef]
  25. Bai, L.L.; Cai, J.B.; Liu, Y.; Chen, H.; Zhang, B.Z.; Huang, L.X. Responses of field evapotranspiration to the changes of cropping pattern and groundwater depth in large irrigation district of Yellow River basin. Agric. Water Manag. 2017, 188, 1–11. [Google Scholar] [CrossRef]
  26. Elhag, M.; Psilovikos, A.; Manakos, I.; Perakis, K. Application of the SEBS water balance model in estimating daily evapotranspiration and evaporative fraction from remote sensing data over the Nile Delta. Water Resour. Manag. 2011, 25, 2731–2742. [Google Scholar] [CrossRef]
  27. Webster, E.; Ramp, D.; Kingsford, R.T. Incorporating an iterative energy restraint for the Surface Energy Balance System (SEBS). Remote Sens. Environ. 2017, 198, 267–285. [Google Scholar] [CrossRef]
  28. Tang, R.; Li, Z.L.; Jia, Y.; Li, C.; Sun, X.; Kustas, W.P.; Anderson, M.C. An intercomparison of three remote sensing-based energy balance models using large aperture scintillometer measurements over a wheat-corn production region. Remote Sens. Environ. 2011, 115, 3187–3202. [Google Scholar] [CrossRef]
  29. Ma, W.Q.; Ma, Y.M.; Ishikawa, H. Evaluation of the SEBS for upscaling the evapotranspiration based on in-situ observations over the Tibetan Plateau. Atmos. Res. 2014, 138, 91–97. [Google Scholar] [CrossRef]
  30. Lubczynski, M.W.; Maicek, W.; Gurwin, J. Integration of various data sources for transient groundwater modeling with spatio-temporally variable fluxes-Sardon study case, Spain. J. Hydrol. 2005, 306, 71–96. [Google Scholar] [CrossRef]
  31. Song, Y.; Wang, J.; Yang, K.; Ma, M.; Li, X.; Zhang, Z.; Wang, X. A revised surface resistance parameterisation for estimating latent heat flux from remotely sensed data. Int. J. Appl. Earth Obs. Geoinf. 2012, 17, 76–84. [Google Scholar] [CrossRef]
  32. Ma, Y.F.; Liu, S.M.; Zhang, F.; Zhou, J.; Jia, Z.Z.; Song, L.S. Estimations of regional surface energy fluxes over heterogeneous oasis-desert surfaces in the middle reaches of the Heihe River during HiWATER-MUSOEXE. IEEE Geosci. Remote Sens. Lett. 2015, 12, 671–675. [Google Scholar]
  33. Gokmen, M.; Vekerdy, Z.; Verhoef, A.; Verhoef, W.; Batelaan, O.; van der Tol, C. Integration of soil moisture in SEBS for improving evapotranspiration estimation under water stress conditions. Remote Sens. Environ. 2012, 121, 261–274. [Google Scholar] [CrossRef]
  34. Huang, C.L.; Gu, J.; Lu, L.; Li, X. Improving estimation of evapotranspiration under water-limited conditions based on SEBS and MODIS data in arid regions. Remote Sens. 2015, 7, 16795–16814. [Google Scholar] [CrossRef]
  35. Li, Y.; Zhou, J.; Wang, H.J.; Li, D.Z.; Jin, R.; Zhou, Y.Z.; Zhou, Q.G. Integrating soil moisture retrieved from L-band microwave radiation into an energy balance model to improve evapotranspiration estimation on the irrigated oases of arid regions in northwest China. Agric. Forest Meteorol. 2015, 214–215, 306–318. [Google Scholar] [CrossRef]
  36. Semmens, K.A.; Anderson, M.C.; Kustas, W.P.; Gao, F.; Alfieri, J.G.; Mckee, L.; Pruegre, J.H.; Hain, C.R.; Cammalleri, C.; Yang, Y.; et al. Monitoring daily evapotranspiration over two California vineyards using Landsat 8 in a multi-sensor data fusion approach. Remote Sens. Environ. 2016, 185, 155–170. [Google Scholar] [CrossRef]
  37. Hu, C.; Tang, P. Automatic algorithm for relative radiometric normalization of data obtained from Landsat TM and HJ-1A/B charge-coupled device sensors. J. Appl. Remote Sens. 2012, 6, 063509. [Google Scholar]
  38. Ouyang, X.Y.; Jia, L.; Pan, Y.Q.; Hu, G.C. Retrieval of land surface temperature over the Heihe River Basin using HJ-1B thermal infrared data. Remote Sens. 2015, 7, 300–318. [Google Scholar] [CrossRef]
  39. Zhang, R.H.; Sun, R.; Du, J.P.; Zhang, T.L.; Tang, Y.; Xu, H.W.; Yang, S.T.; Jiang, W.G. Estimations of net primary productivity and evapotranspiration based on HJ-1A/B data in Jinggangshan City, China. J. Mt. Sci. 2013, 10, 777–789. [Google Scholar] [CrossRef]
  40. Li, Z.S.; Hu, G.C.; Lu, J.; Zhang, J.X.; Chen, Q.T.; Wang, K. Estimation of Growing Season Daily ET in the Middle Stream and Downstream Areas of the Heihe River Basin Using HJ-1 Data. IEEE Geosci. Remote Sens. Lett. 2015, 12, 948–952. [Google Scholar] [CrossRef]
  41. Zhou, S.; Sun, Y.; He, H.; Huang, H. Research for agricultural drought monitoring of Shandong province based on HJ-1 satellite data. In Proceedings of the SPIE-The International Society for Optical Engineering, Guilin, China, 23 November 2011. [Google Scholar]
  42. Tan, M.H.; Zheng, L.Q. Different Irrigation Water Requirements of Seed Corn and Field Corn in the Heihe River Basin. Water 2017, 9, 606. [Google Scholar] [CrossRef]
  43. Wu, X.J.; Zhou, J.; Wang, H.J.; Li, Y.; Zhong, B. Evaluation of irrigation water use efficiency using remote sensing in the middle reach of the Heihe river, in the semi-arid Northwestern China. Hydrol. Process. 2014. [Google Scholar] [CrossRef]
  44. Li, X.; Liu, S.M.; Xiao, Q.; Ma, M.G.; Jin, R.; Che, T.; Wang, W.Z.; Hu, X.L.; Xu, Z.W.; Wen, J.G.; et al. A multiscale dataset for understanding complex eco-hydrological processes in a heterogeneous oasis system. Sci. Data 2017, 4, 17008. [Google Scholar] [CrossRef] [PubMed]
  45. Xu, Z.W.; Ma, Y.F.; Liu, S.M.; Shi, W.J.; Wang, J.M. Assessment of the Energy balance closure under advective conditions and its impact using remote sensing data. J. Appl. Meteorol. Climatol. 2017, 56, 127–140. [Google Scholar] [CrossRef]
  46. Liu, S.M.; Xu, Z.W.; Wang, W.Z.; Jia, Z.Z.; Zhu, M.J.; Bai, J.W.; Wang, J.M. A comparison of eddy-covariance and large aperture scintillometer measurements with respect to the energy balance closure problem. Hydrol. Earth Syst. Sci. 2011, 15, 1291–1306. [Google Scholar] [CrossRef]
  47. Zhong, B.; Yang, A.X.; Nie, A.H.; Yao, Y.J.; Zhang, H.; Wu, S.L.; Liu, Q.H. Finer Resolution Land-Cover Mapping Using Multiple Classifiers and Multisource Remotely Sensed Data in the Heihe River Basin. IEEE J. Sel. Top. Appl. Earth Obs. Remote Sens. 2015, 99, 1–20. [Google Scholar] [CrossRef]
  48. Hao, J.; Li, J.; Liu, Q.H.; Fan, W.J.; Zhong, B.F.; Wu, S.L.; Yang, L.; Zeng, Y.L.; Xu, B.D.; Yin, G.F. Leaf Area Index Retrieval Combining HJ1/CCD and Landsat8/OLI Data in the Heihe River Basin, China. Remote Sens. 2015, 7, 6862–6885. [Google Scholar]
  49. Su, Z.; Schmugge, T.; Kustas, W.P.; Massman, W.J. An evaluation of two models for estimation of the roughness height for heat transfer between the land surface and the atmosphere. J. Appl. Meteorol. 2001, 40, 1933–1951. [Google Scholar] [CrossRef]
  50. Monteith, J.L. Evaporation and environment. Symp. Soc. Exp. Biol. 1965, 19, 205–234. [Google Scholar] [PubMed]
  51. Thom, A.S. Momentum, mass and heat-exchange of vegetation. Q. J. Royal Meteorol. Soc. 1972, 98, 124–134. [Google Scholar] [CrossRef]
  52. Verhoef, A.; DeBruin, H.A.R.; Hurk, B.V.D. Some practical notes on the parameter kB−1 for sparse vegetation. J. Appl. Meteorol. 1997, 36, 560–572. [Google Scholar] [CrossRef]
  53. Seneviratne, S.I.; Corti, T.; Davin, E.L.; Hirschi, M.; Jaeger, E.B.; Lehner, I.; Orlowsky, B.; Teuling, A. Investigating soil moisture–climate interactions in a changing climate: A review. Earth-Sci. Rev. 2010, 99, 125–161. [Google Scholar] [CrossRef]
  54. Ghulam, A.; Qin, Q.M.; Teyip, T.; Li, Z.L. Modified perpendicular drought index (MPDI): A real-time drought monitoring method. ISPRS J. Photogramm. Remote Sens. 2007, 62, 150–164. [Google Scholar] [CrossRef]
  55. Zhang, J.H.; Zhou, Z.M.; Yao, F.M.; Yang, L.M.; Hao, C. Validating the modified perpendicular drought index in the North China region using in situ soil moisture measurement. IEEE Geosci. Remote Sens. Lett. 2015, 12, 542–546. [Google Scholar] [CrossRef]
  56. Rungsipanich, A.; Chansury, W. Application of perpendicular drought index in the drought assessment in northeast region of Thailand using MODIS data. In Proceedings of the Asian Conference on Remote Sensing, Colombo, Sri Lanka, 10–14 November 2008; Available online: http://www.a-a-rs.org/acrs/proceeding/ACRS2008/Papers/TS%2030.2.pdf (accessed on 1 September 2008).
  57. Shahabfar, A.; Ghulam, A.; Eitzinger, J. Drought monitoring in Iran using the perpendicular drought indices. Int. J. Appl. Earth Obs. Geoinform. 2012, 18, 119–127. [Google Scholar] [CrossRef]
  58. Niinemets, U.; Sober, A.; Kull, O.; Hartung, W.; Tenhunen, J.D. Apparent controls on leaf conductance by soil water availability and via light-acclimation of foliage structural and physiological properties in a mixed deciduous, temperate forest. Int. J. Plant Sci. 1999, 160, 707–721. [Google Scholar] [CrossRef]
  59. Odhiambo, L.O.; Irmak, S. Evaluation of the impact of surface residue cover on single and dual crop coefficient for estimating soybean actual evapotranspiration. Agric. Water Manag. 2012, 104, 221–234. [Google Scholar] [CrossRef]
Figure 1. Location of study area.
Water 10 00640 g001
Figure 2. The flowchart of the modified perpendicular drought index (MPDI)-integrated surface energy balance system (SEBS) model.
Water 10 00640 g002
Figure 3. The scaling effect of MPDI to the kB−1 parameter in SEBS.
Water 10 00640 g003
Figure 4. Comparison of HEC with HSEBS (a) and HSEBS-MPDI (b).
Water 10 00640 g004
Figure 5. Comparison of time series of HEC with HSEBS and HSEBS-MDPI together with soil moisture and LAI at Daman station (a) and Huazhaizi station (b).
Water 10 00640 g005aWater 10 00640 g005b
Figure 6. H obtained from the original SEBS (a); H obtained from the MPDI-integrated SEBS (b); MPDI (c); and LAI distribution (d) on 4 May, 2015. Purple circles (“1”) were samples with low LAI and high MPDI; red circles (“2”) were samples with high LAI and high MPDI.
Water 10 00640 g006aWater 10 00640 g006b
Figure 7. Comparison of ETd observations with the values obtained from the original SEBS and the MPDI-integrated SEBS.
Water 10 00640 g007
Figure 8. Comparison of the time series of daily ET measured by the eddy covariance (EC) system and estimated by SEBS with and without the integration of MPDI over the growth period in 2015 at Daman station (a) and Huazhaizi station (b).
Water 10 00640 g008
Figure 9. Spatial distribution and frequency distribution of ETd using the SEBS model (a) and the MPDI-integrated SEBS model (b) on 4 July 2015.
Water 10 00640 g009
Figure 10. Magnified view of the spatial distribution of daily ET on the day of satellite overpass—24 May 2015 (a) and 3 July 2015 (b) within a selected part of the Daman irrigation district. Field boundaries were overlaid to compare inter- and intra-field variability in ET.
Water 10 00640 g010
Figure 11. Variation of daily ET over different land-cover types in the Ganzhou irrigation districts during the growing season of 2015.
Water 10 00640 g011
Table 1. Specific information for each site.
Land UseSiteLocationInstrument
MaizeDaman100°22′20″ E, 38°51′20″ NAWS, EC
Steppe desertHuazhaizi100°19′12″ E, 38°45′57″ NAWS, EC
DesertGebi100°19′12″ E, 38°45′57″ NAWS
DesertShenshawo100°19′12″ E, 38°45′57″ NAWS
WetlandZhangye100°19′12″ E, 38°45′57″ NAWS
Table 2. HJ-1A/B charge coupled device (CCD) and HJ1-B infrared scanner (IRS) sensor parameters. HJ-1A and HJ-1B (HJ-1A/B) are the two satellites in HJ-1, respectively.
SensorBandSpectral Resolution
(μm)
Spatial Resolution
(m)
SensorBandSpectral Resolution
(μm)
Spatial Resolution
(m)
HJ-1A/B CCD10.43–0.5230HJ-1B IRS50.75–1.10150
20.52–0.6061.55–1.75
30.63–0.6973.5–3.9
40.76–0.9810.5–12.5300
Table 3. Satellite images for this study.
SatelliteTotal NumberDay of Year (DOY)
HJ-1B CCD/IRS3391, 95, 99, 103, 111, 119, 124, 129, 132, 136, 139, 143, 151, 158, 168, 176, 184,188, 192, 200, 208, 212, 216, 220, 225, 233, 237, 241, 249, 257, 263, 272, 274
HJ-1A CCD18105, 117, 121, 134, 138, 149, 190, 202, 206, 211, 215, 223, 235, 255, 256, 260, 275, 276
Table 4. Error evaluations of the estimated H from the original SEBS and the MPDI-integrated SEBS at Daman and Huazhaizi stations.
H Estimation Under Different Soil Moisture (SM) ConditionsSensible Heat Flux (H)
Root Mean Square Error (RMSE) (W/m2)Mean Absolute Error (MAE) (W/m2)
SM (m3/m3)SM ≤ 0.30SM > 0.30SM ≤ 0.35SM > 0.30
SEBS59.7835.9458.1726.01
MPDI-integrated SEBS15.2826.537.0619.73
Table 5. Error evaluations of the estimated ET from the original SEBS and the MPDI-integrated SEBS at Daman and Huazhaizi stations.
ET Estimation Under Different Soil Moisture (SM) ConditionsEvapotranspiration (ET)
Root Mean Square Error (RMSE) (mm)Mean Absolute Error (MAE) (mm)
SM (m3/m3)SM ≤ 0.30SM > 0.30SM ≤ 0.30SM > 0.30
SEBS1.250.661.050.98
MPDI-integrated SEBS0.320.570.350.64

