Occurrences and Ecotoxicological Risk Assessment of Heavy Metals in Surface Sediments from Awash River Basin, Ethiopia
by

Niguse Bekele Dirbaba
1,2, 
Xue Yan
2,3,
Hongjuan Wu
1,*,
Luanettee’ Lydia Colebrooke
1 and
Jun Wang
2,3,* 1
School of Environmental and Science and Engineering, Huazhong University of Science and Technology, Luoyu Road 1037, Wuhan 430074, China
2
Key Laboratory of Aquatic Botany and Watershed Ecology, Wuhan Botanical Garden, Chinese Academy of Sciences, Wuhan 430074, China
3
Sino-Africa Joint Research Center, Chinese Academy of Sciences, Wuhan 430074, China
*
Authors to whom correspondence should be addressed.
Water 2018, 10(5), 535; https://doi.org/10.3390/w10050535
Submission received: 27 March 2018
/
Revised: 12 April 2018
/
Accepted: 16 April 2018
/
Published: 24 April 2018
(This article belongs to the Special Issue Freshwater Quality as a Driver of Aquatic Ecosystem Health)
Abstract
:Like many areas in developing nations, rapid population growth, a high urbanization rate, and poor waste management practices have been observed in the Awash River Basin. Moreover, no comprehensive study has been conducted in this basin to evaluate sediment contamination with heavy metals. About 46 sampling locations were considered to study heavy metal concentrations, distributions, pollution levels, and potential ecological risks associated with these contaminants. The results indicate that average concentrations of all metals have exceeded their respective background values except Pb and Hg. A comparison with similar studies also revealed that sediments from the Awash River Basin had a high average value for Cd. The mean enrichment values of heavy metals increased in the order of Hg < As < Pb < Ni < Cu < Cr < Zn < Cd. Multivariate analysis revealed that Ni and Cu had common sources. The average potential ecological risk index (ERI = 355.54) indicates high potential toxicity response in the study area. In general, surficial sediment contamination with heavy metals is causing high ecological hazards in Awash River Basin. This study sheds lights on the current level of contamination of heavy metals which are widely distributed across the sediments of rivers and streams of Awash River Basin.
1. Introduction
In the river ecosystem, heavy metals mainly originate from chemical leaching of bed rocks; runoff from river banks; and waste discharged from several sources such as industries, agriculture, and domestic [1,2]. Even though the heavy metals naturally exist in the environment, they are primarily discharged into water bodies through anthropogenic activities [3]. Once heavy metals are introduced into the water bodies, sediments are their major sink [4]. Due to the dynamics in the natural environment, metallic pollutants can be freed from the sediments and cause secondary pollution in the water ecosystem [5]. Hence, river sediments can be considered as potential secondary sources of pollution in a water ecosystem [6].
Heavy metals are attracting special attention because of their persistence, biogeochemical recycling, and the associated ecological risks [7]. Heavy metals in water ecosystems can be deposited in sediments, gradually dissolved and absorbed by aquatic organisms, and biomagnified in the food chain, resulting in sublethal effects to aquatic inhabitants such as fish [8]. Thus, metallic pollutants can cause hazardous effects to aquatic organisms or human beings in direct or indirect ways. Increasing heavy metal pollution due to rapid developments in industries and agricultural sectors is causing significant ecological threats to aquatic organisms and humans [9].
In 1994, a report indicated that the majority of African water bodies were less affected by human-induced heavy metal [10]. However, rapid population growth, expansion in urban areas, poor waste management practices, and metal mining have become and continued to be the major causes of water quality deterioration with heavy metals [11]. Recently, water bodies of East African countries have been exposed to pollution with heavy metals mainly due to the use of leaded gasoline and improper waste disposal [12]. Even though there are extensive reports about sediments and water pollution with heavy metals in numerous parts of the world [2,4,13,14,15,16], there is no comprehensive information from many African countries [17]. Although there are a few reports on sediment pollution with heavy metals in and around Addis Ababa [18,19], no detailed and systemic study has been conducted to describe the sediment pollution in the Awash River Basin. Therefore, successive monitoring programs are very important to provide representative and reliable estimates across time and space. The current study was initiated to (1) assess the distributions and concentrations of selected heavy metals in the surface sediments of rivers and streams of the Awash River Basin, (2) investigate if sediment pollution with heavy metals is a major threat to the water quality of the basin, and (3) identify the main factors affecting sediment pollution with heavy metals by using cluster analysis (CA).
2. Material and Methods
2.1. Study Area
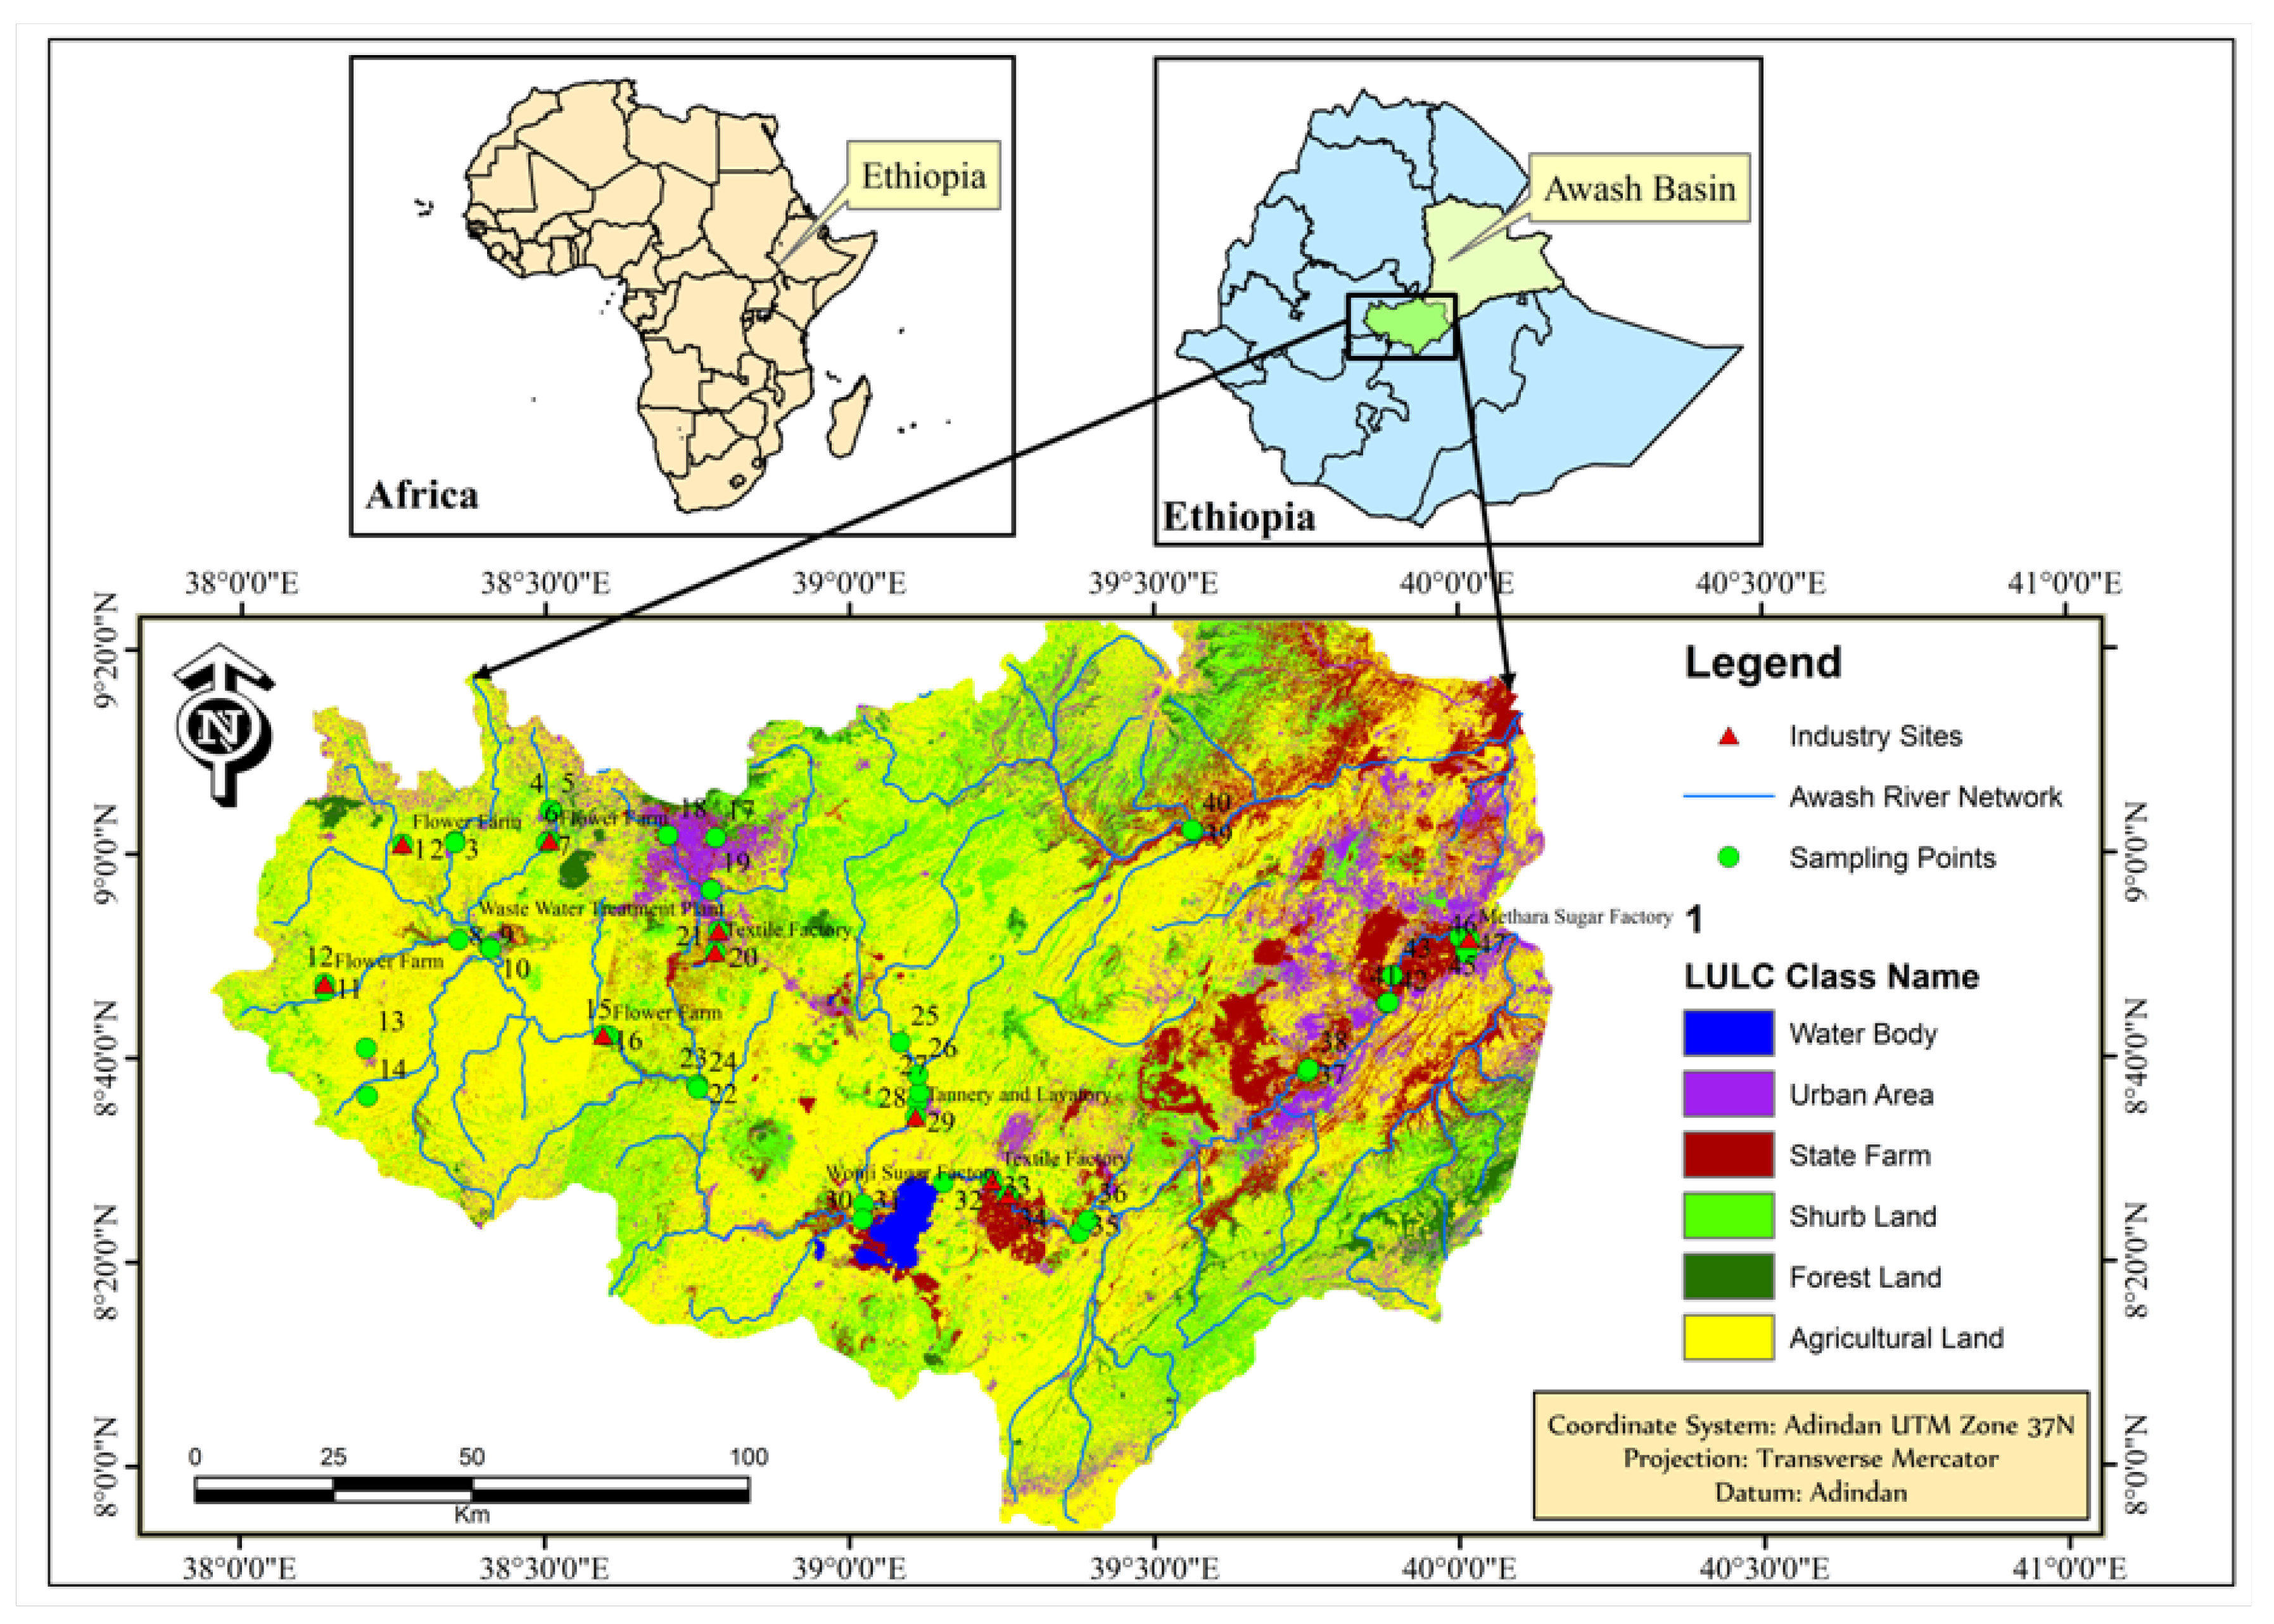
Awash River Basin was named after Awash River, which originates from central Ethiopia and flows to Lake Abbe at the Ethio–Djibouti border. The basin has 110,000 km2 catchment areas and 1200 km total length across the main course of Awash River [20]. The altitude ranges from 3000 m in the west to 250 m in the east. Even though there are such wide altitudinal variations in the basin, the majority of the drainage areas are flat. The economic activities in the basin include pastoral and agro-pastoral systems in the lower reach while mixed farming systems and urban livelihoods dominate in the middle and upper parts of the basin. Sampling locations varied from the lowest point (09°00′13.5″ N, 038°15′53.5″ E) on the main course of Awash River up to the highest point (08°50′17″ N, 040°00′49.9″ E) on the Kela Stream within the altitudinal range of 933.5 m to 2391 m. Figure 1 demonstrates a map of the study area and specific sampling sites.
2.2. Sample Collection
The sampling sites comprised from areas with low pollutant load up to areas which receive high quantities of pollutants from the point sources. For this purpose, sampling spots were identified in the rivers and streams across urban, peri-urban, and rural (mixed small-scale farmlands, large-scale farmlands, and grasslands) areas. Out of the existing river networks of the basin, the main course of Awash River, 4 major tributaries, 12 streams, and Koka dam were considered for sample collection. The first 10 cm depth of surficial sediments was sampled from the two peripherals and the middle part of the river beds using stainless steel corers. The overall sampling process included 46 sampling sites and 138 sediment samples (three replicates from each sampling site). The details of sampling sites are indicated in Figure 1.
The collected samples were reserved in plastic containers and transported to the laboratory. The samples were kept open under room temperature air until they dried to a constant weight, were ground using a pestle and mortar, and were sieved through a 12 mm nylon mesh sieve to separate out the gravels. After the removal of course materials, samples were further ground and homogenized to a fine powder. Fine samples were sieved by passing through 0.3 mm nylon mesh sieve and preserved at 4 °C until the laboratory analyses were conducted.
2.3. Sample Analysis
Samples were analyzed in Wuhan Botanical Garden, Chinese Academy of Sciences. Each sample was weighed (0.1–0.15 g), transferred to Teflon vessels, and digested by an acid mixture (4 mL, 65% HNO3 and 2 mL HF). A microwave digester (Milestone ETHOS ONE, Leutkirch im Allgau, Germany) was used for the sample digestion process. The procedures for sample extraction by microwave digester were described previously [21]. Operation pressure, temperature, and output power were adjusted to 300 psi, 165 °C, and 900 W, respectively, and kept constant for 10 min; in the second step, the temperature was raised to 175 °C while pressure and output power were kept the same (300 psi and 900 W) for five minutes; at the last step, the parameters were maintained at 100 psi, 170 °C, and 900 W, respectively, for 10 min. After digestion, the digestion vessels were cooled, opened, and then reheated by using a hotplate (135 °C) to evaporate the solutions until dry. Deionized water was added to the samples to make a solution, and then filtered using 0.45 µm cellulose acetate filter membranes. The final volume of each sample was made to 50 mL by adding additional deionized water and stored in a refrigerator (4 °C) for further tests. The heavy metals were tested by using inductively coupled plasma mass spectrometry (ICP-MS) (Thermos X SERIES2). The standard solutions were purchased from the CRM/RM information center of China and diluted using deionized water; mixed diluted solutions were used to obtain the standardization curves. More details for ICP-MS were reported previously [22]. The detection limits of heavy metals ranged between 1.1 × 10⁻⁹ g/L and 12 × 10−9 g/L for all heavy metals except Hg. The detection limit for Hg was 25 × 10−9 g/L. To calculate the mean values, all readings below detection limits were considered as zero. The total organic carbon (TOC) fraction was analyzed using a solid TOC analyzer (Elementar, Langenselbold, Germany). A quantity of 5 mg of each sediment sample was used for TOC measurement. Tin capsules were used to wrap samples and prepare them for the TOC analyzer. The TOC analyzer was operated after adjusting the combustion tube temperature to 950 °C and the carrier gas flow meter on the PC in- and outflow to 200 mL/min. The details for operation of the TOC analyzer were described in the vario TOC cube condensed manual.
2.4. Quality Assurance and Quality Control
Reference material (GBW07401) was purchased from Chinese Academy of Measurement Science. Two blanks and one reference sample were injected after every 15 sediment samples to assess the accuracy of the instrument. The accuracy of the ICP-MS machine was estimated using the relative standard deviation (RSD) of three successive results of the reference solutions. RDS was described as the ratio of standard deviation to mean value and the results obtained ranged between 1% and 5%. The standard solutions with concentrations of 0.1, 0.5, 1, 5, 10, and 20 µg/L of all tested heavy metals were used for standardization curves. The relative coefficients of all standardization curves were greater than 0.9923.
2.5. Statistical Analysis
SPSS statistics version 19 was used for data analysis while the relationships between the parameters were defined by using a Pearson correlation analysis. A value of p < 0.05 was considered to determine the level of significance. During hierarchical cluster analysis, Ward’s method with Euclidian distances was applied to group the parameters and sampling sites. Principal component analysis (PCA) was implemented to identify the possible sources of pollutants.
2.6. Enrichment Factor
Enrichment factor (EF) is used to evaluate artificial sources of heavy metals in sediments [23]. It reflects the extent of pollution and possible sources of pollution in a specific environment [24]. The guidelines EF < 2, 2 ≤ EF < 5, 5 ≤ EF < 20, 20 ≤ EF < 40, and EF ≥ 40 are used to describe minimum, moderate, significant, very high, and extremely high enrichment levels, respectively [25]. Usually, EF > 1.5 indicates that the majority of the metal originated from artificial sources [26]. The EF was defined based on the following equation:
where is the ratio of the concentration (mg/kg) of a specific heavy metal to Al in the field sample; and is the ratio of the concentration of the same element and Al in the background value. Elements which are abundant in the Earth’s crust (e.g., Si, Al, Fe, Sc, Cs, and Ti) and are not easily changed by the impacts of human activities are used as the reference elements [27]. In this study, Al was used as a reference element to calculate the EF value. Due to the absence of a reference background information from the study area, the average shale value [28] was used as a background, following similar reports [27,29,30].
2.7. Risk Assessment
The ecological risks imposed due to sediment contamination with heavy metals were described by using the potential ecological risk index. The ERI method has been frequently used to assess potential ecological impacts of heavy metals in river sediments [30,31]. The potential ecological risk index (ERI) estimates the possible ecological hazards of sediment contamination with heavy metals [32]. This index was calculated as
where Cf is the contamination factor for specific metal i (the ratio of the metal’s concentration in the sample to its concentration in the background value), and Tif is the toxic response factor of the metal i. Eri is the potential ecological risk of an individual heavy element whereas ERI refers to the summation of Eri..The toxic response factor Tif indicates toxicity of a given heavy metal and the sensitivity level of aquatic organisms to environmental pollution with the same heavy metal [31]. Eri describes the sensitivity of a biological community to a given heavy metal and can be used to illustrate the risk posed to that community by the specific contaminant [33] while ERI is used to identify locations which need special considerations due to the risks associated with pollutants. The toxic response factors Tif of the eight heavy metals investigated are As = 10, Cd = 30, Cr = 2, Cu = 5, Pb = 5, Hg = 40, Ni = 5, and Zn = 1 [21,32,33,34]. Hakson [32] defined five classes of Eri and four classes of ERI. The reference Eri were classified as Eri < 40, 40 ≤ Eri < 80, 80 ≤ Eri < 160, 160 ≤ Eri < 320, and Eri ≥ 320 representing low, medium, high, very high, and extremely high potential ecological risk, respectively. Moreover, ERI < 150 refers to low ecological risk; 150 ≤ ERI < 300 to medium ecological risk; 300 ≤ ERI < 600 to high ecological risk, and ERI ≥ 600 to very high ecological risk [32,35,36].
3. Results and Discussion
3.1. The Concentration of Heavy Metals and Total Organic Matter
Table 1 illustrates the summary of the concentrations of the heavy metals and total organic matter in the sediments of the Awash River Basin. The average concentrations of all heavy metals except those of Pb and Hg were higher than their respective background values. The average concentration of heavy metals increased in the order of Hg < Cd < As < Pb < Cu < Ni < Cr < Zn. A summary of data from individual sampling sites showed that Zn had a concentration above its corresponding background values at all sampling locations, whereas, Ni, Cd, and Cu revealed concentrations higher than their corresponding background values at 44 (95.65%), 42 (91.3%), and 29 (63.04%) of the total sampled sites, respectively. The concentrations of Cr, Pb, As, and Hg were greater than their corresponding background values at 23 (50%), 19 (41.3%), 12 (26.1%), and 9 (19.6%) of the sample sites, respectively. The highest three ratios of average concentrations of metals in the samples to their respective background values were recorded for Cd (8.67), Zn (4.03), and Cu (1.77). The ratios declined to the order of Cd > Zn > Cu > Cr > Ni > As > Pb > Hg. Even though there were variations between the sampling sites, the percentage content of total organic carbon was low at nearly all the sampling sites. Low TOC content can be associated with higher oxidation processes in the surface sediments [37].
Table 2 compares the results obtained from the Awash River Basin and those from other freshwater ecosystems. A comparison between other local studies (Lake Awasa) [38] and the Awash River Basin indicates that samples from the latter showed higher average concentrations for all tested heavy metals with the exception of Pb. A comparison with reports from other countries exhibited that the concentration of Cd in this study is higher than the mean values in reports from Buriganga River, Bangladesh [39]; Neretva River Valley, Croatia [40]; Yangtze River Basin, China [41]; Lijiang River, China [42]; and Danube River, Germany [43]. However, the Cd concentration from this study is lower than those found in results from Almendares River, Cuba [44] and Tigris River, Turkey [45]. Use of phosphate fertilizers, open burning of municipal solid waste, metal working plants, and less-treated industrial wastes are among the major anthropogenic sources of Cd [43,46]. In this study area, wide use of phosphate fertilizers in the agricultural sector and runoff from agricultural fields might have a big share in causing sediment contamination with Cd. Electronic wastes from various industries in urban areas could be also a possible source of Cd [47]. Hg and As contents in the Lijiang River, China [42] and the Danube River, Germany [43] were higher than those of the Awash River Basin. Moreover, the mean values for Cr, Cu, Ni, and Zn in Neretva River Valley, Croatia [40]; Yangtze River Basin, China [41]; Lijiang River, China [42]; and Danube River, Germany [43] were lower than the average values of the Awash River Basin while Buriganga River, Baangladish [39]; Almendares River, Cuba [44]; and Tigris River, Turkey [45] showed higher contamination with Cu, Ni, and Zn. Industrial and municipal wastewater are the major artificial sources of Cr, Cu, and Ni [48]. In general, this comparison indicated that there was high accumulation of heavy metals in the sediments of rivers and streams of the Awash River Basin and that it requires special care and management interventions such as proper waste treatment and disposal.
3.2. Enrichment Factor
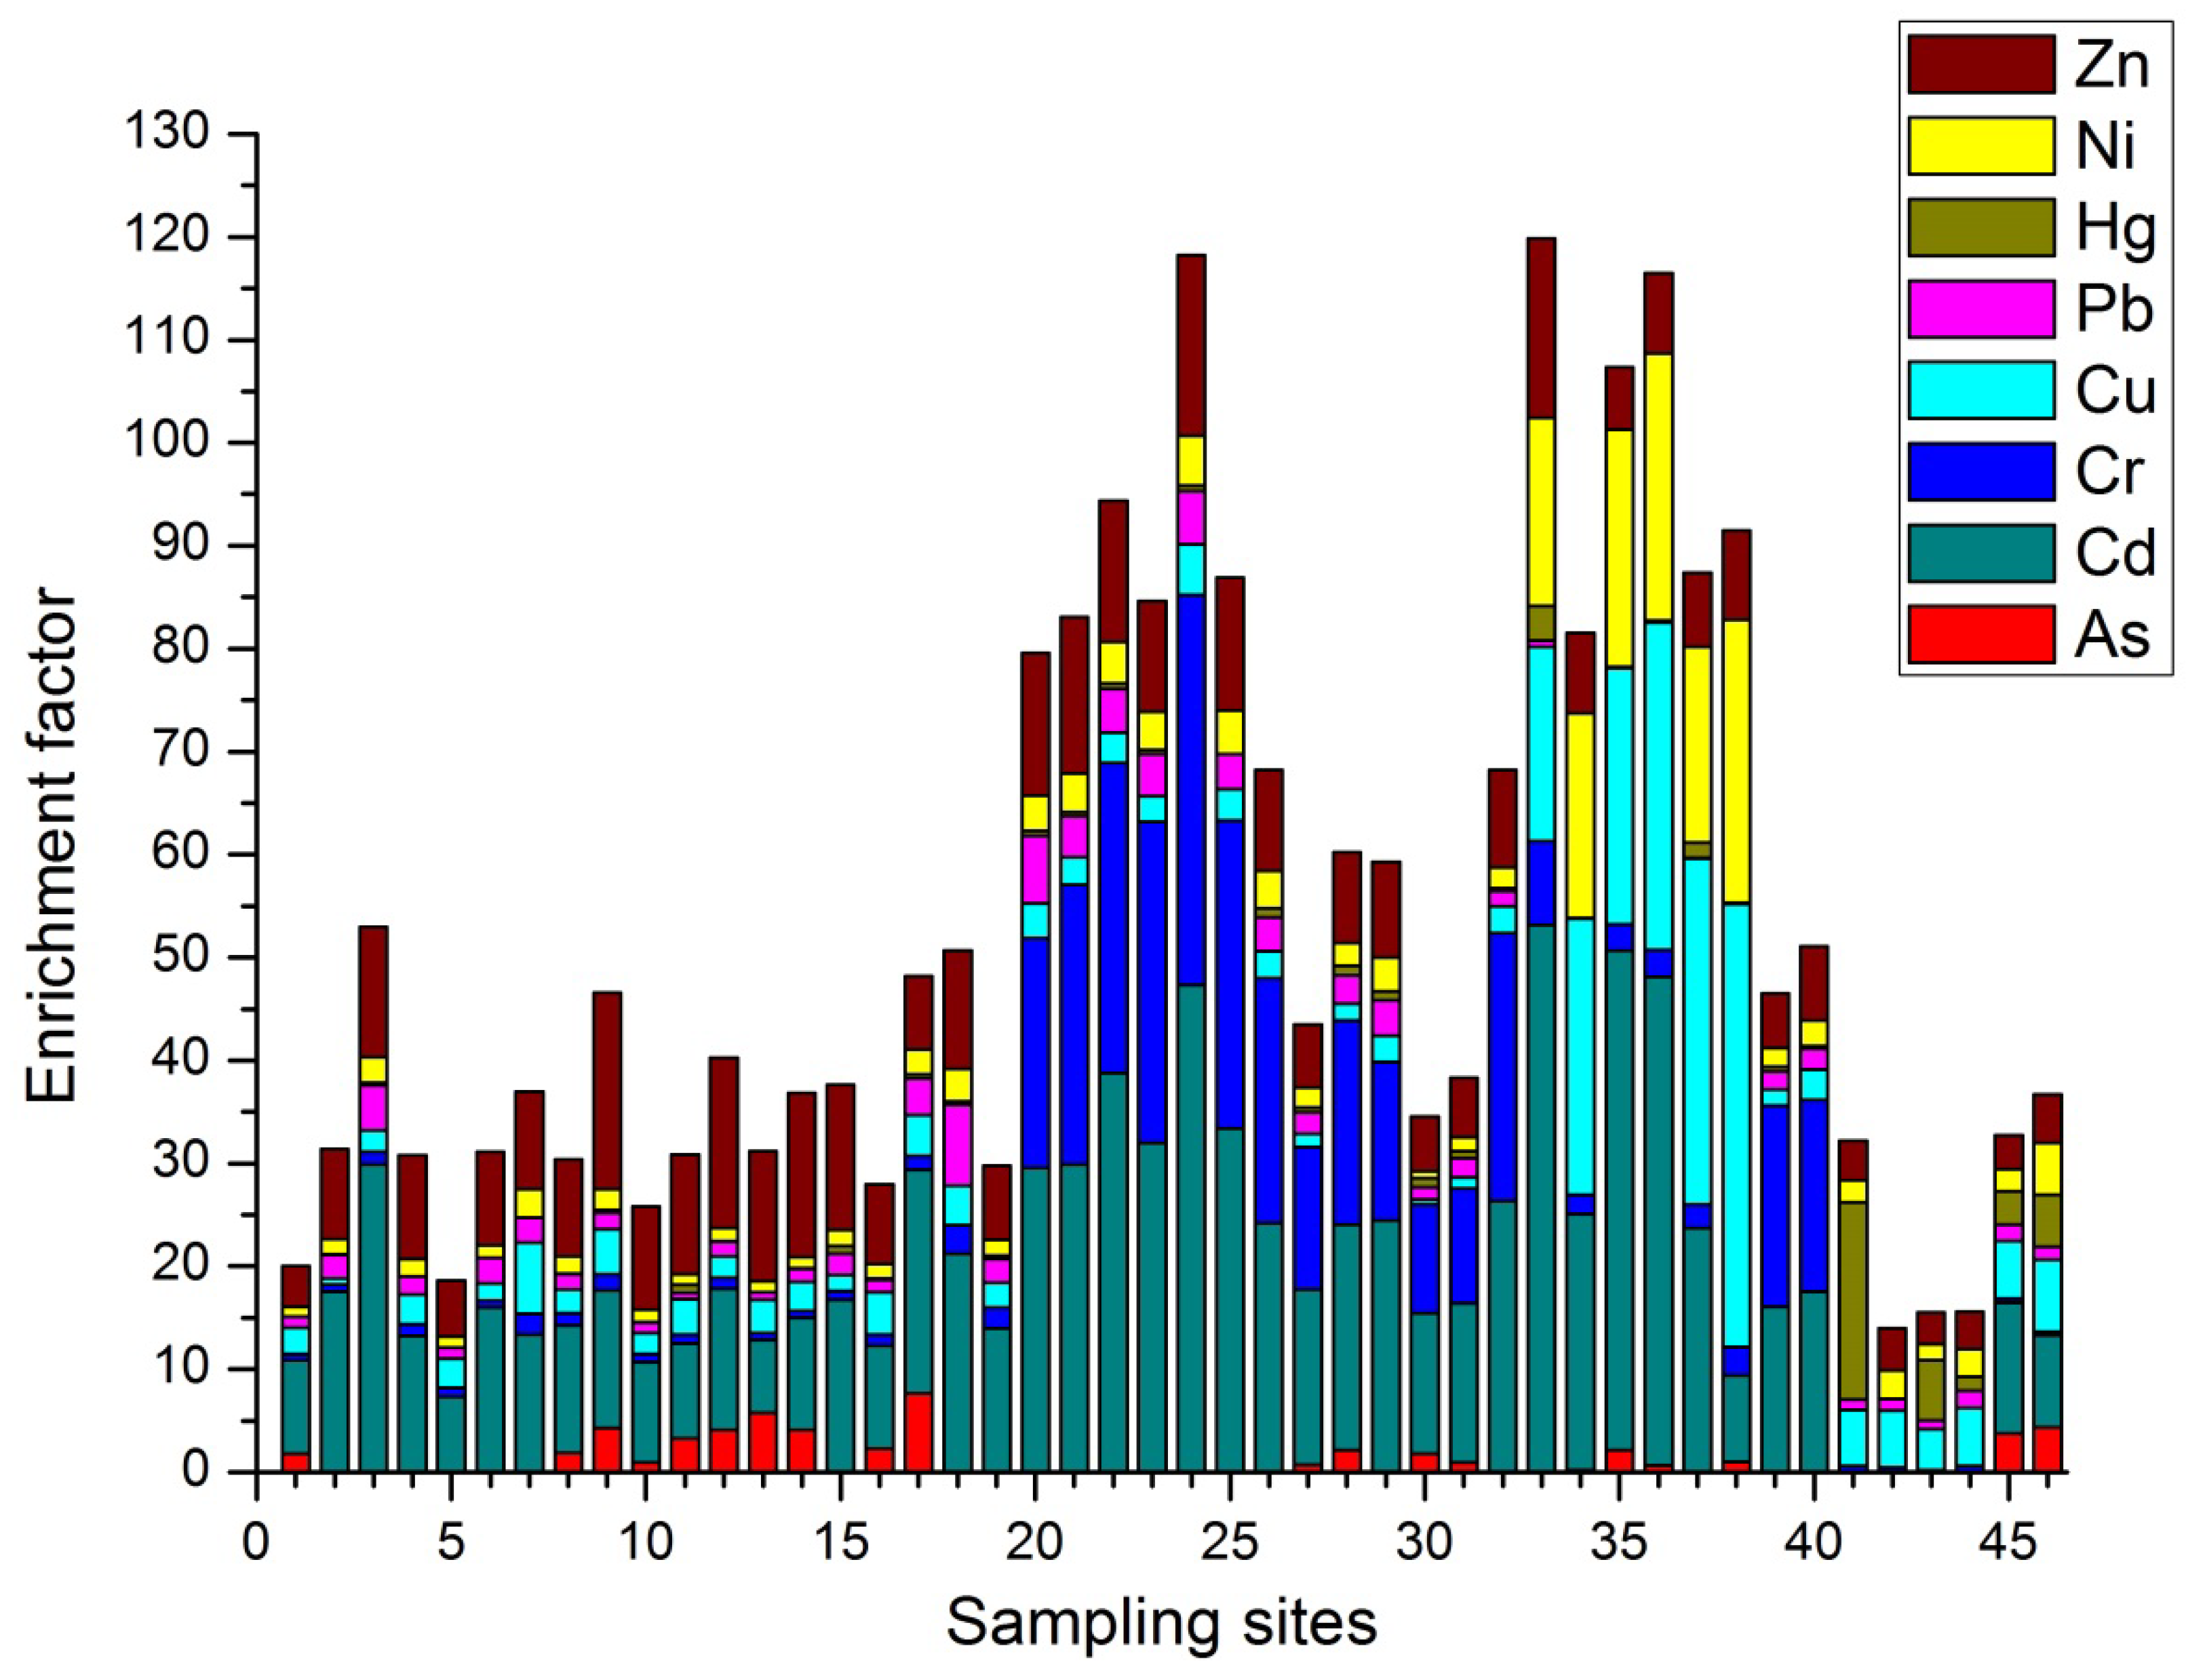
For this study area, the average EF values of heavy metals decreased in the sequential order Cd > Zn > Cr > Cu > Ni > Pb > As > Hg (Table 3). Based on the EF guidelines [25], Cd, Zn, Cr, and Cu had significant enrichment levels while Ni and Pb fell in the range of moderate enrichment levels. On the other hand, Hg and As had low enrichment levels. In addition to artificial sources, the high mobility, water solubility, and geochemical activity of Cd might have contributed to the increase in its EF value [47].
Figure 2 reveals that Cd showed EF values which ranged from significant to extremely high enrichment levels in all sampling locations except at four sites (sites 41–44) where its enrichment was not observed at all. Extremely high levels of Cd enrichment were observed at sites 33, 35, and 36 around the Wonji area where the sugar factory and large-scale agricultural farms are located. Five sampling stations (sites 33–37) around the same locality (Wonji area) were also highly contaminated with Cu and Ni. The majority of the heavy metals that enter the river systems are removed from the liquid phase within a few minutes, mainly through precipitation and adsorption [49]. This reveals that sediment pollution with heavy metals is mainly affected by nearby land use systems. The Wonji area has gentle slopes, slow water flow, and high sedimentation, which might have contributed to the high concentrations of metallic contaminants at sites 33–37.
EF values of Zn for all sampling sites ranged between moderate and significant enrichment levels. Many of the sites with significant Zn enrichment were in rural areas where floriculture farms and cereal crop agriculture are dominant. Therefore, runoff from agriculture fields (artificial fertilizers, pesticides, and animal manure) could be the major source of Zn. Cr exhibited a very high enrichment level (EF > 20) at 8 sampling sites across the Akaki and Mojo Rivers located in and around the capital city (Addis Ababa) and Mojo town, respectively. Here, many tanneries and waste treatment plants were located near to the river banks. This indicates that effluents from point sources like tanneries and landfills near to the sampling sites were the major sources of Cr. Activities such as blasting, painting, and metal manufacturing in urban areas can also be sources for Cr [50]. Thus, urban runoff might have also contributed to the Cr contamination. Even though there were low enrichment values for Hg and As across the study areas, Hg showed high enrichment values at four sampling sites (sites 41, 43, 45, and 46) near the Matahara sugar factories, indicating the presence of a substantial anthropogenic source for Hg. The variations in EF mainly occur due to the variation in rates of addition and elimination of each metallic element [50].
3.3. Correlation Analysis
The outputs of a Pearson’s correlation analysis are displayed in Table 4 to illustrate the relationships between the studied parameters. Positive and significant correlations were observed between the pairs Cu–Ni, Cd–Ni, Cu–Cd, and As–Zn, at p < 0.01. The uppermost correlation coefficient (r = 0.97) was recorded between Cu and Ni followed by Cd and Ni (r = 0.659).
A high correlation coefficient (r) between metals indicates common source contamination, level of contamination, and/or comportment through transportation [51]. Hence, Cu and Ni might have the same anthropogenic sources. These two heavy metals also showed high levels of enrichment at similar sites (sites 33–37). This might point out that the two elements mainly originated from agricultural inputs like fertilizers and pesticides. In the same manner, Zn–TOC, Pb–TOC, and As–TOC exhibited significant positive correlations. This also indicates that the circulations of these metallic elements were partly influenced by TOC. On the other hand, Cr and Hg did not show any positive correlation, indicating different distribution patterns and/or possible sources of pollution.
3.4. Factor Analysis
The details of PCA values for heavy metals and total organic matter are displayed in Table 5. In this study, three main principal components (PCs) with eigenvalues greater than 1 were used to specify the significance. These three components of analysis (PC 1, 2, and 3) described 74.93% of the data variations. The first component (PC1) contributed 33.28% of the total variations. In this component, Ni and Cu showed the two highest loading values (0.958 and 0.944, respectively). Therefore, this component showed the strong association between Cu and Ni and their dominance over other tested parameters. The highest correlation between Cu and Ni also coincided with this result. High concentrations of these two heavy metals appeared mainly at 6 sites (sites 33–38), revealing anthropogenic sources which were identified as agrochemicals (pesticides and artificial fertilizers) from the nearby intensive agricultural fields, effluents from textile and sugar factories, and deposition of wastes from the nearby towns (Adama and Wonji). The study by [52] also reported that Cu could be released by sanitary sewages.
In the second factor (PC2), Zn, As, and TOC exhibited the three highest loading values (0.830, 0.77, and 0.703, respectively) and were thus considered as major contributors for PC2. The correlation matrix also revealed that Zn, As, and TOC were significantly positively correlated. Agriculture could be the major anthropogenic source for these groups. Fertilizers and pesticides with arsenic-containing compounds are two major sources of As and increase its accumulation in the sediment [53], while animal manure is a potential source of Zn.
In the third factor, only Cd showed a high loading value, indicating its dominant contribution in this component. High concentration and enrichment values were observed in most sampling sites, whereas extremely high enrichments were observed around the Wonji area. This might indicate that both natural and artificial sources were major contributors for Cd accumulation in the sediment. Pb, Cr, and Hg did not show high loading values in any component, indicating that these heavy metals had different sources of pollution.
3.5. Cluster Analysis
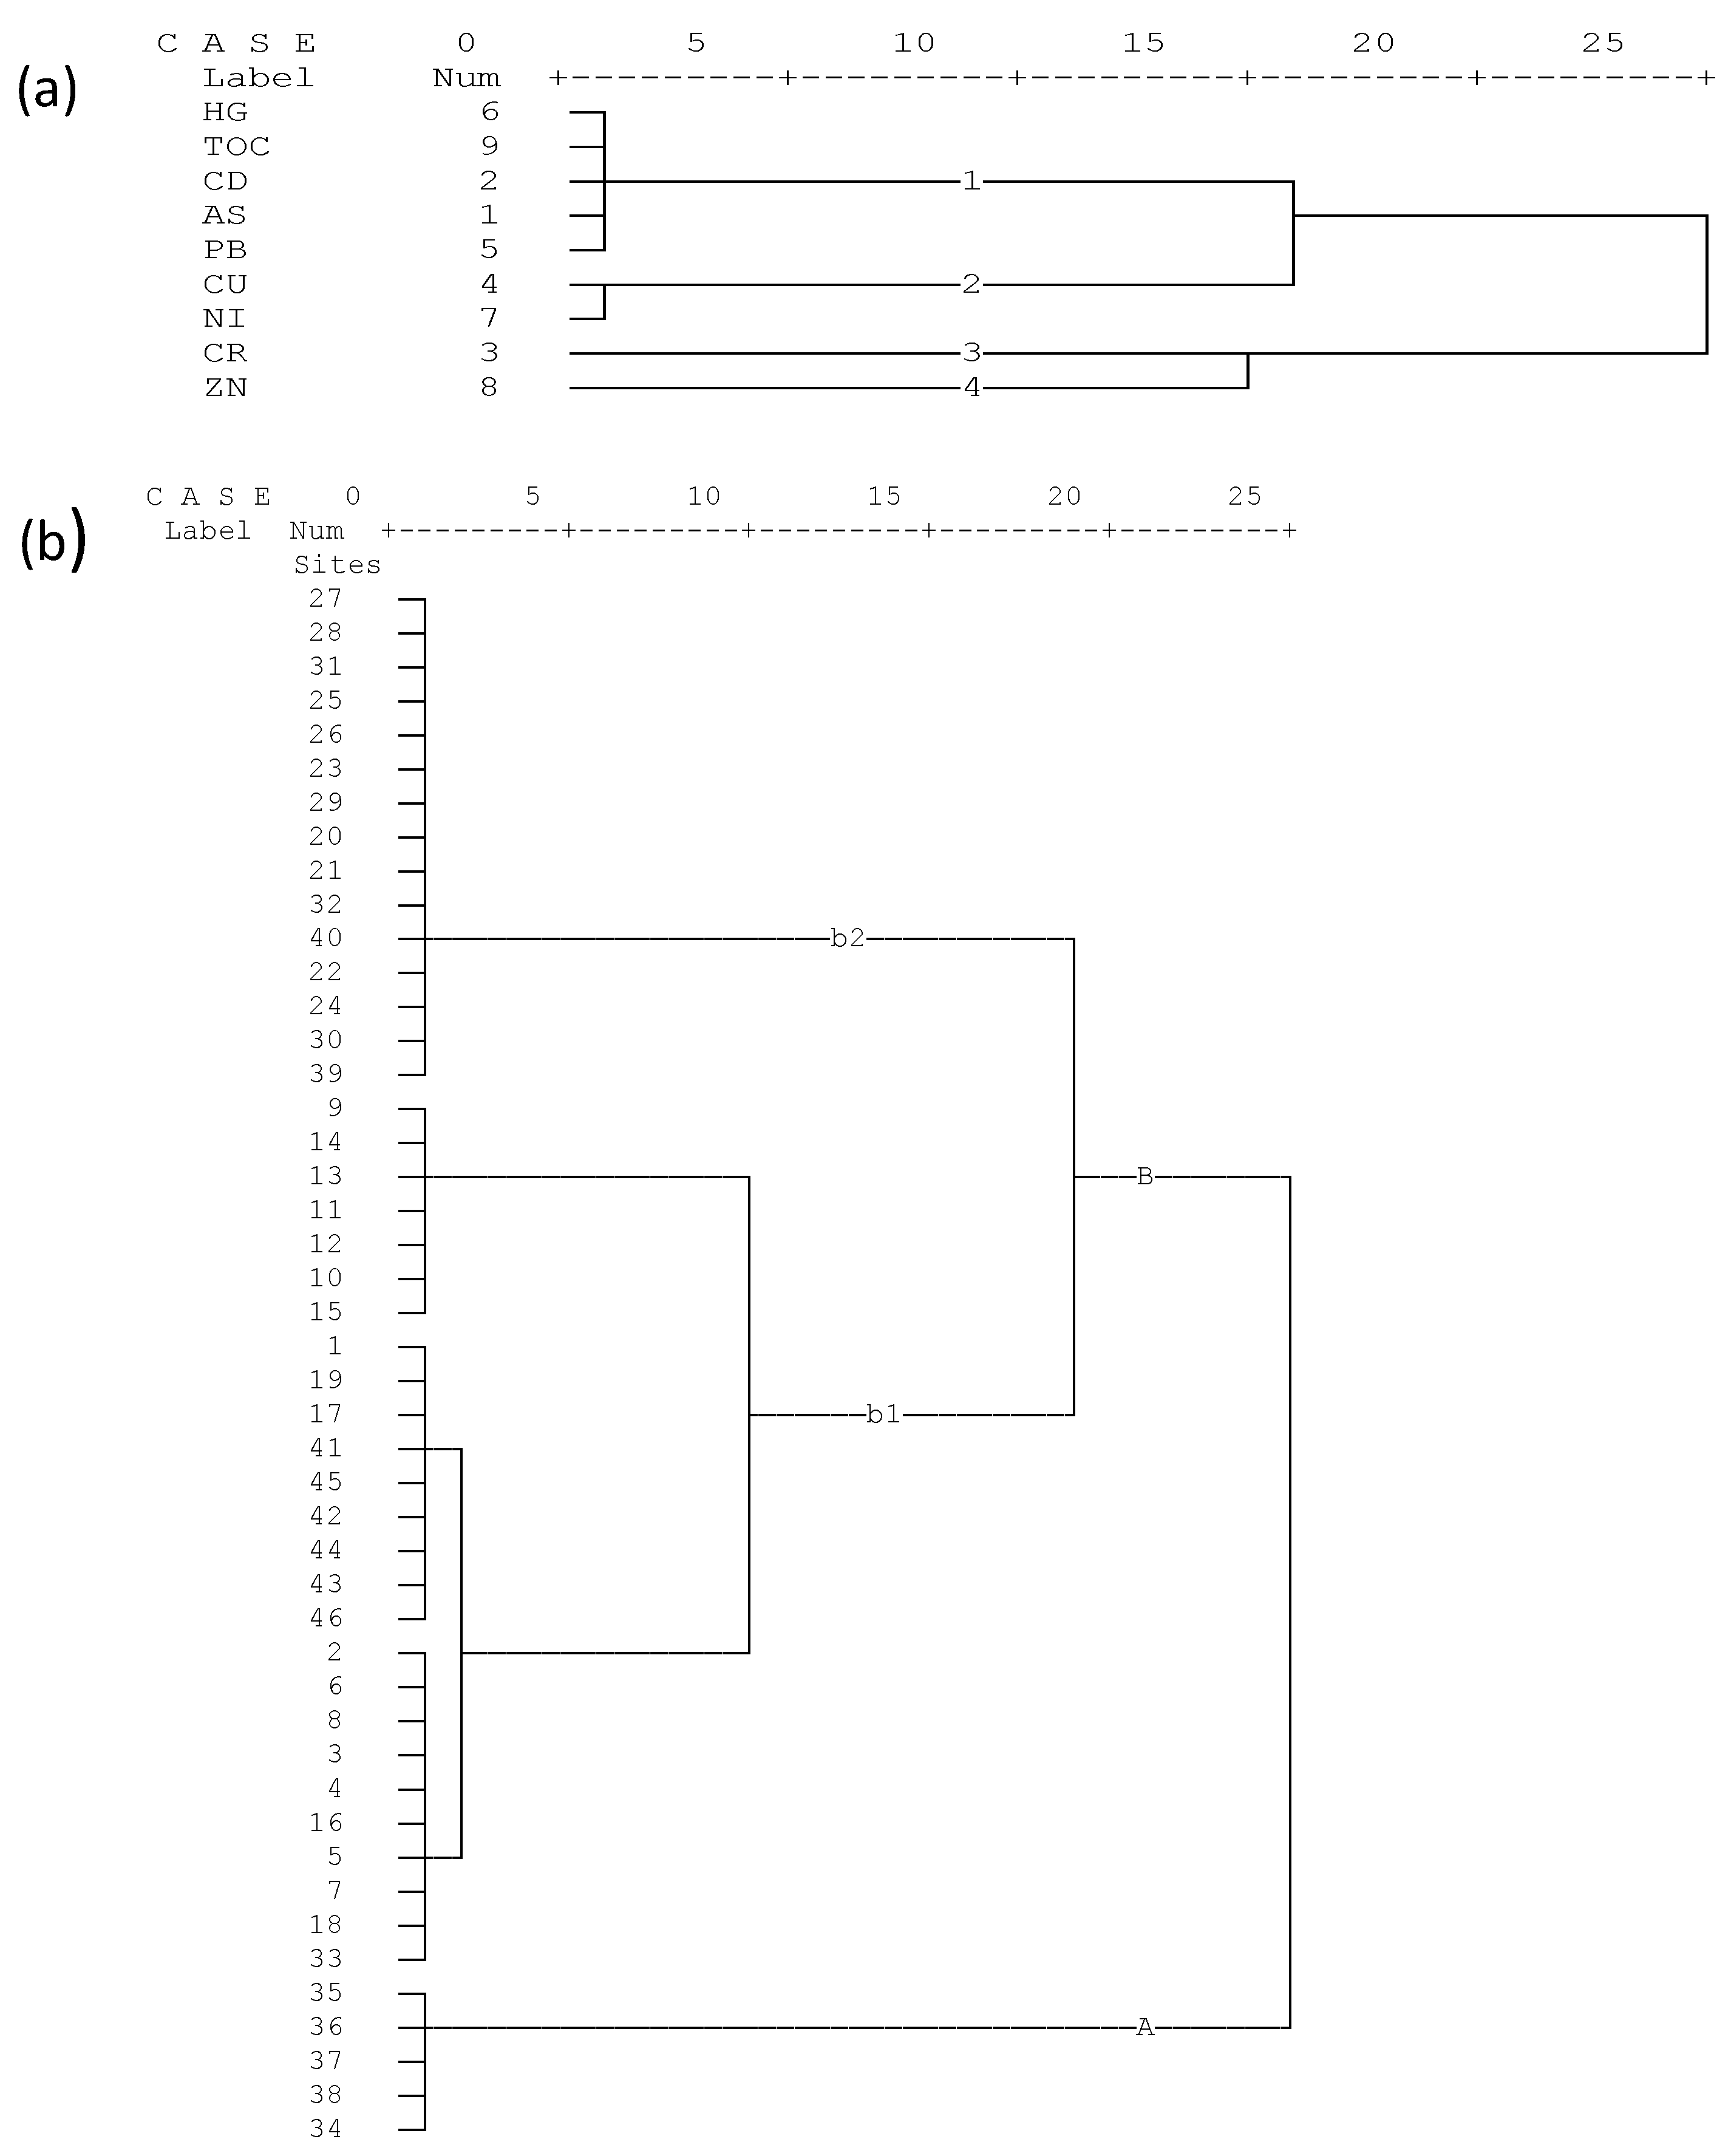
A hierarchal dendrogram of single-linkage Euclidean distances is displayed in Figure 3. Figure 3a reveals that metallic elements and TOC were grouped into four major clusters. Grouping was supported by the Pearson’s correlation analysis which revealed that Zn and Cr were negatively correlated. The principal component analysis also showed that Cr influenced PC2 negatively, whereas Zn was among the major determinants in this component of analysis. This displayed a clear cluster difference between the two elements. Cluster 1 consisted of Hg, TOC, Cd, As, and Pb; Cluster 2 consisted of Cu and Ni, while Clusters 3 and 4 were represented by Cr and Zn, respectively.
Figure 3b summarizes the dendrogram of sites of the study area. Two major clusters were identified (Cluster A and Cluster B) and displayed in this figure. Cluster A (Site 34–38) represented highly contaminated sites. These sites were located after major possible sources of pollution such as large scale crop farms, textile factories, sugar factories, and urban sewage discharges. Therefore, these sites need to receive first priority during remediation activities. Cluster B represented sites with comparatively moderate levels of contamination. Because of visible differences between the sites, Cluster B was subdivided into b1 and b2, where b1 represented sites with relatively more polluted sites.
3.6. Potential Ecological Risk Index (ERI) of the Heavy Metals
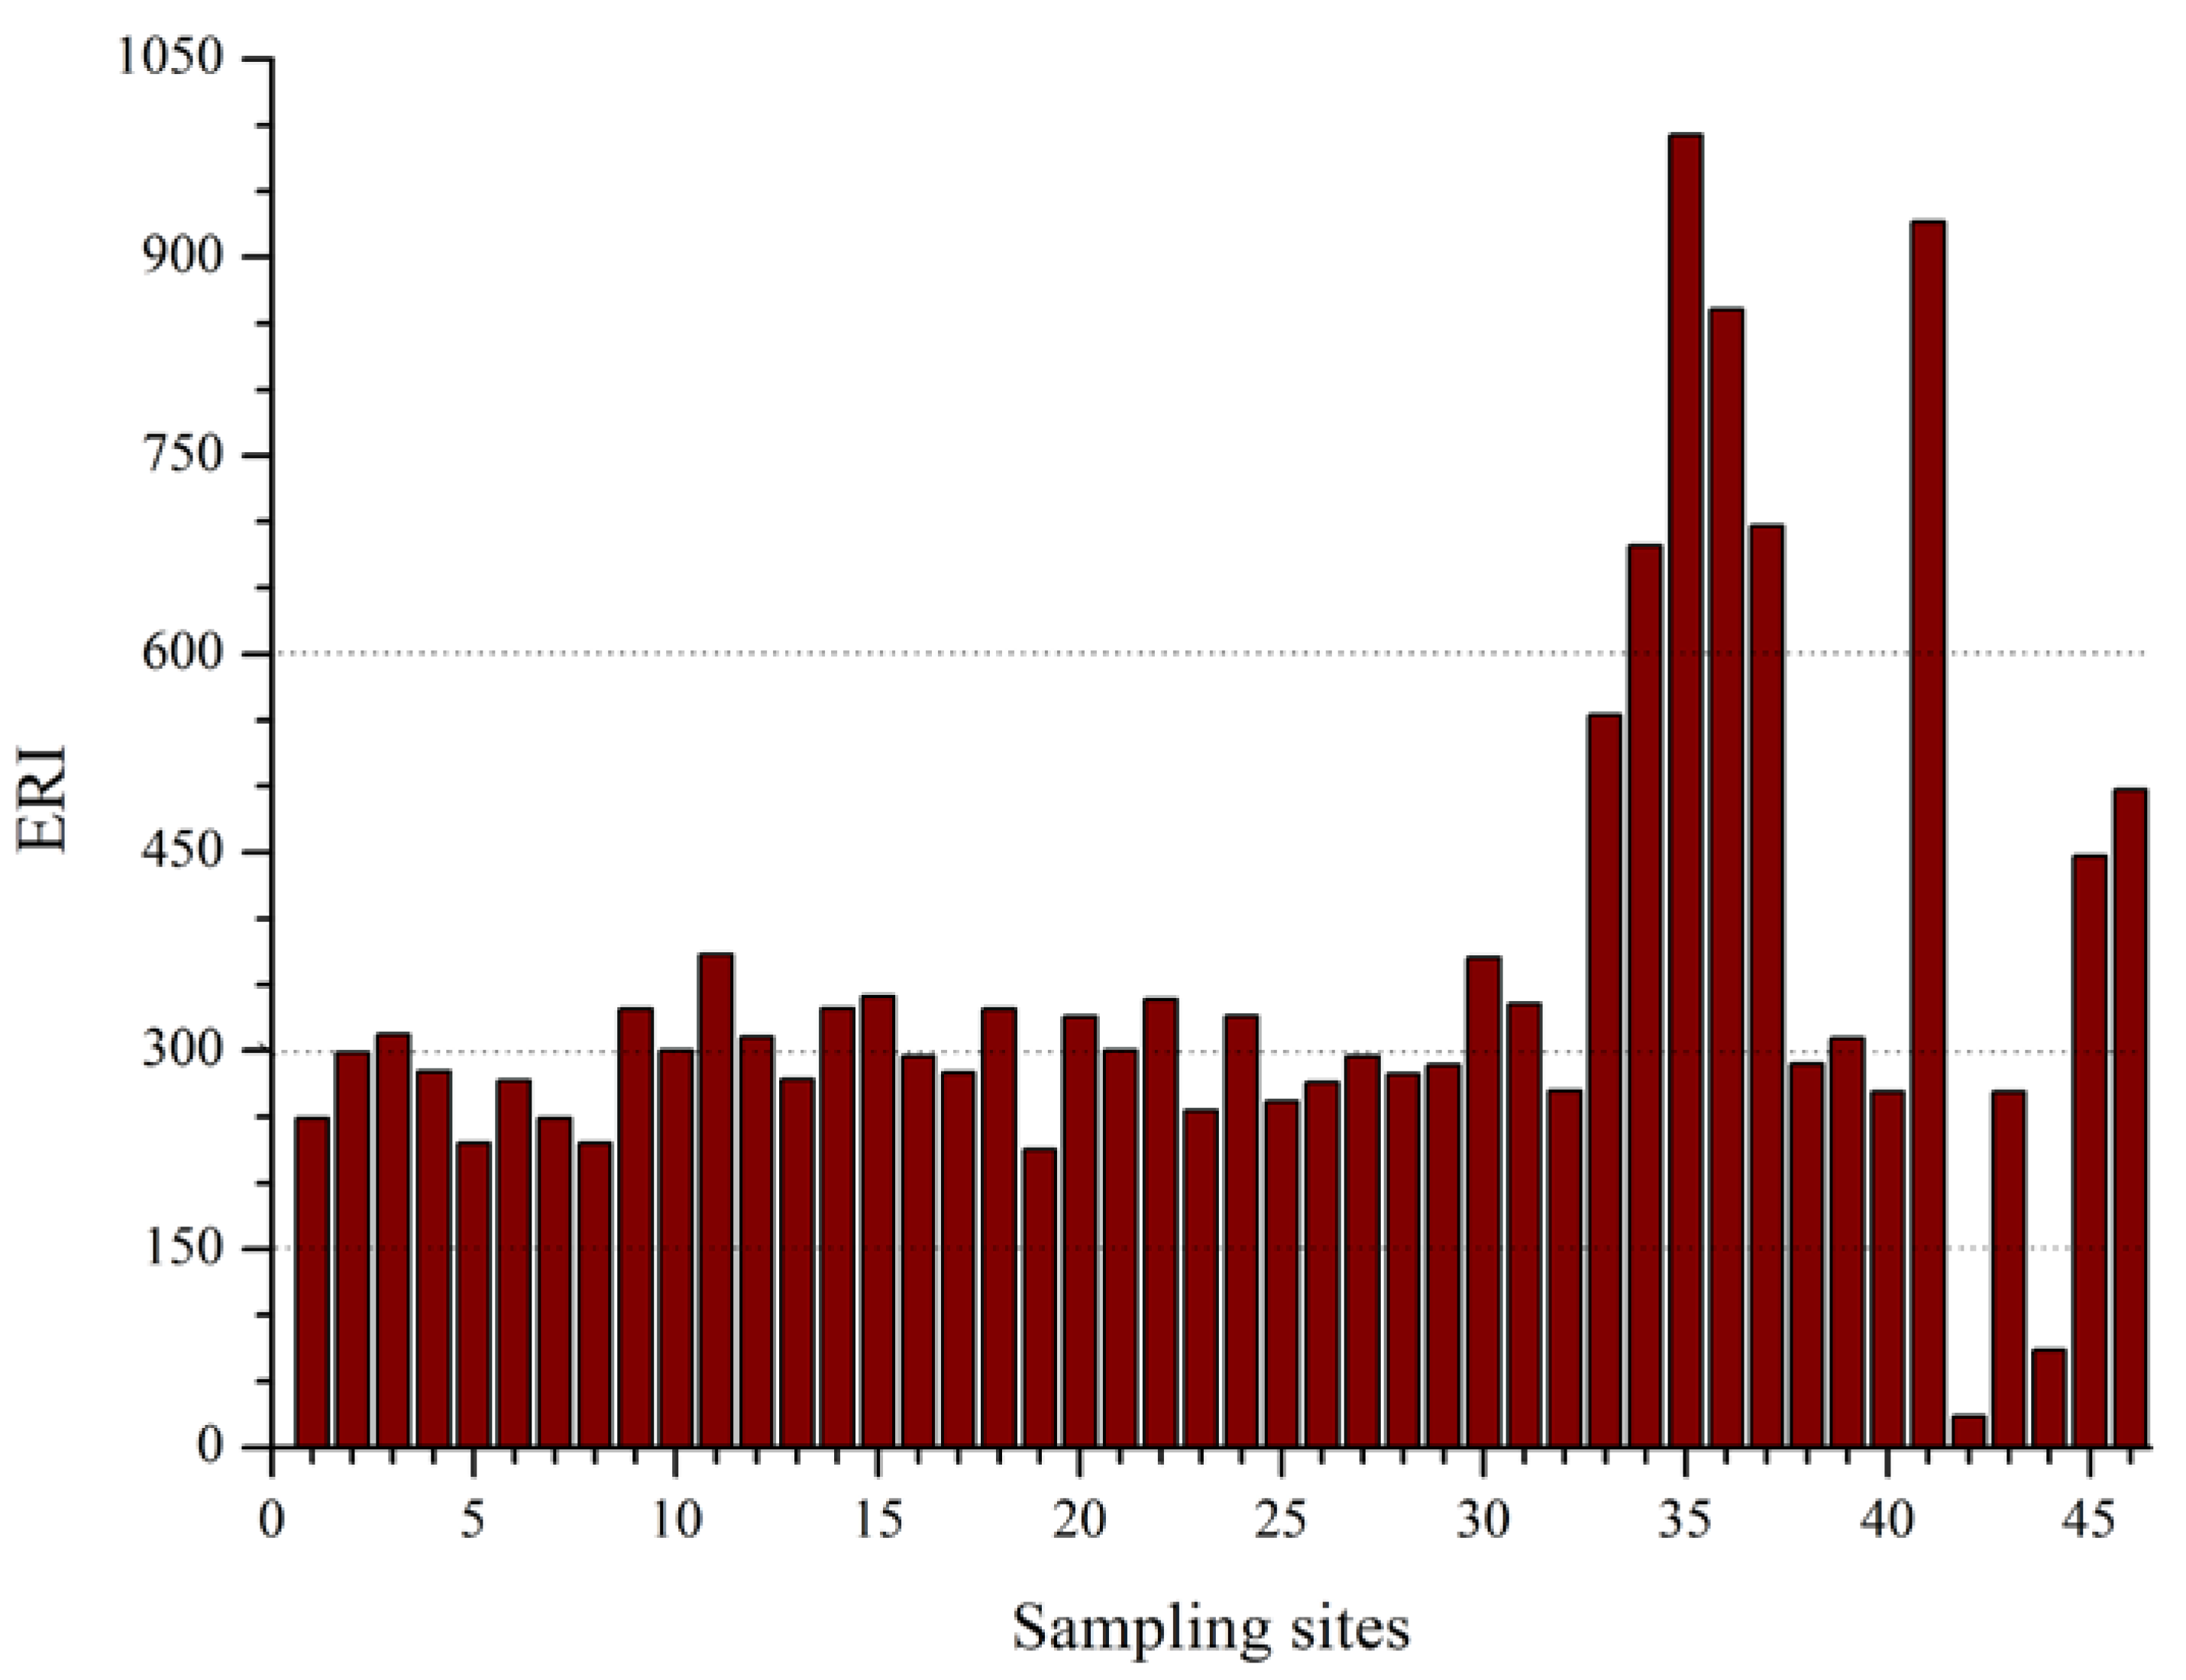
The mean ERI value for the study area was 355.54, indicating high ecological risk due to sediment pollution with heavy metals (Table 6). Cd also showed very high mean potential ecological risk (Eri = 254.64) while other heavy metals were in the range of low to moderate risks (Eri < 50). Eri values decreased in the order of Cd > Hg > Pb > Cu > Ni > As > Cr > Zn. Cd showed very high contamination factor and ecological risk at 34 (73.91%) sampling sites. This might indicate that Cd was the most important element in the study area, posing very high ecological toxicity. Hg showed the second highest Eri value (49.34) mainly because of its toxicity response (Tif = 40) and heavy contamination at site 41. Even though its concentrations across all sampling sites were high, Zn showed the least Eri value due to its low toxicity response.
The ERI values for all sampling sites are displayed in Figure 4. Out of 46 sampling sites, 2 sites (4.35%), 16 sites (45.65%), 23 sites (50%), and 5 sites (10.87%) were grouped into low, medium, high, and very high ecological risk, correspondingly. Almost all sites with very high ecological risk (ERI value > 600) were from the main course of the Awash River where large-scale agricultural fields and sugar factories are located. These sites were situated in rural areas with gentle slopes, slow flow rates, and high sedimentation. Thus, waste discharged to the streams in upper major cities such as Addis Ababa, Adama, and Mojo can have the chance to sink down in these areas and increase sediment contamination with heavy metals.
4. Conclusions
The mean, min–max, enrichment factor, and mean ERI values showed that surficial sediments of the Awash River Basin are contaminated with heavy metals. Heavily contaminated sites were located in rural areas below the major towns. Based on the calculated enrichment factor and comparisons with average shale values, Cd was found to be the most contaminating metal. The accumulation of Cu and Cr is also a threat to aquatic life in this particular water ecosystem. High accumulation of Cr in sediments of the Mojo River is primary evidence of the poor waste treatment practices of the nearby tanneries and weak controlling mechanisms. Increased urban and agricultural runoff and less-treated effluents from point sources like tanneries and sugar and textile factories were the main sources of heavy metal enrichment. The study also indicated that sediment pollution with heavy metals is posing high ecological risks in the Basin. Thus, controlling of waste at the source and remediation of contaminated sites are required to minimize adverse effects on the aquatic organisms and related food webs.
Acknowledgments
The authors are grateful to Natural Science Key Foundation of Hubei Province of China, Funding Project of Sino-Africa Joint Research Center, Chinese Academy of Sciences (Y623321K01), and the Hundred Talents Program of the Chinese Academy of Sciences (Y329671K01).
Author Contributions
This article was produced from Niguse Bekele’s Ph.D. research project. Hongjuan Wu and Jun Wang supervised the overall activities of the research project. These three authors designed the research project, participated in field data collection, laboratory analysis and final write-up. Xue Yan and Luanettee’ Lydia Colebrooke participated in laboratory analysis and editing the paper.
Conflicts of Interest
The authors declare no conflict of interest.
References
- Park, J.; Presley, B.J. Trace metal contamination of sediments and organisms from the Swan Lake area of Galveston Bay. Environ. Pollut. 1997, 98, 209–221. [Google Scholar] [CrossRef]
- Soares, H.M.V.M.; Boaventura, R.A.R.; Machado, A.S.C.; Esteves da Silva, J.C.G. Sediments as monitors of heavy metal contamination in the Ave river basin (Portugal): Multivariate analysis of data. Environ. Pollut. 1999, 105, 311–323. [Google Scholar] [CrossRef]
- Ma, Y.Q.; Qin, Y.W.; Zheng, B.H.; Zhang, L.; Zhao, Y.M. Seasonal variation of enrichment, accumulation and sources of heavy metals in suspended particulate matter and surface sediments in the Daliao river and Daliao river estuary, Northeast China. Earth Sci. 2015, 73, 5107–5117. [Google Scholar] [CrossRef]
- Buccolieri, A.; Buccolieri, G.; Cardellicchio, N.; Dell-Atti, A.; Di-Leo, A.; Maci, A. Heavy metals in marine sediments of Taranto Gulf (Ionian Sea, Southern Italy). Mar. Chem. 2006, 99, 227–235. [Google Scholar] [CrossRef]
- Atkinson, C.A.; Jolley, D.F.; Simpson, S.L. Effect of overlying water pH, dissolved oxygen, salinity and sediment disturbances on metal release and sequestration from metal contaminated marine sediments. Chemosphere 2007, 69, 1428–1437. [Google Scholar] [CrossRef] [PubMed]
- Lin, D.A.; Ouyang, Y.; Huang, C.H.; Huang, D.Y. Characterization of heavy metals from banana farming soils. Clean-Soil Air Water 2010, 38, 430–436. [Google Scholar] [CrossRef]
- Paula, F.J.L.; Marins, R.V.; Aguiar, J.E.; Peres, T.F. Background values for evaluation of heavy metal contamination in sediments in the Parnaíba River Delta estuary, NE/Brazil. Mar. Pollut. Bull. 2014, 91, 424–428. [Google Scholar] [CrossRef]
- Almeida, J.A.; Diniz, Y.S.; Marques, S.G.; Faine, I.A.; Ribas, B.O.; Burneiko, R.C.; Novelli, E.L.B. The use of oxidative stress responses as biomarkers in Nile Tilapia (Oreochromis niloticus) exposed to in vivo cadmium contamination. Environ. Int. 2002, 27, 673–679. [Google Scholar] [CrossRef]
- Uluturhan, E.; Kucuksezgin, F. Heavy metal contaminants in Red Pandora (Pagellus erythrinus) tissues from the Eastern Aegean Sea, Turkey. Water Res. 2007, 41, 1185–1192. [Google Scholar] [CrossRef] [PubMed]
- Biney, C.; Amuzu, A.T.; Calamari, D.; Kaba, N.; Mbome, I.L.; Naeve, H.; Ochumba, P.B.; Osibanjo, O.; Radegonde, V.; Saad, M.A. Review of heavy metals in the African aquatic environment. Ecotoxicol. Environ. Saf. 1994, 28, 134–159. [Google Scholar] [CrossRef] [PubMed]
- Japan International Cooperation Agency. Kenya Planning and Evaluation Department. A Country Profile on Environment. Available online: http://iodeweb1.vliz.be/odin/bitstream/1834/779/1/ (accessed on 25 June 2016).
- Yabe, J.; Ishizuka, M.; Umemura, T. Current Levels of Heavy Metal Pollution in Africa. J. Vet. Med. Sci. 2010, 72, 1257–1263. [Google Scholar] [CrossRef] [PubMed]
- Martin, J.M.; Meybeck, N. Elemental mass balance of materials carried by major world rivers. Mar. Chem. 1979, 7, 173–206. [Google Scholar] [CrossRef]
- Lietz, W.; Galling, G. Metals from sediments. Water Res. 1989, 23, 247–252. [Google Scholar] [CrossRef]
- Issa, Y.M.; Elewa, A.A.; Rizk, M.S.; Hassouna, A.F.A. Distribution of some heavy metals in Qaroun lake and river Nile, Egypt, Menofiya. J. Agric. Res. 1996, 21, 733–746. [Google Scholar]
- Sutherland, R.A. Bed sediment-associated trace metals in an urban stream, Oahu, Hawaii. Environ. Geol. 2000, 39, 611–627. [Google Scholar] [CrossRef]
- Aguilar, A.; Borrel, A.; Reijnders, P.H. Geographical and temporal variation in levels of organochlorine contaminants in marine mammals. Mar. Environ. Res. 2002, 53, 425–452. [Google Scholar] [CrossRef]
- Alemayehu, T. The impact of uncontrolled waste disposal on surface water quality in Addis Ababa, Ethiopia. SINET Ethiop. J. Sci. 2001, 24, 93–104. [Google Scholar] [CrossRef]
- Mekonnen, K.N.; Ambushec, A.A.; Chandravanshia, B.S.; Redi-Abshiro, M.; Mc-Crindle, R.I. Assessment of potentially toxic elements in Swiss chard and sediments of Akaki River, Ethiopia. Toxicol. Environ. Chem. 2015, 96, 1501–1515. [Google Scholar] [CrossRef]
- Taddese, G.; Sonder, K.; Peden, D. The Water of the Awash River Basin a Future Challenge to Ethiopia. 2004. Available online: http://www.iwmi.cgiar.org (accessed on 15 September 2016).
- Mungai, T.M.; Owino, A.A.; Makokha, V.A.; Gao, Y.; Yan, X.; Wang, J. Occurrences and toxicological risk assessment of eight heavy metals in agricultural soils from Kenya, Eastern Africa. Environ. Sci. Pollut. Res. 2016, 23, 18533–18541. [Google Scholar] [CrossRef] [PubMed]
- Yang, Y.; Wei, L.; Cui, L.; Zhang, M.; Wang, J. Profiles and risk assessment of heavy metals in Great Rift Lakes, Kenya. CLEAN Air Soil Water 2017, 45, 1600825. [Google Scholar] [CrossRef]
- Zhang, H.; Liu, G.; Shi, W.; Li, J. Soil Heavy Metal Contamination and Risk Assessment Around the Fenhe Reservoir, China. Bull. Environ. Contam. Toxicol. 2014, 93, 182–186. [Google Scholar] [CrossRef] [PubMed]
- Woitke, P.; Wellmitz, J.; Helm, D.; Kube, P.; Lepom, P.; Litheraty, P. Analysis and assessment of heavy metal pollution in Suspended solids and sediments of river Danube. Chemosphere 2003, 51, 633–642. [Google Scholar] [CrossRef]
- Feng, H.; Han, X.F.; Zhang, W.G.; Yu, L.Z. A preliminary study of heavy metal contamination in Yangtze River intertidal zone due to urbanization. Mar. Pollut. Bull. 2004, 49, 910–915. [Google Scholar] [CrossRef] [PubMed]
- Sundaray, S.K.; Nayak, B.B.; Lin, S.; Bhatta, D. Geochemical speciation and risk assessment of heavy metals in the river estuarine sediments—A case study: Mahanadi basin, India. J. Hazard. Mater. 2011, 186, 1837–1846. [Google Scholar] [CrossRef] [PubMed]
- Gałuszka, A.; Migaszewski, Z.M. Geochemical background—An environmental perspective. Mineralogia 2011, 42, 7–17. [Google Scholar] [CrossRef]
- Turekian, K.K.; Wedepohl, K.H. Distribution of the elements in some major units of the earth’s crust. Geol. Soc. Am. Bull. 1961, 72, 175–192. [Google Scholar] [CrossRef]
- Salati, S.; Moore, F. Assessment of heavy metal concentration in the Khoshk River water and sediment, Shiraz, Southwest Iran. Environ. Monit. Assess. 2010, 164, 677–689. [Google Scholar] [CrossRef] [PubMed]
- Díaz-de Alba, M.; Galindo-Riano, M.D.; Casanueva-Marenco, M.J.; García-Vargas, M.; Kosore, C.M. Assessment of the metal pollution, potential toxicity and speciation of sediment from Algeciras Bay (South of Spain) using chemometric tools. J. Hazard. Mater. 2011, 190, 177–187. [Google Scholar] [CrossRef] [PubMed]
- Song, J.; Yang, X.; Zhang, J.; Long, Y.; Zhang, Y.; Zhang, T. Assessing the Variability of Heavy Metal Concentrations in Liquid-Solid Two-Phase and Related Environmental Risks in the Weihe River of Shaanxi Province, China. Int. J. Environ. Res. Public Health 2015, 12, 8243–8262. [Google Scholar] [CrossRef] [PubMed]
- Hakanson, L. An ecological risk index for aquatic pollution control. A sedimentological approach. Water Res. 1980, 14, 975–1001. [Google Scholar] [CrossRef]
- Ma, Z.; Chen, K.; Yuan, Z.; Bi, J.; Huang, L. Ecological risk assessment of heavy metals in surface sediments of six major Chinese freshwater lakes. J. Environ. Qual. 2013, 42, 341–350. [Google Scholar] [CrossRef] [PubMed]
- Chen, C.F.; Chen, C.W.; Ju, Y.R.; Kao, C.M.; Dong, C.D. Impact of disposal of dredged material on sediment quality in the Kaohsiung Ocean Dred ged Material Disposal Site, Taiwan. Chemosphere 2018, 191, 555–565. [Google Scholar] [CrossRef] [PubMed]
- Guo, W.; Liu, X.; Liu, Z.; Li, G. Pollution and Potential Ecological Risk Evaluation of Heavy Metals in the Sediments around Dongjiang Harbor, Tianjin. Procedia Environ. Sci. 2010, 2, 729–736. [Google Scholar] [CrossRef]
- Angulo, E. The Tomlinson Pollution Load Index applied to heavy metal ‘Mussel-Watch’ data: A useful index to assess coastal pollution. Sci. Total Environ. 1996, 187, 19–56. [Google Scholar] [CrossRef]
- Okay, O.S.; Ozmen, M.; Güngördü, A.; Yılmaz, A.; Yakan, S.D.; Karacik, B.; Tutak, B.; Schramm, K.W. Heavy metal pollution in sediments and mussels: Assessment by using pollution indices and metallothionein levels. Environ. Monit. Assess. 2016, 188, 352. [Google Scholar] [CrossRef] [PubMed]
- Yohannes, Y.B.; Ikenaka, Y.; Saengtiencha, A.; Watanabe, K.P.; Nakayama, S.M.M.; Ishizuka, M. Occurrence, distribution, and ecological risk assessment of DDTs and heavy metals in surface sediments from Lake Awassa—Ethiopian Rift Valley Lake. Environ. Sci. Pollut. Res. 2013, 20, 8663–8671. [Google Scholar] [CrossRef] [PubMed]
- Mohiuddin, K.M.; Alam, M.M.; Ahmed, I.; Chowdhury, A.K. Heavy metal pollution load in sediment samples of the Buriganga river in Bangladesh. J. Bangladesh Agric. Univ. 2015, 13, 229–238. [Google Scholar] [CrossRef]
- Romic, D.; Romic, M.; Zovko, M.; Bakic, H.; Ondrasek, G. Trace metals in the coastal soils developed from estuarine floodplain sediments in the Croatian Mediterranean region. Environ. Geochem. Health 2012, 34, 399–416. [Google Scholar] [CrossRef] [PubMed]
- Yi, J.Y.; Sun, J.; Tang, C.H.; Zhang, S.H. Ecological risk assessment of heavy metals in sediment in the upper reach of the Yangtze River. Environ. Sci. Pollut. Res. 2016, 23, 11002–11013. [Google Scholar] [CrossRef] [PubMed]
- Xu, D.; Wang, Y.; Zhang, R.; Guo, J.; Zhang, W.; Yu, K. Distribution, speciation, environmental risk, and source identification of heavy metals in surface sediments from the karst aquatic environment of the Lijiang River, Southwest China. Environ. Sci. Pollut. Res. 2016, 23, 9122–9133. [Google Scholar] [CrossRef] [PubMed]
- Zhang, W.G.; Feng, H.; Chang, J.N.; Qu, J.; Xie, H.; Yu, L. Heavy metal contamination in surface sediments of Yangtze River intertidal zone: An assessment from different indexes. Environ. Pollut. 2009, 157, 1533–1543. [Google Scholar] [CrossRef] [PubMed]
- Olivares-Rieumont, S.; De la Rosa, D.; Lima, L.; Graham, D.W.; Borroto, J.; Martínez, F.; Sanchez, J. Assessment of heavy metal levels in Almendares River sediments—Havana City, Cuba. Water Res. 2005, 39, 3945–3953. [Google Scholar] [CrossRef] [PubMed]
- Varol, M.; Şen, B. Assessment of nutrient and heavy metal contamination in surface water and sediments of the upper Tigris River, Turkey. Catena 2012, 92, 1–10. [Google Scholar] [CrossRef]
- Abdullah, M.; Fasola, M.; Muhammad, A.; Malik, S.A.; Boston, N.; Bokhari, H.; Kamran, M.A.; Shafqat, M.N.; Alamdar, A.; Khan, M.; et al. Avian feathers as a non-destructive bio-monitoring tool of trace metals signatures: A case study from severely contaminated areas. Chemosphere 2015, 119, 553–561. [Google Scholar] [CrossRef] [PubMed]
- Hanif, N.; Eqani, S.A.M.; Ali, S.M.; Cincinelli, A.; Ali, N.; Katsoyiannis, I.A.; Tanveer, Z.I.; Bokhari, H. Geo-accumulation and enrichment of trace metals in sediments and their associated risks in the Chenab River, Pakistan. J. Geochem. Explor. 2016, 165, 62–70. [Google Scholar] [CrossRef]
- Eqani, S.A.M.A.S.; Kanwal, A.; Ali, S.M.; Sohail, M.; Bhowmik, A.K.; Rizwan, U.; Alamdar, A.; Ali, N.; Fasola, M.; Shen, H. Spatial distribution of dust–bound trace metals from Pakistan and its implications for human exposure. Environ. Pollut. 2016, 213, 213–222. [Google Scholar] [CrossRef] [PubMed]
- Zhu, S.Q.; Zhang, X.P. Heavy metal pollution along the Yangtze River stretches of urban area in major cities. Yangtze River 2001, 32, 23–25. [Google Scholar]
- Ghrefat, H.A.; Abu-Rukah, Y.; Rosen, M.A. Application of geoaccumulation index and enrichment factor for assessing metal contamination in the sediments of Kafrain Dam, Jordan. Environ. Monit. Assess. 2011, 178, 95–109. [Google Scholar] [CrossRef] [PubMed]
- Li, H.M.; Qian, X.; Hu, W.; Wang, Y.L.; Gao, H.L. Chemical speciation and human health risk of trace metals in urban street dusts from a metropolitan city, Nanjing, South East China. Sci. Total Environ. 2013, 456–457, 212–221. [Google Scholar] [CrossRef] [PubMed]
- Varol, M. Assessment of heavy metal contamination in sediments of the Tigris River (Turkey) using pollution indices and multivariate statistical techniques. J. Hazard. Mater. 2011, 195, 355–364. [Google Scholar] [CrossRef] [PubMed]
- Yu, D.; Jiang, Y.; Kang, M.; Tian, Y.; Duan, J. Integrated urban landuse planning based on improving ecosystem service: Panyu case, in a typical developed area of China. J. Urban Plan. Dev. 2011, 137, 448–458. [Google Scholar] [CrossRef]
Figure 1.
Map of the study area and the specific sampling sites.

Figure 2.
Enrichment factor (EF) values of heavy metals at each sampling site.

Figure 3.
Dendrogram of the rescaled distance cluster combination of the variables (a) and the sampling sites based on similarity (b) using the Ward method.
Figure 3.
Dendrogram of the rescaled distance cluster combination of the variables (a) and the sampling sites based on similarity (b) using the Ward method.

Figure 4.
Summary of potential ecological risk index (ERI) values of Awash River Basin.


Table 1.
Descriptive statistics for analytical results of heavy metal contents (mg/kg) and total organic carbon (%) in sediments collected from 46 sampling sites (n = 138).
Table 1.
Descriptive statistics for analytical results of heavy metal contents (mg/kg) and total organic carbon (%) in sediments collected from 46 sampling sites (n = 138).
| Concentration | As | Cd | Cr | Cu | Pb | Hg | Ni | Zn | TOC (%) |
|---|---|---|---|---|---|---|---|---|---|
| Mean | 15.87 | 2.60 | 120.58 | 79.43 | 13.53 | 0.17 | 89.46 | 382.73 | 0.48 |
| Median | 0.00 | 2.43 | 90.22 | 67.94 | 18.45 | 0.10 | 68.19 | 357.50 | 0.13 |
| Min | N.D. | N.D. | 10.00 | 13.58 | 0.93 | N.D. | 33.64 | 142.44 | N.D. |
| Max | 67.42 | 8.35 | 712.67 | 939.21 | 67.72 | 9.02 | 928.85 | 1210.04 | 1.89 |
| SD | 15.54 | 1.48 | 270.10 | 236.67 | 11.83 | 1.41 | 255.78 | 265.64 | 0.551 |
| Ratio | N.A. | N.A. | 71.24 | 69.17 | 72.87 | N.A. | 28.67 | 8.49 | N.A. |
| BV | 13 | 0.30 | 90.00 | 45.00 | 20.00 | 0.40 | 68.00 | 95.00 | |
| % a > BV | 26.09 | 91.30 | 50 | 63.04 | 41.3 | 19.57 | 95.65 | 100.00 |
Note: BV = background value of average shale value [28], % a = % sites with mean > BV, , SD = standard deviation, N.D. = not detected, N.A. = not applicable.
Table 2.
Average heavy metal contents (mg/kg) in sediment from Awash River basin compared with aquatic environments from Ethiopia and other parts of the world.
Table 2.
Average heavy metal contents (mg/kg) in sediment from Awash River basin compared with aquatic environments from Ethiopia and other parts of the world.
| Region | As | Cd | Cr | Cu | Pb | Hg | Ni | Zn | References |
|---|---|---|---|---|---|---|---|---|---|
| Awash River basin, Ethiopia | 15.87 | 2.60 | 120.58 | 79.43 | 13.53 | 0.17 | 89.46 | 382.73 | This study |
| Lake Awassa, Ethiopia | 4.02 | 0.21 | 8.27 | 8.69 | 15.7 | 0.03 | 20.20 | 93.80 | [38] |
| Buriganga River, Bangladesh | N.A | 1.50 | 173.40 | 344.20 | 31.40 | N.A | 153.30 | 481.80 | [39] |
| Neretva River Valley, Croatia | N.A. | 0.31 | 42.10 | 55.10 | 15.50 | N.A. | N.A. | 58.70 | [40] |
| Yangtze River Basin, China | 8.79 | 0.93 | 80.04 | 65.80 | 51.01 | 0.10 | N.A. | 141.85 | [41] |
| Lijiang River, China | 18.05 | 1.72 | 56.38 | 38.07 | 51.54 | 0.18 | N.A. | 142.16 | [42] |
| Danube River, Germany | 17.60 | 1.20 | 64.00 | 65.70 | 46.30 | 0.22 | 49.6 | 187.00 | [43] |
| Almendares River, Cuba | N.A. | 3.47 | N.A. | 195.00 | 189.00 | N.A. | N.A. | 85.00 | [44] |
| Tigris River, Turkey | N.A. | 7.90 | N.A. | 2860.00 | 66.00 | N.A. | N.A. | 1061.00 | [45] |
Note: N.A. = not applicable.
Table 3.
Description of enrichment factor (%) in each pollution category for trace metals in Awash River basin.
Table 3.
Description of enrichment factor (%) in each pollution category for trace metals in Awash River basin.
| Metals | Percent Enrichment Factor (EF) Categories | Mean | Median | Range | ||||
|---|---|---|---|---|---|---|---|---|
| EF < 2 | 2 ≤ EF < 5 | 5 ≤ EF < 20 | 20 ≤ EF < 40 | EF > 40 | ||||
| As | 76.03 | 19.57 | 4.35 | - | - | 1.17 | N.D. | N.A.–7.86 |
| Cd | 8.70 | - | 52.17 | 30.43 | 8.70 | 19.18 | 16.04 | N.A.–53.17 |
| Cr | 50.00 | 15.22 | 17.39 | 17.39 | - | 8.31 | 1.93 | 0.23–37.87 |
| Cu | 17.39 | 56.52 | 15.22 | 8.70 | 2.17 | 6.10 | 2.94 | 0.54–43.03 |
| Pb | 60.87 | 32.61 | 6.52 | - | - | 2.10 | 1.66 | 0.09–7.83 |
| Hg | 89.13 | 4.35 | 6.52 | - | - | 0.11 | 0.34 | N.A.–19.23 |
| Ni | 41.30 | 43.48 | 8.70 | 6.52 | - | 4.88 | 2.21 | 0.70–27.52 |
| Zn | 15.22 | 84.78 | - | - | - | 9.37 | 8.93 | 3.14–19.09 |
Note: Mean, median, and range represent actual EF values, N.D. = not detected, N.A. = not applicable.
Table 4.
Pearson square correlation of heavy metals in sediment samples.
| As | Cd | Cr | Cu | Pb | Hg | Ni | Zn | TOC | |
|---|---|---|---|---|---|---|---|---|---|
| As | 1 | ||||||||
| Cd | −0.005 | 1 | |||||||
| Cr | −0.341 * | 0.055 | 1 | ||||||
| Cu | −0.021 | 0.525 ** | −0.278 | 1 | |||||
| Pb | −0.093 | −0.199 | 0.103 | −0.561 ** | 1 | ||||
| Hg | −0.027 | −0.330 * | −0.185 | −0.008 | −0.160 | 1 | |||
| Ni | −0.084 | 0.659 ** | −0.191 | 0.970 ** | −0.548 ** | −0.057 | |||
| Zn | 0.615 ** | 0.131 | −0.333 * | 0.001 | 0.074 | −0.233 | −0.058 | 1 | |
| TOC | 0.326 * | −0.092 | −0.380 ** | −0.280 | 0.435 ** | −0.233 | −0.327 * | 0.556 ** | 1 |
Note: ** Correlation is significant at the 0.01 level (two-tailed). * Correlation is significant at the 0.05 level (two-tailed).
Table 5.
Total variance and component matrices for the heavy metals in the surface sediment from the Awash River Basin.
Table 5.
Total variance and component matrices for the heavy metals in the surface sediment from the Awash River Basin.
| Parameters | Varimax Rotation | ||
|---|---|---|---|
| PC1 | PC2 | PC3 | |
| As | 0.014 | 0.774 | −0.062 |
| Cd | 0.612 | −0.002 | 0.621 |
| Cr | −0.252 | −0.701 | 0.340 |
| Cu | 0.944 | 0.048 | 0.058 |
| Pb | −0.729 | 0.043 | 0.296 |
| Hg | 0.052 | −0.066 | −0.865 |
| Ni | 0.958 | −0.043 | 0.159 |
| Zn | −0.038 | 0.830 | 0.254 |
| TOC | −0.410 | 0.703 | 0.254 |
| Eigenvalues | 2.995 | 2.298 | 1.450 |
| % of total variance | 33.28 | 25.54 | 16.11 |
| % of cumulative total variance | 33.28 | 58.82 | 74.93 |
Table 6.
Potential ecological risk indices of elements in sediments.
| Heavy Metals | Eri | ||
|---|---|---|---|
| Min | Mean | Max | |
| As | N.D. | 7.41 | 51.86 |
| Cd | N.D. | 254.64 | 835.49 |
| Cr | 0.22 | 5.73 | 20.32 |
| Cu | 1.51 | 17.16 | 104.36 |
| Pb | 0.30 | 4.65 | 18.90 |
| Hg | N.D. | 49.43 | 901.98 |
| Ni | 2.38 | 11.87 | 68.30 |
| Zn | 1.5 | 4.65 | 12.74 |
| ERI | 23.26 | 355.54 | 992.67 |
| * low | * high | * very high | |
Note: Eri is the index of environmental risk indices for each metal. ERI is the potential ecological risk index for sediment heavy metals in the study area. * = potential ecological risk, N.D. = not detected.
© 2018 by the authors. Licensee MDPI, Basel, Switzerland. This article is an open access article distributed under the terms and conditions of the Creative Commons Attribution (CC BY) license (http://creativecommons.org/licenses/by/4.0/).
Share and Cite
MDPI and ACS Style
Dirbaba, N.B.; Yan, X.; Wu, H.; Colebrooke, L.L.; Wang, J. Occurrences and Ecotoxicological Risk Assessment of Heavy Metals in Surface Sediments from Awash River Basin, Ethiopia. Water 2018, 10, 535. https://doi.org/10.3390/w10050535
AMA Style
Dirbaba NB, Yan X, Wu H, Colebrooke LL, Wang J. Occurrences and Ecotoxicological Risk Assessment of Heavy Metals in Surface Sediments from Awash River Basin, Ethiopia. Water. 2018; 10(5):535. https://doi.org/10.3390/w10050535
Chicago/Turabian StyleDirbaba, Niguse Bekele, Xue Yan, Hongjuan Wu, Luanettee’ Lydia Colebrooke, and Jun Wang. 2018. "Occurrences and Ecotoxicological Risk Assessment of Heavy Metals in Surface Sediments from Awash River Basin, Ethiopia" Water 10, no. 5: 535. https://doi.org/10.3390/w10050535
Note that from the first issue of 2016, this journal uses article numbers instead of page numbers. See further details here.