Effect of Sand Mulches of Different Particle Sizes on Soil Evaporation during the Freeze–Thaw Period
by
 ,
,
Huijun Feng
1, 
Junfeng Chen
1,*,
Xiuqing Zheng
1,*,
Jing Xue
1,
Chunyan Miao
1,2,
Qi Du
3 and
Yongxin Xu
1,4 1
College of Water Resources Science and Engineering, Taiyuan University of Technology, Taiyuan 030024, China
2
First Hydrogeology and Engineering Geology Team of Shanxi Province, Taiyuan 030024, China
3
Taigu Water Balance Experimental Field, Bureau of Hydrology and Water Resources Survey of Shanxi Province, Taigu 030800, China
4
Department of Earth Sciences, University of the Western Cape, Private Bag X17, Bellville, Cape Town 7535, South Africa
*
Authors to whom correspondence should be addressed.
Water 2018, 10(5), 536; https://doi.org/10.3390/w10050536
Submission received: 18 March 2018
/
Revised: 12 April 2018
/
Accepted: 20 April 2018
/
Published: 24 April 2018
(This article belongs to the Section Water Resources Management, Policy and Governance)
Abstract
:Reducing ineffective evaporation is a feasible means to improve water use efficiency in agriculture, especially in arid and semi-arid areas. A field experiment assessed the impact of sand mulches (1-cm thickness) with a particle size of 0.5–1.5 mm (XS) and 1.5–2.0 mm (CS) on soil evaporation during winter in Northern China. Results showed that CS and XS increased by at least 11.93% and 14.92% compared to bare soil (LD), respectively. However, the sand mulches showed significant distinctions in soil evaporation at different stages. Soil evaporation was the highest in LD, while CS evaporated the least in the unstable freezing stage (P1) and stable freezing stage (P2); in the thawing stage (P3), XS evaporated the most, while LD evaporated the least. Ten factors affecting evaporation were analyzed using the principal component analysis method to elaborate the mechanisms of soil evaporation. Mean soil moisture at depths from 0 to 15 cm was a factor that affected the evaporation of XS and CS in the test. Soil moisture was evaporated by vapor when the frost penetration was dense and the frost impeded the vapor movement. The evaporation rates were steady and weak in this period, and soil moisture had slight impact on soil evaporation, especially XS and CS treatment with higher water content at the surface. The research is significant for preventing evaporation and the improvement of water-use efficiency.
1. Introduction
Seasonally frozen soil is primarily distributed in the arid and semi-arid areas, at the northern latitude above 30°, where most precipitation is lost by evaporation, especially in the Loess Plateau, China [1,2,3]. The mean precipitation on the Plateau is only 388.9 mm, while the annual surface evaporation capacity is up to 1500–2000 mm [4,5]. The agricultural production is usually restricted by drought and water resource deficiencies. Therefore, reducing soil evaporation to improve water-use efficiency is one of the best available means to alleviate the severe water scarcity for agriculture. Some techniques were and are still applied to address this problem, such as covering the soil surface with different materials, which involved sand, gravel, plastic, pine bark grass clippings, leaf debris and straw mulches [6,7,8,9,10,11,12,13,14]. Covering surfaces with mulches can prevent soil evaporation, adjust the soil temperature, and alleviate soil salinization to some extent [15,16]. However, most experiments were conducted in the non-freeze period without freezing and thawing cycles, and few studies have assessed soil evaporation during the freeze–thaw period with sand mulches.
Mulches with different grain sizes, thickness, color and combinations have a significant effect on the suppression of evaporation. Some research has found that gravel mulches hamper the capillary force to limit liquid water moving up into the pores between gravel, leading to a reduced evaporation capacity with decreasing gravel sizes and increasing thickness [17,18]. However, not all thicker layers are more effective in preventing evaporation. Qiu et al. [19] found that the difference in cumulative evaporation between a thickness of 8 cm and 10 cm was slight. Fekri and Kasmaei [20] noted that the most effective thickness was 3 cm in their experiments. Therefore, there is no consensus as to the adequate thickness of the mulches. Sand has a low water-holding capability, high saturated hydraulic conductivity and low unsaturated hydraulic conductivity relative to soil; an unsaturated sand mulch will restrict the water from upward movement, reducing evaporation. Sand mulches are often used in arid and semi-arid areas, but not all sand mulches are effective at suppressing evaporation. The research found that the liquid-phase between mulch and air easily occurs due to sufficient capillary force when the particle size was less than 0.1 mm in diameter [21]. Fine sand particles are also more susceptible to being drifted by wind, which influences the effect of mulching. Additionally, Modaihsh et al. [21] also pointed out that coarse sand (0.2–0.3 mm) was slightly more effective than fine sand (0.1–0.15 mm). Kemper et al. [22] and Jiménez et al. [23] reported that a relatively thick surface layer of sand of light color had a greater reductive effect on evaporation. The investigation of soil evaporation under sand mulch during non-freeze periods has demonstrated that soil evaporation has to some extent declined with the increasing thickness of mulching and particle size.
In recent years, more attention had been paid to evaporation in the arid and semi-arid areas of northern China during crop growth, and less to overwintering [24,25,26,27,28]. Chen et al. [29] applied the simultaneous heat and water model to simulate soil evaporation with different groundwater table depths. Wu et al. [30] estimated evaporation with various water and solute conditions using the mass balance method in Inner Mongolia, China. When moisture is not completely frozen or frost begins to melt, the liquid water content at the surface is higher and the evaporation rate is also larger than that of the completely frozen period. Therefore, higher evaporation quantities were maintained at the beginning and the end of experiments, while relatively lower values occurred when the soil was deeply frozen. In summary, most research into soil evaporation with different sand mulches has been chiefly conducted in the non-frozen period, with less research performed during the freeze–thaw period.
Shanxi Province is located in a seasonally frozen area with the planting of winter wheat, and winter or spring irrigation is usually performed. Preventing evaporation to improve water-use efficiency could facilitate crop production during this period. However, it is difficult to monitor soil evaporation during the freeze–thaw period due to the complex evaporative process triggered by the phase transition of soil moisture [31,32]. Additionally, the general methods used in the non-freeze period are not applicable in the freezing period, and the existing results are relatively weak [33,34]. This means that we need to find optimizing ways to reduce soil evaporation during the freeze–thaw period to increase water-use efficiency and alleviate the contradictions in water resources.
The objectives of this paper are (a) to confirm whether sand mulches prevent soil evaporation during the freeze–thaw period; (b) to explore the main factors affecting evaporation in different freeze–thaw stages; and (c) to analyze the mechanism of soil evaporation during the freeze–thaw period.
2. Materials and Methods
2.1. Experimental Site
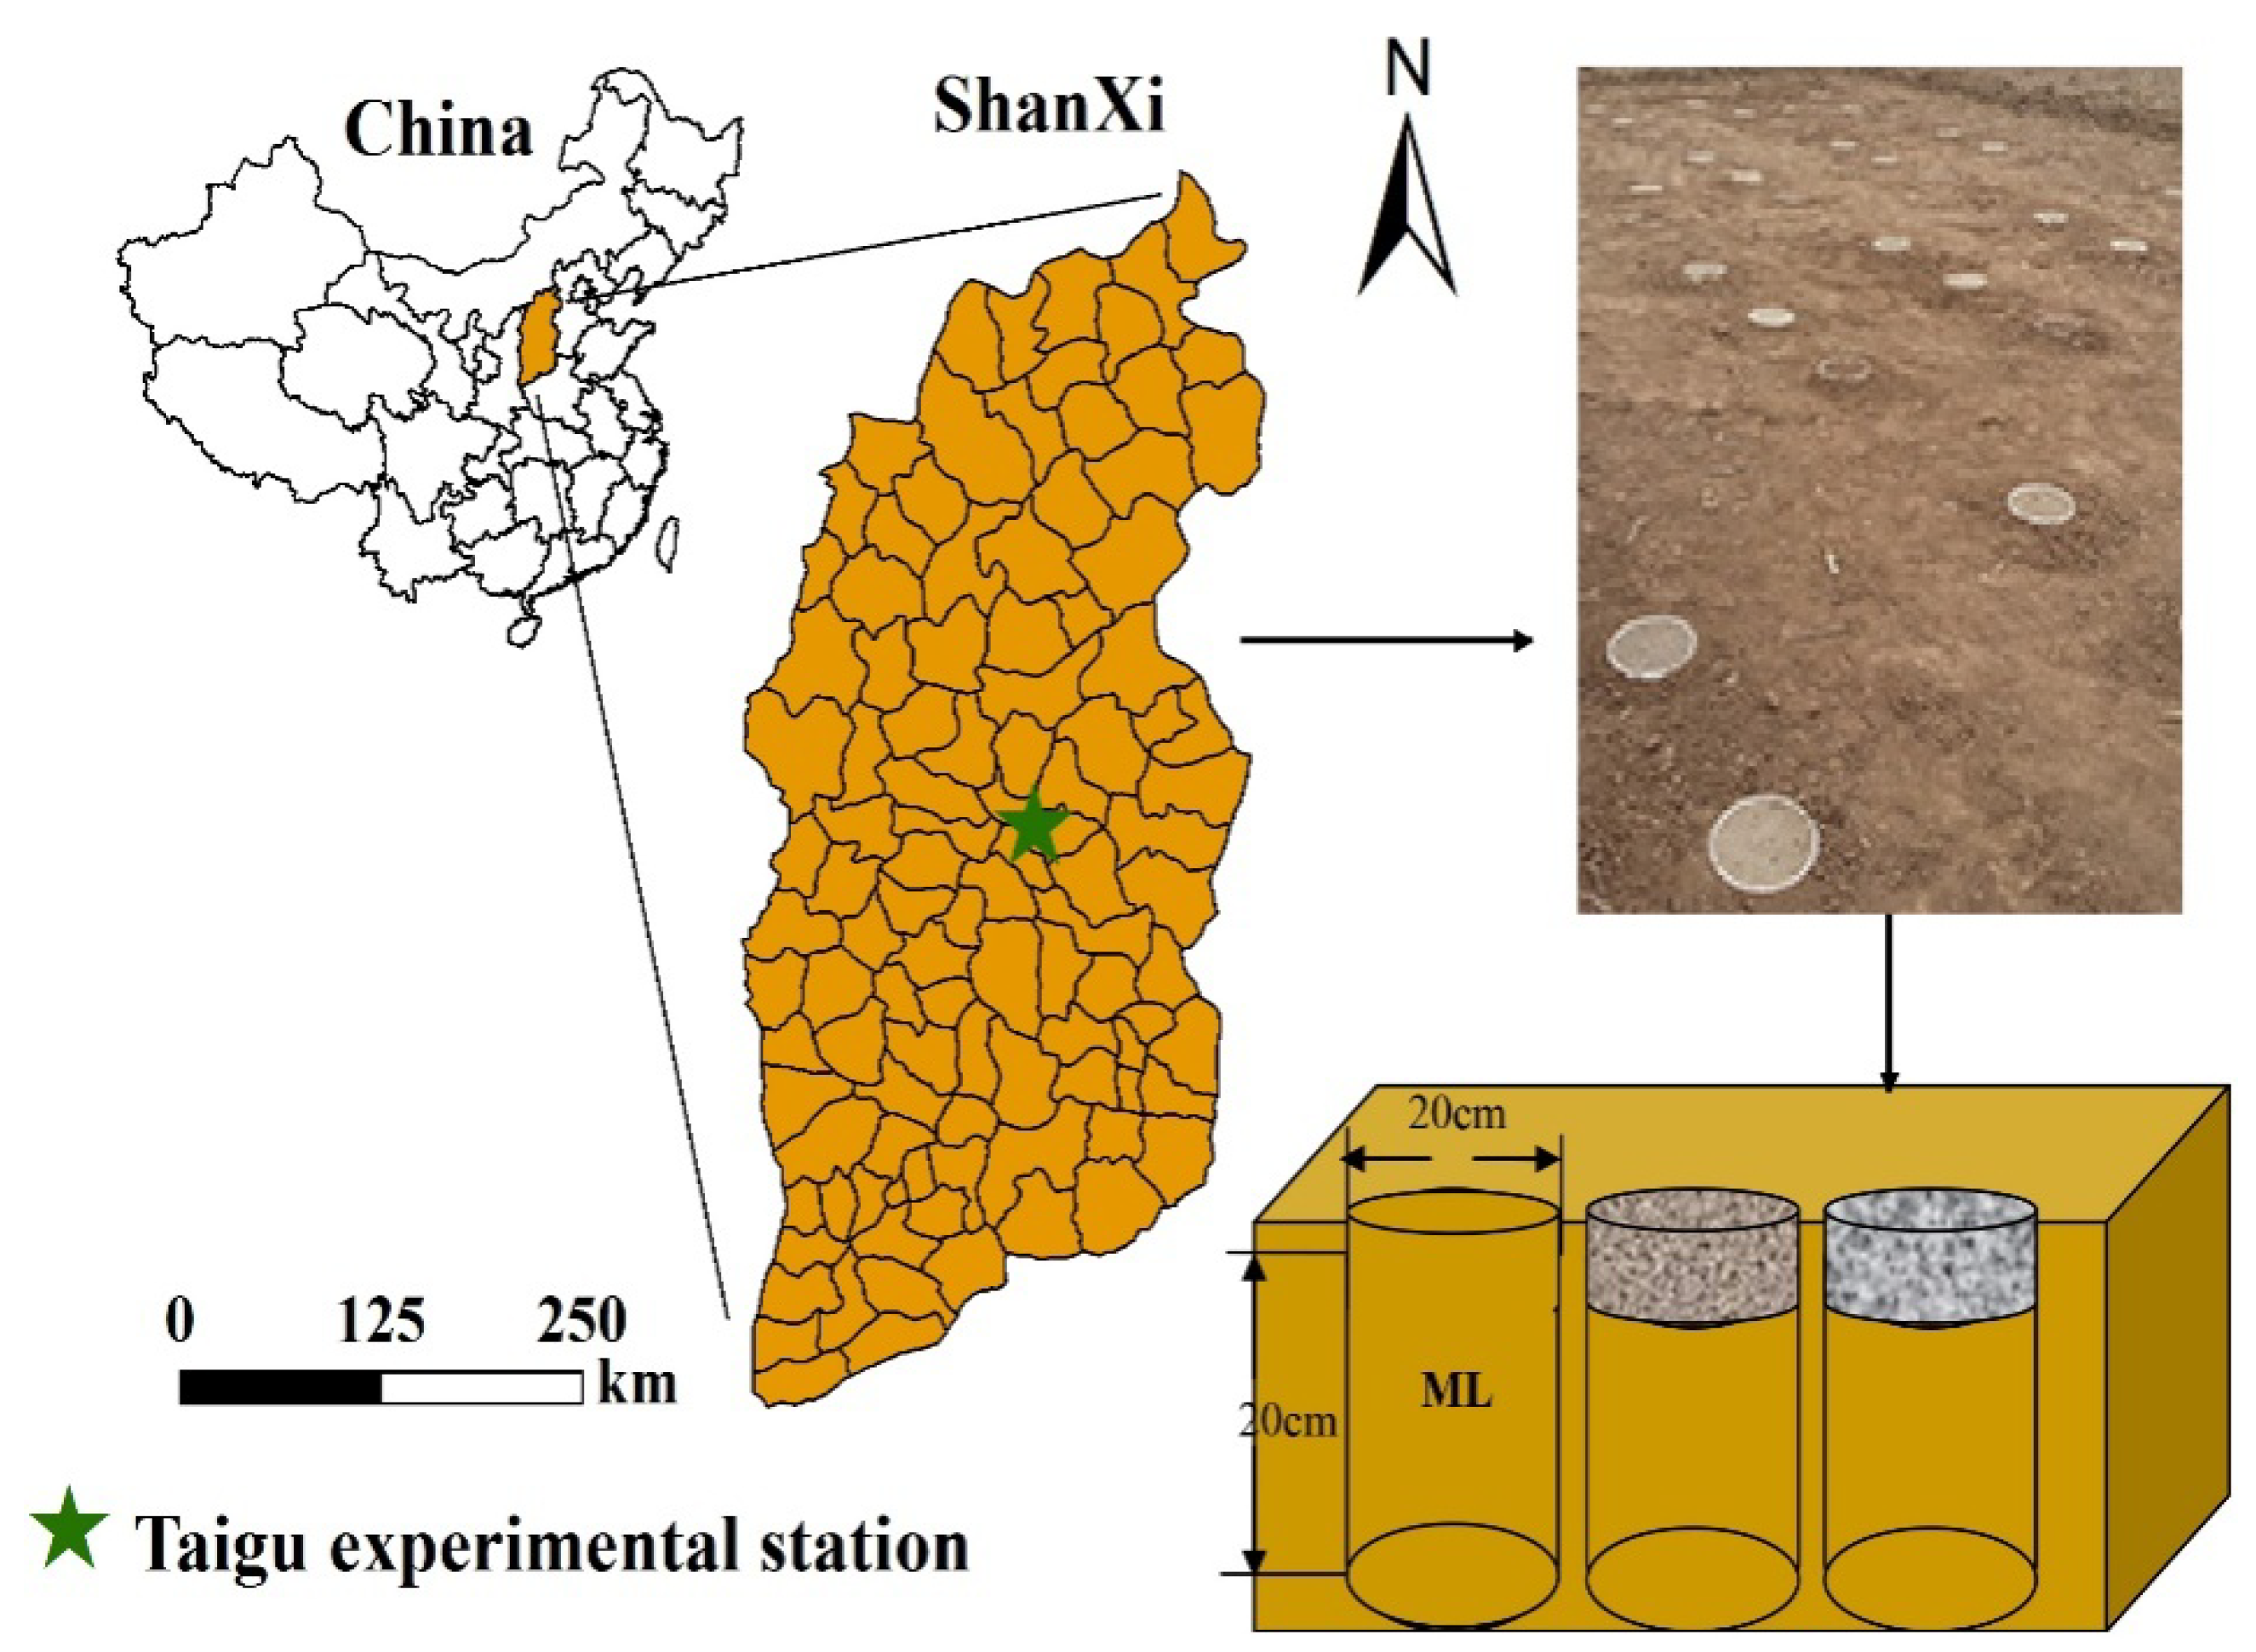
This study assessed soil evaporation from November 2016 to March 2017 in the Taigu Water Balance Experimental Field (37°26′–37°27′ N, 112°30′–112°33′ E), Shanxi Province, China. Taigu is located in the east of Jinzhong Basin, which is on the alluvial plain of Fenhe River. The location of the Taigu Water Balance Experimental Field is shown in Figure 1. The area is characterized by a continental semi-arid climate with groungwater table depth of 25.0 m, average annual water surface evaporation potential of 1542.4 mm and an annual precipitation of 415.2 mm. The annual average frost-free period is about 200 days in this region. The observed maximum soil frost depth was 92 cm in 1960. The experiment was conducted in a fallow plot with an area of 8 × 11 m2. The duration of freezing and thawing was approximately 128 d for the whole test. The soil physical properties at the experimental site are shown in Table 1.
2.2. Sampling and Measurements
Three treatments were designed: (1) bare soil (LD); (2) sand mulch with a particle size of 0.5–1.5 mm and a thickness of 1 cm (XS); and (3) sand mulch with a particle size of 1.5–2.0 mm and thickness of 1 cm (CS). Soil evaporation was monitored through consecutive weighing using micro-lysimeters. The micro-lysimeter, with an inner diameter of 200 mm, a thickness of 4 mm and length of 200 mm, was manufactured using polyvinyl chloride (PVC). Pedestals were also made from PVC, with an inner diameter of 200 mm and height of 35 mm, used to seal the bottom of the micro-lysimeter. Before the experiment, 60 micro-lysimeters (20 groups), were embedded in the field at intervals of about one meter, without being sealed with pedestals.
Evaporation was measured approximately at intervals of seven days by an electronic scale with a range of 15 kg and a sensitivity of 0.1 g at 8:00–9:00 h. The bottom of the micro-lysimeters were sealed with pedestals after the initial weighing, and then buried in the original position until the next weighing. Assuming that the moisture exchange quantities in this period were zero, the difference between the two weighing values was thus considered to be the soil evaporation in this period. Sand samples were prepared before the experiment. The air-dried sand was passed through a 2-mm sieve to select particle sizes of 0.5–1.5 mm and 1.5–2.0 mm to put onto the soil surface in the micro-lysimeters as mulches with a thickness of 1 cm.
Soil samples were obtained at 5-cm depths using a soil auger after the second weighing, and stored in an aluminum specimen box to measure the soil water content, with depths of 0, 5, 10, 15, 20, 25, 30, 35, 40, 45, 50, 60, 70, 80, 90 and 100 cm. Partial samples were obtained in the micro-lysimeters at depths of 0, 5, 10, 15 and 20 cm. Other samples were obtained in the plot at depths from 20 to 100 cm below the micro-lysimeters. The soil water content was calculated using the oven-drying method (drying in the oven at 105 °C for 8 h).
The soil temperature was measured by thermistors, which were buried at depths of 0, 5, 10 and 15 cm in micro-lysimeters. The meteorological data for the period of the experiment—including air temperature, soil temperature, frost depth, wind speed, precipitation, water surface evaporation, vapor pressure, relative humidity and sunshine hours—were measured by the automatic weather station at the Taigu Water Balance Experimental Field.
2.3. Calculation of Evaporation from the Micro-Lysimeter
The initial and final masses of the micro-lysimeters were recorded as M1 (g) and M2 (g), and the cumulative evaporation capacity in this interval could be calculated by the following equation:
where Ei is the evaporation value for a period, mm; i indicates the sample time (i = 1, 2, …, 19); r represents the diameter of micro-lysimeters, cm; and is the density of water, g/cm3.
The evaporation rate at any period was calculated by the following equation:
where Ti is the number of days corresponding to Ei, d.
3. Results and Discussion
3.1. Frost Depth, Precipitation and Air Temperature
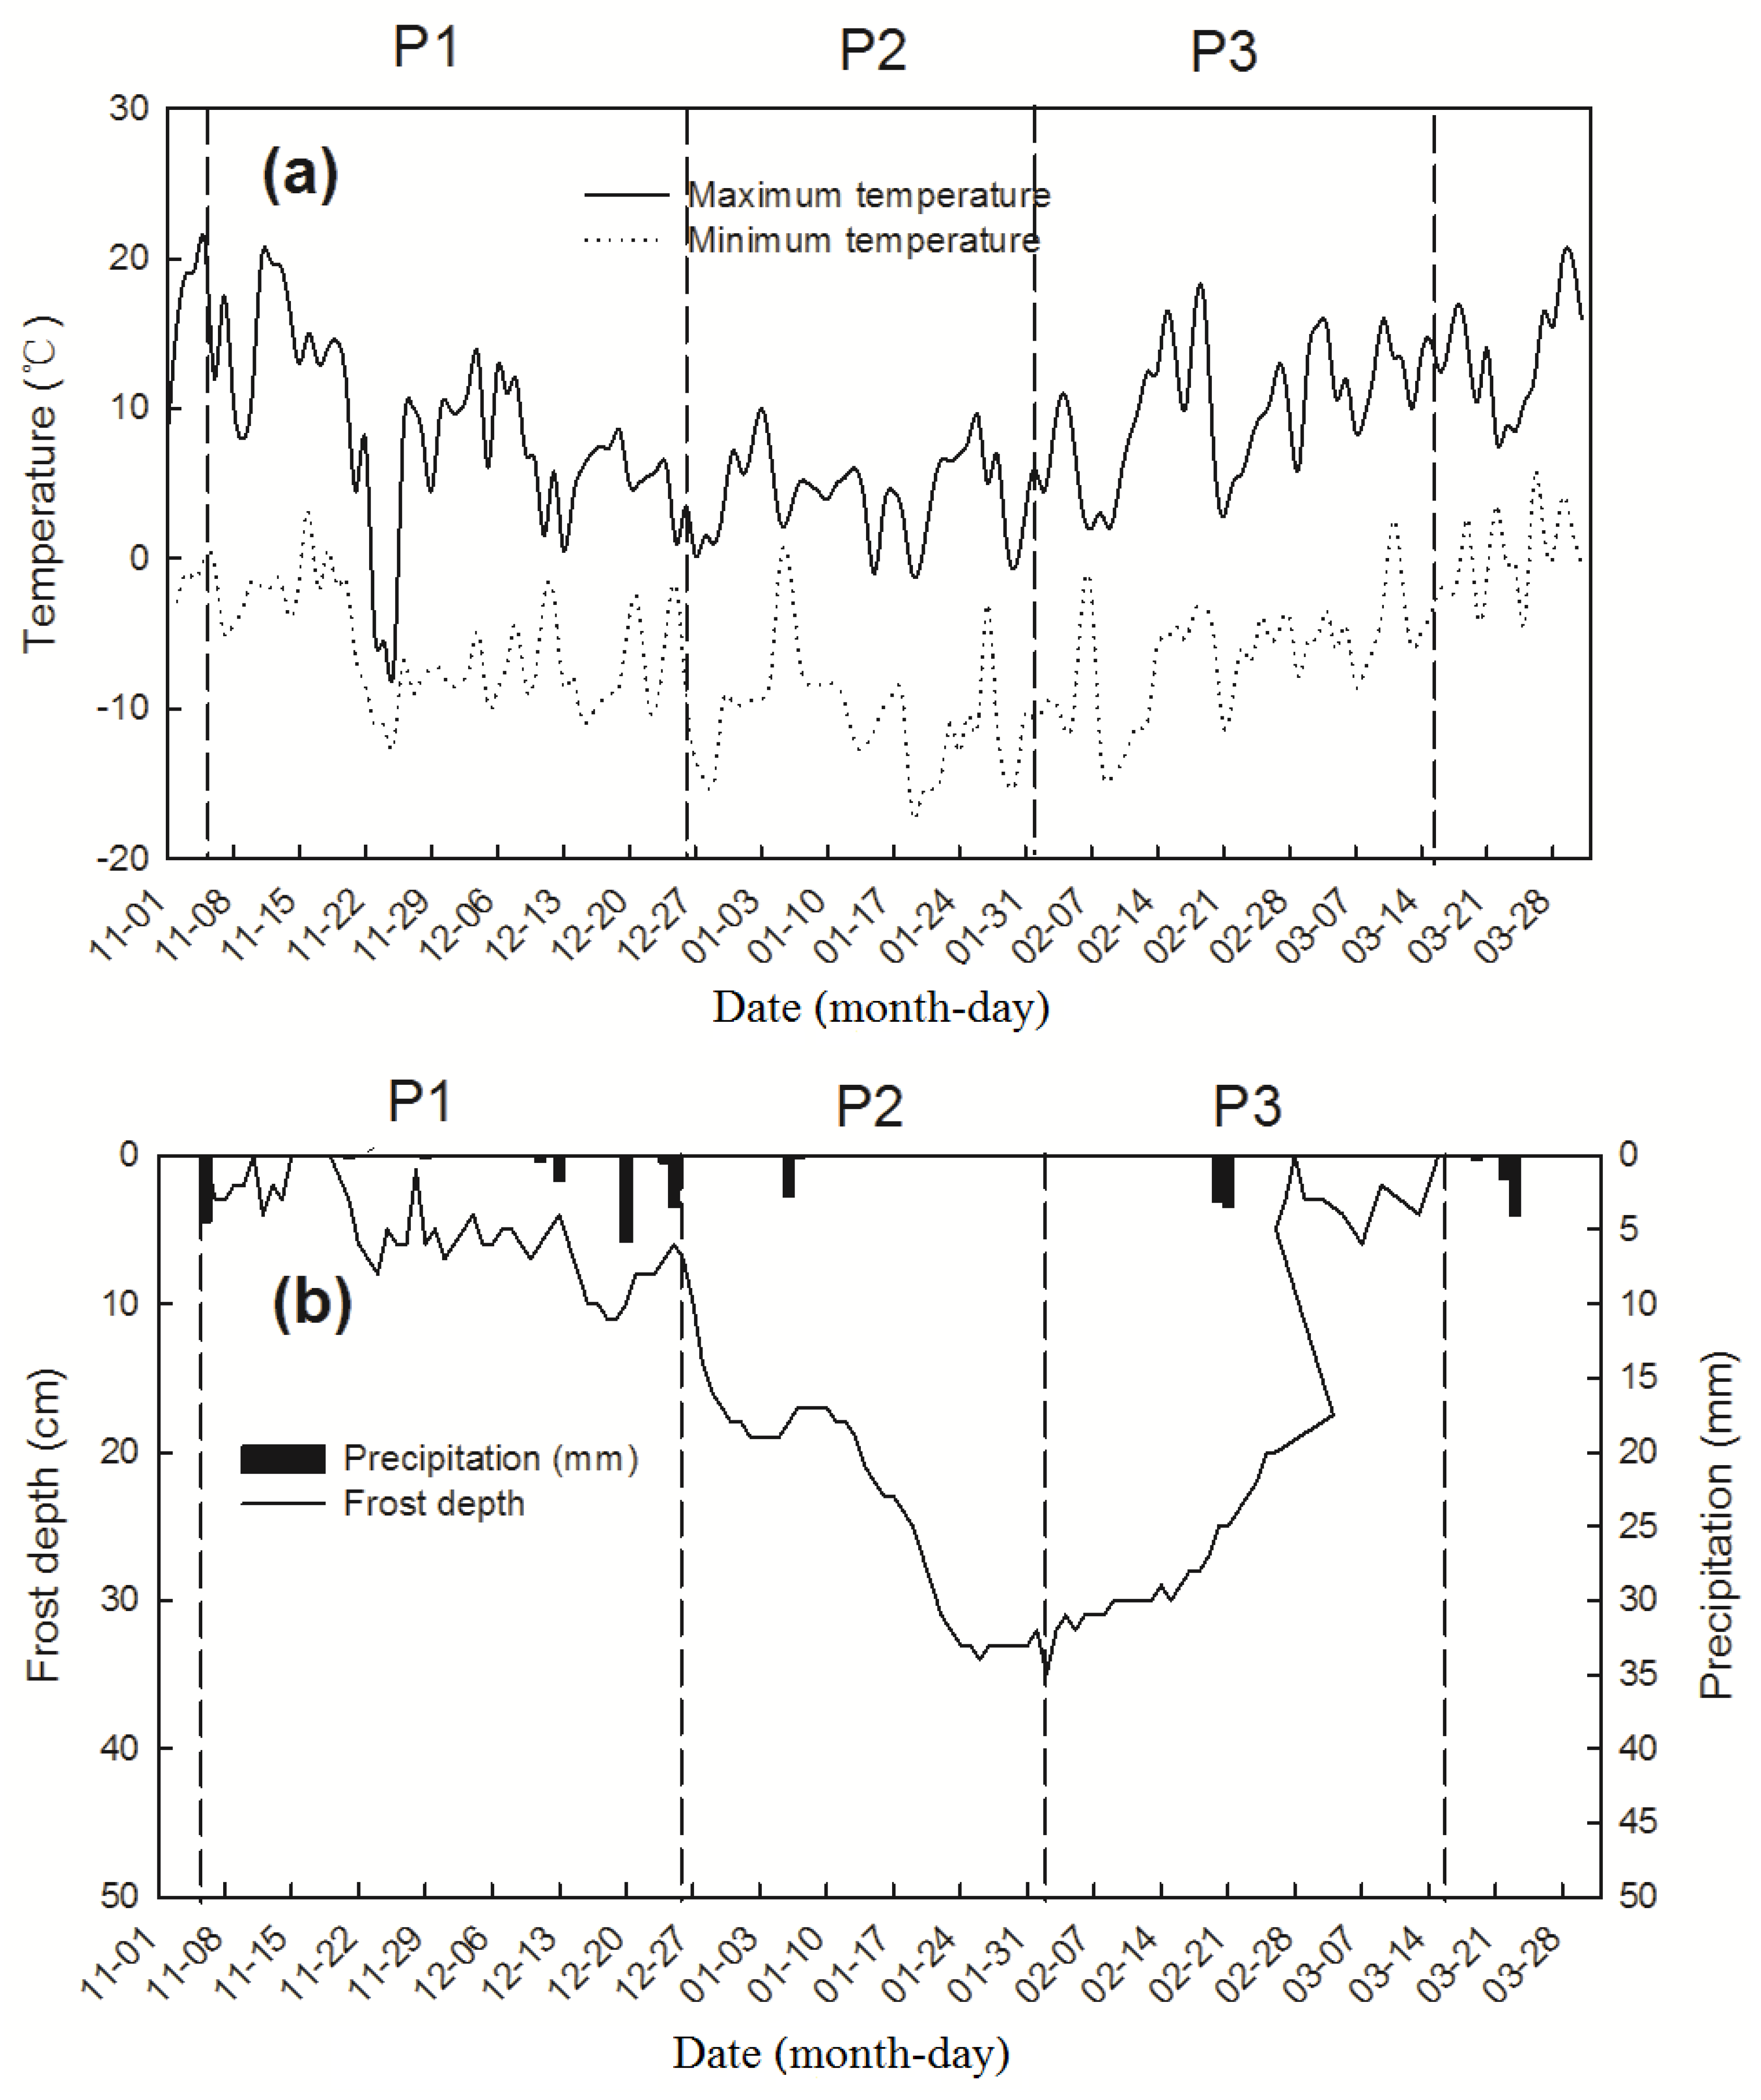
The soil freezing and thawing process was divided into three stages according to the freeze–thaw characteristics in the field (Figure 2): P1 was the unstable freezing stage between 7 November 2016 and 26 December 2016, P2 was a stable freezing stage from 27 December 2016 to 2 February 2017 and P3 was a thawing stage between 3 February 2017 and 15 March 2017. In P1, the frost depth was shallow and unstable with frequent fluctuations, and the maximum frost depth was less than 10 cm. During P2, the frost developed stably and rapidly downward with a maximum freezing rate of 3 cm/d. In P3, the surface suffered diurnal cycles (thawing by day and freezing at night), frost started to thaw downward from the surface and upward from the bottom, with a shorter thawing than freezing time. The date of complete soil thaw was 15 March 2017.
There were 15 precipitation events during the entire experiment, mostly in the form of sleet and little snow cover, with a total amount of 26.2 mm. The changes between the minimum and maximum air temperature are shown in Figure 2, indicating consistent changes between the two air temperatures during the freeze–thaw period. However, the daily difference between the two curves was large, with a fluctuation range of 2.9–22.4 °C. Additionally, the daily maximum air temperature was slightly above 0 °C, except for individual days (1 January, 19 January and 29 January) and the daily minimum air temperature fluctuated in the vicinity of 0 °C. The diurnal changes in air temperature indicated that the daily freeze–thaw cycles occurred frequently in the experiment.
Combined with the curves of air temperature and frost depth, the frost depth fluctuated with the air temperature in the P1. During P2, the frost developed steadily downward with decreasing air temperature, with an obviously higher freezing velocity than P1. The maximum frozen depth was 35 cm when the daily average temperature reached the minimum value in the test. In P3, the air temperature increased rapidly and the soil surface underwent diurnal cycles at this time.
3.2. Soil Evaporation in the Micro-Lysimeter under Sand Mulches with Different Particle Sizes
3.2.1. Cumulative Evaporation
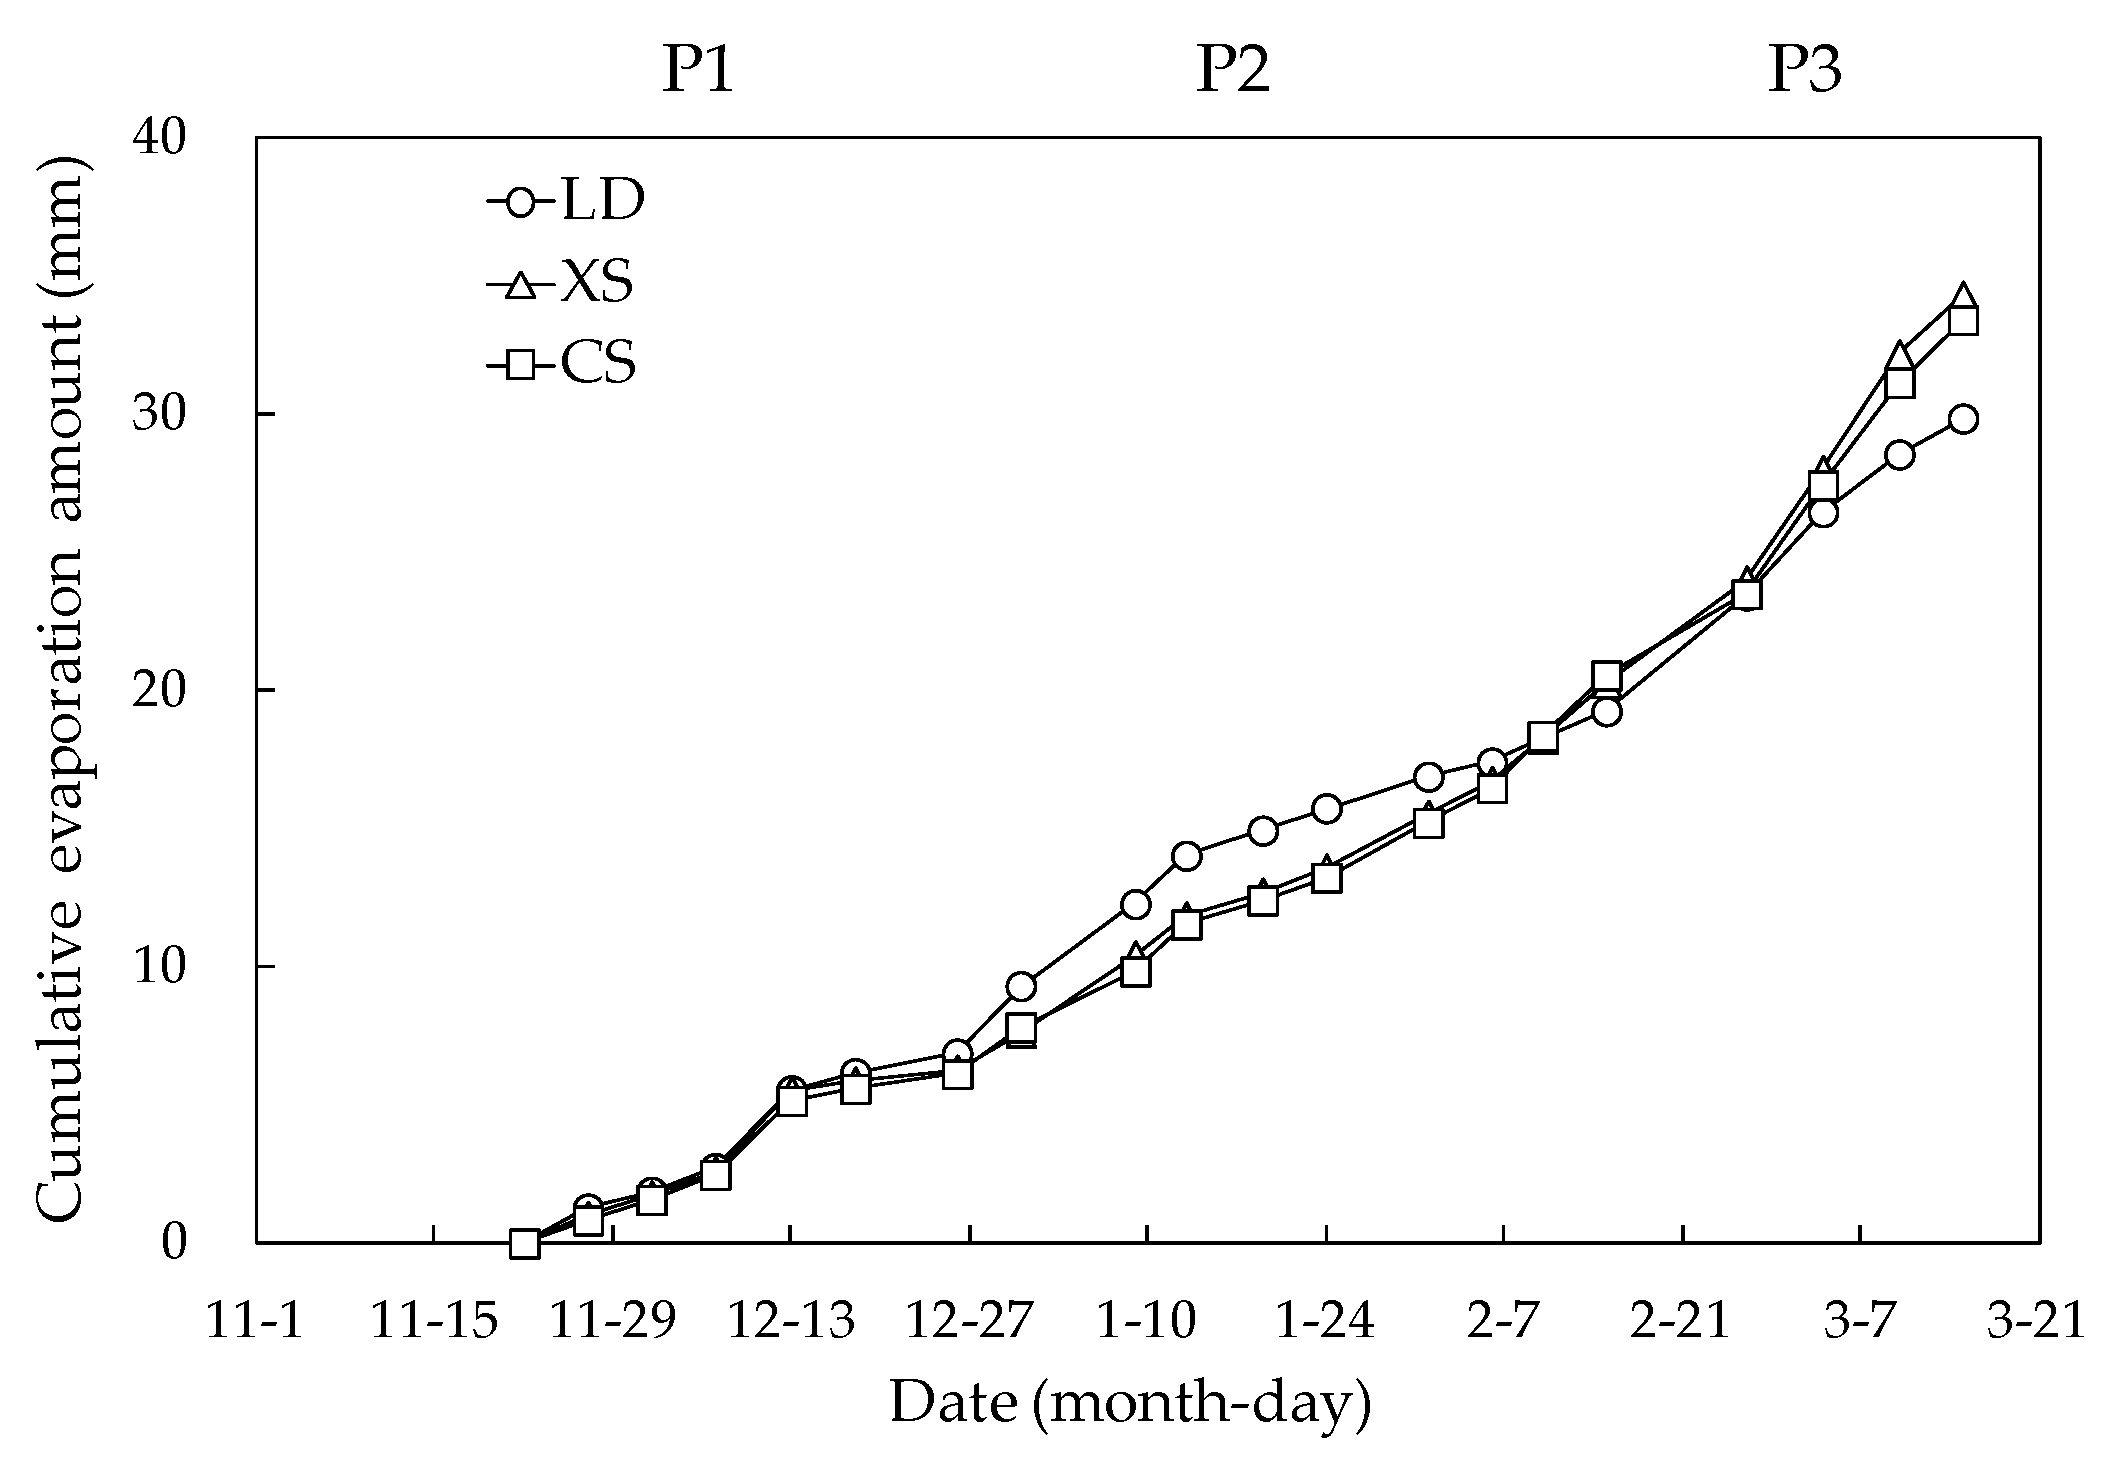
The total evaporation of the LD, XS, and CS treatments over all three stages were 29.87, 34.33 and 33.43 mm, respectively (Figure 3). The evaporation of CS and XS increased by 11.93% and 14.92% over that of bare soil. The evaporation of the three treatments at different stages is shown in Figure 4. In P1, LD experienced the most evaporation, with a value of 6.88 mm accounting for 23.02% of the total evaporation. Sand mulch interrupted the capillary force and transformed the path of the water upward, the vapor escaped into the atmosphere merely through the pore space of the sand mulches, and was partially trapped in the mulches by molecular attraction [18,19]. Thus soil with CS mulches experienced the least evaporation, accounting for 18.33% of total evaporation (6.13 mm). Meanwhile, the average surface temperature of LD was 0.47 °C higher than that of XS and 0.22 °C higher than that of CS, and had relatively higher heat energy for evaporation. Modaihsh et al. [21] found that coarse sand was more effective in preventing soil evaporation when particle sizes are smaller, and the result in P1 was consistent with these findings. XS evaporated 6.30 mm, slightly more than CS. The sand mulches with particle sizes of 0.5–1.5 mm and 1.5–2.0 mm were able to prevent soil evaporation in P1, and the difference was slight.
In P2, the energy supplied to evaporation and vaporization was dramatically reduced with the decreasing solar radiation. The dense frost penetration hindered the infiltration of snowmelt and water movement, and the moisture evaporated in the form of water vapor. The paths of vapor diffusion from the sand mulches to the atmosphere were lengthened, and the mostly weak vapor diffusion in the pore space of the sand mulches was typically high, preventing evaporation from the soil surface and leading to lower evaporation than that of the LD treatment [21]. CS evaporated the least, with a value of 9.09 mm, while LD evaporated the most, with a value of 10.02 mm. The percentage of total evaporation was 33.56% for LD, 26.89% for XS and 27.19% for CS. The results indicate that sand mulches with particle sizes of 0.5–1.5 mm and 1.5–2.0 mm were able to prevent soil evaporation in P2, and relatively coarse particle sizes were more effective.
In P3, the liquid water content was increased with the increasing air temperature [29,30]. The sand mulches stored moisture on the surface, leading to more liquid water than in the LD treatment. The soil evaporation was 12.97 mm for LD, 18.80 mm for XS and 18.21 mm for CS, respectively, with a larger percentage than that of the previous stage, for which the results were 43.23% (LD), 54.77% (XS) and 54.47% (CS). The maximum difference in amount also occurred in this stage. Sand mulches with particle sizes of 0.5–1.5 mm and 1.5–2.0 mm were not able to prevent soil evaporation in P3; it is necessary to find a mulching treatment that can inhibit evaporation in all three stages.
The regression of the cumulative evaporation versus time were fitted by linear equation (E = a + bt), exponential equation (E = aebt) and power function (E = atb). The parameters are shown in Table 2. The determination coefficients of the linear equation, exponential equation and power function equation were 0.94, 0.77 and 0.99. The equations E = atb and E = a + bt were fitted better than the exponential equation. The power function, which had the best accuracy, could be used to simulate the change of cumulative evaporation during the freeze–thaw period.
3.2.2. Evaporation Rate
The evaporation rates under different sand mulches during the freeze–thaw period are shown in Table 3. The average evaporation rate for all three stages was 0.323 mm·d−1 for LD treatment, 0.359 mm·d−1 for XS treatment and 0.349 mm·d−1 for CS treatment. In P1, the sand layer weakened the solar radiation, which directly reached the soil surface and lessened the heat of liquid water vaporization [18,19]. The hydraulic conductivity gradually decreased with the reducing liquid water content, thus the evaporation rates of the sand mulches in P1 were less than for LD. CS treatment had the lowest evaporation rate, with a value of 0.270 mm·d−1, while LD had the largest evaporation rate (0.297 mm·d−1). The reduction was 5.41% for the XS treatment and 9.08% for the CS treatment compared with LD. The sand mulches reduced evaporation and the effect was related to the particle size in P1.
In the P2, the unsaturated hydraulic conductivity was reduced and close to 0 with the downward development of frost. The soil moisture evaporated by vapor diffusion and the evaporation rate did not change with the potential evaporation. The evaporation rate of XS and CS reached the lowest values of the whole freeze–thaw period, namely 0.263 and 0.268 mm·d−1. The evaporation rate of XS and CS decreased by 12.62% and 10.96% more than that of LD treatment. Soil with CS mulches effectively inhibited soil evaporation in P2.
The winter of 2016–2017 was characterized by low intensity and sustained precipitation, mostly in the form of snow-sleet and without complete snow cover. When the rainfall reached the surface, some of the moisture rapidly evaporated and the residual infiltrated [35,36]. With the cover thickness of 1 cm, the soil water content of XS and CS, 18.46 and 16.38 cm3·cm−3, respectively, were relatively higher than the soil water content of LD (6.44 cm3·cm−3). Melting frost provided a large amount of liquid water for evaporation, especially the sand mulches, possessing a larger evaporation capacity than the LD treatment. Therefore, the larger soil water supply capacity of the sand mulch increased evaporation at this stage. The evaporation rate was 0.366 mm·d−1 for LD, 0.507 mm·d−1 for XS mulches and 0.485 mm·d−1 for CS treatment, respectively. The evaporation rate of XS and CS increased by 38.52% and 32.51% over that of LD treatment.
The evaporation rates of LD, XS and CS were obviously higher in P3 and lower in P1, the differences between P1 and P3 were 0.069 (LD), 0.226 (XS) and 0.215 mm·d−1 (CS), respectively. During the experiment, the greatest precipitation occurred on 13 December, 26 December, 9 January, 13 January and 26 February. Therefore, greater evaporation also occurred on or near these days, thus the evaporation rate on 13 December was 0.940 mm·d−1 for the LD treatment.
3.3. Factors That Influence Soil Evaporation
The principal component analysis (PCA) method was applied to investigate the main factors affecting the evaporation at different stages during the freeze–thaw period using SPSS18.0 [37,38]. In this paper, 10 factors were selected, involving solar radiation (x1), average air temperature (x2), average soil temperature (x3), mean soil moisture at depths from 0 to 15 cm (x4), mean soil moisture at depths from 15 to 30 cm (x5), wind speed (x6), average vapor pressure (x7), average relative humidity (x8), precipitation (x9) and water surface evaporation (x10). The factors of x1, x2 and x3 were temperature indices, and x4 and x5 were moisture indices.
When the cumulative contribution was equal to or greater than 85% and the eigenvalue was more than 1, the former “m” principal components were selected to substitute all information. The former “m” principal component equations were composed of 10 factors to reflect the effect of the factors on soil evaporation according to the magnitude of the coefficient. The choice of primary factors also needed to consider the contribution rate of every principal component. The eigenvalues of the principal components and cumulative contribution rates are shown in Table A1. The coefficients of the factors are shown in Table A2.
3.3.1. Unstable Freezing Stage
For the LD treatment, the former three principal components, with a cumulative contribution rate of 90.87% (>85%), could be used to replace all information. For f1 (linear combination of the original variables for the first component), the large coefficients of absolute values (x1, x3, x4, x7, x9 and x10) reflect the largest contribution of the principal component. Other factors promoted evaporation, except for x4 and x9. In P1, the soil moisture for evaporation decreased with the gradually reducing liquid water on the surface and then affected the evaporation rate. The f1 was considered as a comprehensive efficiency index for soil evaporation. For f2 (linear combination of the original variables for the second component), x5 had the largest coefficient (0.56) and could be used to reflect the effect of mean soil moisture at depths from 15 to 30 cm. For f3 (linear combination of the original variables for the third component), x8 could be used to reflect the effect of average relative humidity on soil evaporation. The variance contribution of f1 accounted for 44.60%, constituting a larger impact on evaporation. The f2 and f3 accounted for only 26.12% and 20.15%, respectively, with little effect. Therefore, f1 was considered as the main component in P1.
The main factors involved were water surface evaporation, precipitation, temperature indices, vapor pressure and mean soil moisture at depths from 0 to 15 cm. Sand mulches altered the albedo of the surface and affected the absorption of solar radiation. Except for the temperature indices, the main factors of the LD, XS and CS treatments were alike. Based on the results of the principal component analysis, the evaporation variations at different stages were the result of the comprehensive effect of multiple factors [39]. In the unstable freezing stage, the decreasing solar radiation caused the air temperature and soil temperature to fluctuate in the vicinity of 0 °C. When the soil temperature dropped to the freezing point, the soil moisture started to freeze. Meanwhile, the decreasing air temperature reduced the water vapor diffusive rate and reduced the saturation water vapor in the atmosphere, further affecting the evaporation rate [40]. Therefore, temperature indices were the main factors for the three treatments that affected soil evaporation in P1. The water lost through soil evaporation could be fully replenished by the moisture of lower layers at this stage. The evaporation rate in P1 was relatively stable and was affected by meteorological factors [41]. Additionally, the soil evaporation was also affected by precipitation. When precipitation occurred, the soil evaporation rate sharply increased.
3.3.2. Stable Freezing Stage
The main factors of the LD treatment constituted average relative humidity, precipitation, temperature indices, vapor pressure and mean soil moisture at depths from 0 to 15 cm. In this stage, the unsaturated hydraulic conductivity also continuously decreased along with the declining liquid water content, which caused the evaporation supply to be reduced. The evaporation rate was also related to the tortuosity and length of the path through which the water vapor passed. Internal factors, such as soil water supply, gradually became the chief factors that affected the evaporation intensity [42]. When the soil surface was completely frozen and the frost developed stably and rapidly, soil evaporation was lost by water vapor diffusion at a steady rate due to the vaporization layer extending downward. The evaporation rate then transformed into a weak phase. Sand mulches stored moisture near the surface, the density of the frost penetration was also greater than that of the LD. Therefore, the evaporation with the XS and CS mulches was also affected by moisture indices, the other main factors were same as for LD. The evaporation rates of the XS and CS treatment were less than that of the LD treatment for this stage.
3.3.3. Thawing Stage
The major factors affecting soil evaporation showed slight differences during the thawing stage in comparison with the earlier stages. Water surface evaporation, average relative humidity, temperature indices and vapor pressure had a greater effect on soil evaporation for the three treatments. In the thawing stage, with the rise of solar radiation, the air temperature and soil temperature increased. At the beginning of P3, the daytime temperature was higher than 0 °C, while the night temperature was still negative; the diurnal temperature change caused diurnal cycles. The liquid water content on the surface sharply increased, which provided large quantities of moisture to replenish evaporation compared to the stable freezing stage, especially in the soil with sand mulches [43]. Another main factor for the XS and CS treatments was the mean soil moisture at depths from 0 to 15 cm. Beginning in February, the region’s climate gradually headed into spring, and frequent and high speed winds increased the near-surface turbulence. The water vapor on the evaporation surface rapidly diffused into the atmosphere with the wind and turbulence. On the evaporation surface, the vapor pressure decreased and the saturation difference increased, accelerating the evaporation rate, which led to a more substantial evaporation than that of the freezing stage [44,45,46]. The mulch layer weakened the wind speed near the surface, and the effect was directly proportional to the particle size. In this experiment, however, there were few effects on evaporation due to the small coverage area and 1-cm thickness. The quantities of liquid water under the sand mulches were larger than without mulch, leading to larger evaporation with the sand mulches.
Based on the analysis, the result found that sand mulch affected evaporation in many ways during the freeze–thaw period. Sand mulch changed the surface albedo, affected the absorption of solar radiation and further influenced the soil temperature in the soil profile; sand mulch also changed the wind field, weakened the wind speed and atmospheric turbulence near the soil surface, and affected the water vapor diffusive rate. Sand mulch interrupted the rising path of the lower moisture and reduced the liquid water transport; and also affected the soil moisture distribution in the soil profile, causing water to be stored near the surface and eventually increased the liquid water content during the thawing stage. Sand mulch also influenced the soil freeze–thaw characteristics and water infiltration, etc. Therefore, evaporation with sand mulch is a complex process during the freeze–thaw period.
4. Conclusions
Based on the field experiments during the freeze–thaw period, the soil evaporation of the three treatments showed certain difference during different stages. Three values 33.43 (CS), 34.32 (XS), and 29.87 (LD) corresponded to evaporation to the CS and XS being increased by 11.93% and 14.92%, respectively, over that of bare soil. The relationship between cumulative evaporation and time was fitted to the power function (E = atb) in the freeze–thaw period. Sand mulch with a particle size 0.5–1.5 mm and 1.5–2.0 mm had an obvious effect on preventing evaporation in P1 and P2, but increased soil evaporation in P3.
The analysis of factors indicated that in P1, the main factors influencing evaporation for the three treatments were water surface evaporation, precipitation, temperature indices, vapor pressure and mean soil moisture at depths from 0 to 15 cm. Temperature indices had a slightly different influence among the three treatments; in P2 the main factors for LD were average relative humidity, precipitation, vapor pressure, temperature indices and mean soil moisture at depths from 0 to 15 cm. Soil moisture was evaporated by vapor when the frost penetration was dense, as the frost impeded the vapor movement. The evaporation rates were steady and weak in this period, and soil moisture had a slight impact on soil evaporation, especially for the XS and CS treatments, with higher water content at the surface. The main factors that affected the sand mulch treatments were the mean soil moisture at depths from 0 to 15 cm; in P3, the main factors of the LD treatment were water surface evaporation, average relative humidity, temperature index and vapor pressure. The main factors affecting the XS and CS treatments also added soil moisture at depths from 0 to 15 cm. The sand mulches with particle sizes of 0.5–1.5 mm and 1.5–2.0 mm reduced evaporation in P1 and P2, but not in P3. Therefore, future research into soil evaporation under sand mulches with different particle sizes and thicknesses during the freeze–thaw period can be conducted with new experiments to search for the most efficient mulches.
Author Contributions
Xiuqing Zheng and Junfeng Chen designed the field experiments. Junfeng Chen, Qi Du and Huijun Feng conducted the field test. Huijun Feng, JingXue and Chunyan Miao analyzed the data and wrote the paper. Yongxin Xu corrected the grammar errors and gave some suggestions for improvement.
Funding
This research was supported by the National Natural Science Foundation of China (Grant No. 41572239), the National Natural Youth Science Foundation of China (Grant No. 41502243), and the Natural Science Youth Foundation of Shanxi Province, China (Grant No. 2015021169).
Acknowledgments
The authors thank Ming Sun, Xiaojun Yang from the Taigu Water Balance Experimental Station for their assistance with the field work, and for supplying us with experimental sites and meteorological data.
Conflicts of Interest
The authors declare no conflict of interest.
Appendix A

Table A1.
Eigenvalue of principal component and cumulative contribution rate.
| Components | LD | XS | CS | |||||||
|---|---|---|---|---|---|---|---|---|---|---|
| Eigenvalues | Contribution Rate | Cumulative Contribution Rate | Eigenvalues | Contribution Rate | Cumulative Contribution Rate | Eigenvalues | Contribution Rate | Cumulative Contribution Rate | ||
| P1 | 1 | 4.46 | 44.60 | 44.60 | 4.68 | 46.81 | 46.81 | 4.25 | 42.54 | 42.54 |
| 2 | 2.61 | 26.12 | 70.72 | 2.37 | 23.74 | 70.55 | 2.87 | 28.71 | 71.25 | |
| 3 | 2.02 | 20.15 | 90.87 | 1.87 | 18.66 | 89.21 | 1.82 | 18.15 | 89.40 | |
| 4 | 0.77 | 7.73 | 98.60 | 0.74 | 7.44 | 96.65 | 0.91 | 9.11 | 98.51 | |
| 5 | 0.14 | 1.40 | 100 | 0.34 | 3.35 | 100 | 0.15 | 1.5 | 100 | |
| 6 | 0 | 0 | 100 | 0 | 0 | 100 | 0 | 0 | 100 | |
| 7 | 0 | 0 | 100 | 0 | 0 | 100 | 0 | 0 | 100 | |
| 8 | 0 | 0 | 100 | 0 | 0 | 100 | 0 | 0 | 100 | |
| 9 | 0 | 0 | 100 | 0 | 0 | 100 | 0 | 0 | 100 | |
| 10 | 0 | 0 | 100 | 0 | 0 | 100 | 0 | 0 | 100 | |
| P2 | 1 | 5.98 | 59.78 | 59.78 | 5.80 | 57.98 | 57.98 | 5.12 | 51.24 | 51.24 |
| 2 | 2.44 | 24.38 | 84.16 | 2.32 | 23.20 | 81.18 | 3.18 | 31.78 | 83.02 | |
| 3 | 0.97 | 9.72 | 93.88 | 1.05 | 10.51 | 91.69 | 1.05 | 10.51 | 93.53 | |
| 4 | 0.61 | 6.12 | 100 | 0.83 | 8.31 | 100 | 0.65 | 6.47 | 100 | |
| 5 | 0 | 0 | 100 | 0 | 0 | 100 | 0 | 0 | 100 | |
| 6 | 0 | 0 | 100 | 0 | 0 | 100 | 0 | 0 | 100 | |
| 7 | 0 | 0 | 100 | 0 | 0 | 100 | 0 | 0 | 100 | |
| 8 | 0 | 0 | 100 | 0 | 0 | 100 | 0 | 0 | 100 | |
| 9 | 0 | 0 | 100 | 0 | 0 | 100 | 0 | 0 | 100 | |
| 10 | 0 | 0 | 100 | 0 | 0 | 100 | 0 | 0 | 100 | |
| P3 | 1 | 5.84 | 58.42 | 58.42 | 6.11 | 61.07 | 61.07 | 6.14 | 61.44 | 61.44 |
| 2 | 2.13 | 21.32 | 79.74 | 1.82 | 18.22 | 79.29 | 1.76 | 17.60 | 79.04 | |
| 3 | 1.03 | 10.29 | 90.03 | 1.10 | 10.96 | 90.25 | 1.09 | 10.95 | 89.98 | |
| 4 | 0.74 | 7.43 | 97.46 | 0.72 | 7.17 | 97.41 | 0.74 | 7.43 | 97.41 | |
| 5 | 0.22 | 2.22 | 99.68 | 0.21 | 2.09 | 99.51 | 0.21 | 2.10 | 99.51 | |
| 6 | 0.03 | 0.32 | 100 | 0.05 | 0.50 | 100 | 0.05 | 0.49 | 100 | |
| 7 | 0 | 0 | 100 | 0 | 0 | 100 | 0 | 0 | 100 | |
| 8 | 0 | 0 | 100 | 0 | 0 | 100 | 0 | 0 | 100 | |
| 9 | 0 | 0 | 100 | 0 | 0 | 100 | 0 | 0 | 100 | |
| 10 | 0 | 0 | 100 | 0 | 0 | 100 | 0 | 0 | 100 | |
Table A2.
Factor loading coefficient of principal analysis.
| Stages | Treatments | Components | x1′ | x2′ | x3′ | x4′ | x5′ | x6′ | x7′ | x8′ | x9′ | x10′ |
|---|---|---|---|---|---|---|---|---|---|---|---|---|
| P1 | LD | 1 | 0.33 | 0.28 | 0.42 | −0.33 | −0.20 | 0.11 | 0.34 | 0.06 | −0.38 | 0.46 |
| 2 | 0.42 | −0.24 | 0.28 | 0.25 | 0.56 | 0.35 | −0.10 | 0.42 | 0.05 | −0.01 | ||
| 3 | −0.03 | 0.45 | −0.05 | 0.37 | 0.00 | −0.37 | 0.44 | 0.47 | 0.34 | 0.04 | ||
| XS | 1 | 0.25 | 0.36 | 0.37 | −0.33 | −0.34 | 0.06 | 0.39 | 0.05 | −0.29 | 0.45 | |
| 2 | 0.54 | −0.24 | 0.30 | 0.32 | 0.41 | 0.31 | −0.09 | 0.40 | −0.14 | 0.08 | ||
| 3 | −0.02 | 0.32 | 0.03 | 0.36 | −0.08 | −0.43 | 0.33 | 0.55 | 0.39 | −0.10 | ||
| CS | 1 | 0.33 | 0.32 | 0.40 | −0.33 | −0.11 | 0.14 | 0.38 | 0.08 | −0.32 | 0.48 | |
| 2 | 0.43 | −0.32 | 0.29 | 0.35 | 0.53 | 0.28 | −0.17 | 0.34 | −0.09 | −0.03 | ||
| 3 | 0.05 | 0.33 | −0.05 | 0.31 | 0.01 | −0.43 | 0.38 | 0.59 | 0.32 | −0.05 | ||
| P2 | LD | 1 | −0.37 | 0.30 | 0.32 | 0.36 | 0.23 | −0.15 | −0.30 | 0.40 | 0.39 | −0.26 |
| 2 | 0.26 | 0.30 | −0.35 | 0.16 | 0.46 | 0.53 | −0.32 | −0.02 | 0.04 | 0.30 | ||
| XS | 1 | −0.35 | 0.34 | 0.29 | 0.31 | 0.29 | −0.13 | −0.31 | 0.40 | 0.41 | −0.24 | |
| 2 | 0.31 | 0.33 | −0.30 | 0.38 | 0.38 | 0.49 | −0.18 | −0.13 | 0.00 | 0.36 | ||
| 3 | −0.11 | 0.28 | −0.42 | 0.20 | 0.21 | −0.51 | 0.59 | −0.17 | 0.11 | −0.02 | ||
| CS | 1 | −0.41 | 0.28 | 0.35 | 0.11 | −0.17 | −0.20 | −0.30 | 0.44 | 0.41 | −0.30 | |
| 2 | 0.16 | 0.37 | −0.12 | 0.53 | 0.51 | 0.40 | −0.27 | 0.05 | 0.14 | 0.17 | ||
| 3 | −0.11 | 0.34 | −0.52 | 0.19 | 0.10 | −0.43 | 0.53 | −0.08 | 0.22 | −0.19 | ||
| P3 | LD | 1 | 0.36 | 0.38 | 0.36 | −0.26 | −0.01 | 0.26 | −0.35 | −0.38 | −0.20 | 0.39 |
| 2 | −0.12 | 0.18 | −0.22 | 0.53 | 0.66 | −0.01 | −0.31 | −0.10 | −0.30 | −0.02 | ||
| 3 | 0.24 | 0.10 | −0.28 | −0.03 | 0.24 | 0.35 | −0.19 | 0.29 | 0.72 | 0.18 | ||
| XS | 1 | 0.34 | 0.37 | 0.36 | −0.33 | −0.11 | 0.26 | −0.33 | −0.38 | −0.20 | 0.38 | |
| 2 | 0.04 | 0.22 | −0.24 | 0.43 | 0.71 | −0.01 | −0.42 | −0.05 | −0.12 | 0.08 | ||
| 3 | 0.39 | −0.02 | 0.15 | 0.10 | 0.07 | 0.10 | −0.06 | 0.31 | 0.80 | 0.23 | ||
| CS | 1 | 0.34 | 0.36 | 0.35 | −0.32 | −0.18 | 0.27 | −0.32 | −0.38 | −0.20 | 0.38 | |
| 2 | 0.02 | 0.27 | −0.21 | 0.44 | 0.67 | −0.03 | −0.44 | −0.08 | −0.18 | 0.10 | ||
| 3 | 0.40 | 0.01 | 0.16 | 0.17 | 0.07 | 0.06 | −0.10 | 0.30 | 0.78 | 0.25 |
Note: x1′ is the standardized index of Solar radiation; x2′ is the standardized index of average air temperature; x3′ is the standardized index of average soil temperature; x4′ is the standardized index of average soil moisture within 15 cm below the surface; x5′ is the standardized index of average soil moisture below the surface from 15 cm to 30 cm; x6′ is the standardized index of average wind speed; x7′ is the standardized index of average vapor pressure; x8′ is the standardized index of average relative humidity; x9′ is the standardized index of precipitation; x10′ is the standardized index of evaporation on the water surface.
References
- Li, R.; Shi, H.; Flerchinger, G.N.; Akae, T.; Wang, C. Simulation of freezing and thawing soils in Inner Mongolia Hetao Irrigation District. Geoderma 2012, 173, 28–33. [Google Scholar] [CrossRef]
- Xiao, B.; Zhao, Y.; Shao, M. Characteristics and numeric simulation of soil evaporation in biological soil crusts. J. Arid Environ. 2010, 74, 121–130. [Google Scholar] [CrossRef]
- Wang, Y.; Xie, Z.; Malhi, S.S.; Vera, C.L.; Zhang, Y.; Wang, J. Effects of rainfall harvesting and mulching technologies on water use efficiency and crop yield in the semi-arid Loess Plateau, China. Agric. Water Manag. 2009, 96, 374–382. [Google Scholar] [CrossRef]
- Wang, Q.; Wang, M.; Fan, X.; Zhang, F.; Zhu, S.; Zhao, T. Trends of temperature and precipitation extremes in the Loess Plateau Region of China, 1961–2010. Theor. Appl. Climatol. 2017, 129, 949–963. [Google Scholar] [CrossRef]
- Gao, X.; Zhao, Q.; Zhao, X.; Wu, P.; Pan, W.; Gao, X.; Sun, M. Temporal and spatial evolution of the standardizedprecipitation evapotranspiration index (SPEI) in the Loess Plateau under climate change from 2001 to 2050. Sci. Total Environ. 2017, 595, 191–200. [Google Scholar] [CrossRef] [PubMed]
- Iftikhar, F.; Ali, S. Impact of different types of mulches on soil moisture. Sarhad J. Agric. 2004, 20, 571–573. [Google Scholar]
- Yamanaka, T.; Inoune, M.; Kaihotsu, I. Effects of gravel mulch on water vapor transfer above and below the soil surface. Agric. Water Manag. 2004, 67, 145–155. [Google Scholar] [CrossRef]
- Demir, Z.; Yildiz, O.; Toprak, B. Water retention ratios of mulching material consisting primarily of pine bark over different soil types. Pak. J. Bot. 2009, 41, 1851–1859. [Google Scholar]
- Gilman, E.F.; Beeson, R.C.; Meador, D. Impact of mulch on water loss from a container substrate and native soil. Arboricult. Urban For. 2012, 38, 18–23. [Google Scholar]
- McMillen, M. The Effect of Mulch Type and Thickness on the Soil Surface Evaporation Rate; Horticulture and Crop Science Department, California Polythechnic State University: San Luis Obispo, CA, USA, 2013. [Google Scholar]
- Zribi, W.; Aragüés, R.; Medina, E.; Faci, J.M. Efficiency of inorganic and organic mulching materials for soil evaporation control. Soil Tillage Res. 2015, 148, 40–45. [Google Scholar] [CrossRef]
- Farzi, R.; Gholami, M.; Baninasab, B.; Gheysari, M. Evaluation of different mulch materials for reducing soil surface evaporation in semi-arid region. Soil Use Manag. 2017, 33, 120–128. [Google Scholar] [CrossRef]
- Tesfuhuney, W.A.; Van Rensburg, L.D.; Walker, S.; Allemann, J. Quantifying and predicting soil water evaporation as influenced by runoff strip lengths and mulch cover. Agric. Water Manag. 2015, 152, 7–16. [Google Scholar] [CrossRef]
- Mahdavia, S.M.; Neyshabouria, M.R.; Fujimaki, H.; Majnooni Heris, A. Coupled heat and moisture transfer and evaporation in mulched soils. Catena 2017, 151, 34–48. [Google Scholar] [CrossRef]
- Xie, Z.; Wang, Y.; Cheng, G.; Malhi, S.S.; Vera, C.L.; Guo, Z.; Zhang, Y. Particle-size effects on soil temperature, evaporation, water use efficiency and watermelon yield in fields mulched with gravel and sand in semi-arid Loess plateau of northwest China. Agric. Water Manag. 2010, 97, 917–923. [Google Scholar] [CrossRef]
- Chen, W.; Jin, M.; Ferré Ty, P.A.; Liu, Y.; Yang, X.; Shan, T.; Ping, X. Spatial distribution of soil moisture, soil salinity, and root density beneath a cotton field under mulched drip irrigation with brackish and fresh water. Field Crops Res. 2018, 215, 207–221. [Google Scholar] [CrossRef]
- Xie, Z.; Wang, Y.; Wei, X.; Zhang, Z. Impacts of a grave-sand mulch and supplemental drip irrigation on watermelon (Citrullus lanatus [Thunb.] Mats. & Nakai) root distribution and yield. Soil Tillage Res. 2006, 89, 35–44. [Google Scholar]
- Yuan, C.; Zhang, X.; Lei, T.; Liu, H.; Li, X. Effects of mulching sand and gravel size on soil moisture evaporation. Trans. Chin. Soc. Agric. Eng. 2008, 24, 25–28. [Google Scholar]
- Qiu, Y.; Xie, Z.; Wang, Y.; Ren, J.; Sukhdev, S. Influence of gravel mulch stratum thickness and gravel grain size on evaporation resistance. J. Hydrol. 2014, 519, 1908–1913. [Google Scholar] [CrossRef]
- Fekri, M.; Kasmaei, L.S. Effects of windy sand and LECA mulches on decreasing evaporation from soil surface. Arab. J. Geosci. 2013, 6, 163–168. [Google Scholar] [CrossRef]
- Modaihsh, A.S.; Horton, R.; Kirkham, D. Soil water evaporation suppression by sand mulches. Soil Sci. 1985, 139, 357–361. [Google Scholar] [CrossRef]
- Kemper, W.D.; Nicks, A.D.; Corey, A.T. Accumulation of Water in Soils under Gravel and Sand Mulches. Soil Sci. Soc. Am. J. 1994, 58, 6–63. [Google Scholar] [CrossRef]
- Jiménez, C.C.; Tejedor, M.; Díaz, F.; Rodríguez, C.M. Effectiveness of sand mulch in soil and water conservation in an arid region, Lanzarote, Canary Islands, Spain. J. Soil Water Conserv. 2005, 60, 63–67. [Google Scholar]
- Miao, C.; Chen, J.; Zheng, X.; Zhang, Y.; Xu, Y.; Du, Q. Soil water and phreatic evaporation in shallow groundwater during a freeze–thaw period. Water 2017, 9, 396. [Google Scholar] [CrossRef]
- Peng, Z.; Huang, J.; Wu, J.; Zeng, W. Effect of autumn irrigation on evaporation from seasonal frozen soils. In Proceedings of the Conference on water in Cold Region 4th, Fuyuan, China, 13–14 August 2011. [Google Scholar]
- Li, X. Gravel-sand mulch for soil and water conservation in the semiarid loess region of northwest China. Catena 2003, 52, 105–127. [Google Scholar] [CrossRef]
- Wang, Y.; Xie, Z.; Malhi, S.S.; Vera, C.L.; Zhang, Y. Gravel-sand mulch thickness effects on soil temperature, evaporation, water use efficiency and yield of watermelon in semi-arid Loess Plateau, China. Acta Ecol. Sin. 2014, 34, 261–265. [Google Scholar] [CrossRef]
- Zheng, W.; Paula, P.; Liu, Y.; Chi, W.; Pereira, L.S. Modelling transpiration, soil evaporation and yield prediction of soybean in North China Plain. Agric. Water Manag. 2015, 147, 43–53. [Google Scholar]
- Chen, J.; Zheng, X.; Zhang, Y.; Qin, Z.; Sun, M. Simulation of Soil Moisture Evaporation under Different Groundwater Level Depths during Seasonal Freeze–thaw period. Trans. Chin. Soc. Agric. Mach. 2015, 46, 131–139. [Google Scholar]
- Wu, M.; Huang, J.; Wu, J.; Tan, X.; Jansson, P.E. Experimental study on evaporation from seasonally frozen soils under various water, solute and groundwater conditions in Inner Mongolia, China. J. Hydrol. 2016, 535, 46–53. [Google Scholar] [CrossRef]
- Dall’Amico, M.; Endrizzi, S.; Gruber, S.; Rigon, R. A robust and energy-conserving model of freezing variably-saturated soil. Cryosphere 2011, 5, 469–484. [Google Scholar] [CrossRef] [Green Version]
- Jafarov, E.E.; Marchenko, S.S.; Romanovsky, V.E. Numerical modeling of permafrost dynamics in Alaska using a high spatial resolution dataset. Cryosphere 2012, 6, 613–624. [Google Scholar] [CrossRef] [Green Version]
- Flerchinger, G.N.; Sauer, T.J.; Aiken, R.A. Effects of crop residue cover and architecture on heat and water transfer at the soil surface. Geoderma 2003, 116, 217–233. [Google Scholar] [CrossRef]
- Kaneko, T.; Kobayashi, T.; Wang, W.; Cho, H. Estimating evaporation in winter at a field irrigated late in autumn in Inner Mongolia, China. J. Fac. Agric. Kyushu Univ. 2006, 51, 407–411. [Google Scholar]
- Archer, N.A.L.; Otten, W.; Schmidt, S.; Glyn Bengough, A.; Shah, N.; Bonell, M. Rainfall infiltration and soil hydrological characteristics below ancient forest, planted forest and grassland in a temperate northern climate. Ecohydrology 2016, 9, 585–600. [Google Scholar] [CrossRef]
- Lee, L.M.; Kassim, A.; Gofar, N. Performances of two instrumented laboratory models for the study of rainfall infiltration into unsaturated soils. Eng. Geol. 2011, 117, 78–89. [Google Scholar] [CrossRef]
- dos Santos, J.S.; de Oliveira, E.; Bruns, R.E.; Gennari, R.F. Evaluation of the salt accumulation process during inundation in water resource of Contas river basin (Bahia–Brazil) applying principal component analysis. Water Res. 2004, 38, 1579–1585. [Google Scholar] [CrossRef] [PubMed]
- Cadavid, A.C.; Lawrence, J.K.; Ruzmaikin, A. Principal Components and Independent Component Analysis of Solar and Space Data. Sol. Phys. 2008, 248, 247–261. [Google Scholar] [CrossRef]
- Li, T.; Fu, Q.; Xu, S.; Meng, F. Application of Principal Component Analysis in Evaluating Influence Factors of Evaporation in Northern Cold Area. In Proceedings of the 2009 Fifth International Conference on Natural Computation, Tianjin, China, 14–16 August 2009. [Google Scholar]
- Meng, C. Land Surface Modeling with Enhanced Considerations of Soil Evaporation and Coupled Transport of Soil Moisture and Heat. Ph.D. Thesis, Beijing Normal University, Beijing, China, 2006. [Google Scholar]
- Lei, Z.; Yang, S.; Xie, S. Soil moisture movement under evaporation conditions. In Soil Water Dynamics. Part 1. Overview; Tsinghua University Press: Beijing, China, 1988; pp. 132–136. [Google Scholar]
- Li, T. Study on the Moisture Movement Law of Farmland Soil in Northern Seasonal Frozen Soil Area. Master’s Thesis, Northeast Agricultural University, Harbin, China, 2010. [Google Scholar]
- Yao, B.; Li, G.; Wang, F. Effects of winter irrigation and soil surface mulching during freezing-thawing period on soil water-heat-salt for cotton fields in south Xinjiang. Trans. Chin. Soc. Agric. Eng. 2016, 32, 114–119. [Google Scholar]
- Davarzani, H.; Smits, K.; Tolene, R.M.; Illangasekare, T. Study of the effect of wind speed on evaporation from soil through integrated modeling of the atmospheric boundary layer and shallow subsurface. Water Resour. Res. 2014, 50, 661–680. [Google Scholar] [CrossRef] [PubMed]
- Agam, N.; Evett, S.R.; Tolk, J.A.; Kustas, W.P.; Colaizzi, P.D.; Alfieri, J.G.; Mckee, L.G.; Copeland, K.S.; Howell, T.A.; Chavez, J.L. Evaporative loss from irrigated interrows in a highly advective semi-arid agricultural area. Adv. Water Resour. 2012, 50, 20–30. [Google Scholar] [CrossRef]
- McVicar, T.R.; Roderick, M.L.; Donohue, R.J.; Li, L.; Van, N.; Thomas, G.; Thomas, A.; Grieser, J.; Jhajharia, D.; Himri, Y.; et al. Global review and synthesis of trends in observed terrestrial near-surface wind speeds: Implications for evaporation. J. Hydrol. 2012, 416, 182–205. [Google Scholar] [CrossRef]
Figure 1.
The location of the Taigu Water Balance Experimental Field and schematic diagram of the micro-lysimeter in the field.
Figure 1.
The location of the Taigu Water Balance Experimental Field and schematic diagram of the micro-lysimeter in the field.

Figure 2.
(a) Air temperature; (b) Precipitation and frost depth during the freeze–thaw period.

Figure 3.
Cumulative evaporation amount under different sand mulches during the freeze–thaw period.

Figure 4.
Soil evaporation under different sand mulches in the different freeze–thaw stages.

Table 1.
Properties of the soils in the micro-lysimeters.
| Soil Depth (cm) | Bulk Density (×103 Kg m−3) | Particle Size Distribution | ||
|---|---|---|---|---|
| Clay (%) | Silt (%) | Sand (%) | ||
| 0–30 | 1.41 | 0.82 | 9.07 | 91.22 |
| 30–60 | 1.41 | 1.27 | 14.84 | 86.61 |
| 60–80 | 1.41 | 0.88 | 13.46 | 90.55 |
| 80–100 | 1.41 | 0.41 | 7.06 | 95.57 |
Table 2.
Fitting equation for evaporation amount under different sand mulches.
| Treatments | E = a + bt | E = aebt | E = atb | ||||||
|---|---|---|---|---|---|---|---|---|---|
| a | b | R2 | a | b | R2 | a | b | R2 | |
| LD | 0.0042 | 0.2459 | 0.98 | 1.6841 | 0.0297 | 0.77 | 0.2245 | 1.0155 | 0.99 |
| XS | −0.0522 | 0.2522 | 0.94 | 1.3912 | 0.0320 | 0.79 | 0.1700 | 1.0742 | 0.99 |
| CS | −0.0980 | 0.2680 | 0.95 | 1.2462 | 0.0340 | 0.80 | 0.1353 | 1.1380 | 0.99 |
Note: E is the cumulative evaporation amount (mm); t is time (d); a and b are equation coefficients; R2 is determination coefficient.
Table 3.
Evaporation rate under different sand mulches during the freeze–thaw period.
| Treatments | P1 | P2 | P3 | ADE |
|---|---|---|---|---|
| LD | 0.297 | 0.301 | 0.366 | 0.323 |
| XS | 0.281 | 0.263 | 0.507 | 0.359 |
| CS | 0.270 | 0.268 | 0.485 | 0.349 |
Note: ADE is the average evaporation rate over all three stages, mm·d−1.
© 2018 by the authors. Licensee MDPI, Basel, Switzerland. This article is an open access article distributed under the terms and conditions of the Creative Commons Attribution (CC BY) license (http://creativecommons.org/licenses/by/4.0/).
Share and Cite
MDPI and ACS Style
Feng, H.; Chen, J.; Zheng, X.; Xue, J.; Miao, C.; Du, Q.; Xu, Y. Effect of Sand Mulches of Different Particle Sizes on Soil Evaporation during the Freeze–Thaw Period. Water 2018, 10, 536. https://doi.org/10.3390/w10050536
AMA Style
Feng H, Chen J, Zheng X, Xue J, Miao C, Du Q, Xu Y. Effect of Sand Mulches of Different Particle Sizes on Soil Evaporation during the Freeze–Thaw Period. Water. 2018; 10(5):536. https://doi.org/10.3390/w10050536
Chicago/Turabian StyleFeng, Huijun, Junfeng Chen, Xiuqing Zheng, Jing Xue, Chunyan Miao, Qi Du, and Yongxin Xu. 2018. "Effect of Sand Mulches of Different Particle Sizes on Soil Evaporation during the Freeze–Thaw Period" Water 10, no. 5: 536. https://doi.org/10.3390/w10050536
Note that from the first issue of 2016, this journal uses article numbers instead of page numbers. See further details here.