Article

Analysis of Current and Future Water Demands in the Upper Indus Basin under IPCC Climate and Socio-Economic Scenarios Using a Hydro-Economic WEAP Model

1
Institute of Geographical Information System, School of Civil and Environmental Engineering, National University of Sciences and Technology, Islamabad 44000, Pakistan
2
Integrated Land and Water Resources Management in the Tropics and Subtropics, Technology Arts Sciences TH Köln, 50679 Köln, Germany
*
Author to whom correspondence should be addressed.
Water 2018, 10(5), 537; https://doi.org/10.3390/w10050537
Submission received: 12 April 2018 / Revised: 19 April 2018 / Accepted: 20 April 2018 / Published: 24 April 2018
(This article belongs to the Section Water Resources Management, Policy and Governance)

Abstract

:
Pakistan is currently facing physical and economic water scarcity issues that are further complicated by the rapid increase in its population and by climate change. Many studies have focused on the physical water scarcity using hydrological modeling and the measurement of the impact of climate change on water resources in the Upper Indus Basin (UIB). However, few studies have concentrated on the importance of the economic water scarcity, that is, the water management issue under the looming impacts of climate change and the population explosion of Pakistan. The purpose of this study is to develop a management strategy which helps to achieve water security and sustainability in the Upper Indus Basin (UIB) with the help of different socio-economic and climate change scenarios using WEAP (Water Evaluation and Planning) modeling. The streamflow data of five sub-basins (Gilgit, Hunza, Shigar, Shyok, and Astore) and the entire Upper Indus Basin (UIB) were calibrated (2006–2010) and validated (2011–2014) in the WEAP model. The coefficient of determination and Nash Sutcliffe values for the calibration period ranged from 0.81–0.96. The coefficient of determination and the Nash Sutcliffe values for the validation period ranged from 0.85–0.94. After the development of the WEAP model, the analysis of the unmet water demand and percent coverage of the water demand for the period of 2006–2050 was computed. Different scenarios were generated for external driving factors (population growth, urbanization, and living standards) and the impact of climate change to evaluate their effect on the current water supply system. The results indicated that the future unmet water demand is likely to reach 134 million cubic meters (mcm) by the year 2050 and that the external driving factors are putting more pressure on the supply service. This study further explores the importance of proposed dams (likely to be built until 2025) by WAPDA (Water and Power Development Authority). These dams will decrease the unmet water demand by 60% in the catchment. The water demands under four scenarios (the reference, moderate future-1, moderate future-2, and management scenarios) were compared. The management scenario analysis revealed that 80% of the water demand coverage could be achieved by the year 2023, which could help in developing sustainable water governance for the catchment.

Graphical Abstract

1. Introduction

Most nations in the world will experience water shortage issues by 2025 [1]. Global reservoirs and glaciers which are sources of fresh water are drying up or melting [2], causing a water shortage within the agricultural and domestic sectors. This is a significant global issue as it affects the water resources as well as the availability of clean drinking water for the population [3]. The ever-increasing population and economic growth put much pressure on the hydrologic cycle and water resources [4]. The water consumption rate, urbanization, and rising living standards have a strong correlation, and these factors are putting more stress on the available water resources [5,6]. These stresses lead to a decrease in the per capita availability of water in cities [7]. In addition to the above factors, the hydrologic cycle is also significantly affected by climate change [8]. According to the fifth Assessment Report (AR5) of the Intergovernmental Panel on Climate Change (IPCC), climate change will have a significant effect on the availability and properties of natural water resources [4]. Earth’s climate is changing and even under the most optimistic scenarios of emissions and climate sensitivity, climate change impacts are inevitable [9,10]. Population growth, economic activities, and the impacts of climate change give rise to the scarcity of water, a condition in which the water demand grows beyond the available water supply because of its physical unavailability and an insufficient water management structure [11]. When the demand surpasses the available supply, then water allocation fails to meet the required demand which causes a decrease in the per capita water availability. This situation intensified further by increasing demands in the case of rapid urbanization and the improvement of living standards along with the impact of severe climate conditions [12].
The hydrology of Pakistan is based on a single river system: the Indus. The Major Indus River headwater lies in India and China [13]. The river system of Pakistan consists of more than 60 rivers (small and large). The Indus Basin has an area approximately 863,508 km2 and is a major drainage of the northwest Himalayas and the Karakoram mountains. The major tributaries in the upper Indus Basin include the Shingo, Shyok, Shigar, Astore, Hunza, Gilgit, and Kabul rivers. The source of these tributaries is dominated by snow and glacial meltwater [14]. The Indus River’s mean annual discharge is 6.2 × 10¹⁰ m3 [15]. The river water of the Indus is becoming insufficient to meet the country’s growing needs as the uses of the water resources are interdependent. Thus, there is a need to use the resource efficiently and to build more storage to avoid floods and the wastage of water in the form of runoffs into the sea [16]. In an arid and semiarid region like Pakistan, the sustainable water use in the domestic and agricultural sectors faces severe challenges under the changing climate, the population growth, and higher living standards. According to an estimate, 10 years into the future, nearly 2.9 billion people in 48 countries will face shortages of safe drinking water and Pakistan will be one of those countries with a water scarcity [17].
In the literature, different water management and allocations tools and software such as REALM (Resource Allocation Model) were used. REALM is a computer simulation used for the water distribution within a water supply source [18]. The Catchment Water Allocation Tool (CaWAT) was used for water resource planning; it is based on water balance accounting concerning the allocation of water into different sectors. It was developed with the AquaCrop (FAO) model in mind, mainly for the simulation of the water requirements for irrigation and crop productivity. The CaWAT also simulates the water storage, which is not only a model of the balance of water but also of fish production [19]. The WEAP (Water Evaluation and Planning) is selected for this study as it is the best option available to evaluate water resources using a scenario-based evaluation under different conditions of input variables. The WEAP is a useful model for the basin level evaluation of the water supply and demand [20]. The loss of water can be comprehensively handled using a simulation model (WEAP), which simulates the current water situation, evaluates the water quality, and manages the water supply and demand issues [21]. The WEAP model provides a set of objects and procedures that can resolve problems faced by water managers using a scenario-based approach, which works on natural watersheds, reservoirs, streams, and canals [22].
In the last decade, Pakistan entered from a water-stress country to water-scarce country. Several hydrological models have been applied to model the hydrological behavior of the Upper Indus Basin (UIB). For example, Tahir (2011) modeled the Hunza catchment under climate change scenarios using the snowmelt runoff model (SRM) and the results of the study suggested that SRM could be an efficient model for a glacier-fed sub-basin in UIB [23]. The soil water assessment tool (SWAT) model was also widely used in climate change impact studies and for the water allocation in the Indus Basin [24,25]. The WEAP model has been used to study the impact of climate change on the hydrology of the Indus Basin [26]. These previous studies failed to model the water management issues in the UIB to address the freshwater scarcity. We assess the water scarcity issues in the UIB by using different socio-economic, management, and climate change scenarios for the availability of sustainable water in the future in the UIB.

2. Materials and Methods

2.1. Study Area

The Upper Indus Basin (UIB) is located in the northern part of Pakistan (33°54′05.48″ E–37°05′27.96″ E latitude and 72°11′26.77″ N–77°41′50.36″ N longitude) (Figure 1). The total area of UIB is about 8303 km2. The UIB contains the mountainous terrains of the Hindu Kush, Karakorum, and Himalayan ranges which are sources of freshwater for the region. The Indus is the main river, which flows through the basin, originating from the Tibetan Plateau in China, before flowing through the disputed territory of Jammu and Kashmir to the Gilgit-Baltistan area (Pakistan). Its main tributaries in the UIB are the Shingo River, the Shyok River, the Shigar River, the Gilgit River, and the Astore River. Then the UIB flows southward through Pakistan into the Arabian Sea. The average maximum temperature of the UIB is 25.7 °C and the average minimum temperature is 4.4 °C. The catchment receives substantially varying rainfall from 2000–2500 mm per year.

2.2. Data Collection
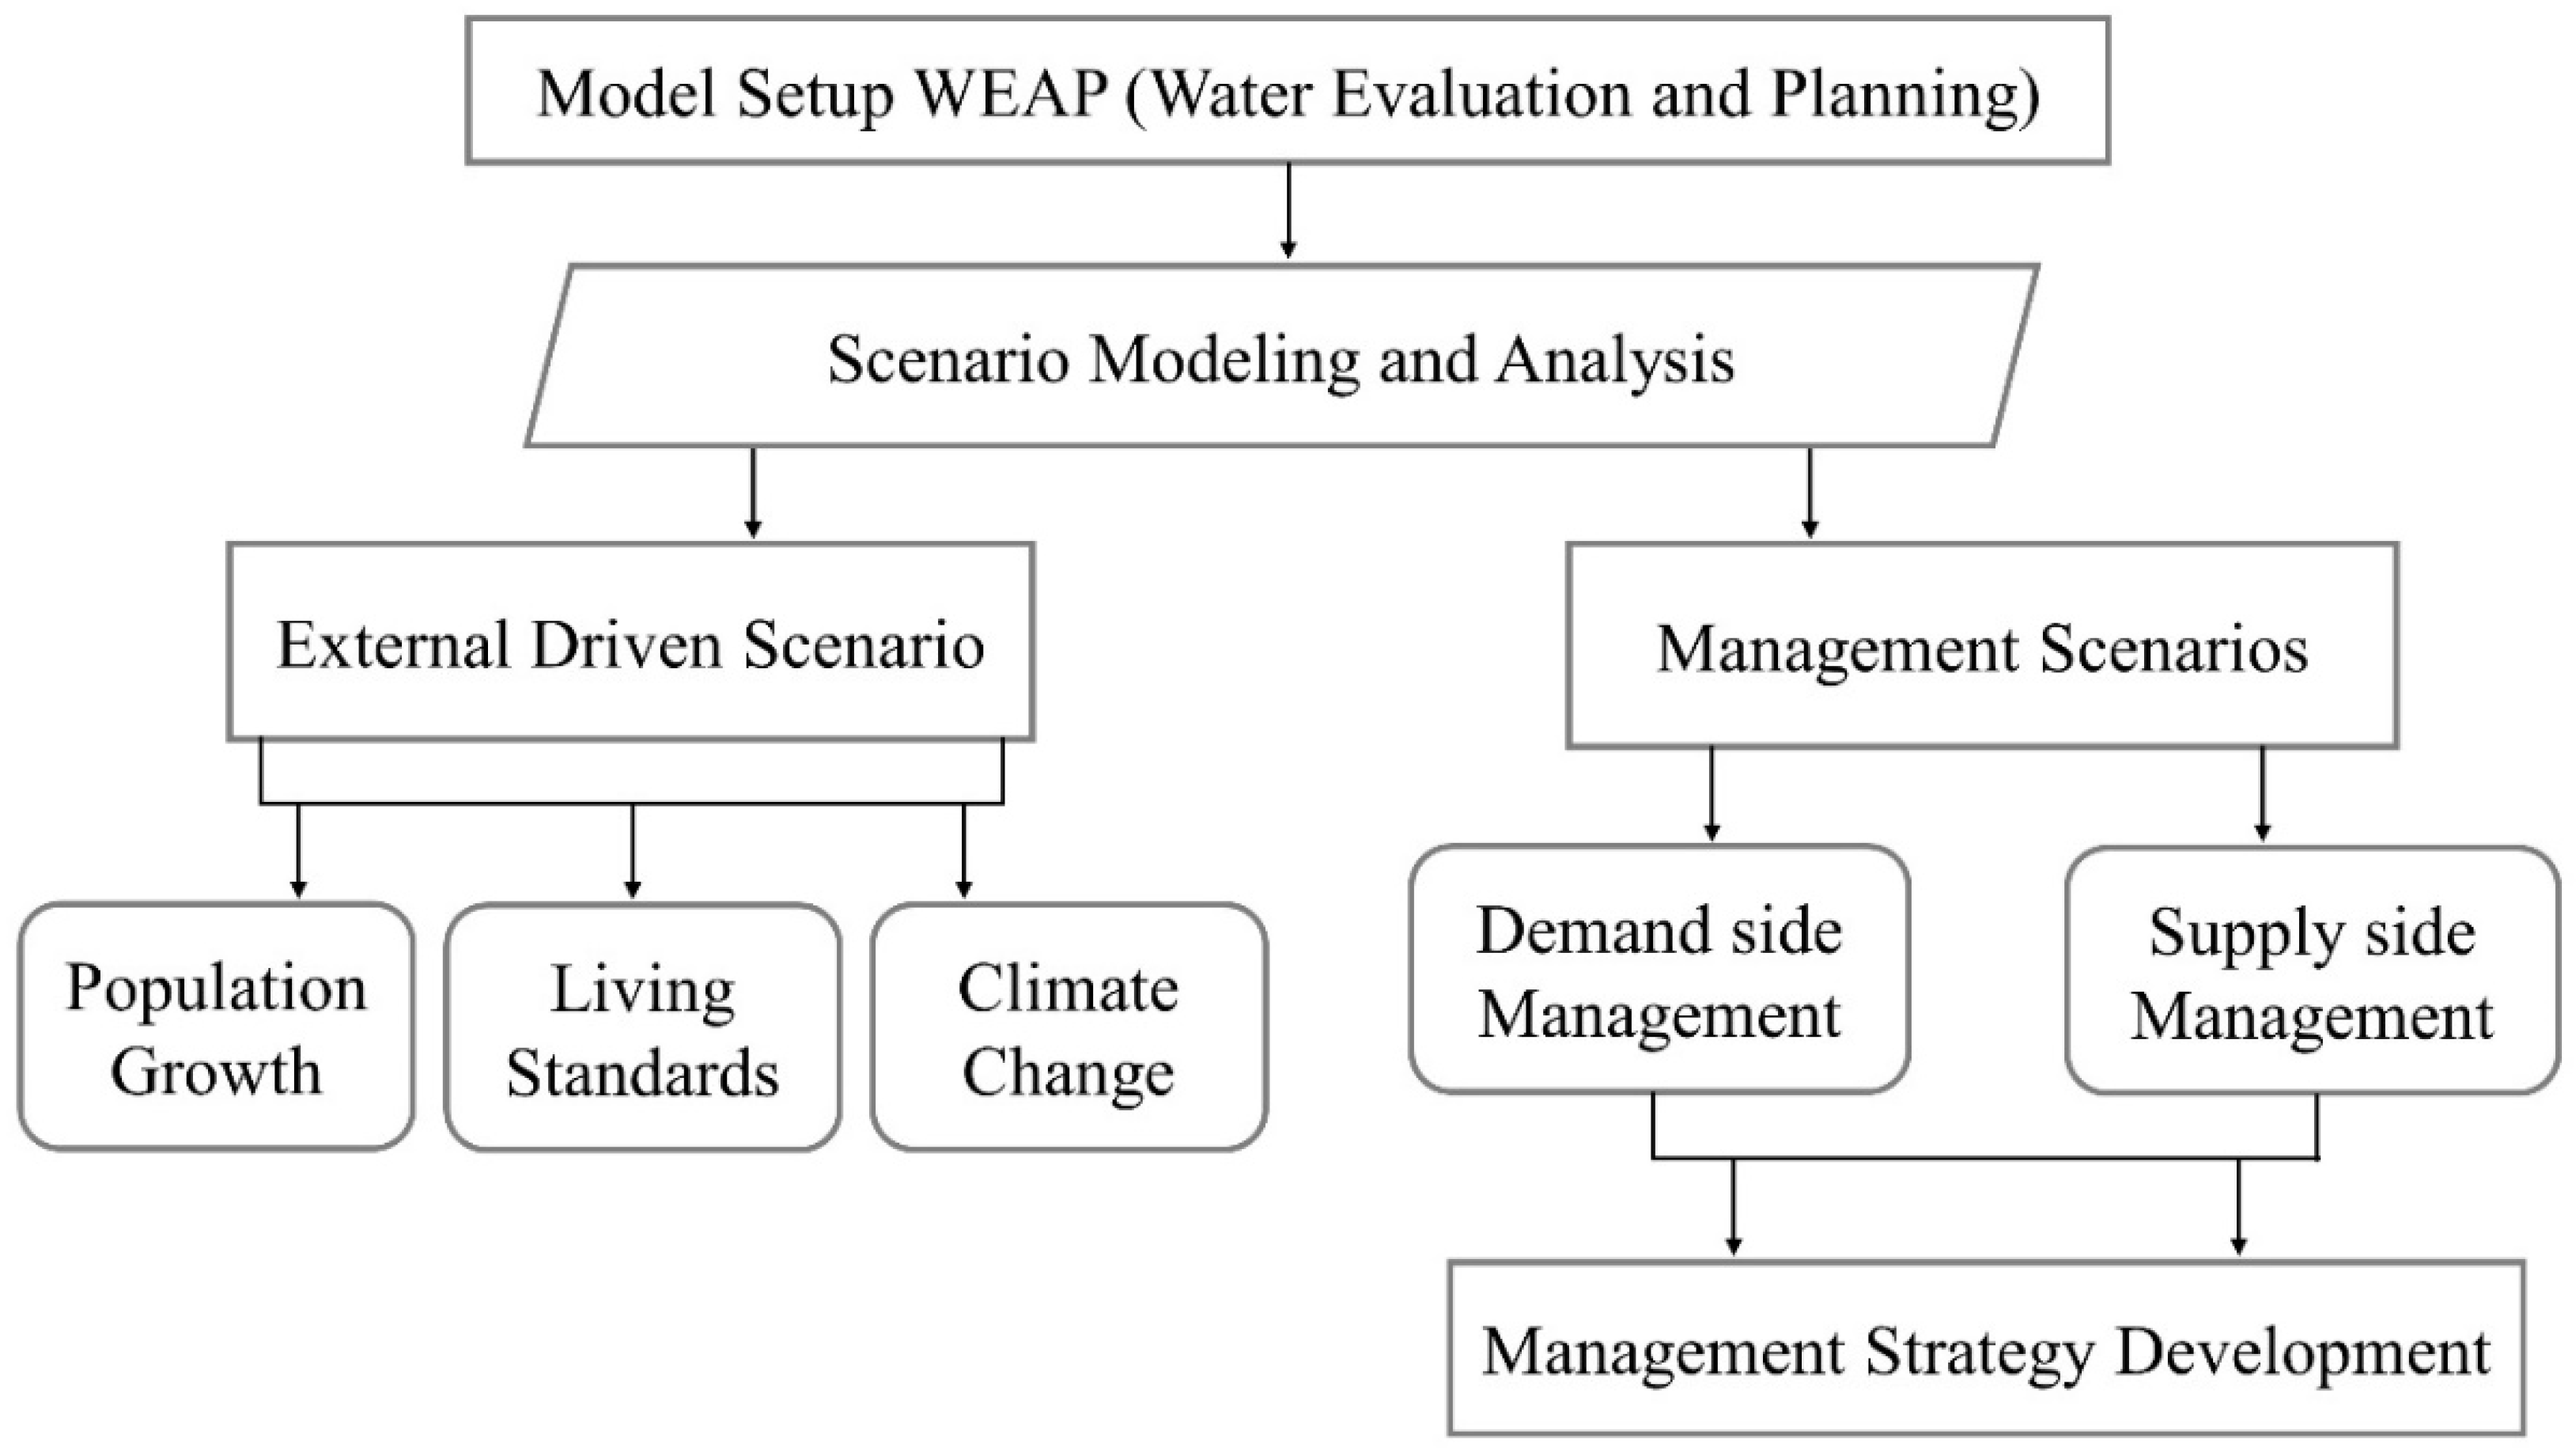
For the development of the hydro-economic WEAP model of the study area, different types of datasets were used (Table 1), including the Digital Elevation Model (DEM) for the delineation of the sub-basins in UIB (https://earthexplorer.usgs.gov/) and TRMM (Tropical Rainfall Measuring Mission) data for the catchments which had no meteorological stations. The MODIS land cover dataset was used to identify the type and percentage of land cover in a sub-catchment (Figure 2).
The climate, precipitation, temperature, wind speed, cloudiness factor, and humidity data were acquired from the Pakistan Meteorological Department (PMD). The river discharges and the gauge station data were collected from the Water and Power Development Authority (WAPDA), the Indus River System Authority (IRSA), and PMD which were further used for the calibration and validation of the catchment. Demographic data including the population, water use rates, and water consumption were acquired from different socio-economic surveys, the Pakistan Bureau of Statistics, and the Water and Sanitation Authority (WASA), which helped to analyze the water demand, water coverage, and unmet water demand. The agricultural data were collected from the Irrigation Department (Pakistan) and agriculture census data which were acquired from the literature, which helps in computing the water requirement and unmet water demand for the agricultural sector.

2.3. Methodology

The study focuses on the development of the WEAP model and the calibration and validation of the five sub-catchments (Gilgit, Hunza, Shigar, Shyok, Shingo, and Astore) in the Upper Indus Basin (UIB). After the development of the WEAP model, three scenarios were used to predict the water demands up to the year 2050. The WEAP model was run on a monthly time-step interval. In building the WEAP model, the 2006–2014 period was set as a baseline for which the agricultural and domestic water demands were calculated. The socio-economic scenarios used in the WEAP model include business as usual (set as a reference), high population growth (HPG), low population growth (LPG), high living standards (HLS), and HPG + HLS. The climate change scenarios were constructed using the downloaded Global Climate Model dataset (RCP-4.5 and RCP-8.5) to calculate the impact of climate change on the supply–demand gap by the year 2050. Figure 3 shows the complete workflow and data inputs for developing the WEAP model.

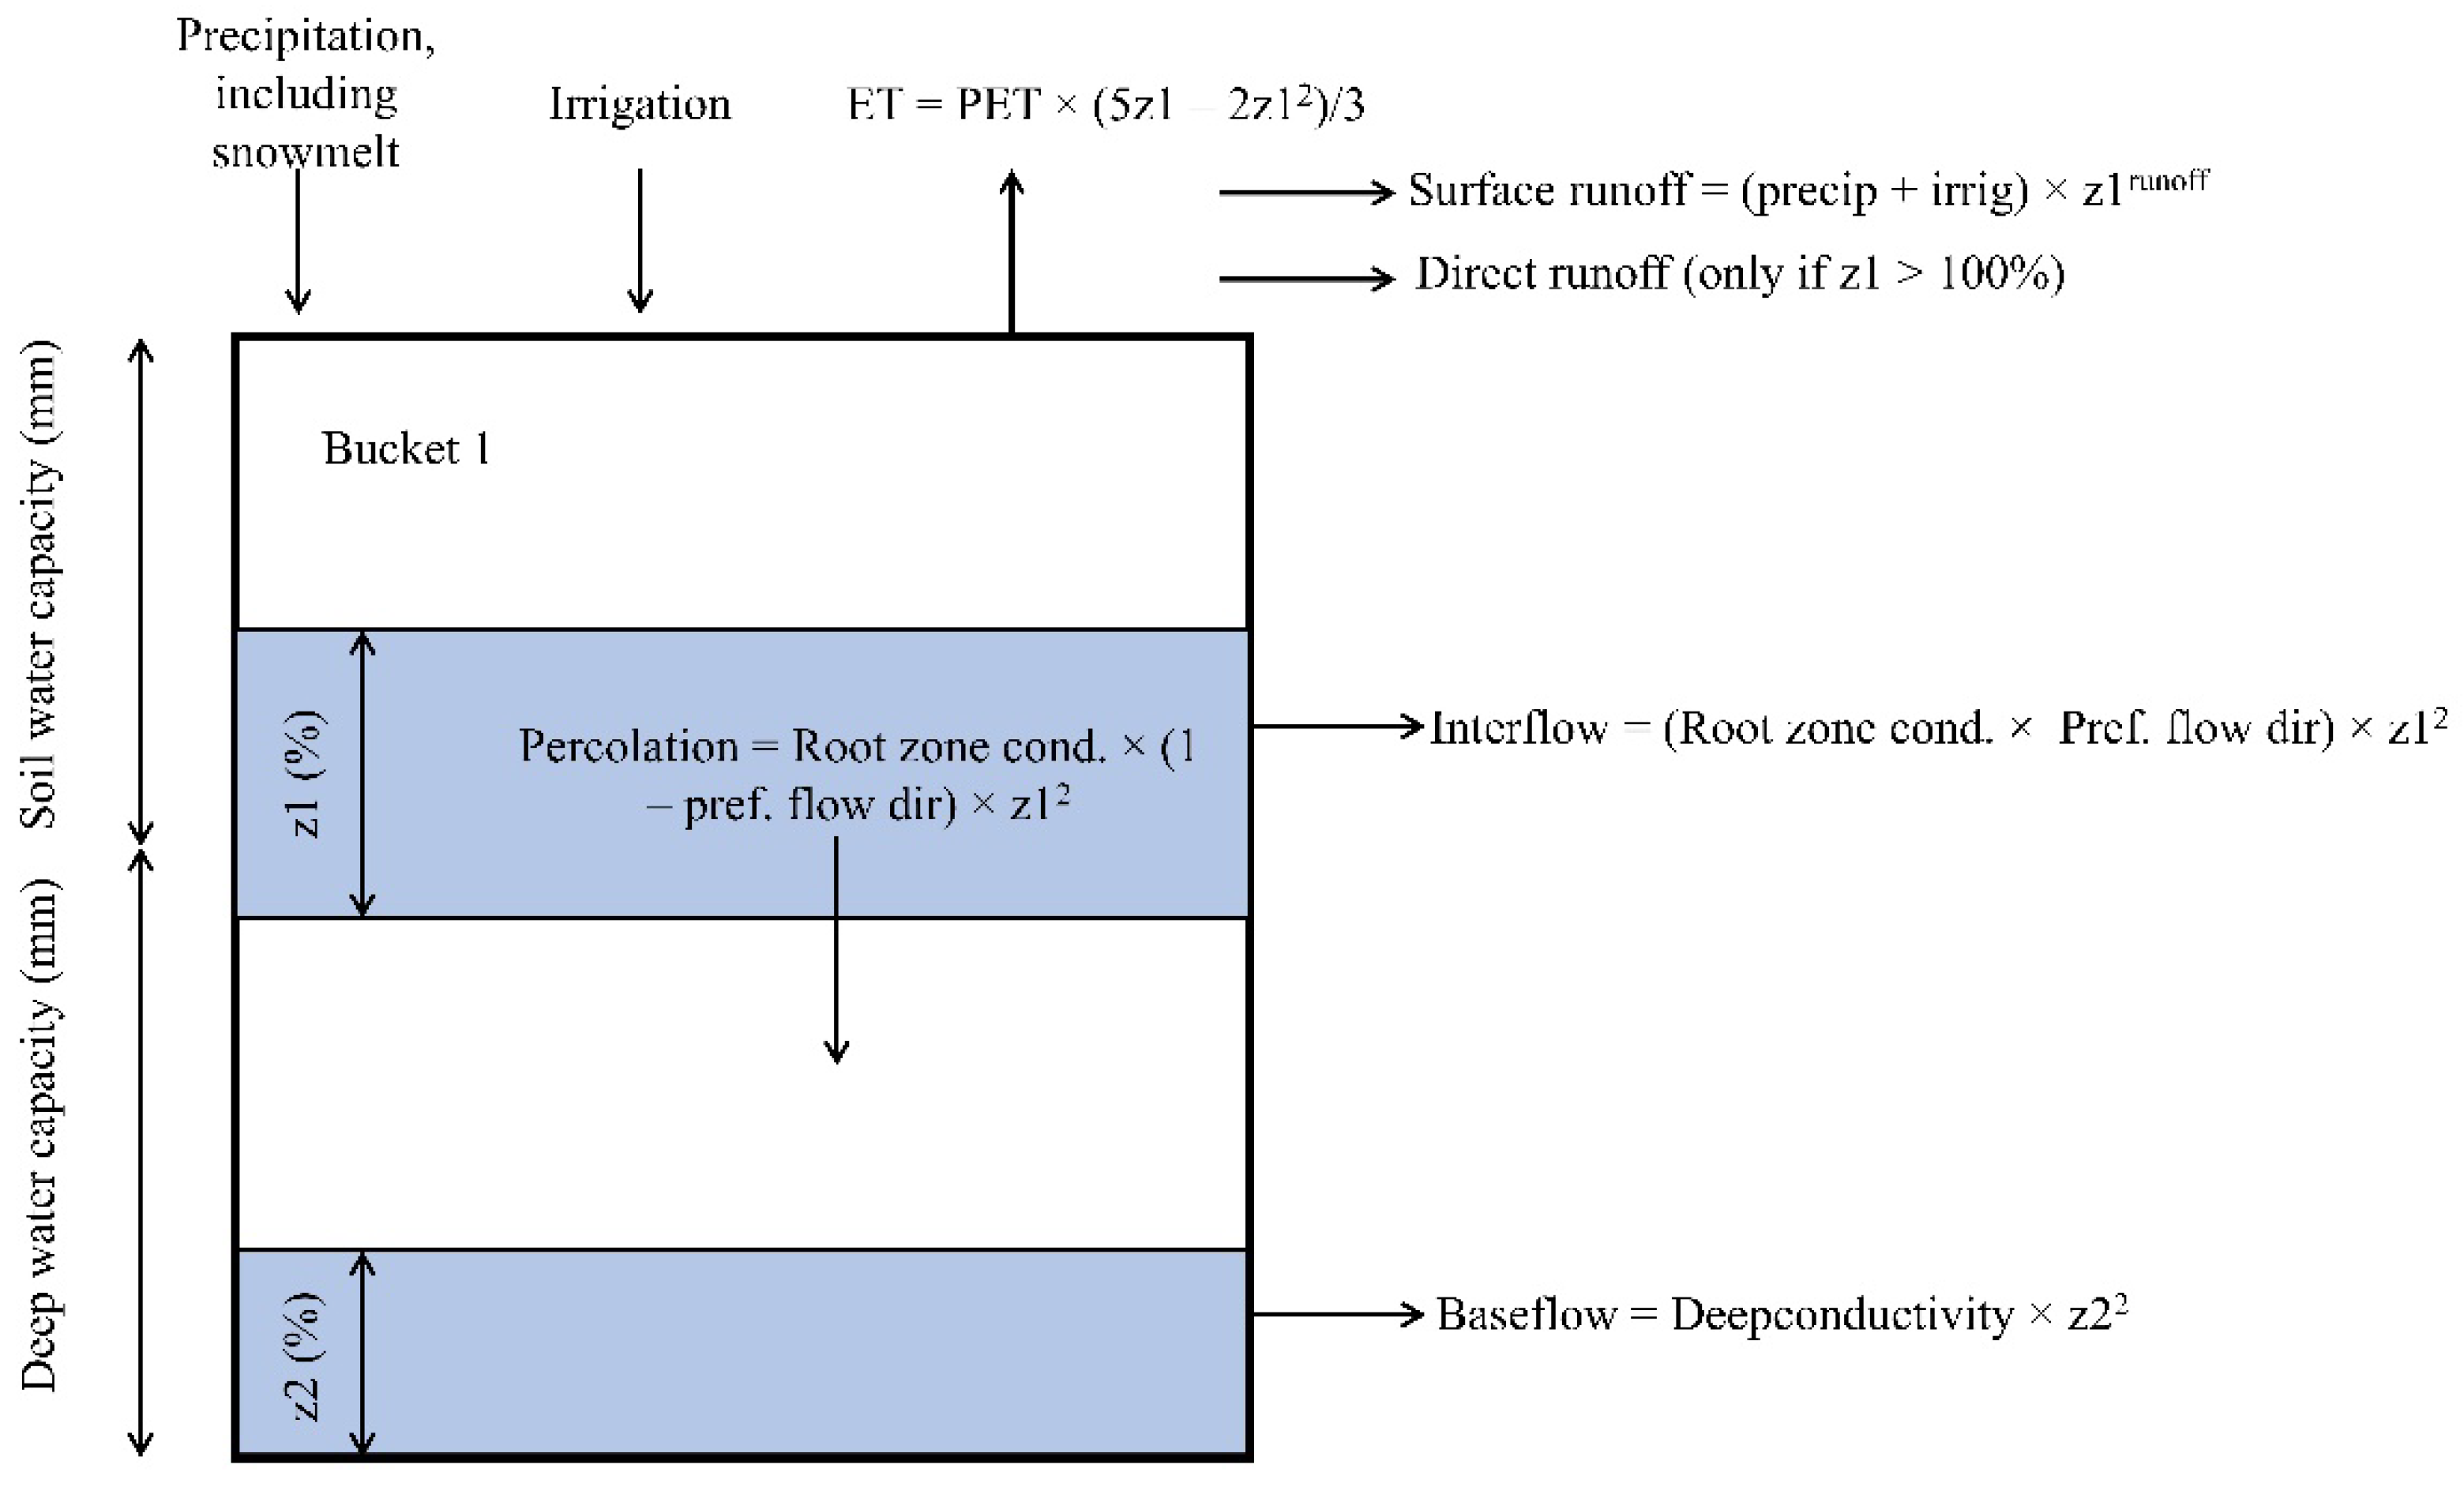
2.4. Hydro-Economic WEAP Model Description
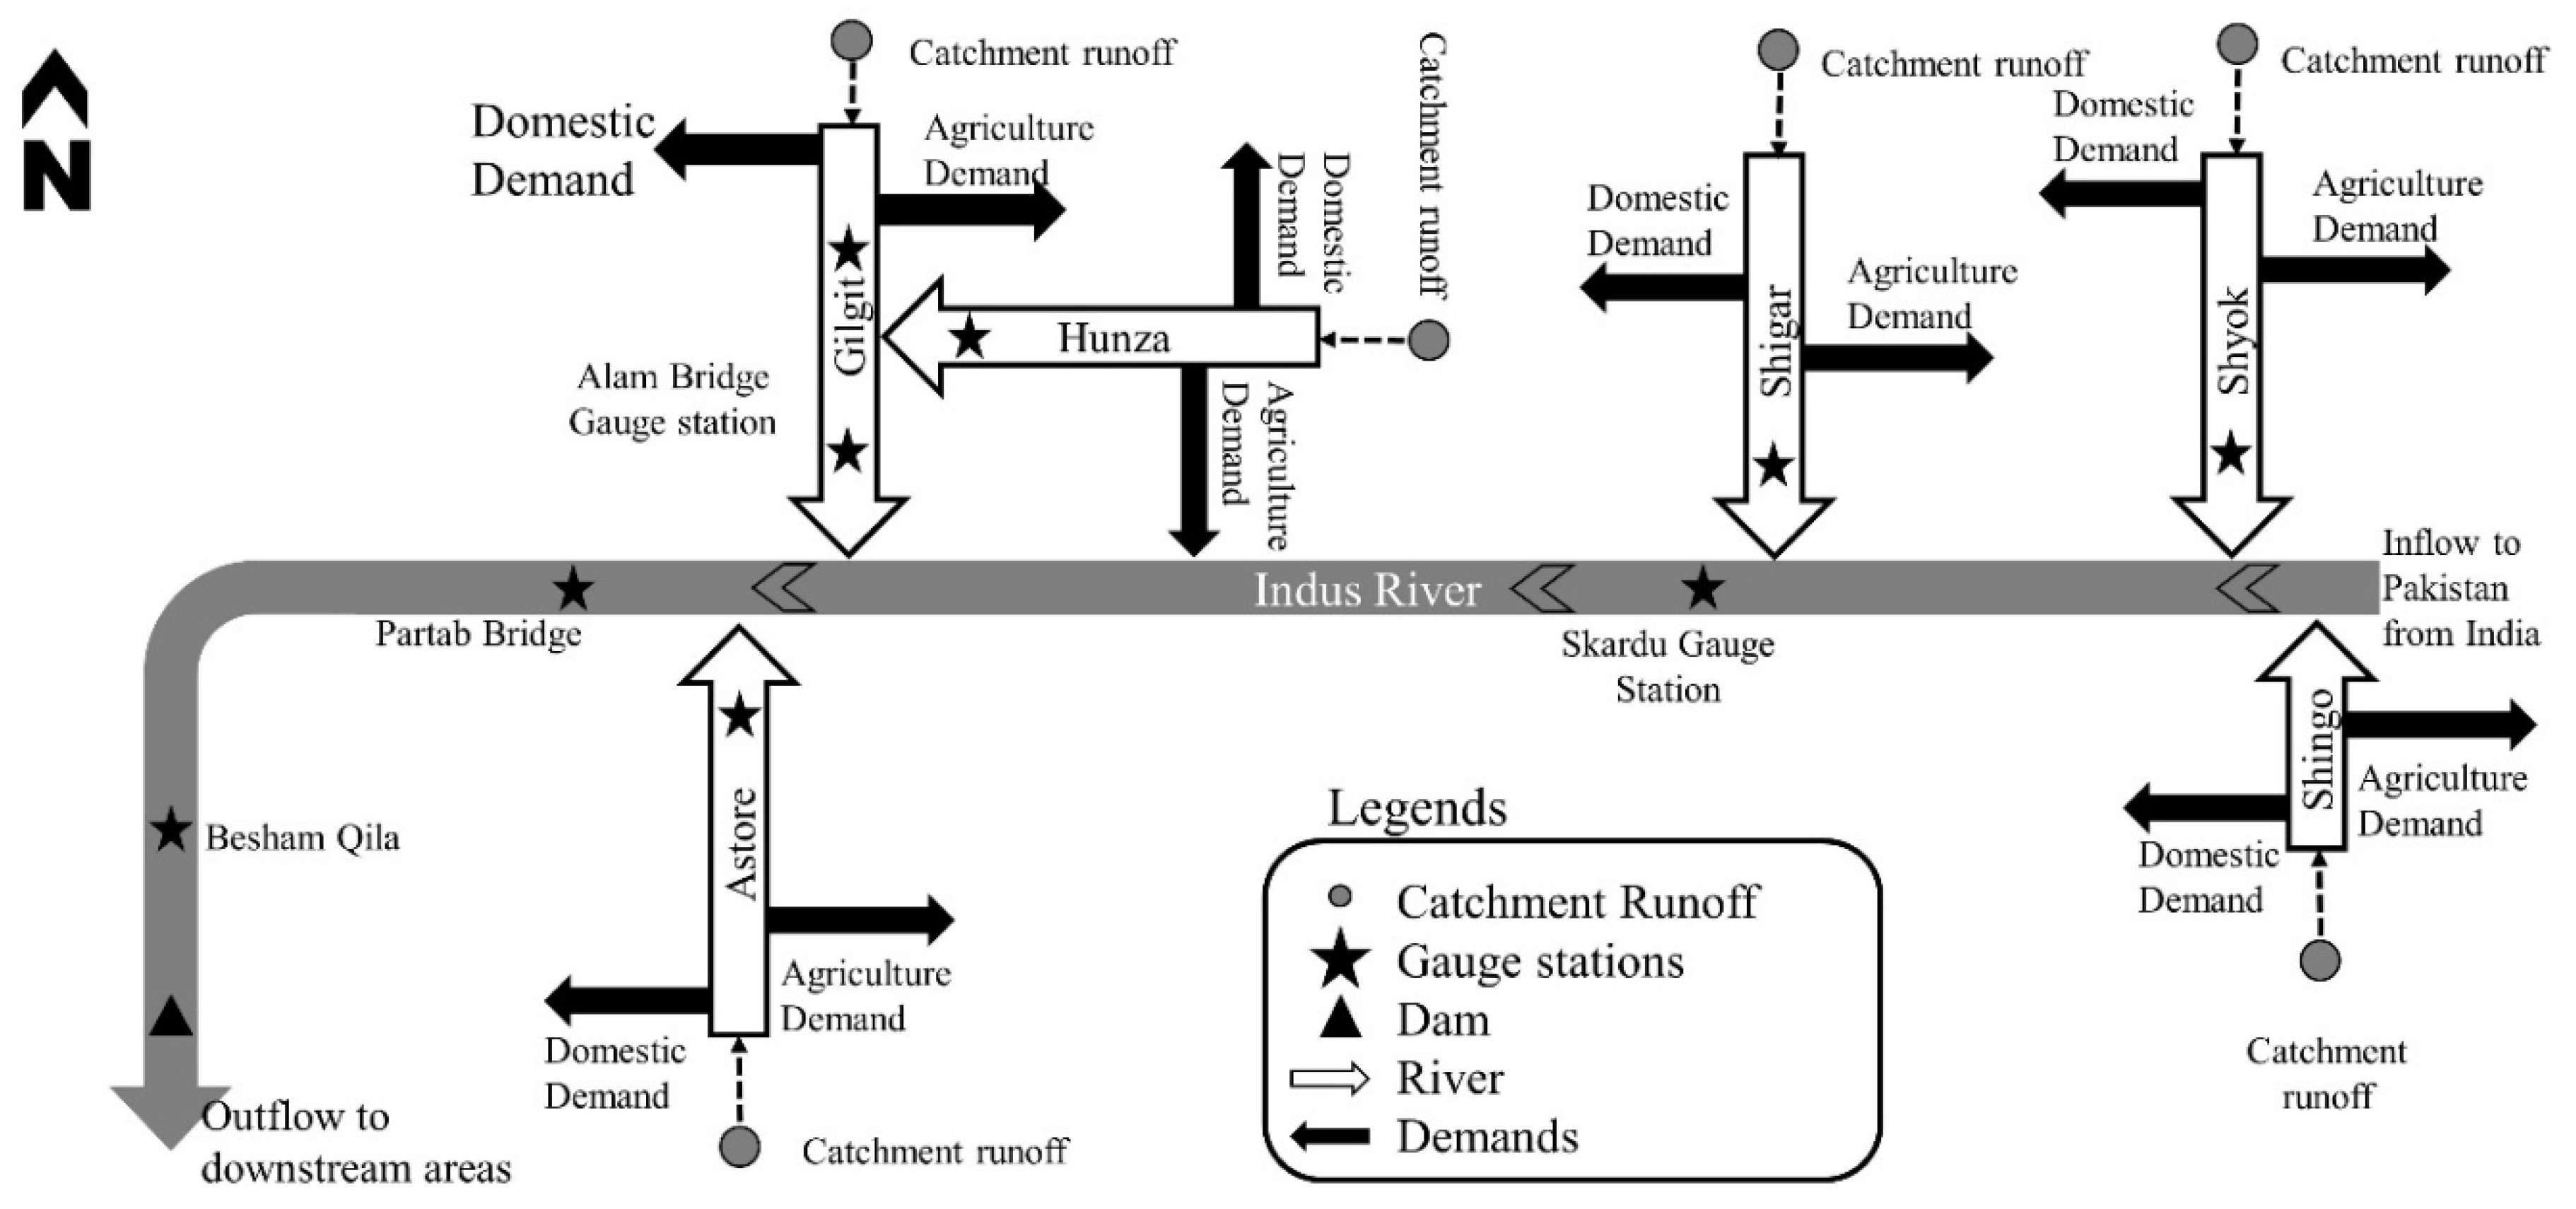
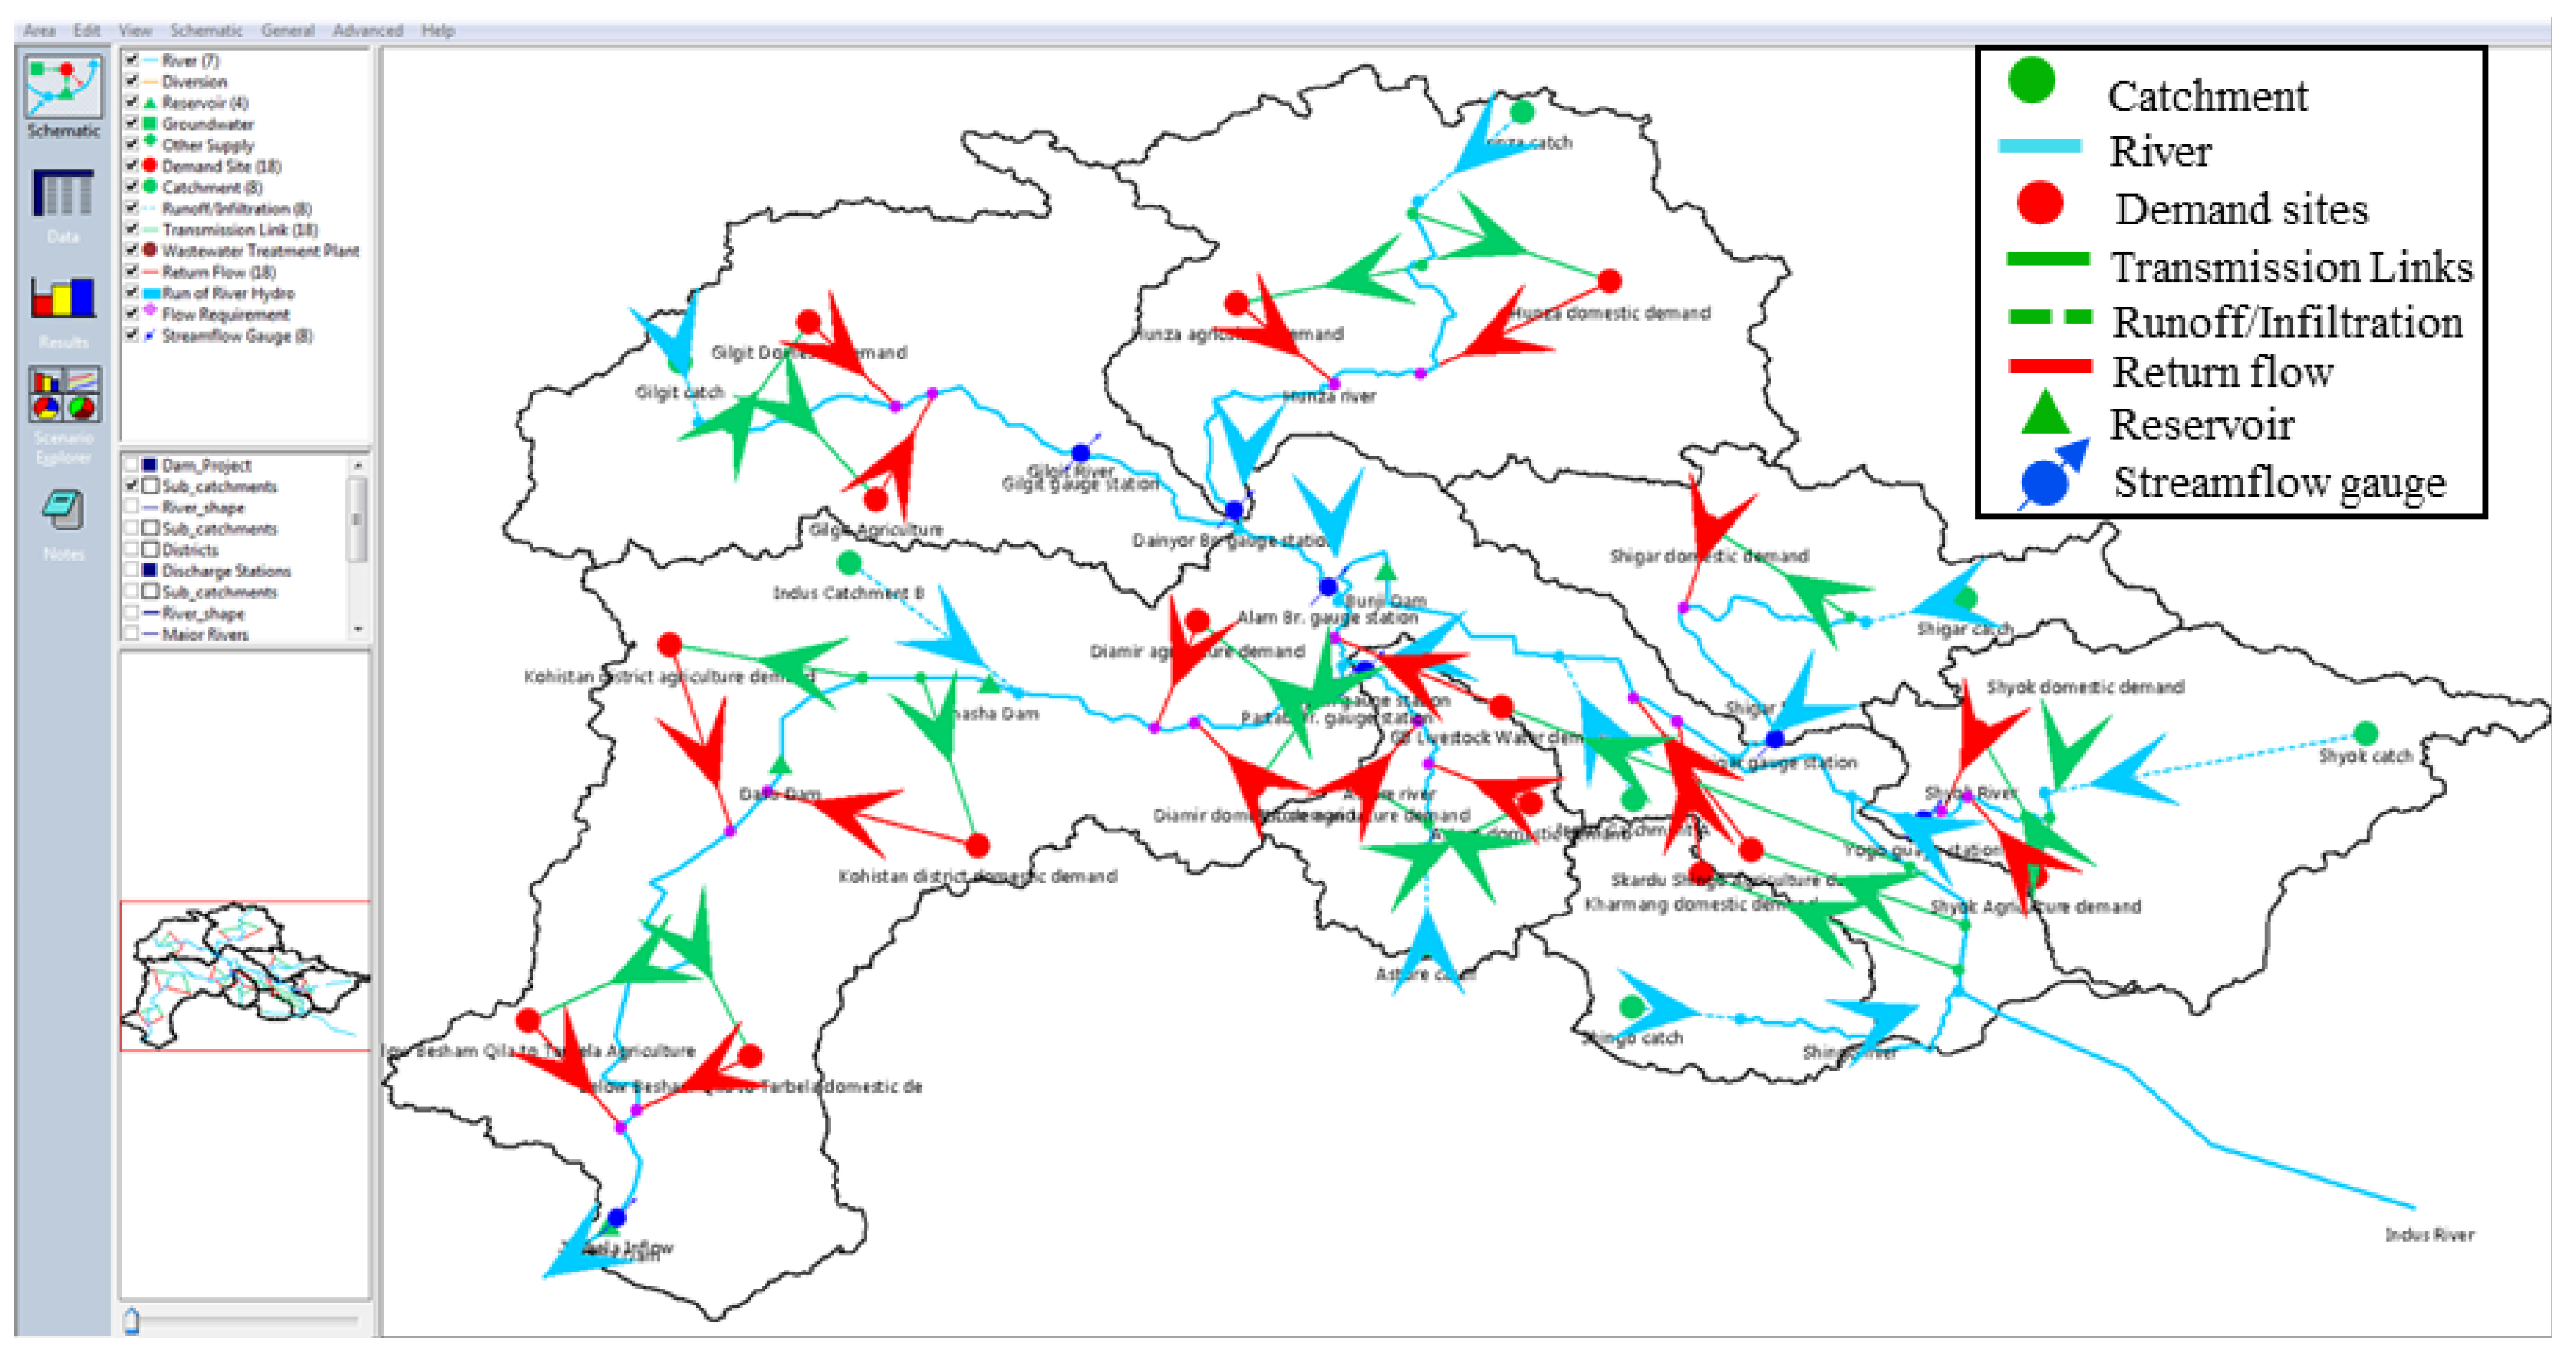
The WEAP tool was used to represent the current water supply and demand in all six catchments. The tool is widely used in the world for water allocation and water management [27]. It provides an integrated assessment of the land use, hydrology, climate, water allocation, and water management of the catchment [28]. The WEAP model addresses a number of water issues including the agricultural sector, surface and groundwater sources, sectoral (domestic, agricultural, and industrial) demand analyses, water management, water allocation using priorities, conjunctive use, reservoir operations, and the cost management by financial planning [22,29]. Based on the linear programming structure, it solves the water allocation problems at user-defined time-steps (monthly or daily) [22].
The WEAP model was used to simulate both the hydrological behavior and anthropogenic activities of water resources to analyze the water availability in the basin [30]. It is useful since it simulates the water supply and demand based on a set of scenarios like demographic changes or water policies for a user-required time period [22]. These future simulations (or scenarios) are compared to the current (or the baseline) year. Generally, the baseline is the year for which there is an availability of all the input data required by the WEAP model including the streamflow, climate data, demographic, and soil and land use/cover. It depicts the actual water supply condition in the catchment, also known as the current account. The baseline year is selected because the model needs a current water availability value which will be further used for a comparison between the current and future water availabilities under different socio-economic, climate, or management scenarios [31]. The WEAP model uses five methods to simulate catchment processes on a daily or monthly basis. The soil moisture method was selected for this study because it allows for the characterization of the impacts of the land use and soil types on these processes [22]. It is a 1-D, 2-bucket water accounting method based on empirical functions that is used to explain the deep percolation, evapotranspiration, surface runoff, and interflow for basin or sub-basins (Figure 4).
The mathematical formula of the soil moisture method [28] is as follows:
R d j d z 1 , j d t = P e ( t ) P E T ( t ) k c , j ( t ) ( 5 z 1 , j 2 z 1 , j 2 3 ) P e ( t ) z 1 , j R R F j f j k s , j z 1 , j 2 ( 1 f j ) k s , j z 1 , j 2
where z1,j = [1, 0] is the relative soil water storage, P e is the effective precipitation (mm), P E T ( t ) is the reference potential evapotranspiration, k c , j is the crop coefficient, and R R F j is the Runoff Resistance Factor of the land cover. Higher values of RRFj lead to less surface runoff; P e ( t ) z 1 , j R R F j is the surface runoff, f j   k s , j   z 1 , j 2 is the interflow from first soil layer, f j is the partition coefficient related to the land cover type, and k s , j is the saturated hydraulic conductivity of the root zone (mm/time).

2.5. Model Setup

The WEAP model was developed for the Upper Indus Basin (UIB) (Figure 5).
The WEAP model includes the following (Figure 6);
  • The main Indus River and six small tributaries (Gilgit, Hunza. Shigar, Shyok, Shingo, and Astore)
  • Eight catchment nodes. Nine domestic demands (Gilgit, Hunza, Shigar, Shyok, Shingo, Astore, Diamir, Kohistan, and the below besham streamflow site), seven agriculture demand sites, and one livestock demand site.
  • Eight runoff/infiltration lines. Eighteen transmission links.
  • Six streamflow gauge stations (Doyian (Astore river), Dainyor Br. (Hunza river), Shigar (Shigar river), Gilgit (Gilgit river), Yogo (Shyok river), Partab Br. (Indus River), and Besham Qila (Indus river).

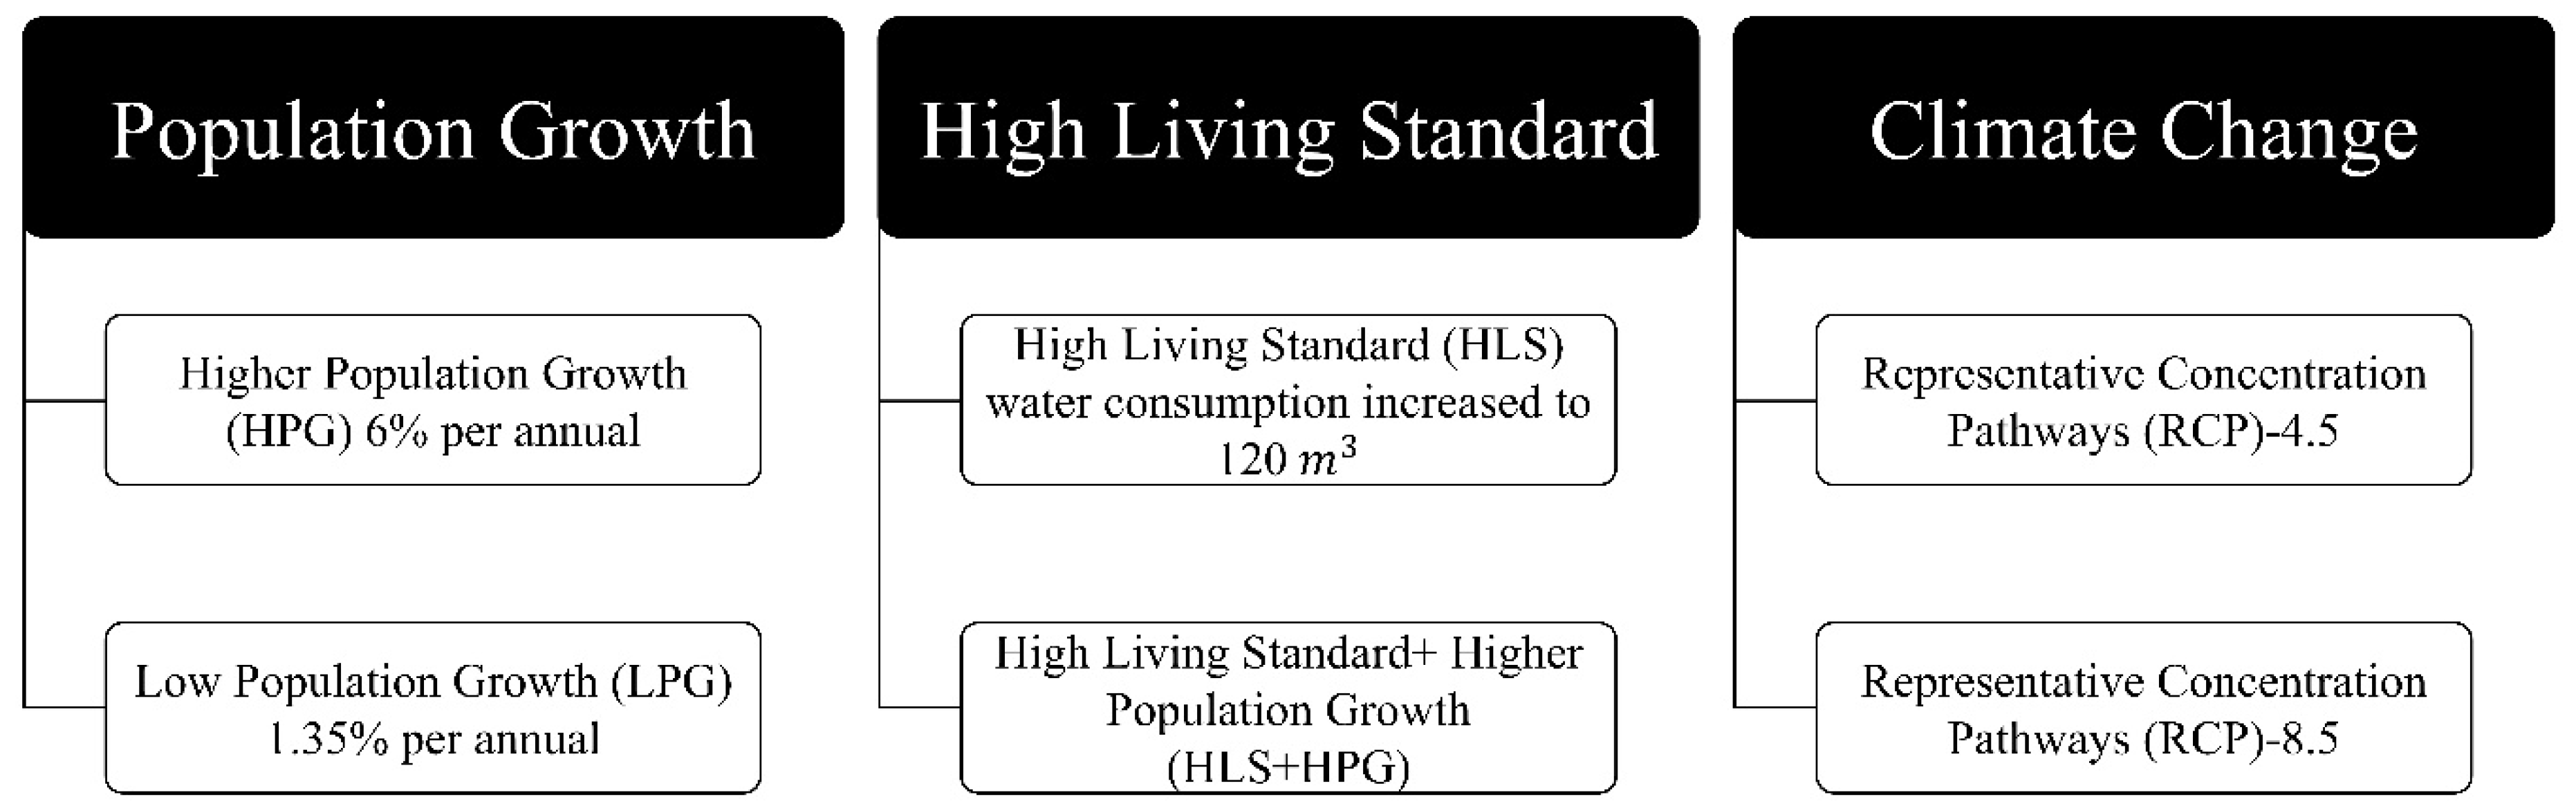
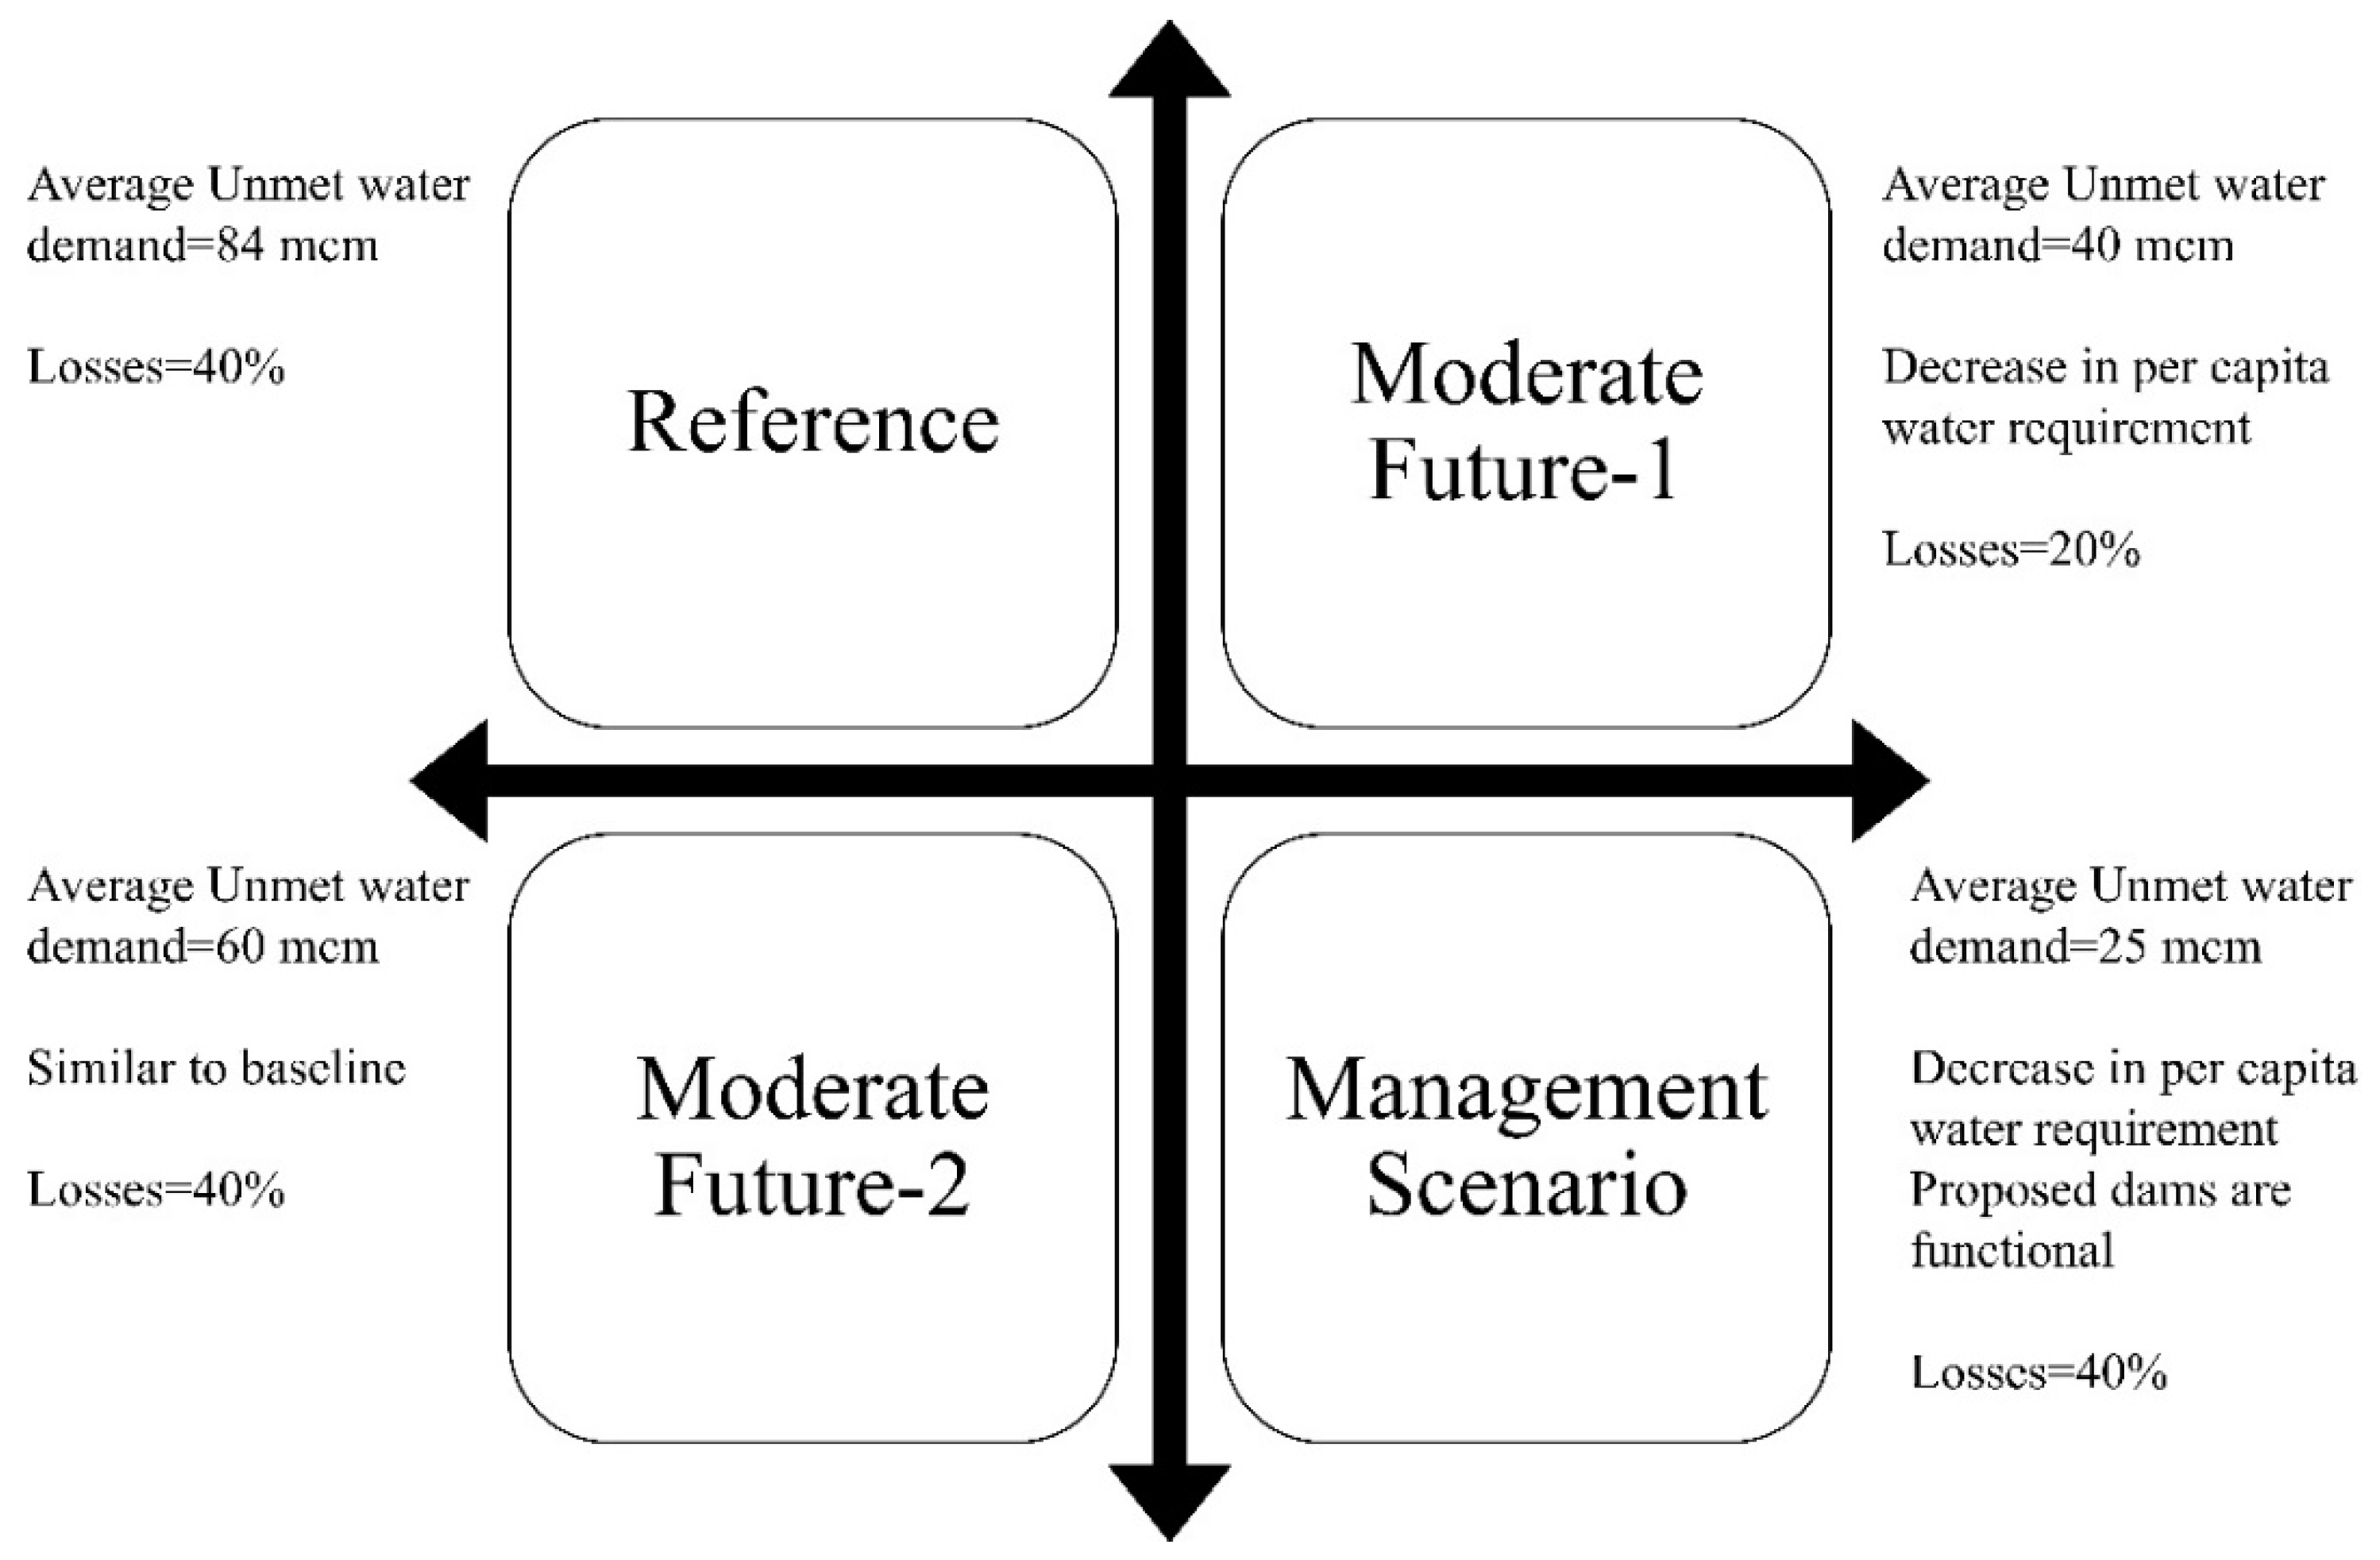
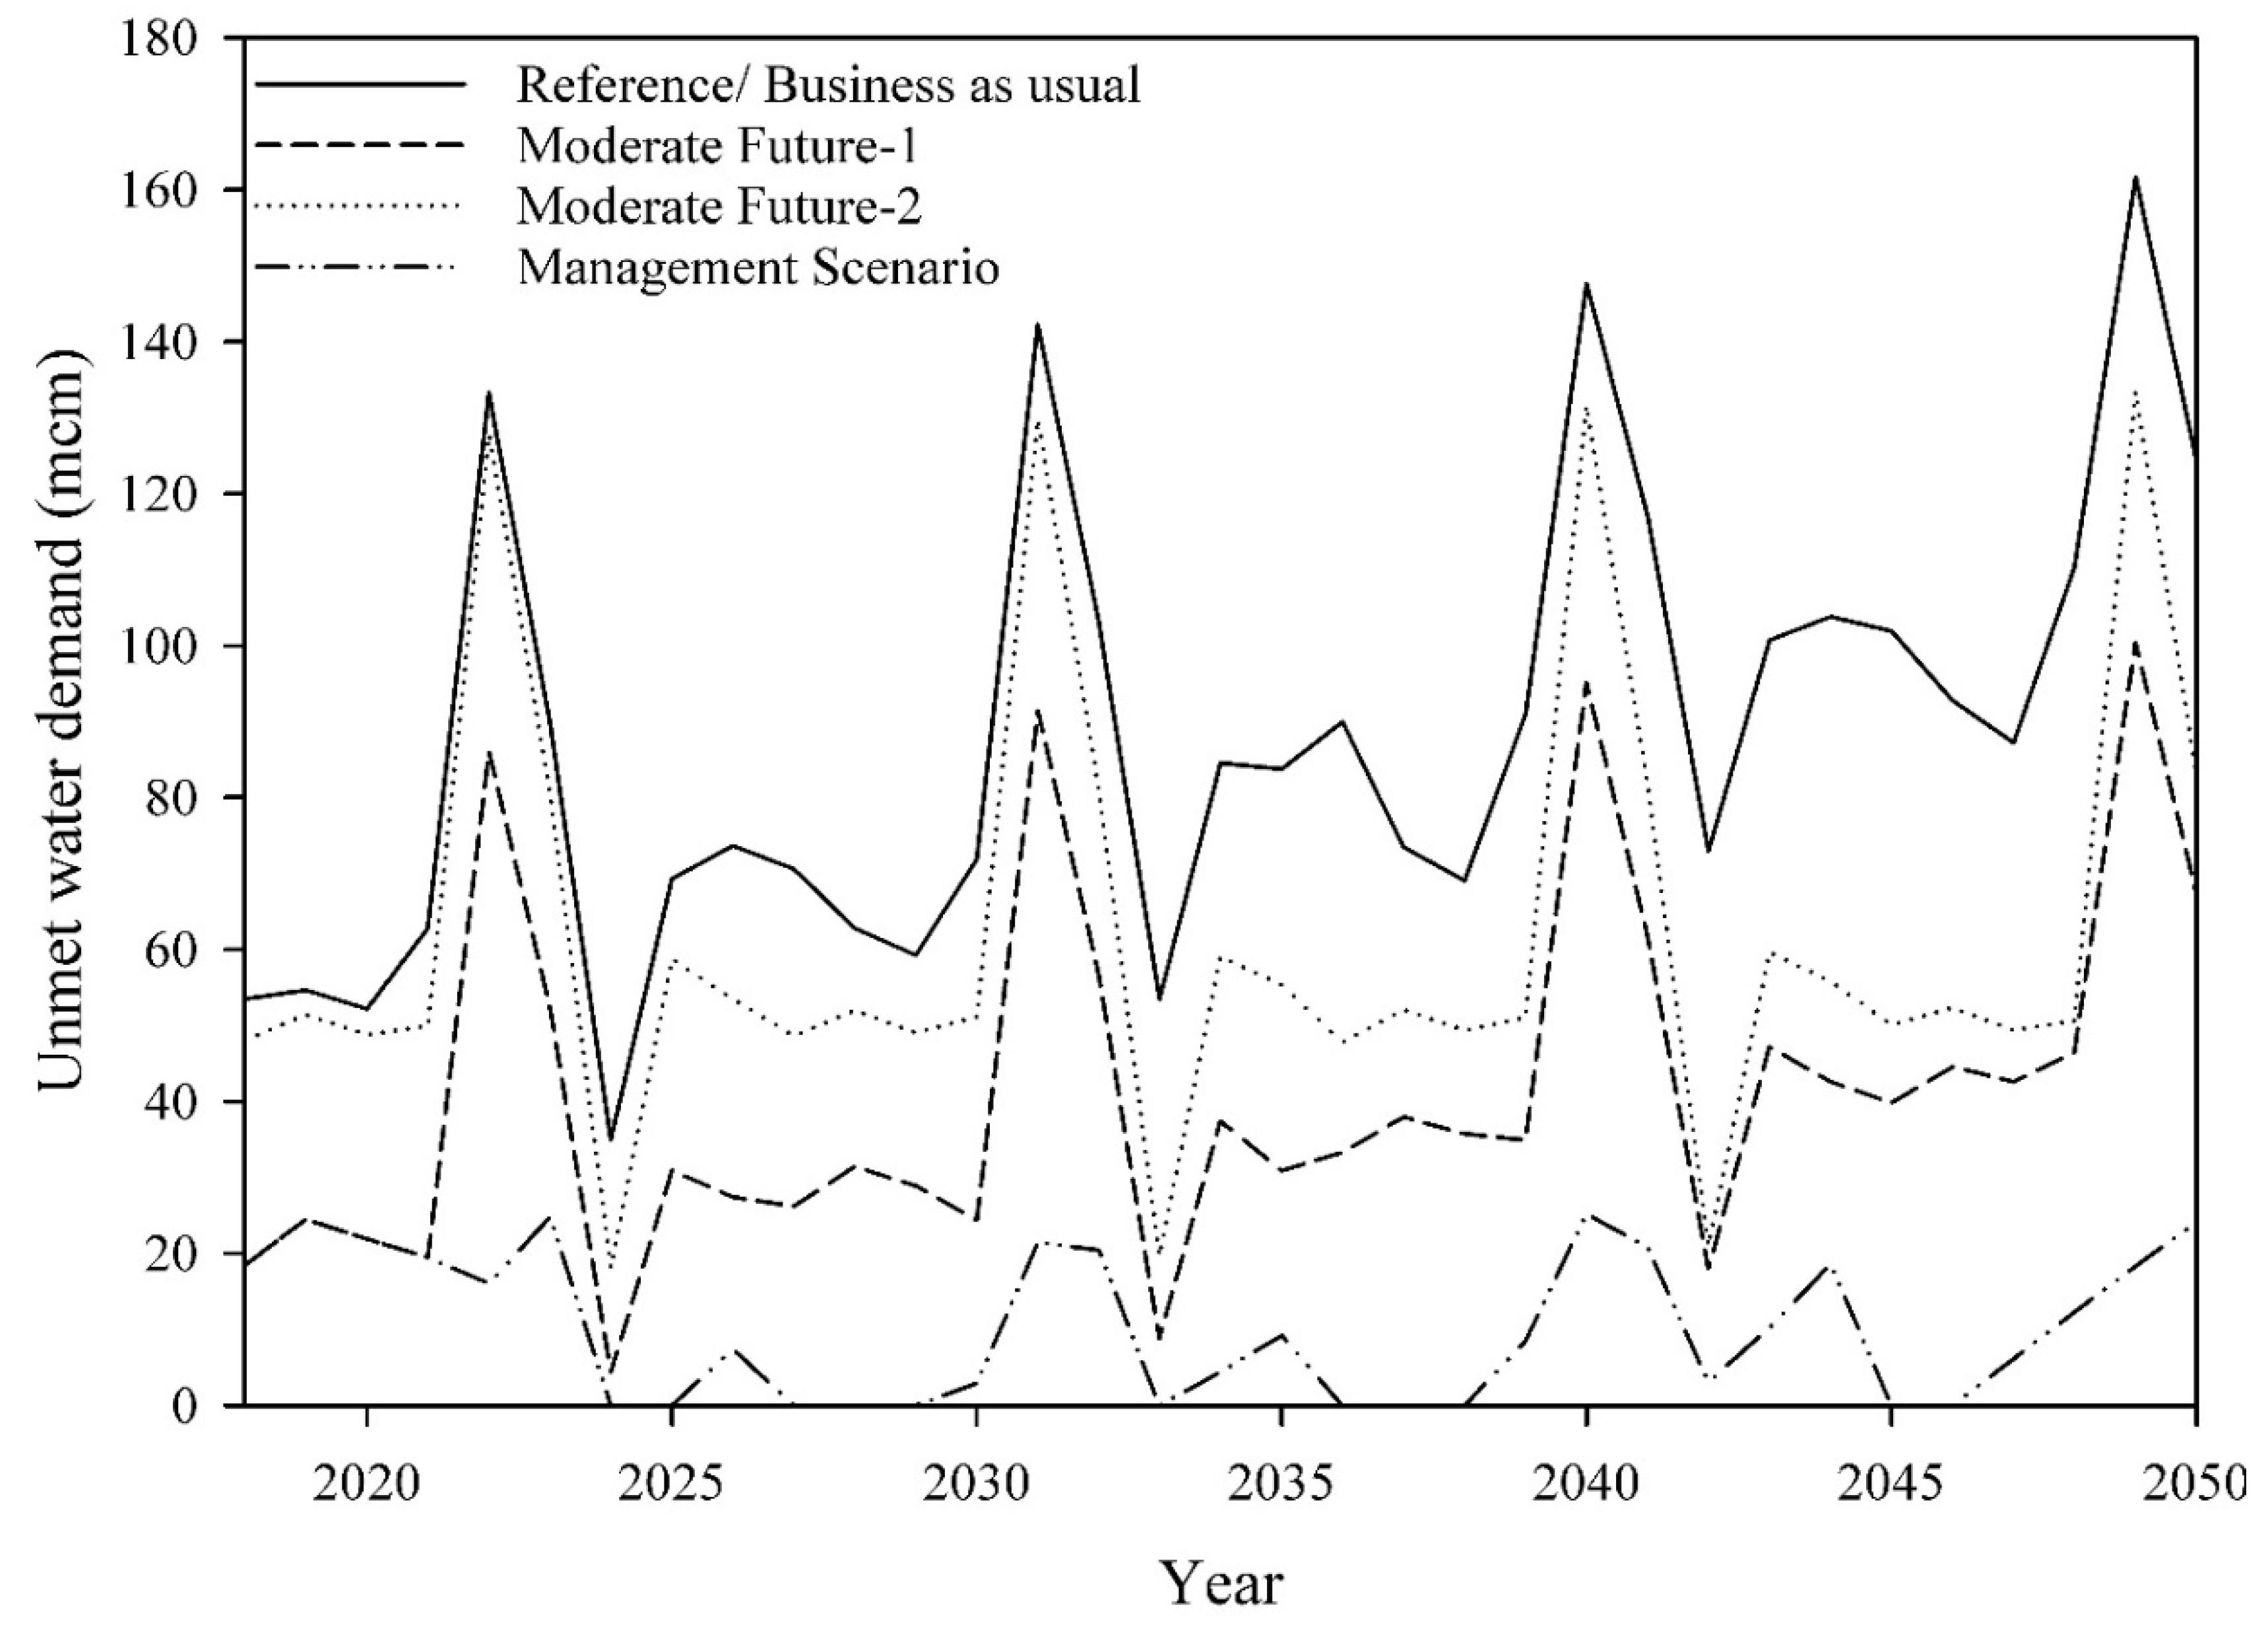
Scenario Development

In the WEAP model, the scenarios were built based on “what if” questions [32] and compared to the reference scenario. In this study, the scenarios were developed using external changes (that is, population growth, living standards, and so forth) and the impact of climate change in order to predict the water supply–demand gap in the future. The first reference scenario constructed represented the present water supply–demand conditions in the catchment, which acts as a baseline for further analysis and comparison with the other scenarios of the model.
To understand the effect of external factors on the future water supply–demand in the UIB, the scenarios were used in the WEAP model to simulate socio-economic activities like high population growth (HPG), set to be 6%. Furthermore, the low population growth (LPG) rate was set to 1.35% and the higher living standards (HLS) was estimated to change from 82.9 m3 to 120 m3 due to economic growth and increased urbanization (Figure 7)
For the climate change scenarios, the climate data was acquired using the downloaded Global Circulation Model (GCM) datasets [33]. There were four Representative Concentration Pathways (RCPs), namely, RCP2.6, RCP4.5, RCP6.0, and RCP8.5. The RCP scenarios were named according to the radiative forcing target level 2100. For this study, the RCP 4.5 and RCP 8.5 scenarios were selected because of the study period time length. The RCP4.5 scenario described a stabilization of the pathway after 2100 without exceeding 4.5 W/m2 (~650 ppm CO 2 ) [34]. The RCP8.5 scenario corresponded to the rising radiative forcing pathway leading to 8.5 W/m2 (~1370 ppm CO 2 ) by 2100 [35]. This scenario was related to the situation with no climate policies and high emissions of greenhouse gases.
The workflow of the scenarios is shown in Figure 8 below.
The accuracy of the model was computed using the coefficient of determination and the Nash–Sutcliffe efficiency index [36,37].

3. Results

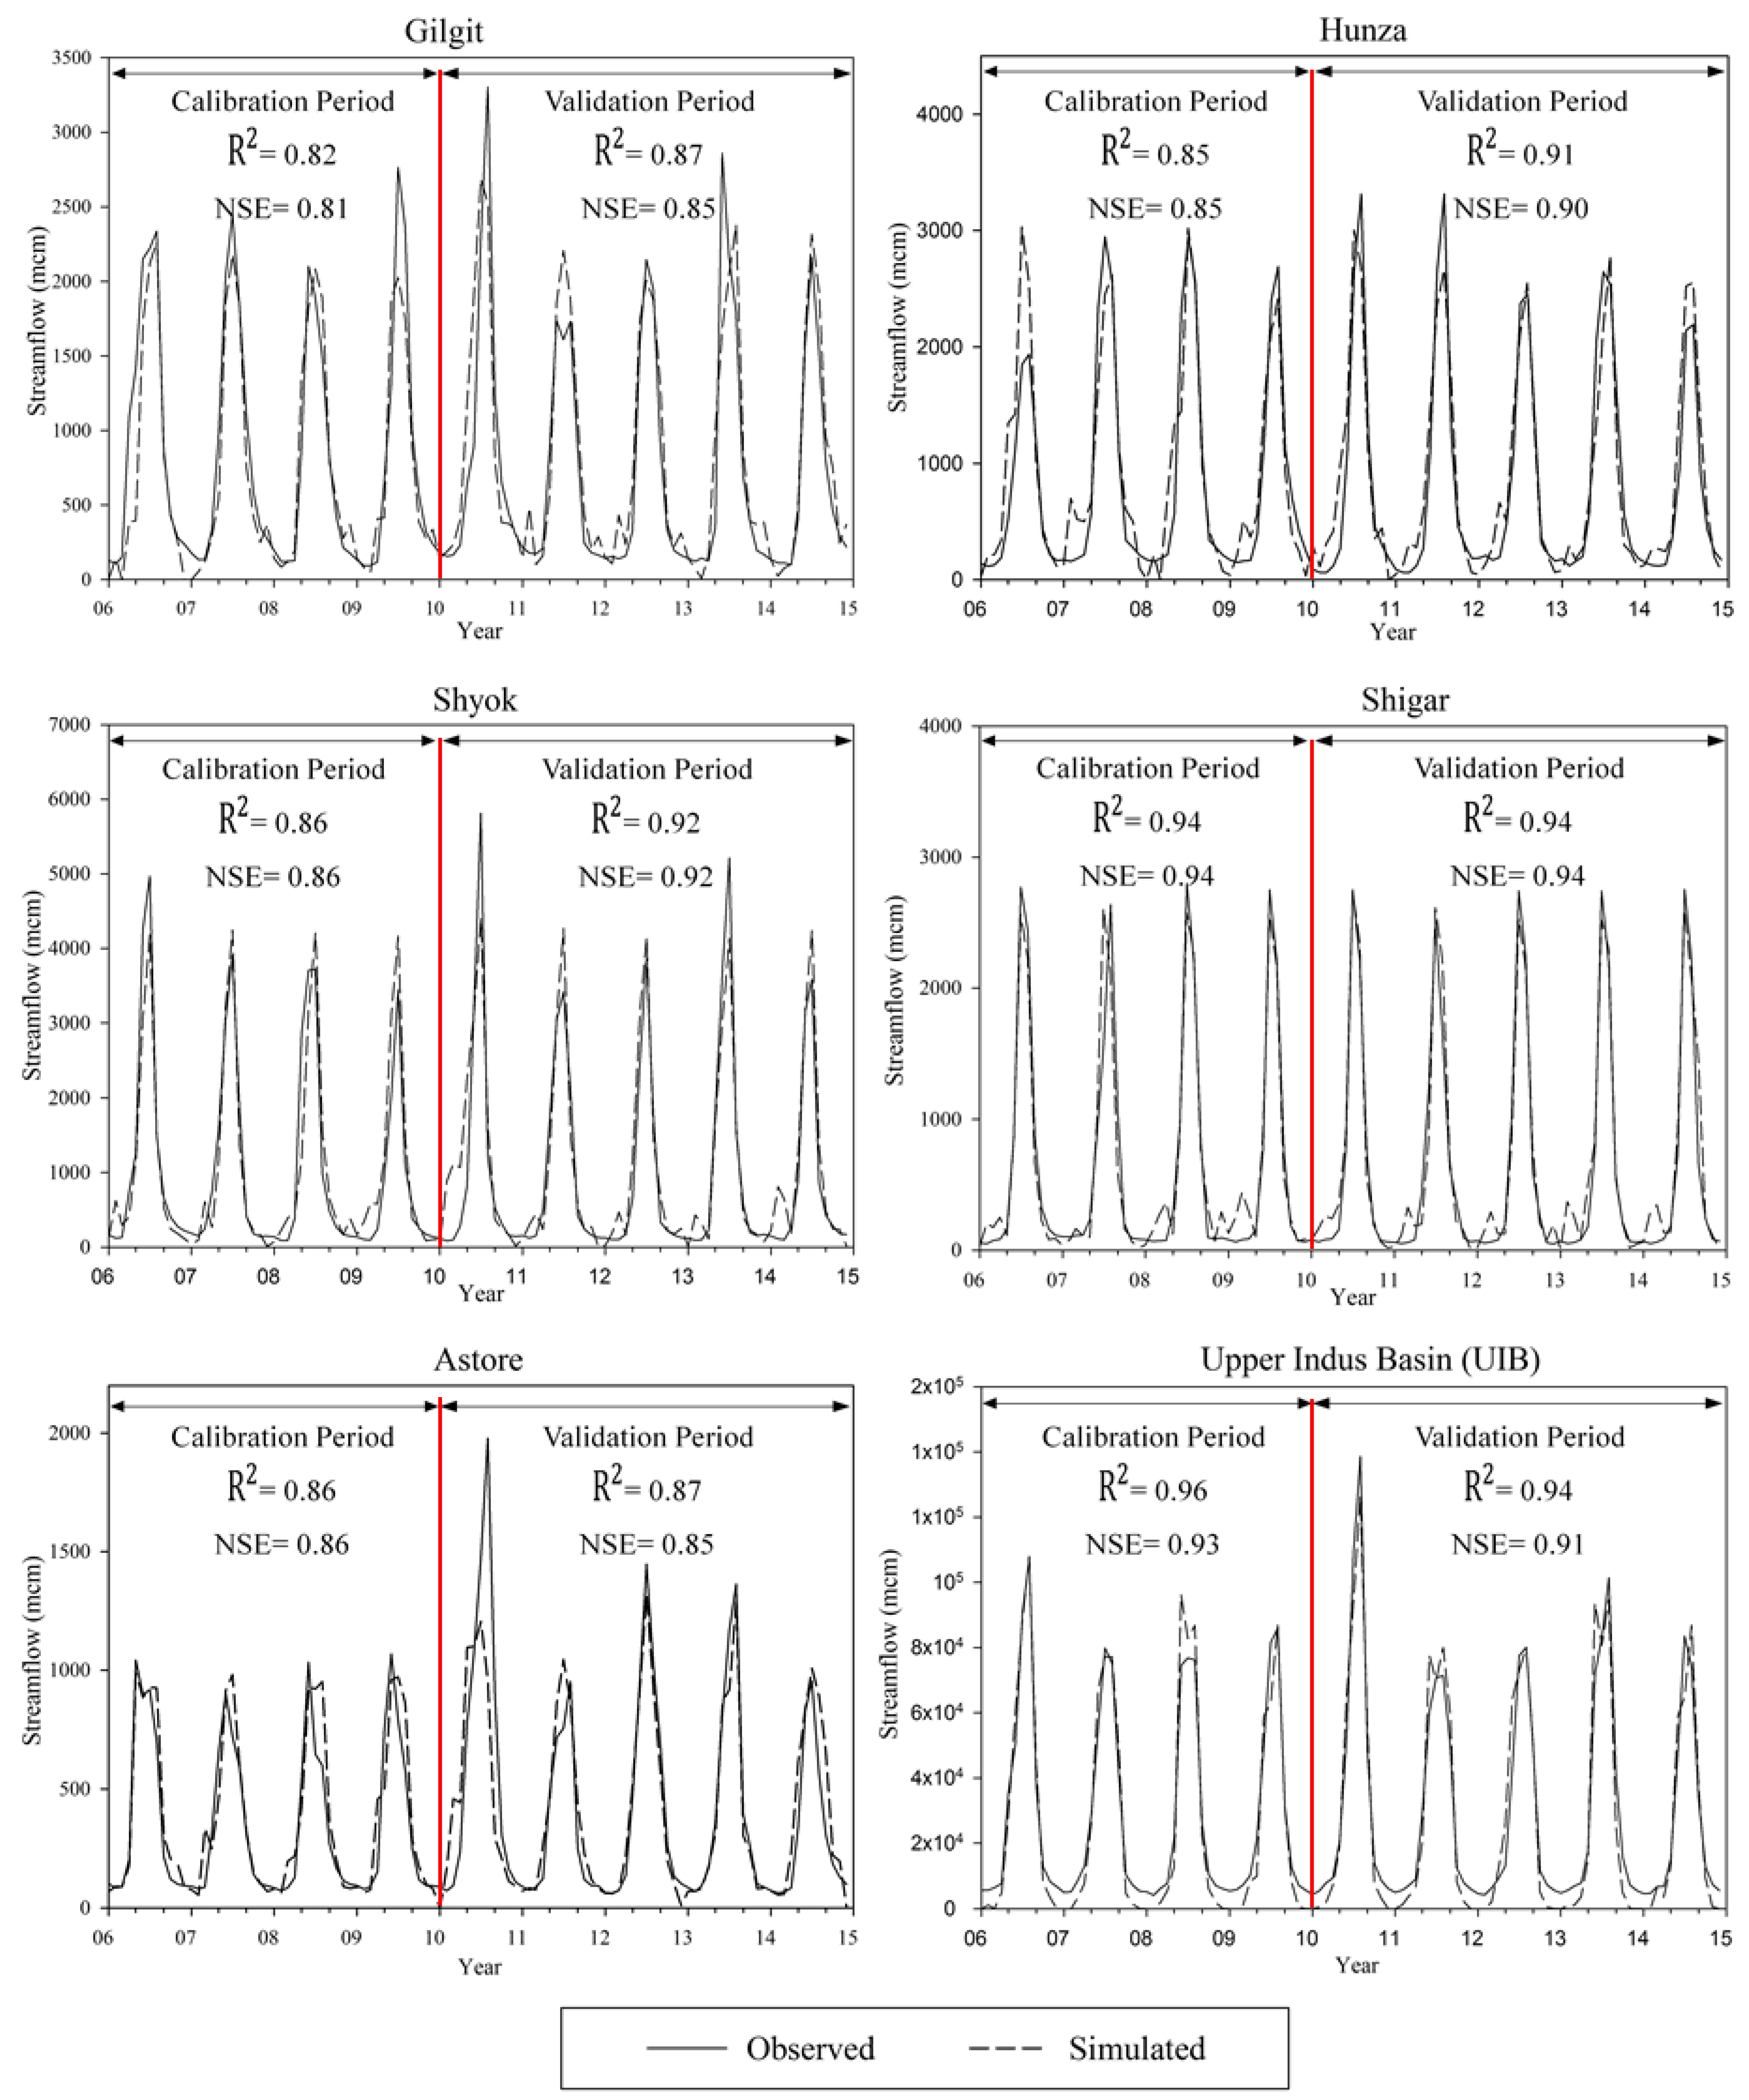
3.1. Model Calibration and Validation

The hydrological and economic data of the UIB were used to calibrate and validate the Hydro-Economic WEAP model for the period of 2006–2014 (Figure 9). To simulate the discharge data in the WEAP model crop coefficient (kc) of the land cover types, the root zone conductivity, the preferred flow direction, and the soil water capacity were calibrated manually. These values were selected based on the location of study area and the default values of the WEAP. The values for the coefficient of determination ranged between 0.82 and 0.96 with an average of 0.88, while the Nash–Sutcliffe parameter varied from 0.81 to 0.94 with an average of 0.87. The Nash–Sutcliffe efficiency ranges from −∞ to 1. An efficiency of 1 (E = 1) corresponds to a perfect match between the modeled discharge and the observed data [38]. The values of these parameters show that the hydrology of the UIB is predicted accurately by the WEAP model. In a sense, this provides a confidence that the future streamflow prediction can be accurately projected based on future scenarios. Table 2 shows the range of the values used for the different parameters in order to calibrate the model.

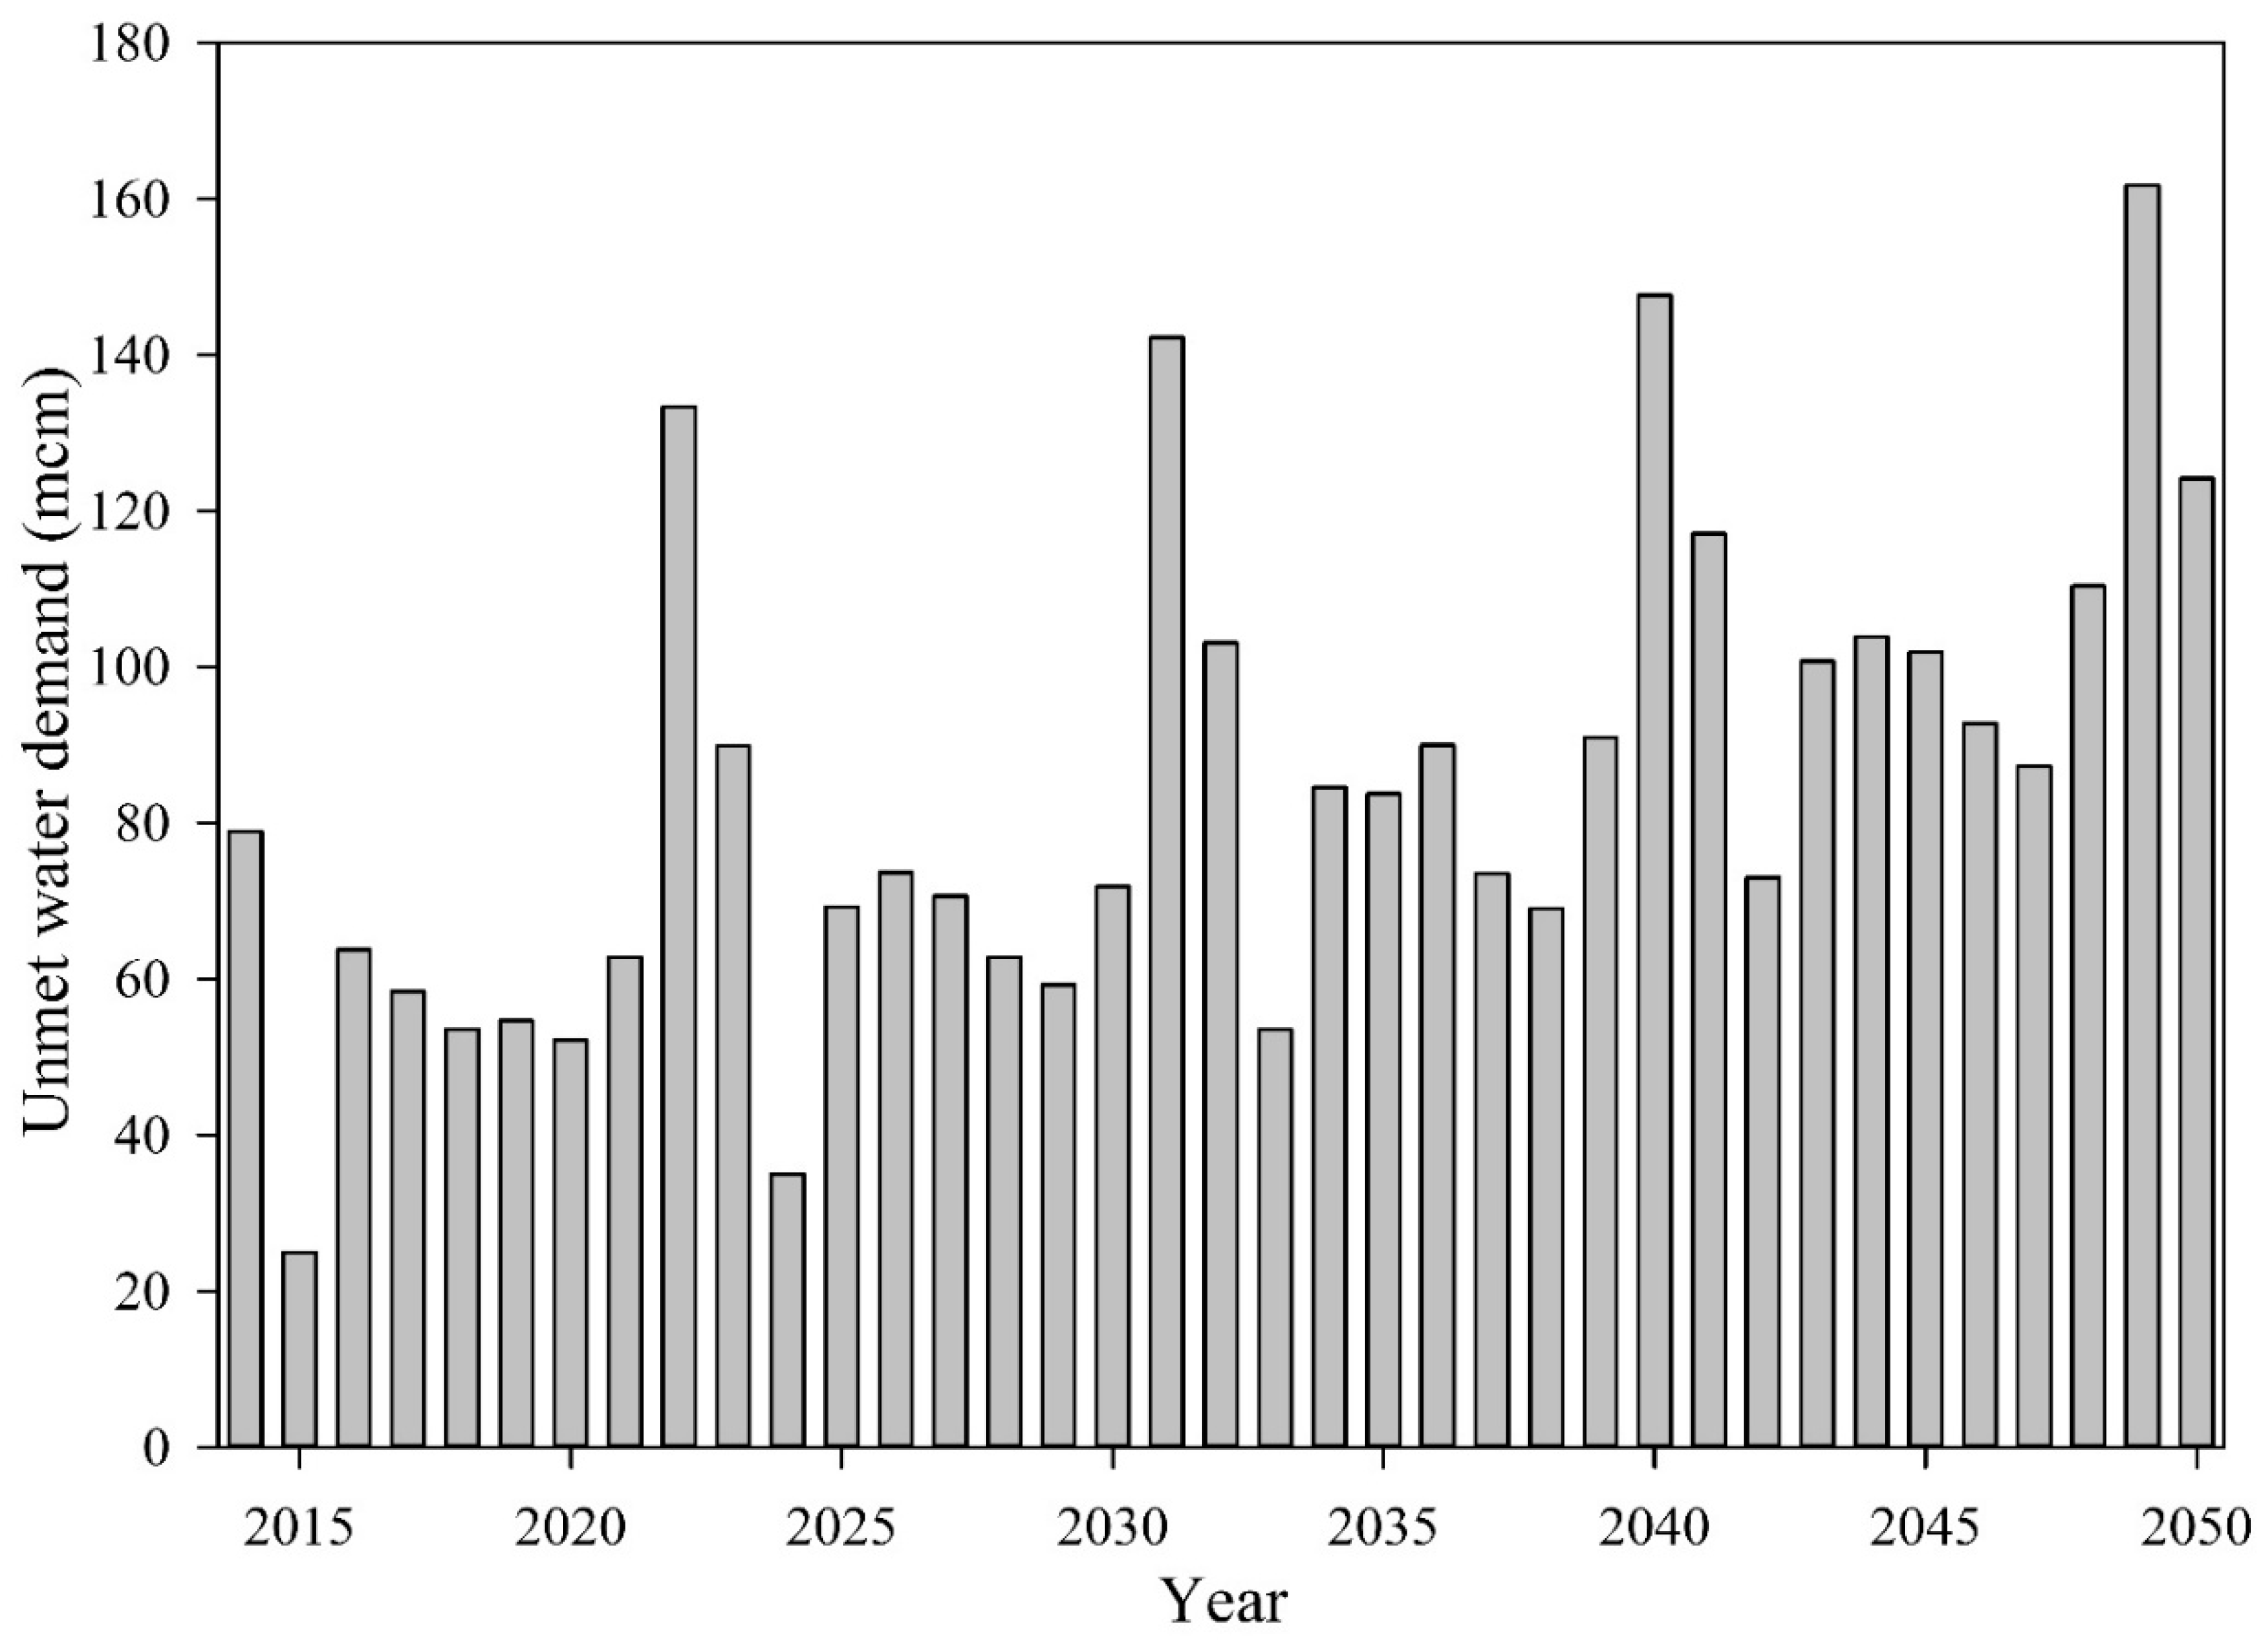
3.2. Scenario 1: Reference/Business as Usual

Figure 10 shows the results of the current/reference scenario simulation and analysis for the unmet water demand. The graph shows that in the year 2014, the average water demand coverage was 90% and that the average monthly supply delivered in the catchment was 44.3 mcm. Based on the baseline conditions, the estimation of the future water supply–demand conditions indicated that the average water demand coverage in the UIB would decrease from 90% to 75% in 2050. The unmet water demands, which were 78.9 mcm in 2014, were estimated to be 134.56 mcm in 2050. The water demands were calculated based on the per capita water consumption rate, which includes the population growth and the agricultural water requirement in the catchment. The reference scenario analysis developed was based on the assumption that if there were no changes in the water supply system of the catchment, the water coverage in the catchment would decrease by 15% in 2050. The reference scenario analysis concluded that no improvement in the water infrastructure and the supply situation would lead the catchment to a water scarcity in the future.

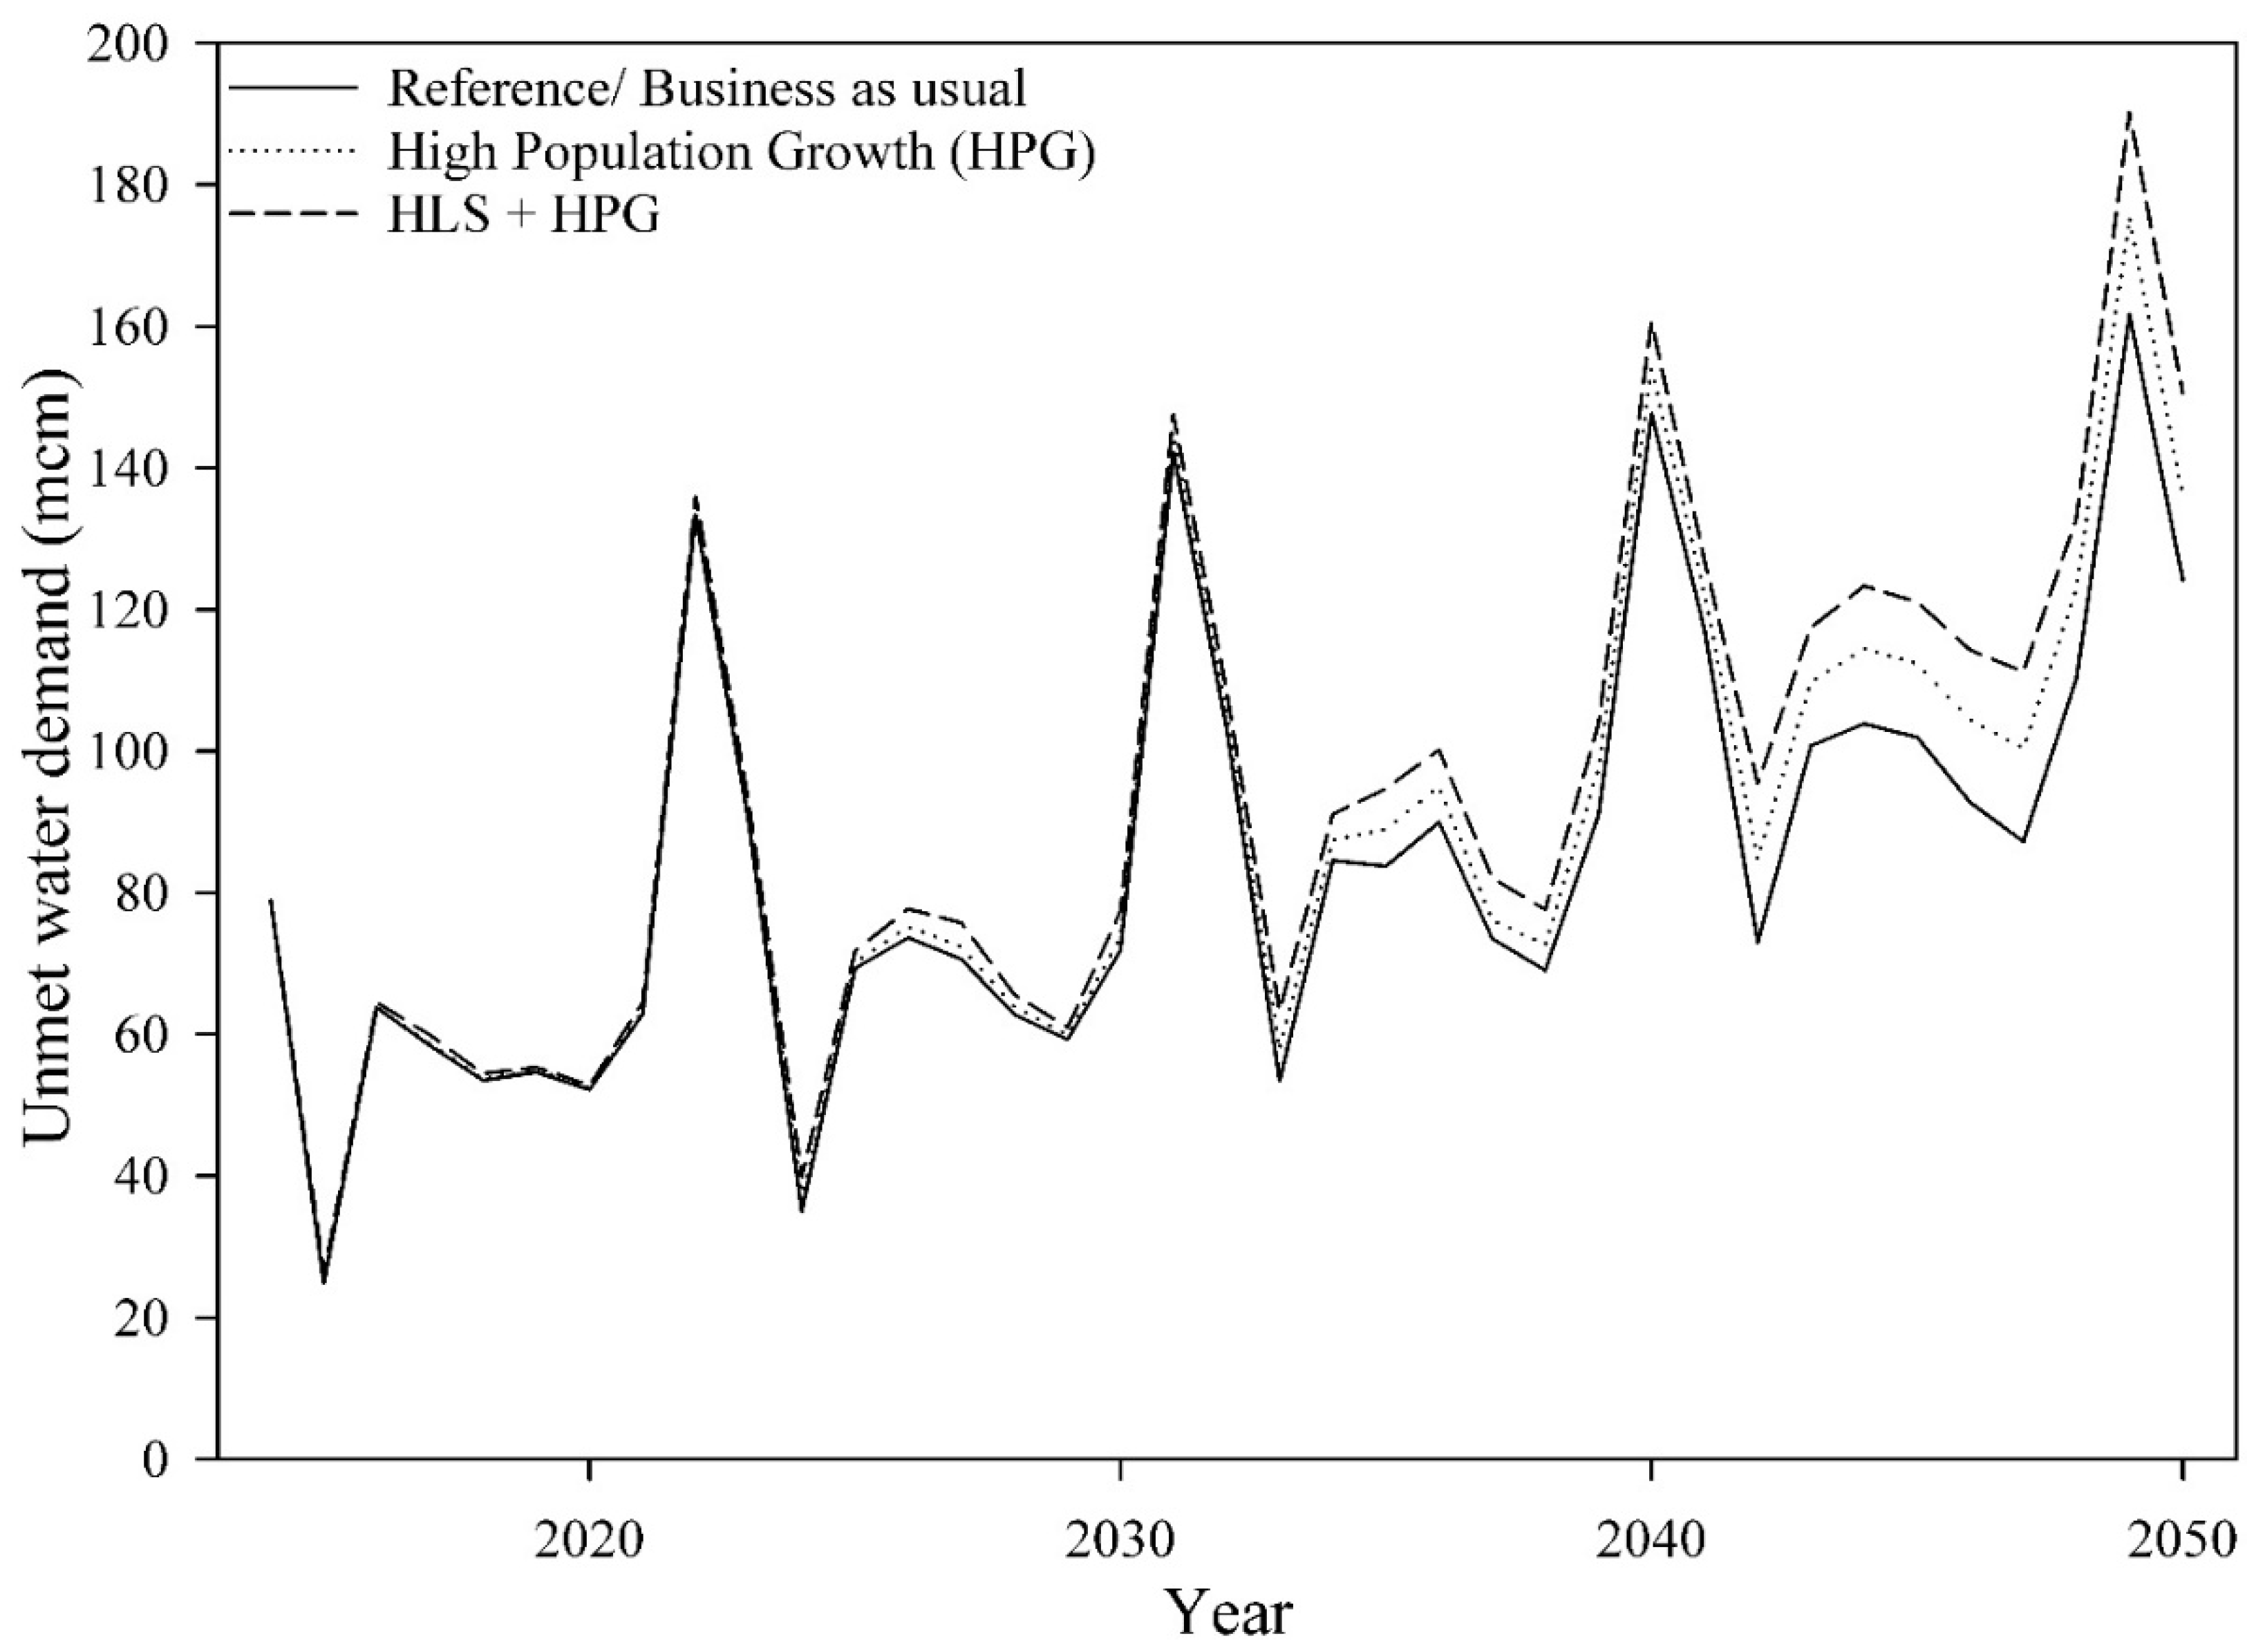
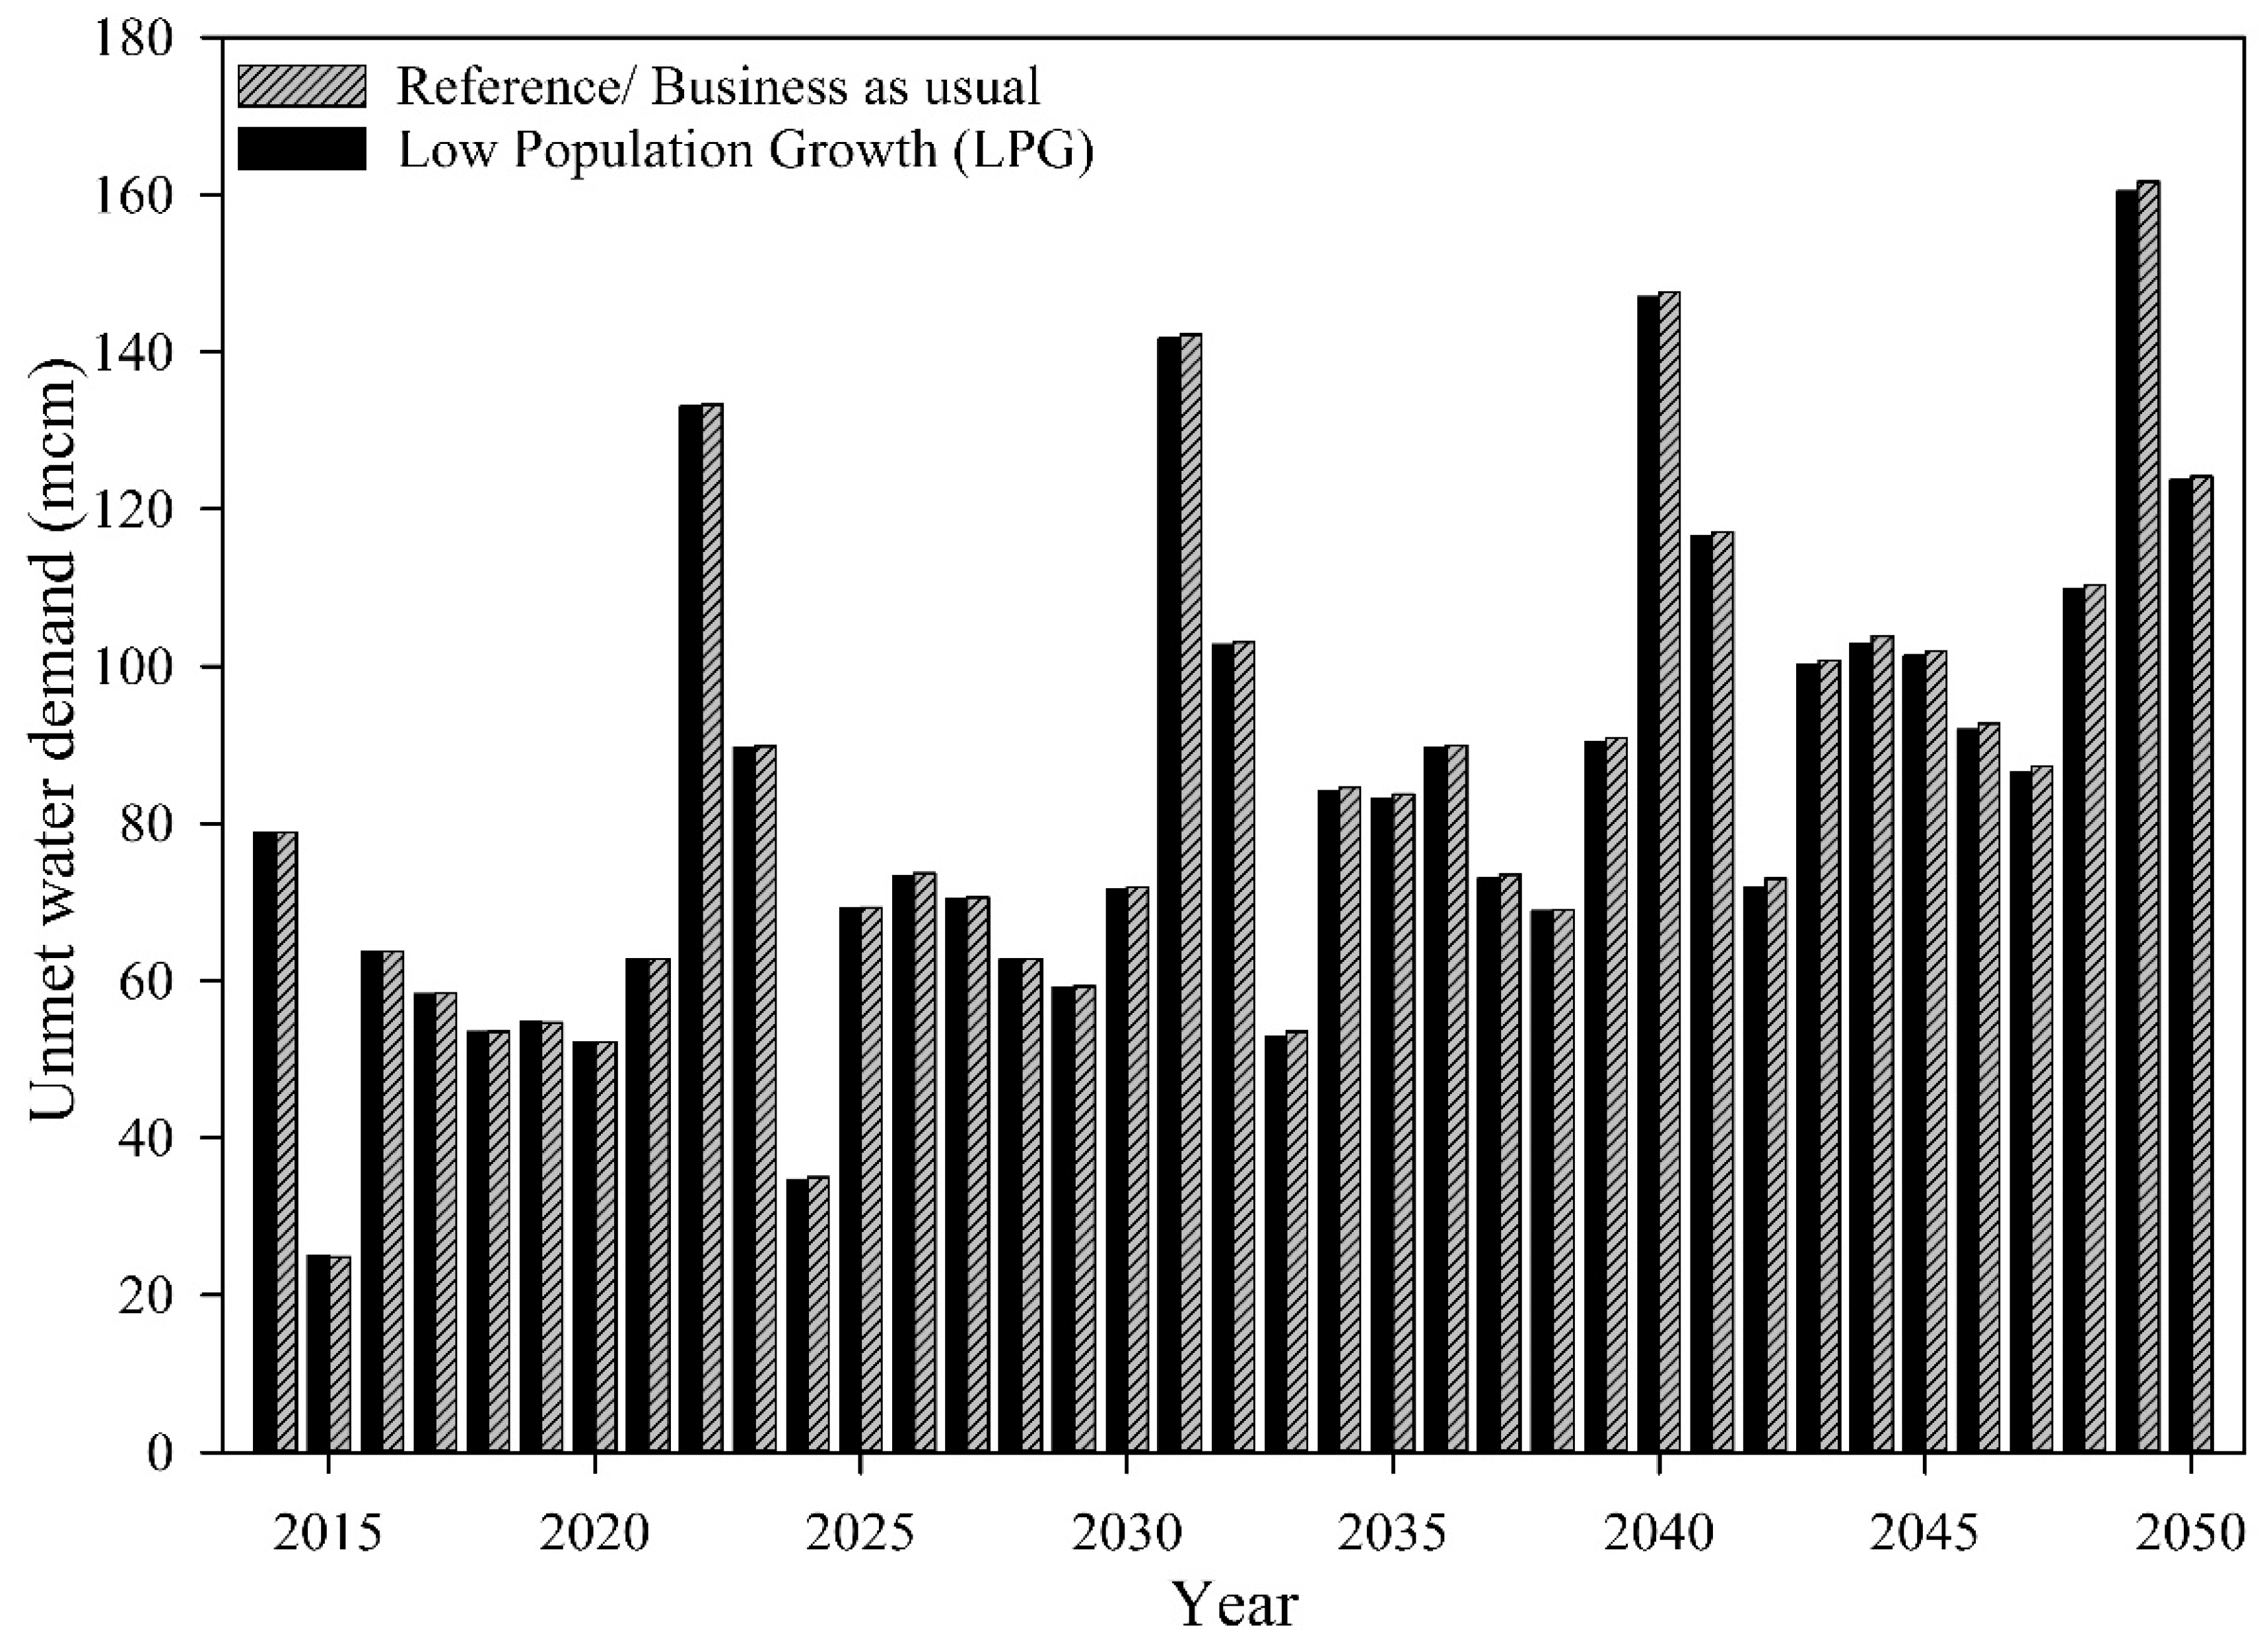
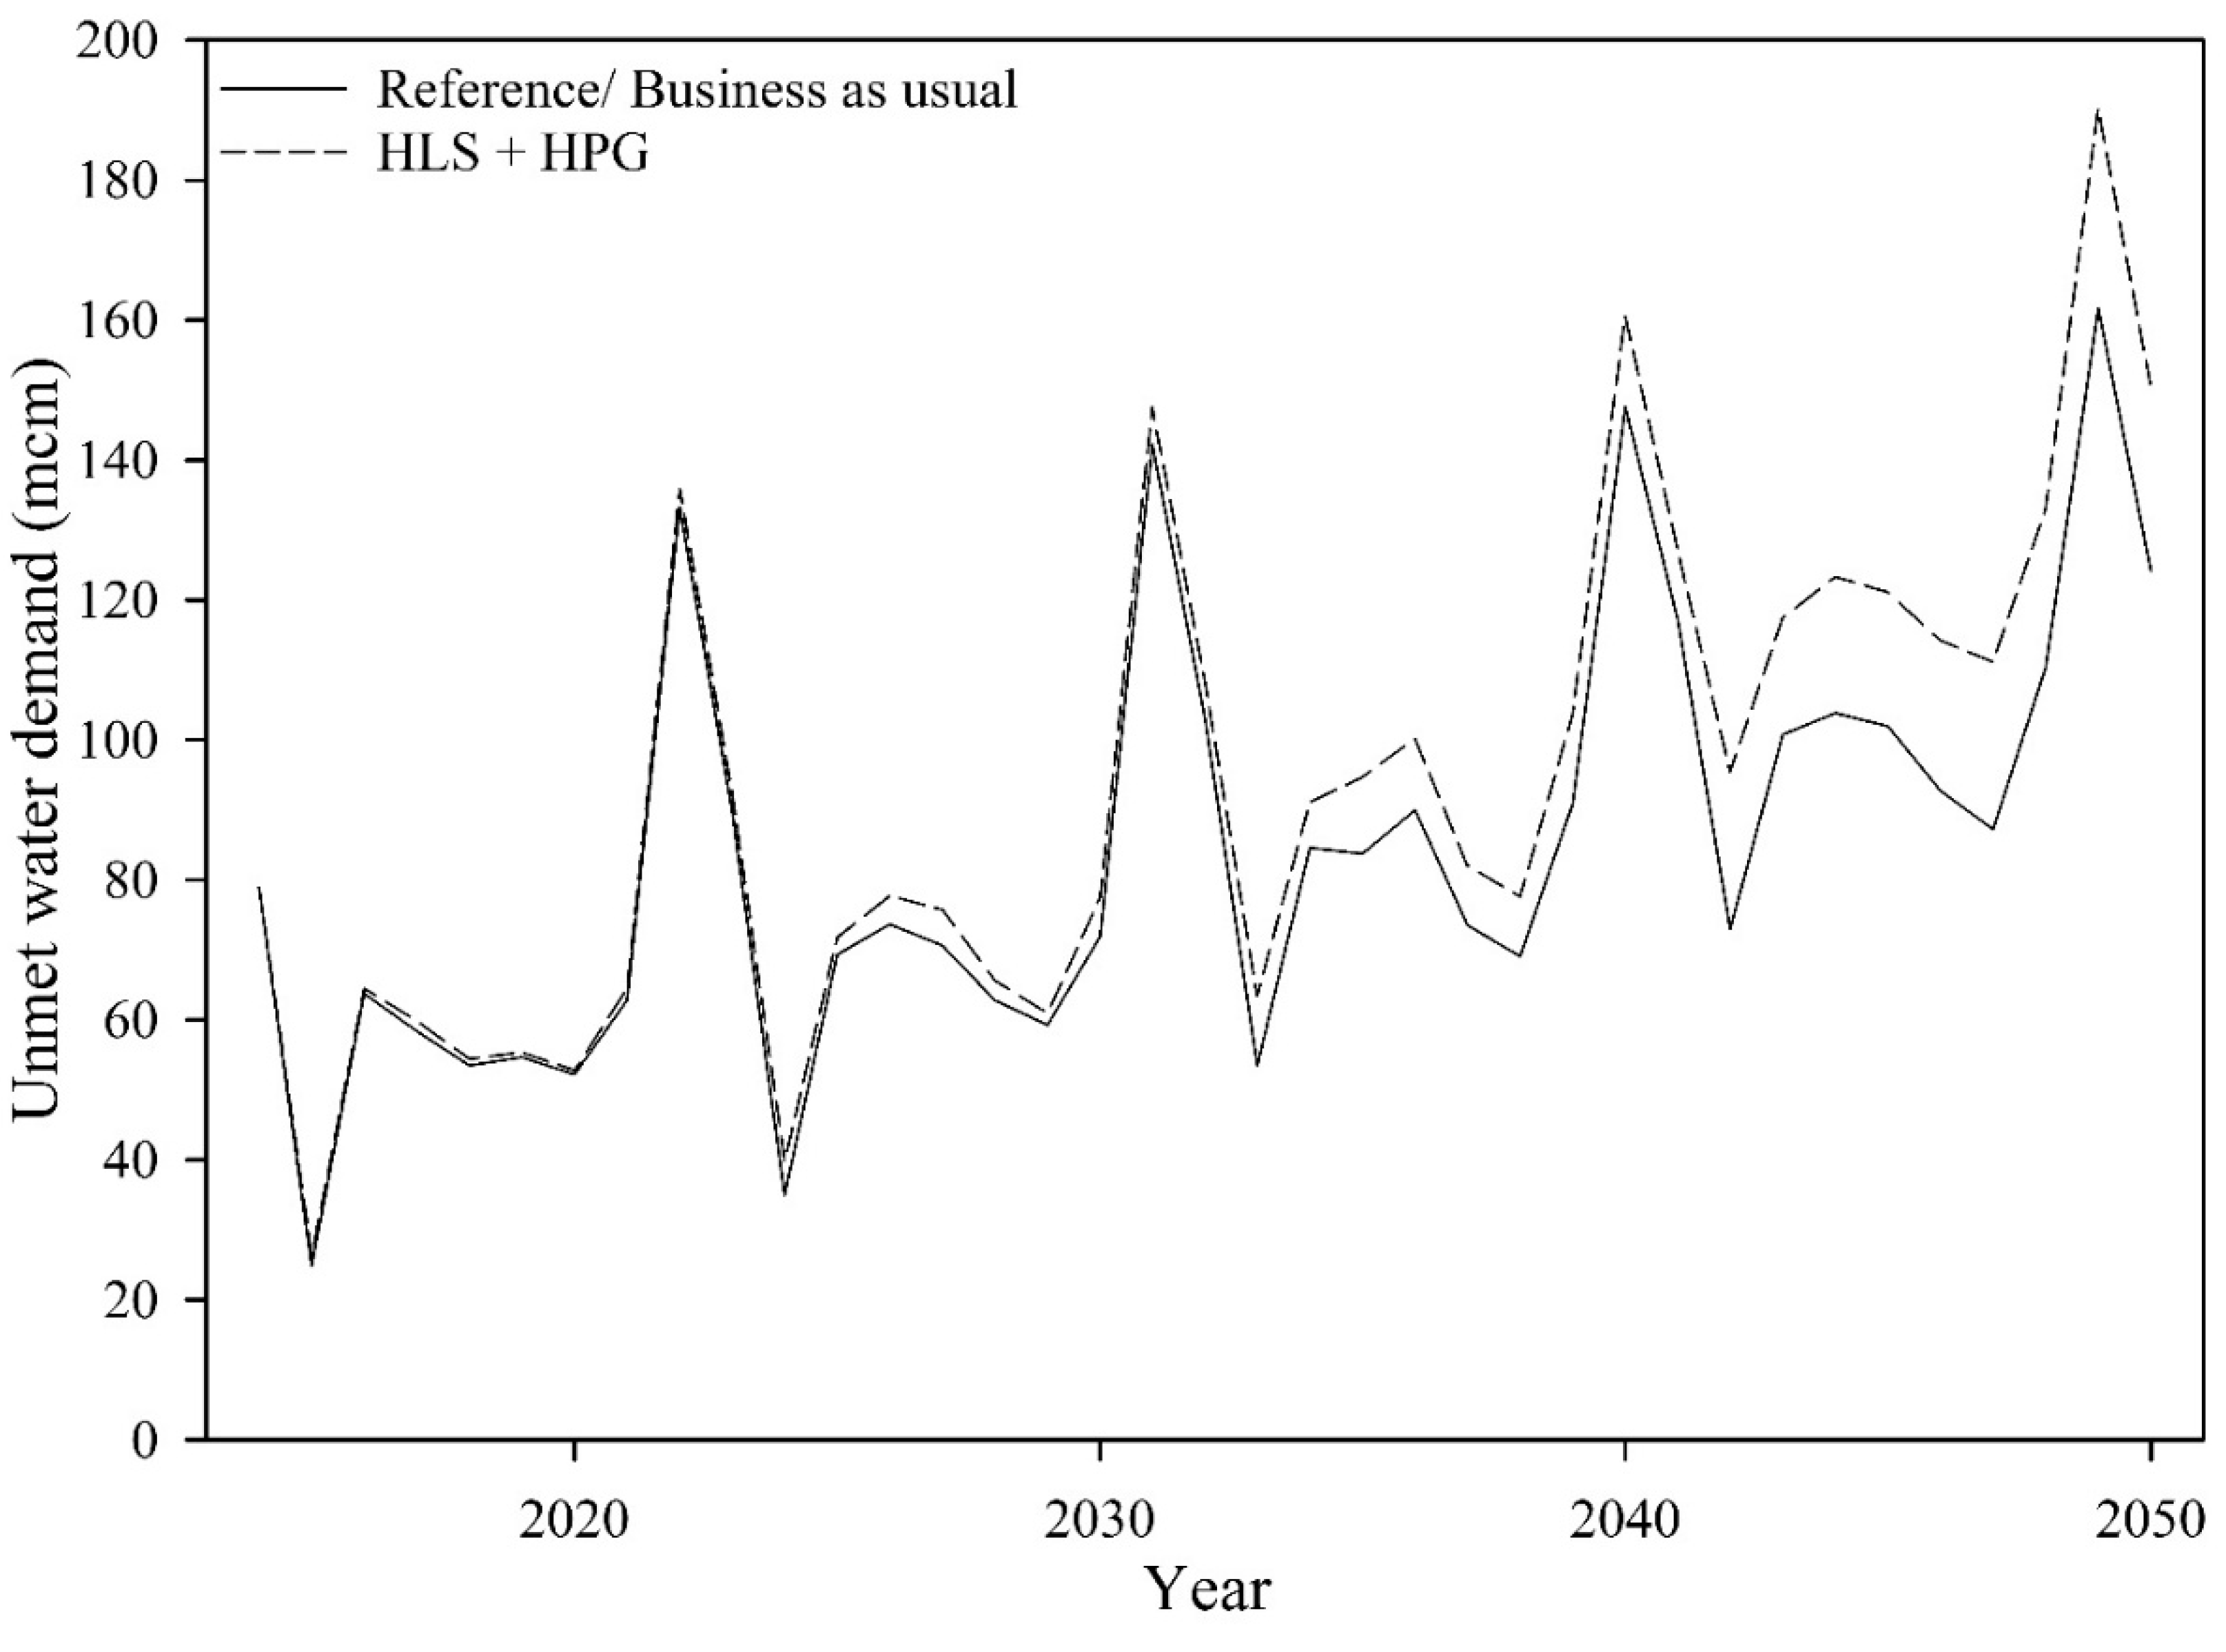
3.3. External-Driven Factor Scenarios Result

Figure 11 shows the comparison of unmet water demands under the impact of externally driven factors (population growth, urbanization, and living standards). The analysis showed that the high population growth and higher living standard scenarios have a critical impact on the water supply–demand situation. For the population growth scenario, it was assumed that if the population of the catchment continued to rise with a 6% growth rate (high population growth), it would lead to more urbanization, which could result in higher living standards and economic growth. The current domestic water demand from the Water and Sanitation Authority (WASA) was 82.9 m3 in the baseline years and was projected to increase to 120 m3 in the scenario of high living standards by the year 2050. For the low population growth (LPG) scenario, the water demands were analyzed for a population growth rate of 1.35% (this would be in the case of the government intervening and stepping up the awareness in order to control the national growth rate) (Figure 11). The study estimated future projections based on the external driving factors such as urbanization (which might lead to a high water consumption per capita), increased in population growth, high living standards, and low population growth (Figure 12).
The worst-case scenario was developed by assuming that there was no significant improvement in the water supply condition in the catchment but an increase in the higher living standards of the population and a higher population growth rate. This scenario was developed by the combination of the high population growth rate scenario and the high living standards scenario (Figure 13).
The results in Figure 12 show that only in the LPG scenario was the unmet water demand somewhat similar to the reference scenario, but in all other cases of external driving factor scenarios, the unmet water demand had an increasing trend. In the high population growth scenario, the unmet water demand reached 136 m3 by the year 2050, which would have severe effects on the water supply system if not improved or if new water management policies are not introduced. The HLS (higher living standard) scenario, introduced based on the assumption of increased urbanization and economic development in the UIB, lead to the unmet water demand of 163 m3 by 2050. For the worst case condition scenario, the water supply–demand was estimated for the combination of the higher living standards and high population growth scenarios. The water demand would reach more than 190 m3 for the year 2050, in this case (Figure 13).

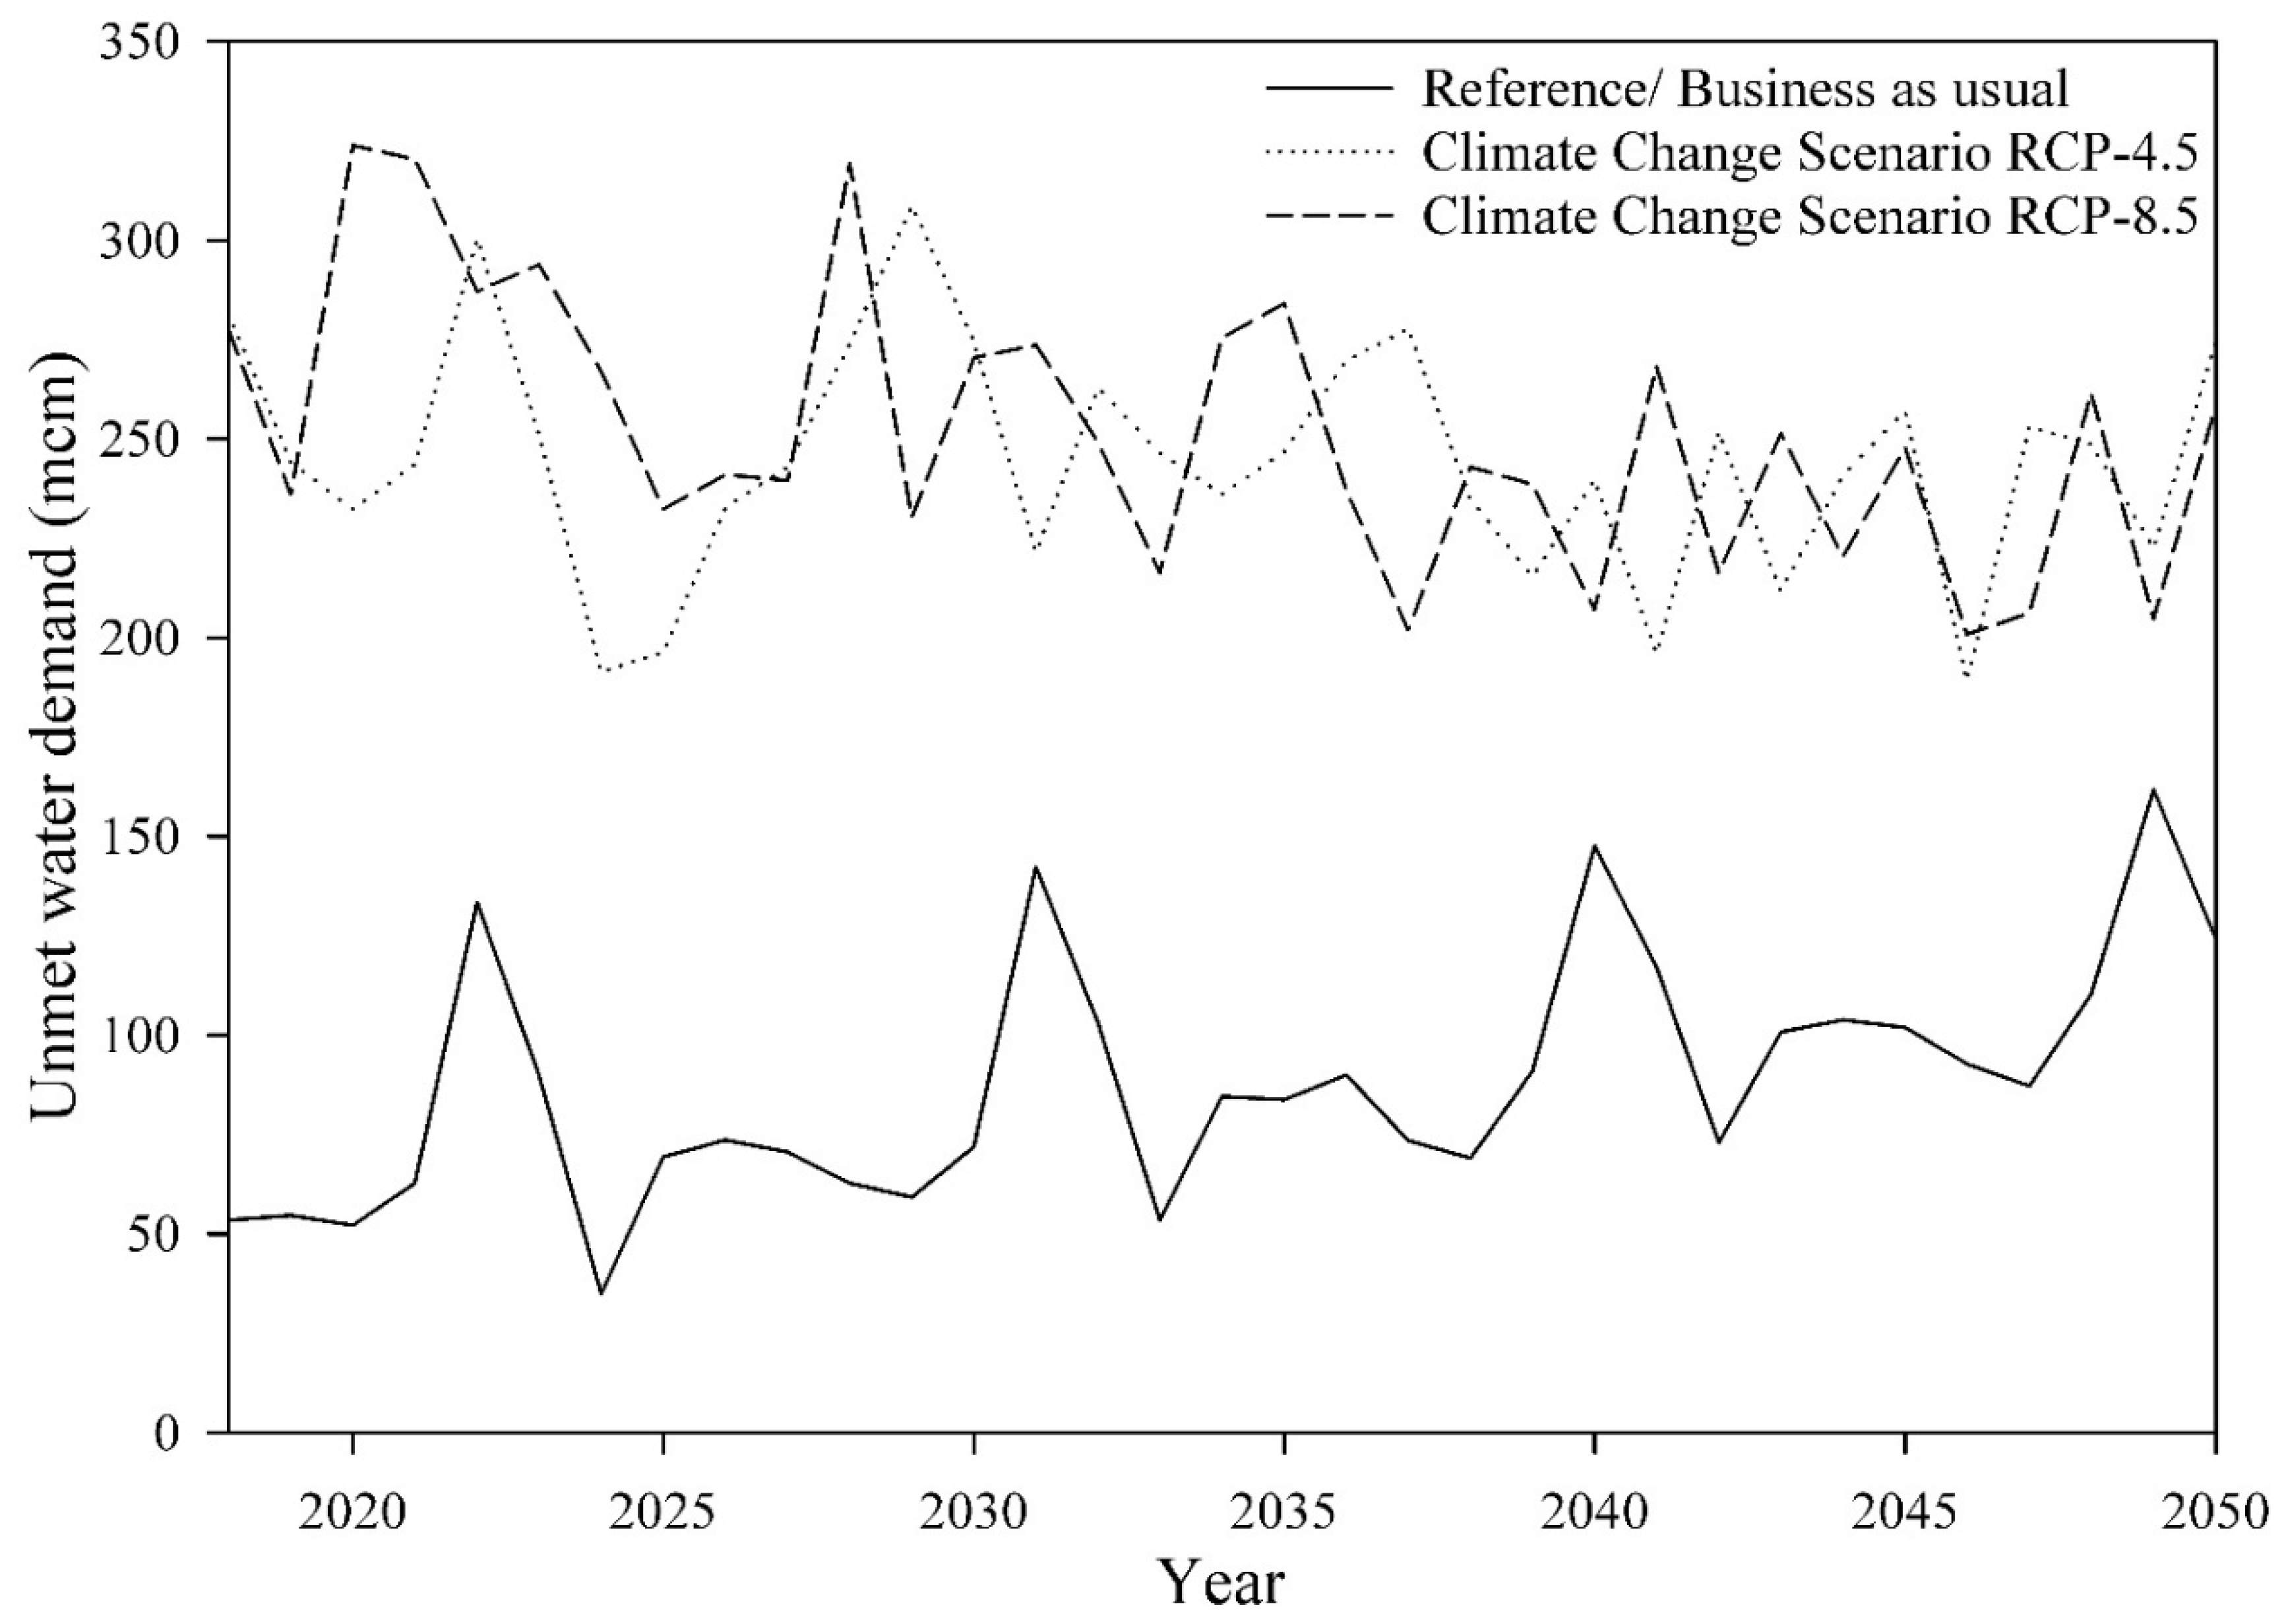
3.4. Climate Change Scenarios

The climate change scenario was constructed by using the climate data downloaded from the website of the Pakistan Meteorological Department [39]. The RCP-4.5 stabilization scenario and the RCP-8.5 for extreme conditions were used to simulate the future impact of the climate on the water supply and demand conditions (Figure 14).

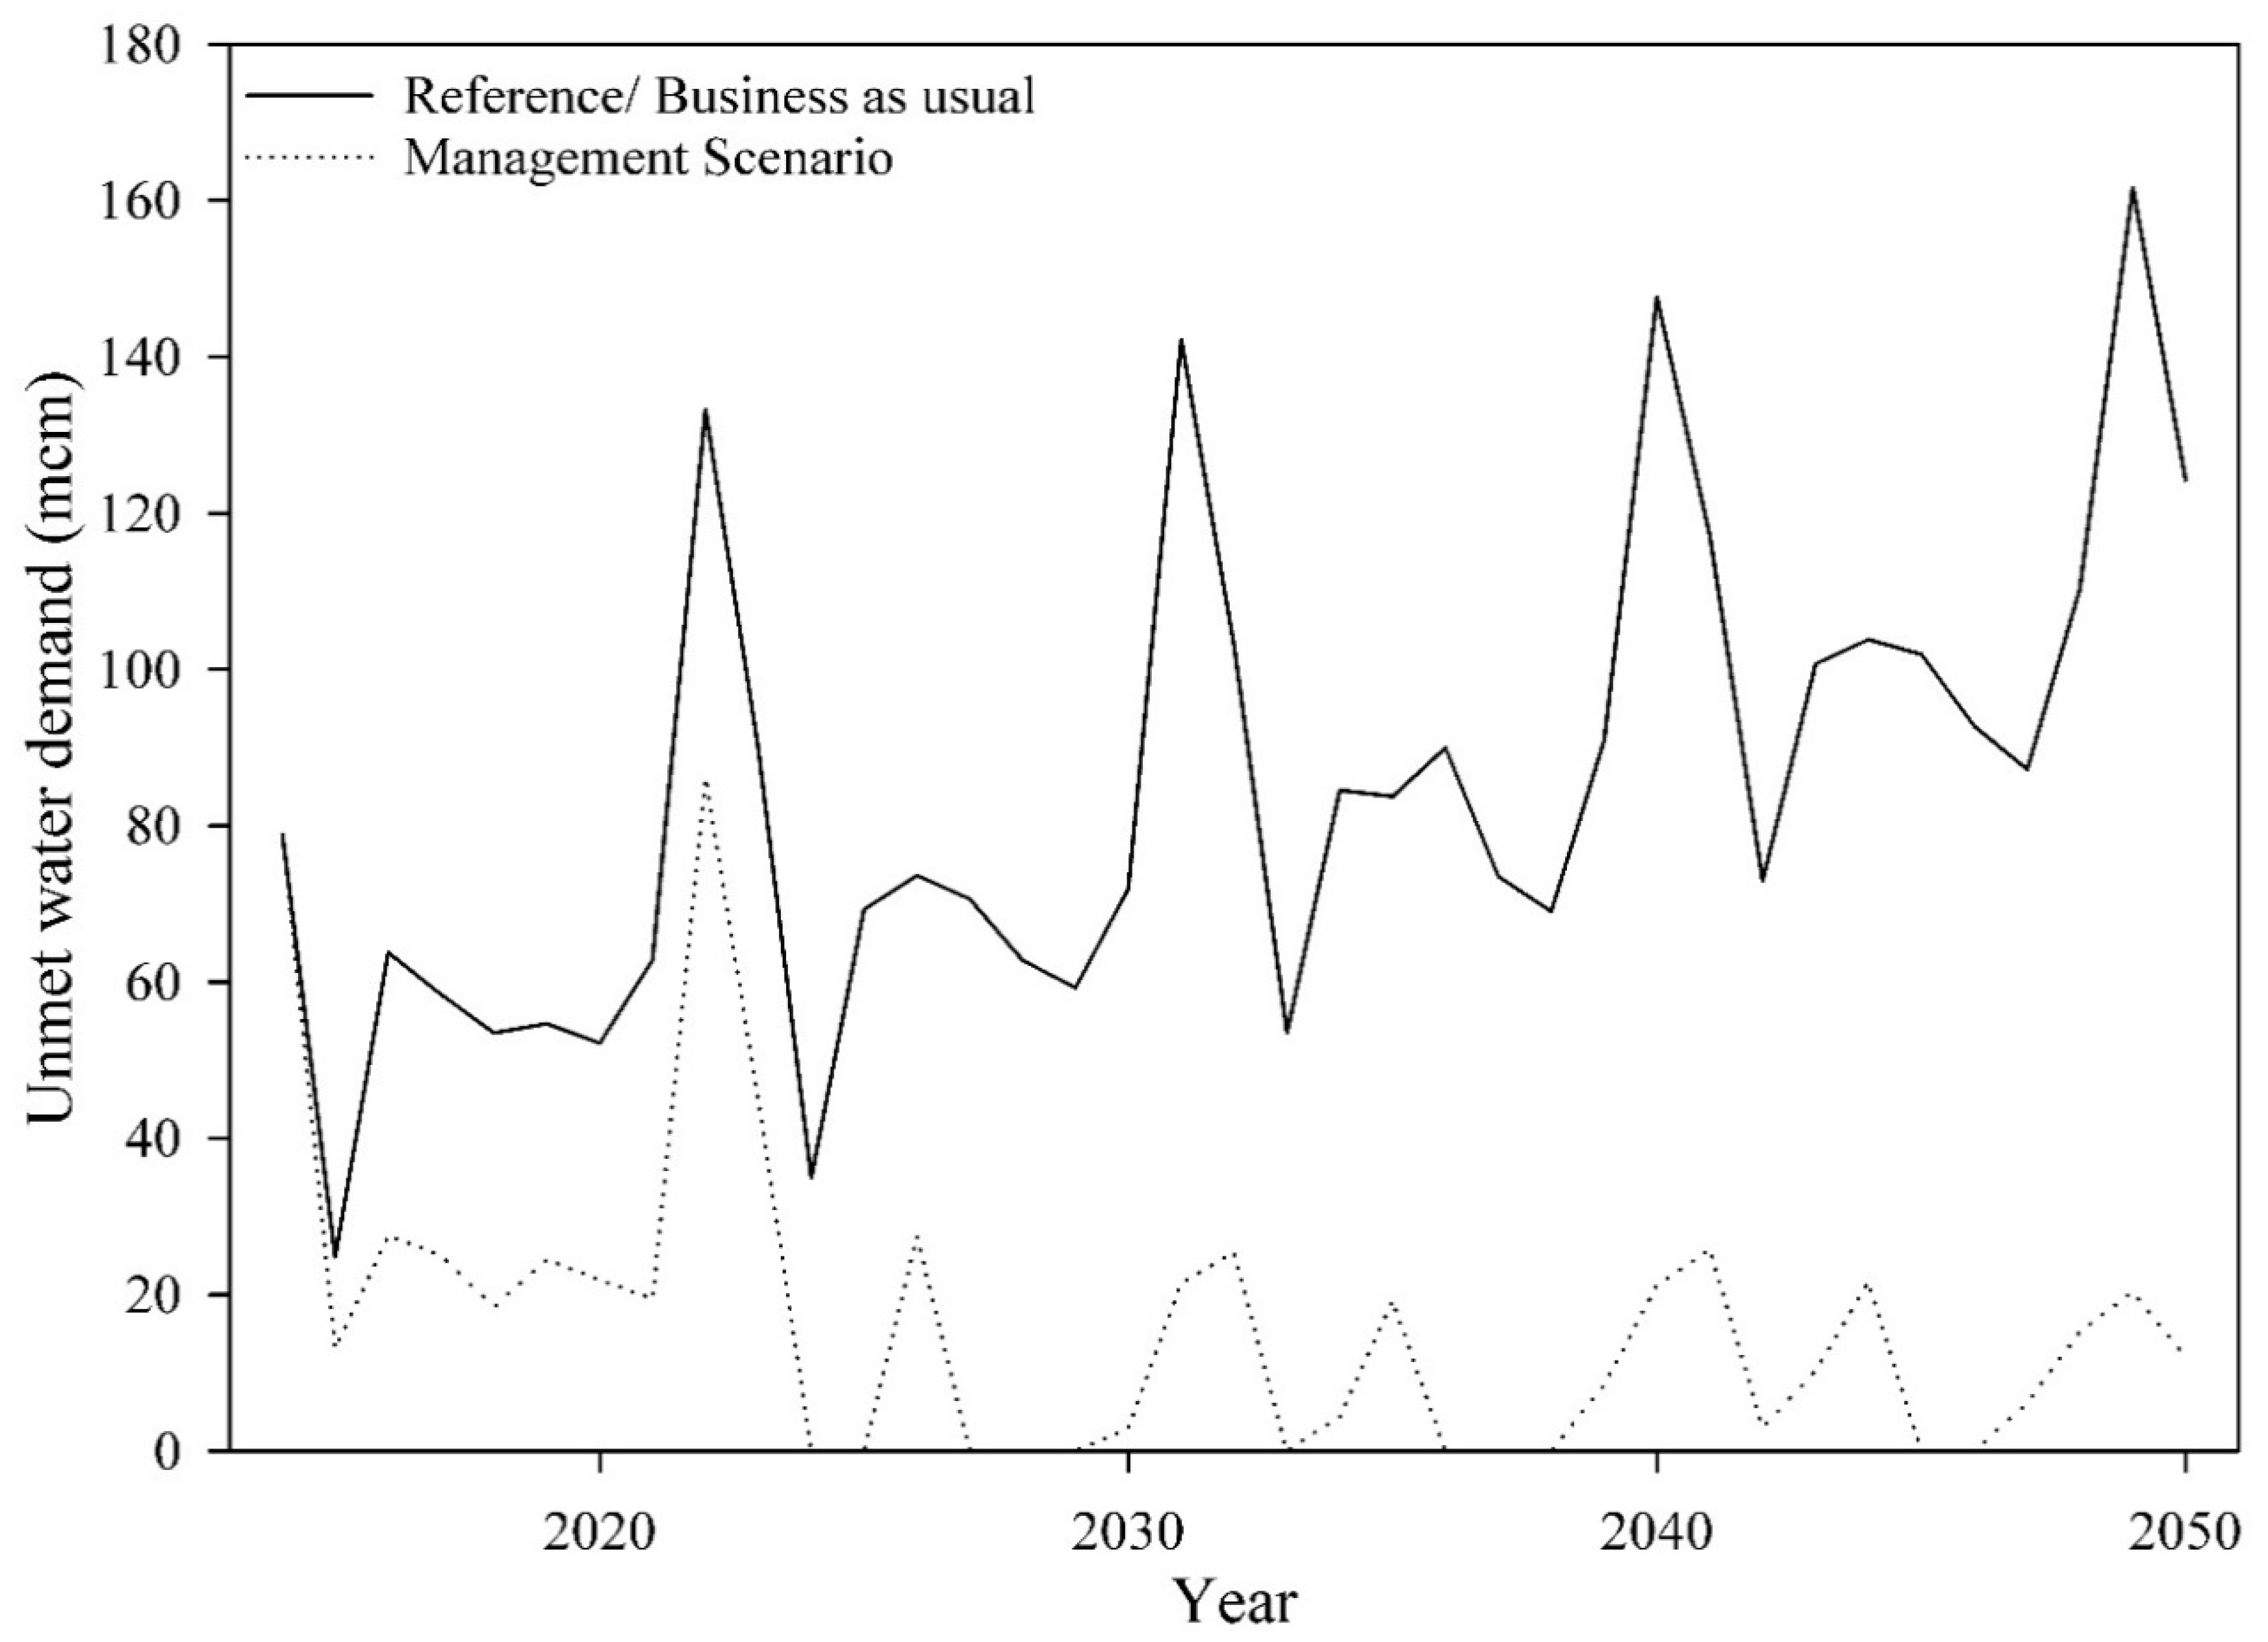
3.5. Management Scenario

Figure 15 shows the comparative analysis of the unmet water demands between the reference scenario and the management scenarios. The management scenarios introduced include the supply side management and the demand side management. The supply side management scenario was built with the assumption that the proposed dams (Bunji, Dasu, and Bhasha Diamir) were functioning by the year 2023. The demand side management included the adoption of proposed water saving techniques by the PCRWR (Pakistan Council of Research in Water Resources) which included a reduction in the water wastages at domestic and agricultural sites and a decrease in the per capita water requirement. These dams will not only store water for agricultural and domestic purposes but they will also help to control the energy crisis in the country. Figure 15 shows the amount of unmet water demand that can be reduced through the implementation of a water management plan via the reference scenario.

4. Discussion

We proposed a water management strategy in the UIB based on the different socio-economic, management, and climate change scenarios for the sustainable availability of future water resources in the UIB. To develop a sustainable water supply–demand system, the first step was to understand the current water supply–demand system in the study area and to evaluate the future impacts of externally driven factors and the impact of climate change on the water resources of the UIB. Then, based on the current supply–demand situation, the supply and demand side management scenarios were applied in the model in order to optimize the water management system to achieve better results (decrease the unmet water demands).
In this study, the reference scenario was built and the current unmet water demand in the Upper Indus Basin (UIB) was estimated to be 134 mcm. Similar findings were reported by Chitresh Saraswat [40] who asserted that the current water demand in the Kathmandu Valley was estimated to be 388.10 MLD (million liters per day). The authors of Reference [41] performed a similar water supply–demand analysis in the Didessa sub-basin West Ethiopia and reported that the current water demand in the sub-basin was 74 mcm. The results of their study suggested that water management strategies can help resolve the water scarcity problem in the basin. In another study conducted in the Mae Kong Basin in Thailand reported that the average unmet water demand for agriculture was 62 mcm per year and 17 mcm per year for the Tha Chin sub-basin [42]. Since the proposed dam sites (supply-side management) are crucial and necessary for achieving water security in the basin, the results of this study indicate that after the completion of the proposed dams and the implementation of the necessary demand side management strategies, there is a high probability of achieving an 80% fulfillment of the unmet water demand by 2025. In this study, the WEAP modeling suggested that water management options such as reducing the losses to domestic demand sites, the reduction in the per capita water requirement, and (mainly) the construction of the proposed dams would help in retaining the water supply services in the future.
The WEAP model also evaluated the externally driving factors (population growth, high living standards, and climate change) which puts immense pressure on the current water supply system and intensifies the water scarcity situation not only in the catchment but also downstream. The results of the study encourage water resources managers to adopt a management policy to resolve the water crisis or to render the unmet water demands in the Upper Indus Basin (UIB).
Based on the analysis of this study, it is necessary to identify an effective management strategy. For this purpose, a comparative analysis was designed to consider the possible options and to identify an effective policy for the maintenance of the water security in the catchment (Figure 16).
In the pessimistic future or reference scenario, we assume that the dams which are under construction could not be completed by 2050 due to some unforeseen reasons (the lack of funds or political issues, for example). Thus, the unmet water demands will rise to an average of 84 mcm and losses could reach up to 40%. In the moderate future-1 scenario, we assume that the various domestic water saving techniques mention by the PCRWR were applied, which could decrease the per capita water demand from 82.9 m3 to 70 m3 along with a decrease in the losses by up to 20%. In the moderate future-2 scenario which is based on the baseline conditions, we assume that the climatic condition, the river flow, and the catchment has a steady population growth. For the optimistic future, the PCRWR’s reported that water saving techniques could be applied which will help in the reduction of losses and the proposed or under construction dams will be fully functional by 2023. In the optimistic future or management scenario, the average unmet water demands could be reduced to just 25 mcm (Figure 17).
The reference scenario exerts a negative impact on the UIB supply system, the water demands rise, and it is predicted that it will be more than double by the year 2050 (Figure 18). This rapid increase in the demand is not only due to anthropogenic activities (urbanization, growth rate, and so on) but also due to changes in the amount of rainfall and its seasonal distribution [43]. Glaciers in the northern region of Pakistan are a major source of fresh water for 200 million people living downstream in the lower Indus Basin for domestic and agricultural purposes and have a high dependency on its GDP on agriculture exports. Archer suggested that any change in the trend of rainfall or snow in winter due to human-induced or non-human-induced climate variability will be reflected on the runoff in the summer season [44]. The presented analysis of management strategies for the future prediction should be considered for planning, developing, and designing a sustainable water supply system (Figure 18).
Pakistan is at high risk regarding the water availability situation due to its dependency on a single river system in the face of looming climate change impacts. However, Pakistan has yet to develop and implement its water policy. Apart from climate change impacts, Pakistan is facing rapid population growth. With Pakistan’s steadily increasing water demand for food security and the loss of storage in the existing water resource development structure due to sedimentation and inter-provincial conflicts on the developing water storage reservoirs, the Government response on these issues is fragmentary [45]. To deal with these issues, the integrated water management of reservoirs, the construction of new water infrastructure, and a water management strategy for the agricultural sector is required. The Water and Power Development Authority (WAPDA) and the Provincial Irrigation and Drainage Authorities (PIDA) have sub-divisional control of the reservoirs, but they have a shortage of resources and technical support to make the best use of the surface water that is available. The productivity per unit of water is 40% lower than in neighboring parts of India and 50% lower than the United States [46].
The Tarbela and Mangla dams are the only two significant reservoirs on the Indus River and they both under degradation due to high sediment loads. So, as this study suggests, with the rapid population increase coupled with an increased water requirement and the impact of climate change, the construction of new major reservoirs like the Bhasha dam, Dasu dam, Bunji dam, and Kalabagh dam (downstream) is the need of the hour. Increasing water productivity could buy some time against the increasing water demand and the reducing water supply until the new reservoirs are functional.
Acknowledgment of the study limitations and Future Research: In this study, the socio-economic data availability and the high-altitude climatic stations’ data scarcity were the significant constraints. This issue has been highlighted by many other studies in the literature [47]. Since we did not include the western (Kabul Basin) and lower part of the Indus Basin, we would like to recommend that future studies should include the Kabul Basin for water allocation for the managerial point of view.
The WEAP model is a flexible tool for hydrological modeling, however, it does have some limitations. For example, it assumes an infinite supply of groundwater which is not the case in reality. Another limitation of the WEAP model is that there is a limited number of catchment hydrologic models (that is, the simplified coefficient method, the soil moisture method, the MABIA method, and the plant growth model method) and this can be a serious constraint if some of the parameters use different catchment models. So, the parameters should be translated from one model to another model. These limitations did not put any constraints on the current study when running the WEAP model for the UIB. However, in the literature, there were some studies that reported that these limitations make a noticeable difference. Arrans and McCartney (2007) suggested that this limitation can be overcome in two ways. Firstly, by developing part of the model externally, and secondly, by building the model separate from the WEAP in order to calculate the WEAP output for downstream [48].

Author Contributions

Ali Amin and Javed Iqbal conceived and designed the study; Ali Amin run the WEAP model and collected and analyzed all the data. Ali Amin, Javed Iqbal, Areesha Asghar wrote the paper. Javed Iqbal extensively reviewed the article. Lars Ribbe provided extensive help in providing training on WEAP modeling.

Funding

This research received no external funding.

Acknowledgments

The authors acknowledge the financial support of National University of Sciences and Technology (NUST), Islamabad for collecting data and Technology Arts Sciences TH Köln, Köln, Germany provided technical support to run the WEAP model. The authors also acknowledge Junaid Aziz for his support for data processing, WAPDA, IRSA and Ghulam Fareed from PMD for providing streamflow and meteorological data.

Conflicts of Interest

The authors declare no conflict of interest.

References

  1. UNEP. Status Report on the Application of Integrated Approaches to Water Resources Management; United Nations Environment Programme: Nairobi, Kenya, 2012. [Google Scholar]
  2. Gardner-Outlaw, T.; Engelman, R. Sustaining Water Easing Scarcity: A Second Update; Population Action International, Population and Environment Program: Washington, DC, USA, 1997. [Google Scholar]
  3. Liu, J.; Wang, Y.; Yu, Z.; Cao, X.; Tian, L.; Sun, S.; Wu, P. A comprehensive analysis of blue water scarcity from the production, consumption, and water transfer perspectives. Ecol. Indic. 2017, 72, 870–880. [Google Scholar] [CrossRef]
  4. Flato, G.; Marotzke, J.; Abiodun, B.; Braconnot, P.; Chou, S.C.; Collins, W.J.; Cox, P.; Driouech, F.; Emori, S.; Eyring, V. Evaluation of climate models. In Climate change 2013: The physical science basis. Contribution of working group I to the fifth assessment report of the intergovernmental panel on climate change. Clim. Chang. 2013, 5, 741–866. [Google Scholar] [CrossRef]
  5. Bao, C.; He, D. The causal relationship between urbanization, economic growth and water use change in provincial China. Sustainability 2015, 7, 16076–16085. [Google Scholar] [CrossRef]
  6. Saraswat, C.; Kumar, P.; Mishra, B.K. Assessment of stormwater runoff management practices and governance under climate change and urbanization: An analysis of Bangkok, Hanoi and Tokyo. Environ. Sci. Policy 2016, 64, 101–117. [Google Scholar] [CrossRef]
  7. Al Radif, A. Integrated water resources management (IWRM): An approach to face the challenges of the next century and to avert future crises. Desalination 1999, 124, 145–153. [Google Scholar] [CrossRef]
  8. Hong, X.; Guo, S.; Wang, L.; Yang, G.; Liu, D.; Guo, H.; Wang, J. Evaluating water supply risk in the middle and lower reaches of Hanjiang river basin based on an integrated optimal water resources allocation model. Water 2016, 8, 364. [Google Scholar] [CrossRef]
  9. Oreskes, N. The scientific consensus on climate change. Science 2004, 306, 1686. [Google Scholar] [CrossRef] [PubMed]
  10. Solomon, S. Climate Change 2007—The Physical Science Basis: Working Group I Contribution to the Fourth Assessment Report of the IPCC; Cambridge University Press: Cambridge, UK, 2007; Volume 4. [Google Scholar]
  11. Hoekstra, A.Y.; Mekonnen, M.M.; Chapagain, A.K.; Mathews, R.E.; Richter, B.D. Global monthly water scarcity: Blue water footprints versus blue water availability. PLoS ONE 2012, 7, e32688. [Google Scholar] [CrossRef] [PubMed]
  12. Babel, M.; Gupta, A.D.; Nayak, D. A model for optimal allocation of water to competing demands. Water Resour. Manag. 2005, 19, 693–712. [Google Scholar] [CrossRef]
  13. Young, G.J.; Hewitt, K. Hydrology research in the upper Indus basin, Karakoram Himalaya, Pakistan. Hydrol. Mt. Areas IAHS Publ. 1990, 190, 139–152. [Google Scholar]
  14. Karim, A.; Veizer, J. Water balance of the Indus river basin and moisture source in the karakoram and western himalayas: Implications from hydrogen and oxygen isotopes in river water. J. Geophys. Res. Atmos. 2002, 107. [Google Scholar] [CrossRef]
  15. Jain, S.K.; Agarwal, P.K.; Singh, V.P. Indus Basin; Springer: Dordrecht, The Netherlands, 2007. [Google Scholar]
  16. Hussain, I.; Hussain, Z.; Sial, M.H.; Akram, W.; Farhan, M. Water balance, supply and demand and irrigation efficiency of Indus basin. Pak. Econ. Soc. Rev. 2011, 49, 13–38. [Google Scholar]
  17. Watkins, K. Human Development Report 2006-beyond Scarcity: Power, Poverty and the Global Water Crisis. Available online: https://ssrn.com/abstract=2294691 (accessed on 26 March 2018).
  18. Perera, B.; James, B.; Kularathna, M. Computer software tool realm for sustainable water allocation and management. J. Environ. Manag. 2005, 77, 291–300. [Google Scholar] [CrossRef] [PubMed]
  19. Cai, X.; Kam, S.P.; Yen, B.T.; Sood, A.; Chu Thai, H. Cawat—A Catchment Water Allocation Tool for Integrated Irrigation and Aquaculture Development in Small Watersheds. 2014. Available online: https://academicworks.cuny.edu/cc_conf_hic/381/ (accessed on 26 March 2018).
  20. Harma, K.J.; Johnson, M.S.; Cohen, S.J. Future water supply and demand in the Okanagan basin, British columbia: A scenario-based analysis of multiple, interacting stressors. Water Resour. Manag. 2012, 26, 667–689. [Google Scholar] [CrossRef]
  21. Raskin, P.; Hansen, E.; Zhu, Z.; Stavisky, D. Simulation of water supply and demand in the aral sea region. Water Int. 1992, 17, 55–67. [Google Scholar] [CrossRef]
  22. Yates, D.; Sieber, J.; Purkey, D.; Huber-Lee, A. Weap21—A demand-, priority-, and preference-driven water planning model: Part 1: Model characteristics. Water Int. 2005, 30, 487–500. [Google Scholar] [CrossRef]
  23. Tahir, A.A.; Chevallier, P.; Arnaud, Y.; Neppel, L.; Ahmad, B. Modeling snowmelt-runoff under climate scenarios in the hunza river basin, karakoram range, northern Pakistan. J. Hydrol. 2011, 409, 104–117. [Google Scholar] [CrossRef]
  24. Awan, U.K.; Liaqat, U.W.; Choi, M.; Ismaeel, A. A swat modeling approach to assess the impact of climate change on consumptive water use in lower chenab canal area of Indus basin. Hydrol. Res. 2016, 47, 1025–1037. [Google Scholar] [CrossRef]
  25. O’Mara, G.T.; Duloy, J.H. Modeling efficient water allocation in a conjunctive use regime: The Indus basin of Pakistan. Water Resour. Res. 1984, 20, 1489–1498. [Google Scholar] [CrossRef]
  26. Sharma, B.R.; Cai, X.; Condappa, D.D. Impact of Climate Change on Water Resources and Agricultural Production in the Indus Basin, South Asia; International Water Resources Association (IWRA): Urbana, IL, USA, 2011. [Google Scholar]
  27. Kiniouar, H.; Hani, A.; Kapelan, Z. Water demand assessment of the upper semi-arid sub-catchment of a mediterranean basin. Energy Procedia 2017, 119, 870–882. [Google Scholar] [CrossRef]
  28. Ahmadaali, J.; Barani, G.-A.; Qaderi, K.; Hessari, B. Analysis of the effects of water management strategies and climate change on the environmental and agricultural sustainability of Urmia lake basin, Iran. Water 2018, 10, 160. [Google Scholar] [CrossRef]
  29. Yates, D.; Purkey, D.; Sieber, J.; Huber-Lee, A.; Galbraith, H. Weap21—A demand-, priority-, and preference-driven water planning model: Part 2: Aiding freshwater ecosystem service evaluation. Water Int. 2005, 30, 501–512. [Google Scholar] [CrossRef]
  30. Toure, A.; Diekkrüger, B.; Mariko, A.; Cissé, A.S. Assessment of groundwater resources in the context of climate change and population growth: Case of the klela basin in southern mali. Climate 2017, 5, 45. [Google Scholar] [CrossRef]
  31. Esteve, P.; Varela-Ortega, C.; Blanco-Gutiérrez, I.; Downing, T.E. A hydro-economic model for the assessment of climate change impacts and adaptation in irrigated agriculture. Ecol. Econ. 2015, 120, 49–58. [Google Scholar] [CrossRef]
  32. Sieber, J.; Purkey, D. Weap: Water Evaluation and Planning System; User Guide; Stockholm Environment Institute, US Center: Somerville, MA, USA, 2011; Available online: http://weap21.org/downloads/WEAP_User_Guide.pdf (accessed on 26 March 2018).
  33. Spalding-Fecher, R.; Joyce, B.; Winkler, H. Climate change and hydropower in the Southern African power pool and Zambezi river basin: System-wide impacts and policy implications. Energy Policy 2017, 103, 84–97. [Google Scholar] [CrossRef]
  34. Clarke, L.; Edmonds, J.; Jacoby, H.; Pitcher, H.; Reilly, J.; Richels, R. Scenarios of Greenhouse Gas Emissions and Atmospheric Concentrations; US Department of Energy Publications; US Department of Energy: Washington, DC, USA, 2007; Volume 6.
  35. Riahi, K.; Grübler, A.; Nakicenovic, N. Scenarios of long-term socio-economic and environmental development under climate stabilization. Technol. Forecast. Soc. Chang. 2007, 74, 887–935. [Google Scholar] [CrossRef]
  36. Blanco-Gutiérrez, I.; Varela-Ortega, C.; Flichman, G. Cost-effectiveness of groundwater conservation measures: A multi-level analysis with policy implications. Agric. Water Manag. 2011, 98, 639–652. [Google Scholar] [CrossRef] [Green Version]
  37. McCuen, R.H.; Knight, Z.; Cutter, A.G. Evaluation of the nash–sutcliffe efficiency index. J. Hydrol. Eng. 2006, 11, 597–602. [Google Scholar] [CrossRef]
  38. Ritter, A.; Muñoz-Carpena, R. Performance evaluation of hydrological models: Statistical significance for reducing subjectivity in goodness-of-fit assessments. J. Hydrol. 2013, 480, 33–45. [Google Scholar] [CrossRef]
  39. Pakistan Meteorological Department. Pakistan Meteorological Department, govt. of Pakistan. Available online: http://www.pmd.gov.pk/ (accessed on 6 April 2018).
  40. Saraswat, C.; Mishra, B.K.; Kumar, P. Integrated urban water management scenario modeling for sustainable water governance in Kathmandu valley, Nepal. Sustain. Sci. 2017, 12, 1037–1053. [Google Scholar] [CrossRef]
  41. Adgolign, T.B.; Rao, G.S.; Abbulu, Y. Weap modeling of surface water resources allocation in Didessa sub-basin, west Ethiopia. Sustain. Water Resour. Manag. 2016, 2, 55–70. [Google Scholar] [CrossRef]
  42. Khalil, A.; Rittima, A.; Phankamolsil, Y. The projected changes in water status of the Mae Klong basin, Thailand, using Weap model. Paddy Water Environ. 2018, 1–17. [Google Scholar] [CrossRef]
  43. Archer, D.R.; Fowler, H.J. Spatial and temporal variations in precipitation in the upper Indus basin, global teleconnections and hydrological implications. Hydrol. Earth Syst. Sci. Discuss. 2004, 8, 47–61. [Google Scholar] [CrossRef]
  44. Archer, D. Contrasting hydrological regimes in the Upper Indus basin. J. Hydrol. 2003, 274, 198–210. [Google Scholar] [CrossRef]
  45. Archer, D.R.; Forsythe, N.; Fowler, H.J.; Shah, S.M. Sustainability of water resources management in the Indus basin under changing climatic and socio economic conditions. Hydrol. Earth Syst. Sci. 2010, 14, 1669–1680. [Google Scholar] [CrossRef] [Green Version]
  46. Briscoe, J.; Qamar, U.; Contijoch, M.; Amir, P.; Blackmore, D. Pakistan’s Water Economy: Running Dry; Oxford University Press: Karachi, Pakistan, 2005; p. 140. [Google Scholar]
  47. Bocchiola, D.; Diolaiuti, G.; Soncini, A.; Mihalcea, C.; D’agata, C.; Mayer, C.; Lambrecht, A.; Rosso, R.; Smiraglia, C. Prediction of future hydrological regimes in poorly gauged high altitude basins: The case study of the upper Indus, Pakistan. Hydrol. Earth Syst. Sci. 2011, 15, 2059–2075. [Google Scholar] [CrossRef] [Green Version]
  48. Arranz, R.; McCartney, M.P. Application of the Water Evaluation and Planning (WEAP) Model to Assess Future Water Demands and Resources in the Olifants Catchment, South Africa; IWMI: Colombo, Sri Lanka, 2007; Volume 116.
Figure 1. The study area map showing the locations of the stream flow gauges and the proposed dam.
Water 10 00537 g001
Figure 2. The land cover/use map of the Upper Indus Basin derived from the MODIS land cover data.
Water 10 00537 g002
Figure 3. The study workflow and data inputs in the WEAP model.
Water 10 00537 g003
Figure 4. The conceptual diagram and equations used in the soil moisture method.
Water 10 00537 g004
Figure 5. The structure of the water supply service in the catchment.
Water 10 00537 g005
Figure 6. A schematic diagram showing the configuration of the WEAP model for the demand sites in the Upper Indus Basin (UIB).
Water 10 00537 g006
Figure 7. Shows the externally driven factors and climate change scenarios used in the WEAP model.
Water 10 00537 g007
Figure 8. An image showing the workflow of the externally driving scenarios, the impact of climate change, and the management scenarios used in the study.
Water 10 00537 g008
Figure 9. The calibration and validation of the five sub-catchments and the entire Upper Indus Basin (UIB).
Water 10 00537 g009
Figure 10. The unmet water demand for the reference/business as usual (2014–2050) scenario in the Upper Indus Basin (UIB).
Water 10 00537 g010
Figure 11. The future projections of the unmet water demands in the Upper Indus Basin (UIB) under the reference, high population growth, and high population growth + higher living standards scenarios for the period 2014–2050.
Water 10 00537 g011
Figure 12. The future projections of the unmet water demands in the Upper Indus Basin (UIB) under the reference and low population growth scenarios.
Water 10 00537 g012
Figure 13. The future projections of the unmet water demands in the Upper Indus Basin (UIB) under the reference and high population growth + high living standards scenarios for the period 2014–2050.
Water 10 00537 g013
Figure 14. The unmet water demands in the Upper Indus Basin (UIB) under the reference scenario and in the RCP-4.5 and RCP-8.5 scenarios for the period 2014–2050.
Water 10 00537 g014
Figure 15. The projection of unmet water demands in the Upper Indus Basin (UIB) under the reference and water management scenarios.
Water 10 00537 g015
Figure 16. The future water estimation under different management strategies of water in the UIB.
Water 10 00537 g016
Figure 17. The projection of the “total unmet water demand” under four different prediction scenarios (2014–2050).
Water 10 00537 g017
Figure 18. The unmet water demand for four different futures for the years of 2015 and 2050.
Water 10 00537 g018
Table 1. The description and sources of the datasets used in developing the WEAP (Water Evaluation and Planning) model.
DataDescriptionSources
Remote sensing dataDigital Elevation Model for catchment delineation, land cover from MODIS, and TRMM data for precipitationUSGS (https://earthexplorer.usgs.gov/)
Climate data
(2006–2014)
Precipitation, Temperature Humidity, Cloudiness factor, Wind speedPakistan Meteorological Department
Hydrological data
(2006–2014)
Gauge station data, ReservoirsWater And Power Development Authority, Indus River System Authority and PMD
Demand dataLand use data
Urban sector
Population
Water use rates
Water consumption
Agricultural sector
Socio-Economic Surveys (Census 1998) and growth rate,
Irrigation Department (Pakistan) and agriculture census data
Table 2. The calibration parameter ranges used in the Water Evaluation and Planning (WEAP) model.
ParametersModel RangeOptimal Range (for Different Land Covers)
Soil water capacity0-higher (mm)0–1200 (mm)
Root zone conductivityDefault = 20 mm10–50 (mm)
Deep conductivity0.1-higher (mm/month)
Default = 20 mm
Default = 20 mm
Runoff resistance factor0–1000 (default = 2)0–100
Preferred flow direction0–1 (default = 0.15)0.5–1

