Article

Community-Based Monitoring in Response to Local Concerns: Creating Usable Knowledge for Water Management in Rural Land

by
Adriana C. Flores-Díaz
*,
Alexander Quevedo Chacón
,
Rosaura Páez Bistrain
,
M. Isabel Ramírez
and
Alejandra Larrazábal
Centro de Investigaciones en Geografía Ambiental, Universidad Nacional Autónoma de México, Antigua Carretera a Pátzcuaro 8701 ExHda La Huerta, ZP 58190 Morelia City, Michoacán, Mexico
*
Author to whom correspondence should be addressed.
Water 2018, 10(5), 542; https://doi.org/10.3390/w10050542
Submission received: 14 March 2018 / Revised: 14 April 2018 / Accepted: 22 April 2018 / Published: 24 April 2018
(This article belongs to the Section Water Resources Management, Policy and Governance)

Abstract

:
Water resources around the world are being affected by increasing demand for human consumption as well as by industrial and agricultural use. Water quality has an impact on our quality of life, so effective monitoring provides the necessary data to allow decision makers to address critical water-related issues. This study (1) analyzes water knowledge generated by a community-based water monitoring (CBWM) network within a world heritage site; (2) discusses the extent to which monitoring responds to community concerns about water; and (3) indicates challenges in the generation of local usable knowledge. Using information generated over 6.5 years by a local monitoring network, we calculated a water quality index (WQI) and generated a time-series analysis using the breaks for additive season and trend (Bfast) algorithm. Results were grouped by specific community and institutional concerns about water. Springs under good management practices had low pollution levels, while others used for drinking and recreation had high fecal bacterial counts. Monitoring provided data about Escherichia coli counts exceeding legal limits, and about conditions of alkalinity and dissolved oxygen that represent a risk for the freshwater ecosystems. This study demonstrates how CBWM schemes can be a means of generating knowledge of water resources that can enhance the understanding of water dynamics and inform users’ decisions at local–regional levels.

1. Introduction

Increasing demands for water for human consumption, industry and agriculture have affected water resources around the world [1,2,3,4]. The implications for human well-being and ecosystem integrity have raised concern in many sectors about water quality [5,6,7,8], and the impact human activities are having on it.
Water-quality monitoring can assist planners and decision makers to alleviate water-related poverty [1] and other critical water-related issues. Unfortunately, historical records related to water planning and research are generally lacking, especially in rural areas [9], making it difficult to understand the contributing factors and relationships that determine trends in the management of water resources. In both rural and urban areas, individuals and local communities who gather information about the quantity, quality and temporality of their water systems [10,11,12,13,14] are now collaborating with scientists [15,16] to develop certified programs as a rigorous way to improve education about water management, generate credible data, and establish early warning systems for water pollution (e.g., the Global Water Watch program, (GWW)) [13,15,17]. As a result, these community-based water monitoring (CBWM) programmes have contributed to local and regional decision making [13,18,19,20], by co-producing knowledge and combining scientific rigor with social concern [21,22,23,24]. Furthermore, as most human territories have no hydrological boundaries, a CBWM network can help involve other groups or communities within co-management schemes [23,25], when local decisions are being made. In practice, CBWM can generate data on long term trends and seasonal changes in order to create best-management practices that improve the control of soil erosion [26], protection of clean water bodies [26], groundwater management [27], and restoration activities [28,29,30], particularly in regions for which water data are lacking or difficult to access [26]. However, the establishment of CBWM faces a number of credibility challenges, given the low resolution of some monitoring tests used and that the citizens collecting the data may lack technical accreditation.
CBWM meets the challenge of generating usable data and knowledge from the users’ perspective (distinctions are made between ‘useful’ and ‘usable’ knowledge [31,32]), which can be incorporated into environmental decisions addressing local concerns [33,34], as well as informing the decisions of regional actors, in diverse contexts and territories. This study proposes the CBWM as a valuable means for generating knowledge of water resources which can enhance the understanding of water dynamics and inform users’ decisions at local to regional levels [1].
This study seeks firstly to describe the knowledge generated regarding water quality and seasonal conditions by the CBWM network of the Monarch Butterfly Biosphere Reserve, Mexico; secondly, to discuss the extent to which community data respond to community concerns about water; and thirdly, to discuss challenges for CBWM to contribute in the generation of knowledge that is usable by local to regional stakeholders.
Our conclusions highlight the fact that CBWM can be an important source of meaningful information in regions lacking long-term data and a way to encourage local participation in addressing environmental concerns.

2. Materials and Methods
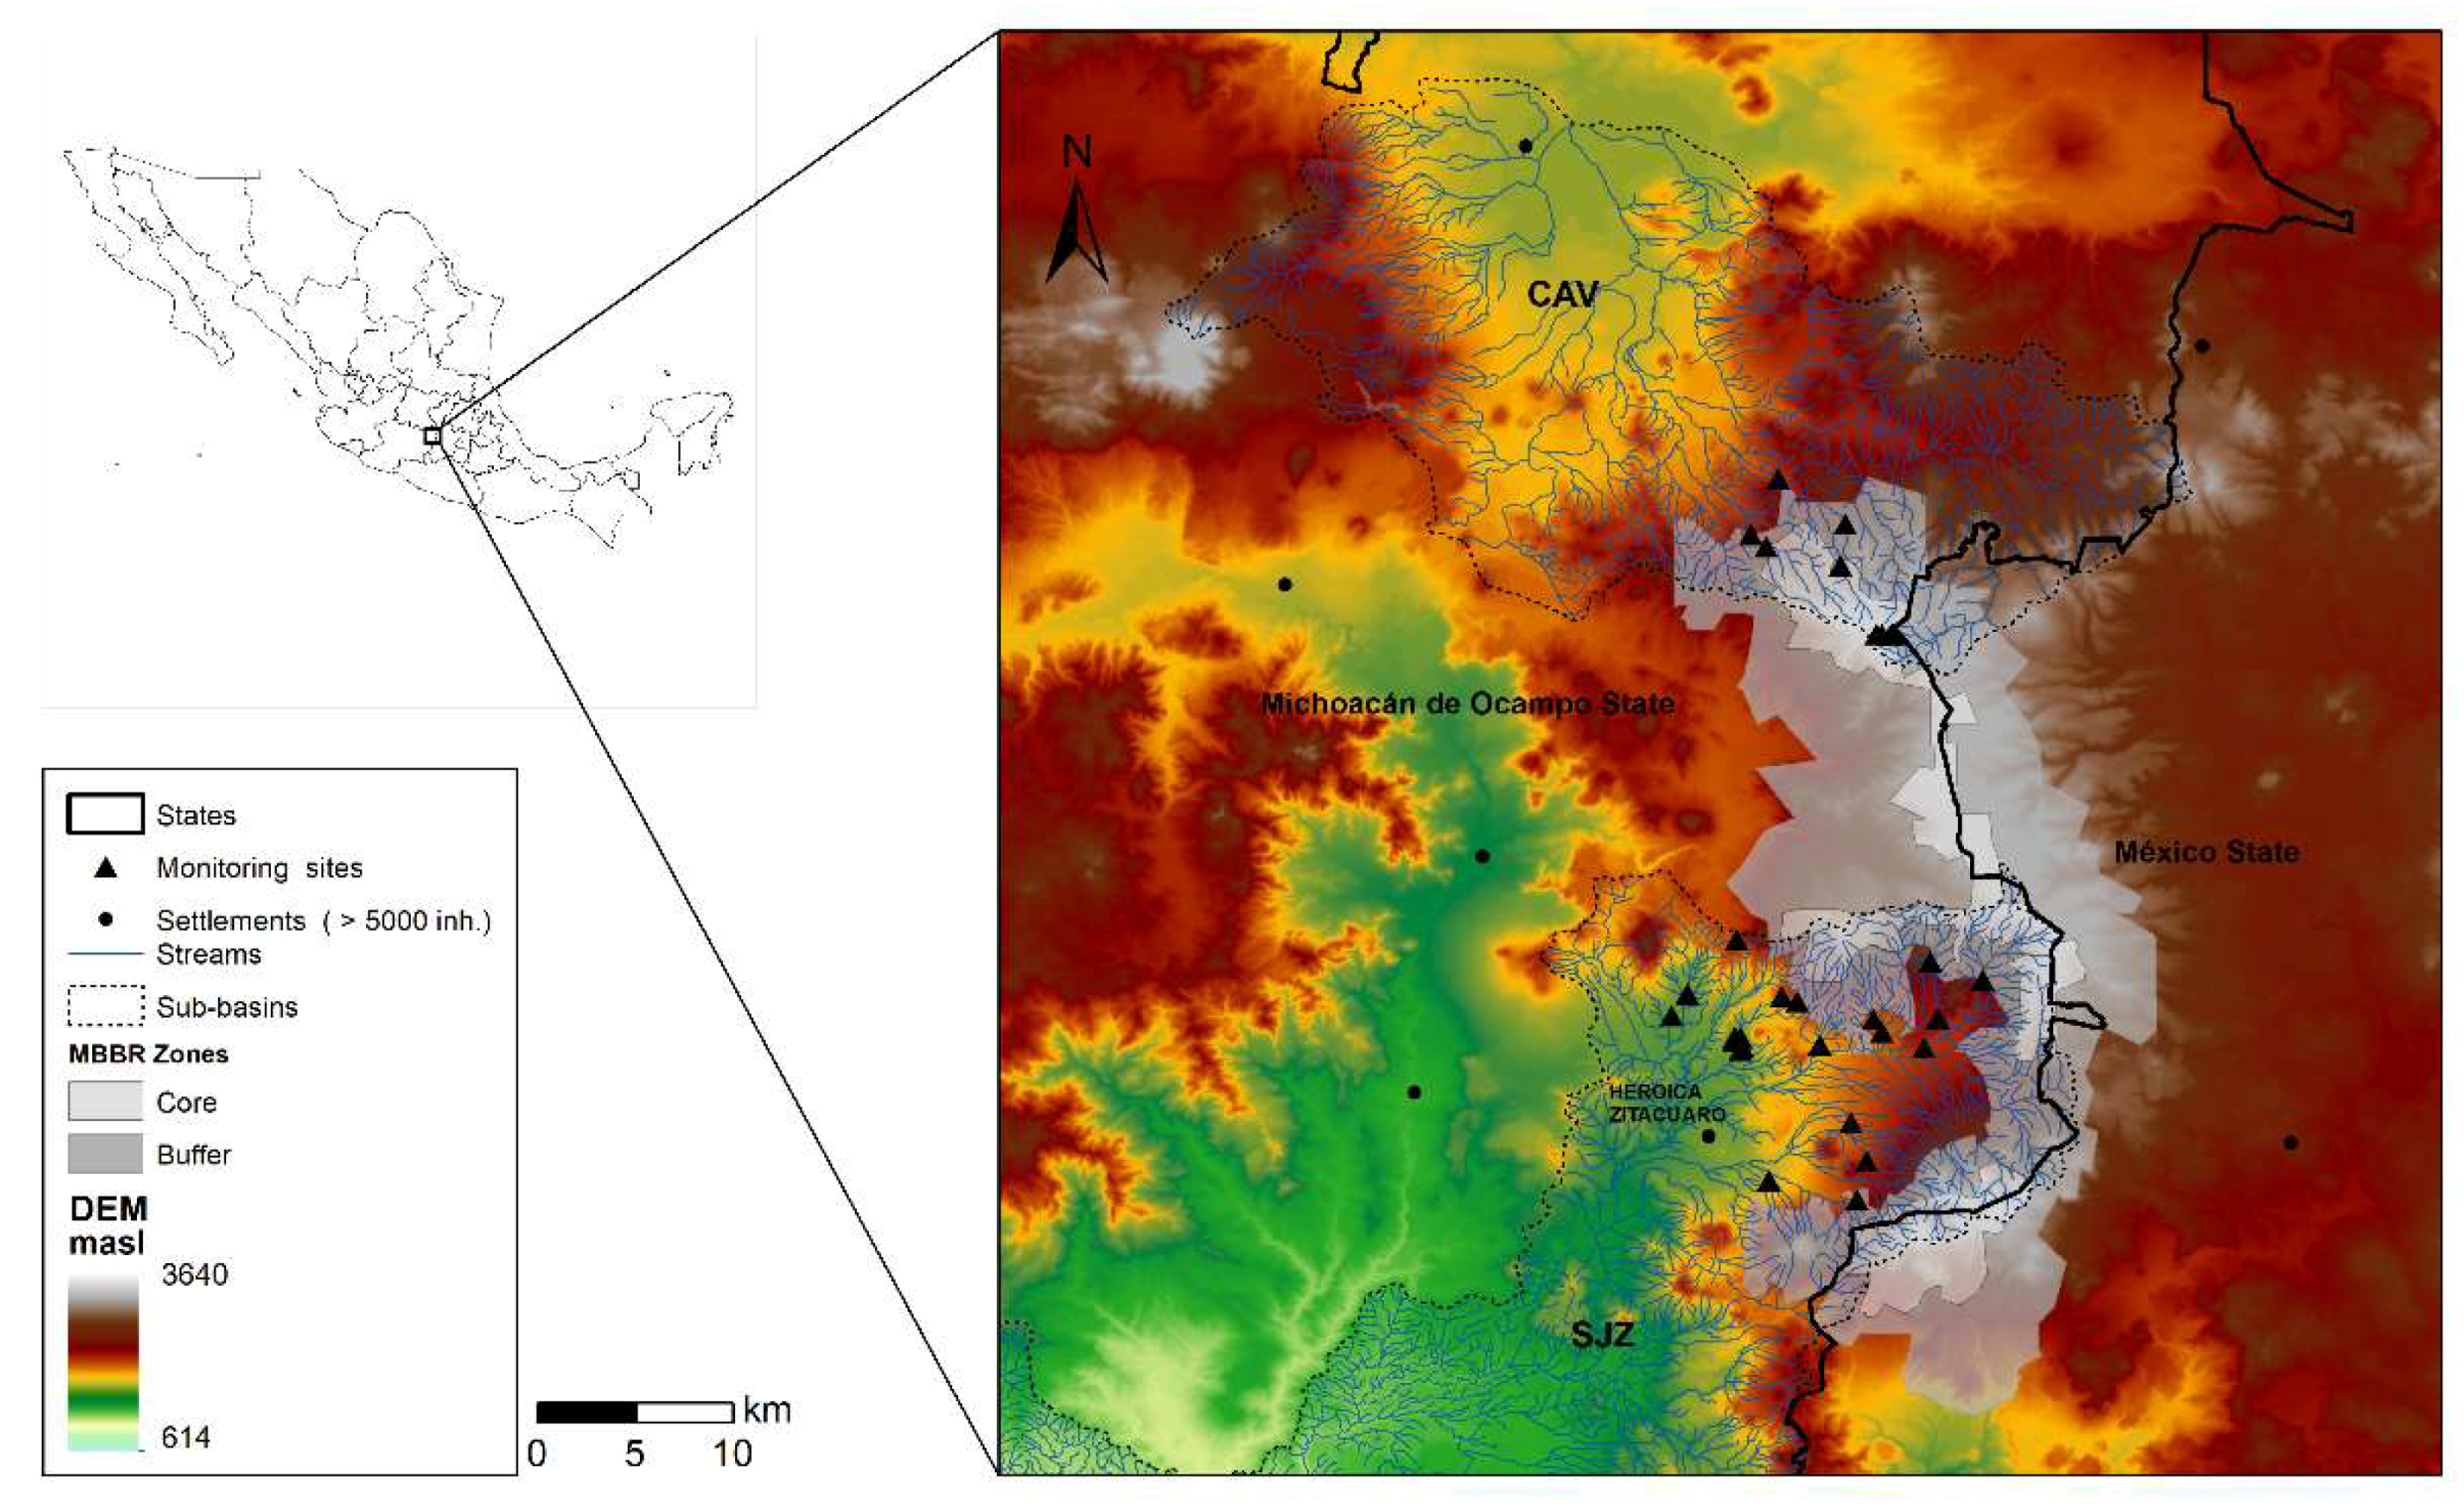
2.1. Study Area

The Monarch Butterfly Biosphere Reserve (Figure 1) was established in 2000 to protect the Mexican forest habitat where the monarch butterfly, Danaus plexippus, overwinters from November to March. Most of the land (80%) belongs to communally owned ‘ejidos’ and indigenous communities, with the remainder belonging to individual owners or the government. The main activities carried out by local farmers in the reserve’s buffer zone are timber harvesting, grain and fruit-crop production, and the raising of livestock. In the core zone, the main activity is ecotourism relating to the butterfly colonies [35].
The forests and the butterflies are the principle conservation objects of the reserve, but other activities (i.e., related to domestic and productive dynamics) have increased pressure on the use and access to water. Consequently, the quality and quantity of water has become a major concern for the local people. In 2011, a number of organisations (see the Acknowledgement section) with more than 15 years’ experience of encouraging local participation and environmental awareness in this region [36] joined forces to establish the Community-Based Water Monitoring Network of the Monarch Butterfly Biosphere Reserve. Their representatives, as well as those from communities were trained by Global Water Watch Programme-Mexico (GWWMex) to monitor water quality following international standards and procedures. The monitoring network is working in the highlands of the San Juan Zitácuaro (SJZ) sub-basin (which belongs to the Balsas River Basin) and the Cachiví (CAV) sub-basin (belonging to the Lerma–Santiago River Basin) (Figure 1). The GWW program is certified by the US Environmental Protection Agency, having satisfied the Data Quality Assurance Protocols [37,38].
This study analyses data collected between July 2011 and April 2017 at 30 monitoring sites (Table 1): 21 in the SJZ sub-basin and 9 in the CAV sub-basin. Each site was chosen following talks among the community and the network, based on the following criteria: (i) safety for drinking; (ii) domestic and recreational use; (iii) habitat for biodiversity (habitat for the endemic endangered stream salamander Ambystoma rivulare); (iv) fluvial conditions downstream of settlements; and (v) fluvial conditions at the border between buffer and core zone of the protected area.

2.2. Data Collection, Validation and Credibility

Network sites were established following discussions at workshops.Then, the Network designed the monitoring strategy to address the concerns of local communities and institutions regarding springs and streams used for water supply and for the conservation of biodiversity. Network sites were defined at preliminary workshops in 2011, when meaningful places and activities were marked on maps of the two sub-basins, San Juan Zitácuaro and Cachiví (Table 1).
Members of civil societies and local inhabitants (with reading, writing and basic arithmetic skills) were trained and certified in physicochemical and bacterial analysis, following the individual certification process of the GWW program guidelines. These include a regular review of principles and procedures for every test and monitoring session (i.e., maintenance of fresh reagents, adherence to correct procedures, review of bacterial counts, etc.). Each month, physicochemical variables (water temperature, hardness, alkalinity, dissolved oxygen, pH and turbidity) were measured with the Alabama Water Monitoring Kit (Lamotte); and Escherichia coli counts were obtained with Coliscan Easygel (Micrology Laboratories) (Table 2).
The quality of community databases was reviewed according to the following criteria: (a) adequate resolution for every test and date; (b) coherence between data and registered observations (e.g., adequate water level for measuring); and (c) exclusion of questionable data with no possible verification (e.g., discrepancies between the field data and digital files). Oxygen saturation was calculated with the standard formula, where Sat% is the percentage of saturation, O2 is the oxygen concentration, and Osat is the oxygen concentration at saturation under standard conditions.
Sat %   =   ( [ O 2 ] / [ Osat ] )   ×   100

2.3. Data Analysis

The water quality index (WQI) calculation for every site and month used a weighted multiplicative index [39], where I is the value of the parameter at site i, and W the weight it has in this analysis. WQI results were grouped in four categories: Excellent 90–100, Good 80–89, Fair 50–79, and Poor <50. Data were compared with environmental and health safety standards [40,41].
WQI   =   i = 1 n I i W i
Time series analysis used the algorithm Bfast (breaks for additive season and trend [42,43]), an additive iterative analysis that adjusts a linear model by separating the time series into seasonal, trend and error components. Bfast components for every site and parameter were tested for significance by a linear model and analysis of variance using the open software R [44], to compare field and modeled data. Time series analysis was calculated with the following formula, where T is a trend component, S a seasonal component and e an error term:
Yt   = Tt + St + et
Results were grouped by seasonal variation in temperature and humidity (having a cold season from November to February, and a rainy season from June to October, being significant for detecting changes in water), into the following categories for a given parameter: ‘Higher values in cold season’; ‘Higher values in rainy season’; ‘High values in both periods’; ‘Lower values in cold season’; and ‘Lower values in rainy season’. In addition, main warnings about the condition of the sites were indicated as follows: ‘Care required to achieve acceptable minimum’ (i.e., for alkalinity and oxygen values); ‘Periods of risk for drinking and human contact’ (i.e., fecal bacteria counts); and ‘Highly vulnerable site’ (i.e., abrupt changes).

3. Results

3.1. Data Validation

Twenty-five monitors were certified following the Quality Assurance Protocols [37,38] of GWW, and five of them have begun an internship to obtain their certification as trainers. Monthly data was revised in the databases and in the field books from each group.

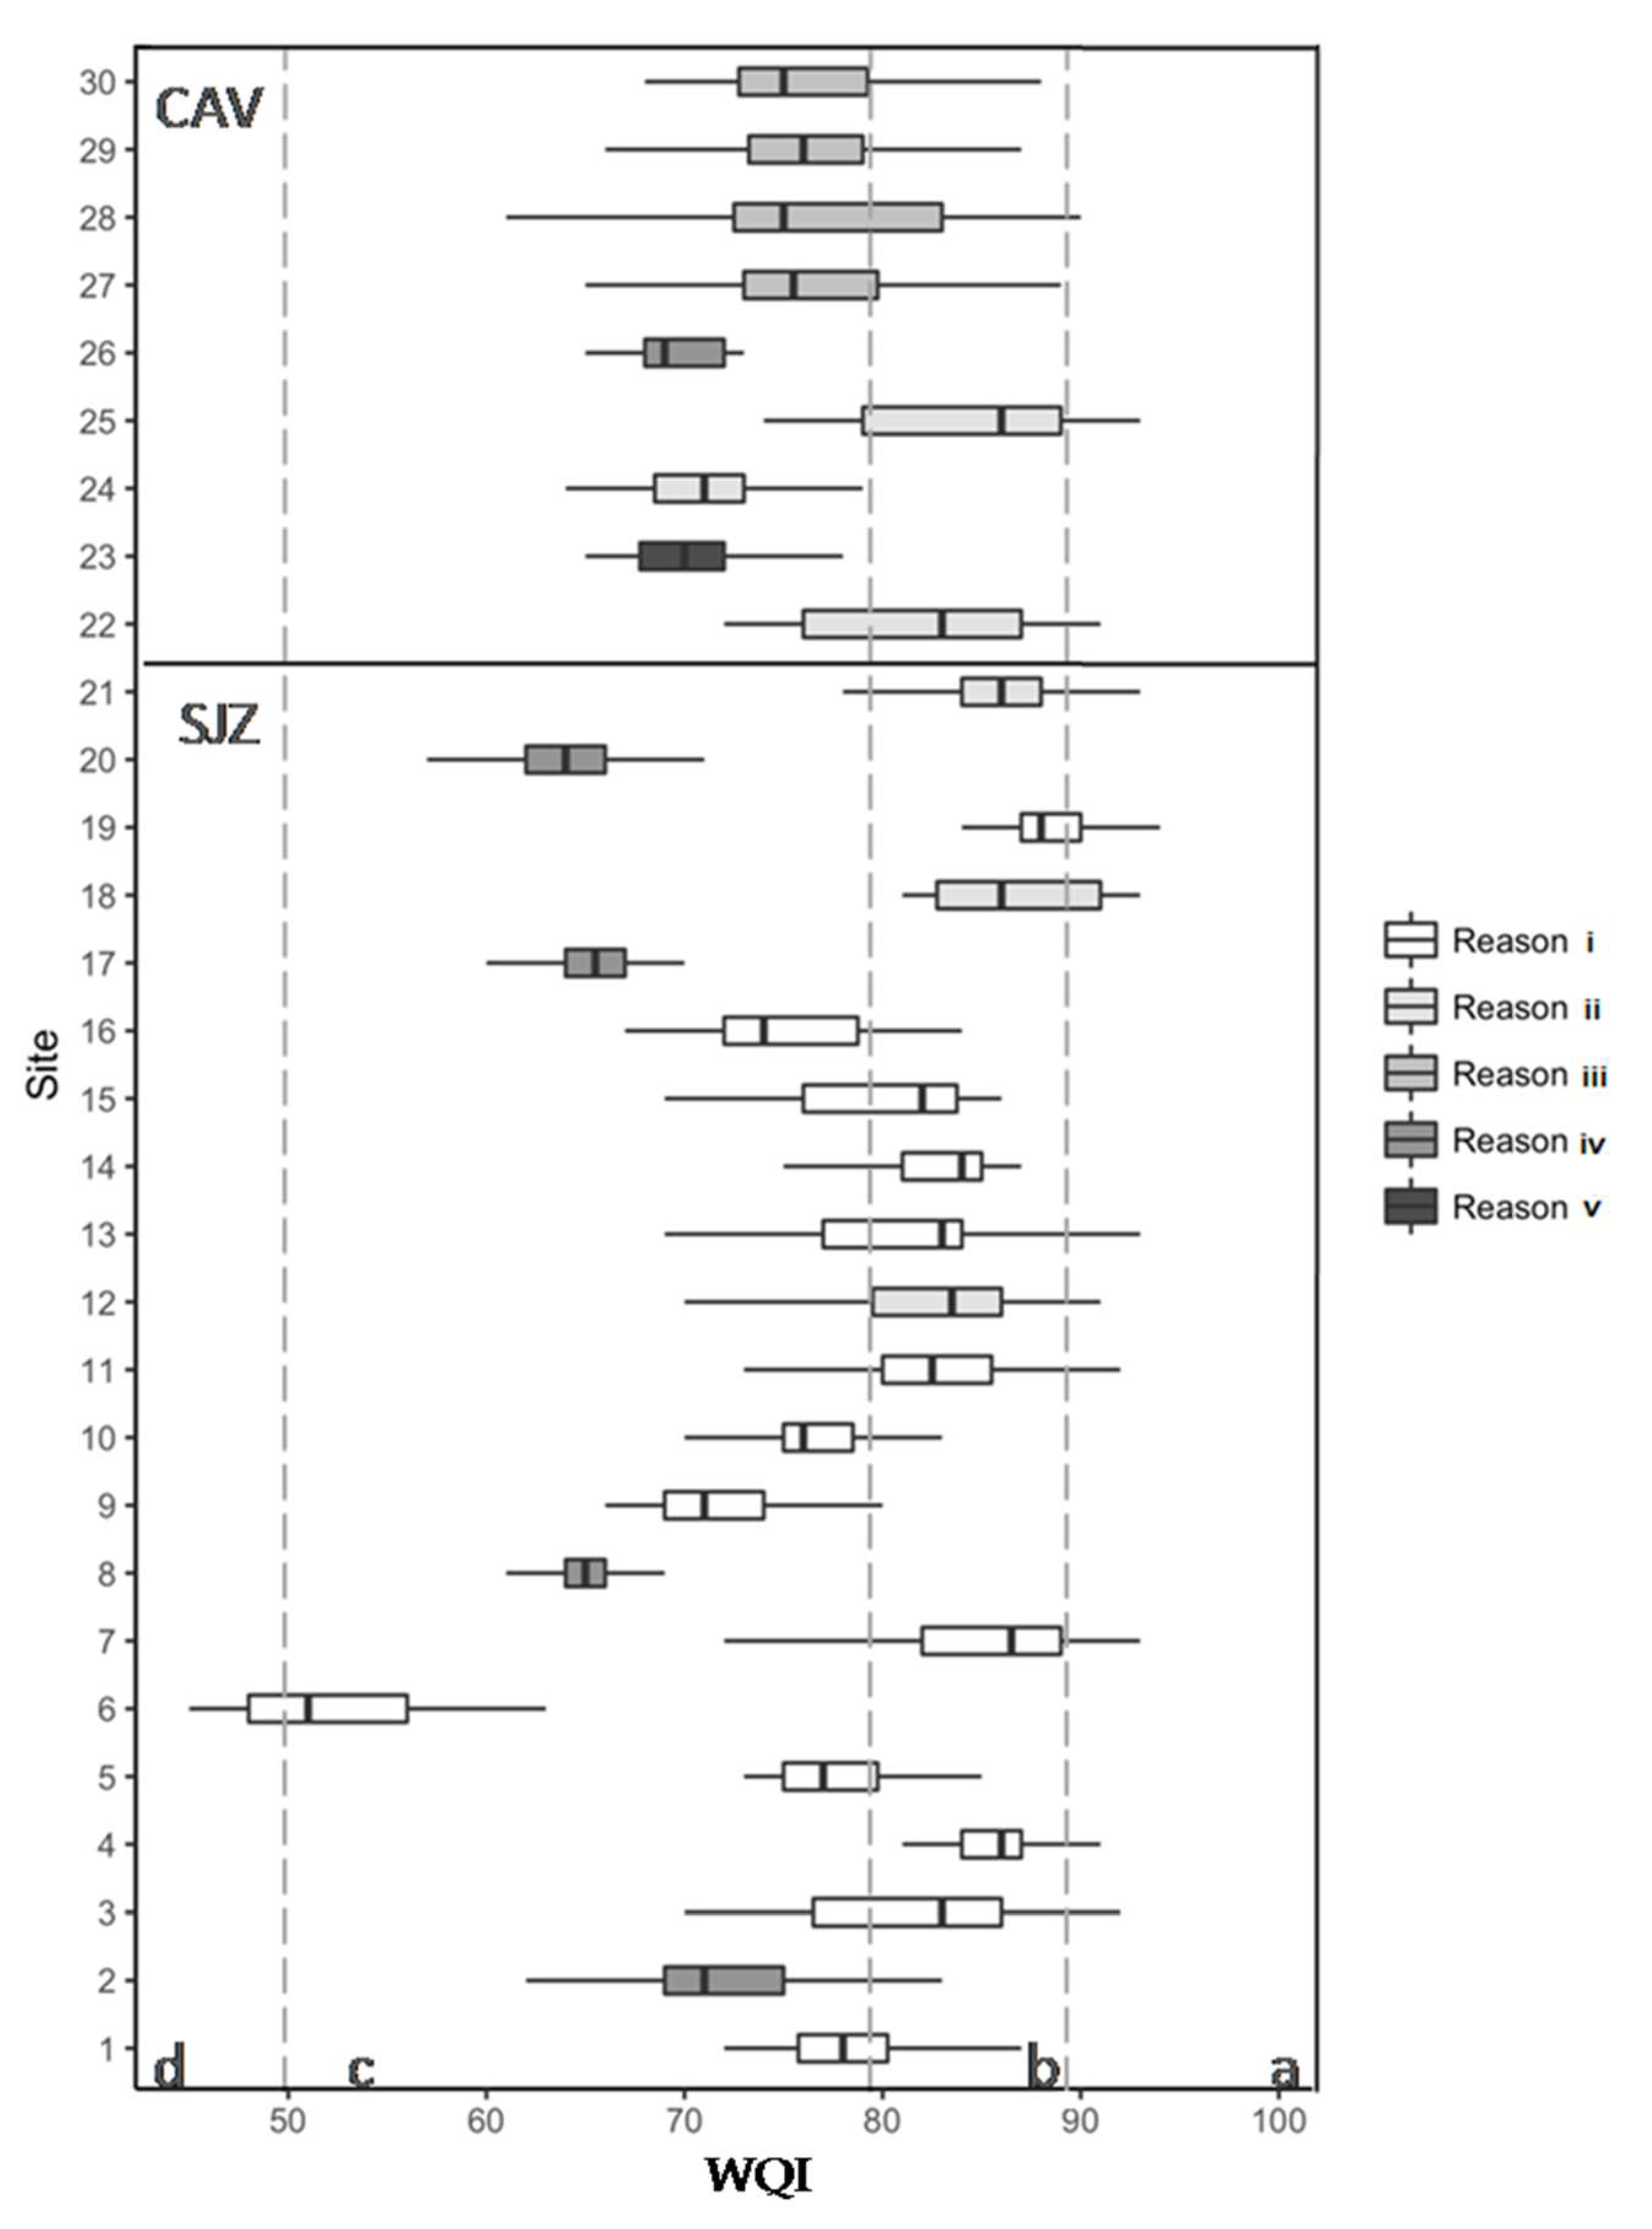
3.2. Water Quality Index

The SJZ sub-basin had more sites with poor water quality than did the CAV sub-basin (Figure 2), and in some cases given thepoor WQI (e.g., site 6) there is some doubt about the possibility of effective treatment. Most SJZ sites used for drinking and domestic supply required minor purification, whereas others such as 10 and 1 required intensive treatment (Figure 2). Despite the fact that there are months of low water quality, water at most of these sites is locally considered good for drinking and domestic uses, since it is piped to houses for direct use.
SJZ sites monitored regarding water quality for domestic and recreational activities had good WQI values (Figure 2), and required minimum treatment, except for site 12 which needed intensive treatment. Downstream of settlements, the water quality in the fluvial network was only fair, this being caused mainly due to wastewater entering the streams and a lack of proper sanitation.
In the CAV sub-basin, monitoring interests were more diverse (Figure 2), including some sites within the core zone of the biosphere reserve. Water quality at one point at the top of the microbasin (site 25) was adequate for drinking and recreation throughout most of the observed period, whereas a major water source for families (site 24) needed intensive treatment in most of the periods. Low WQI values indicate impairment of the fluvial network downstream of settlements. The same situation occurred at the border between the core and buffer zones of the protected area. Water quality at the sites representing habitat for A. rivulare was only fair (indicating some risk for this species), possibly because of the seasonal influx of tourists who visit some of these sites during the winter (sites 27 to 30) or the presence of the cattle in the surrounding grasslands.

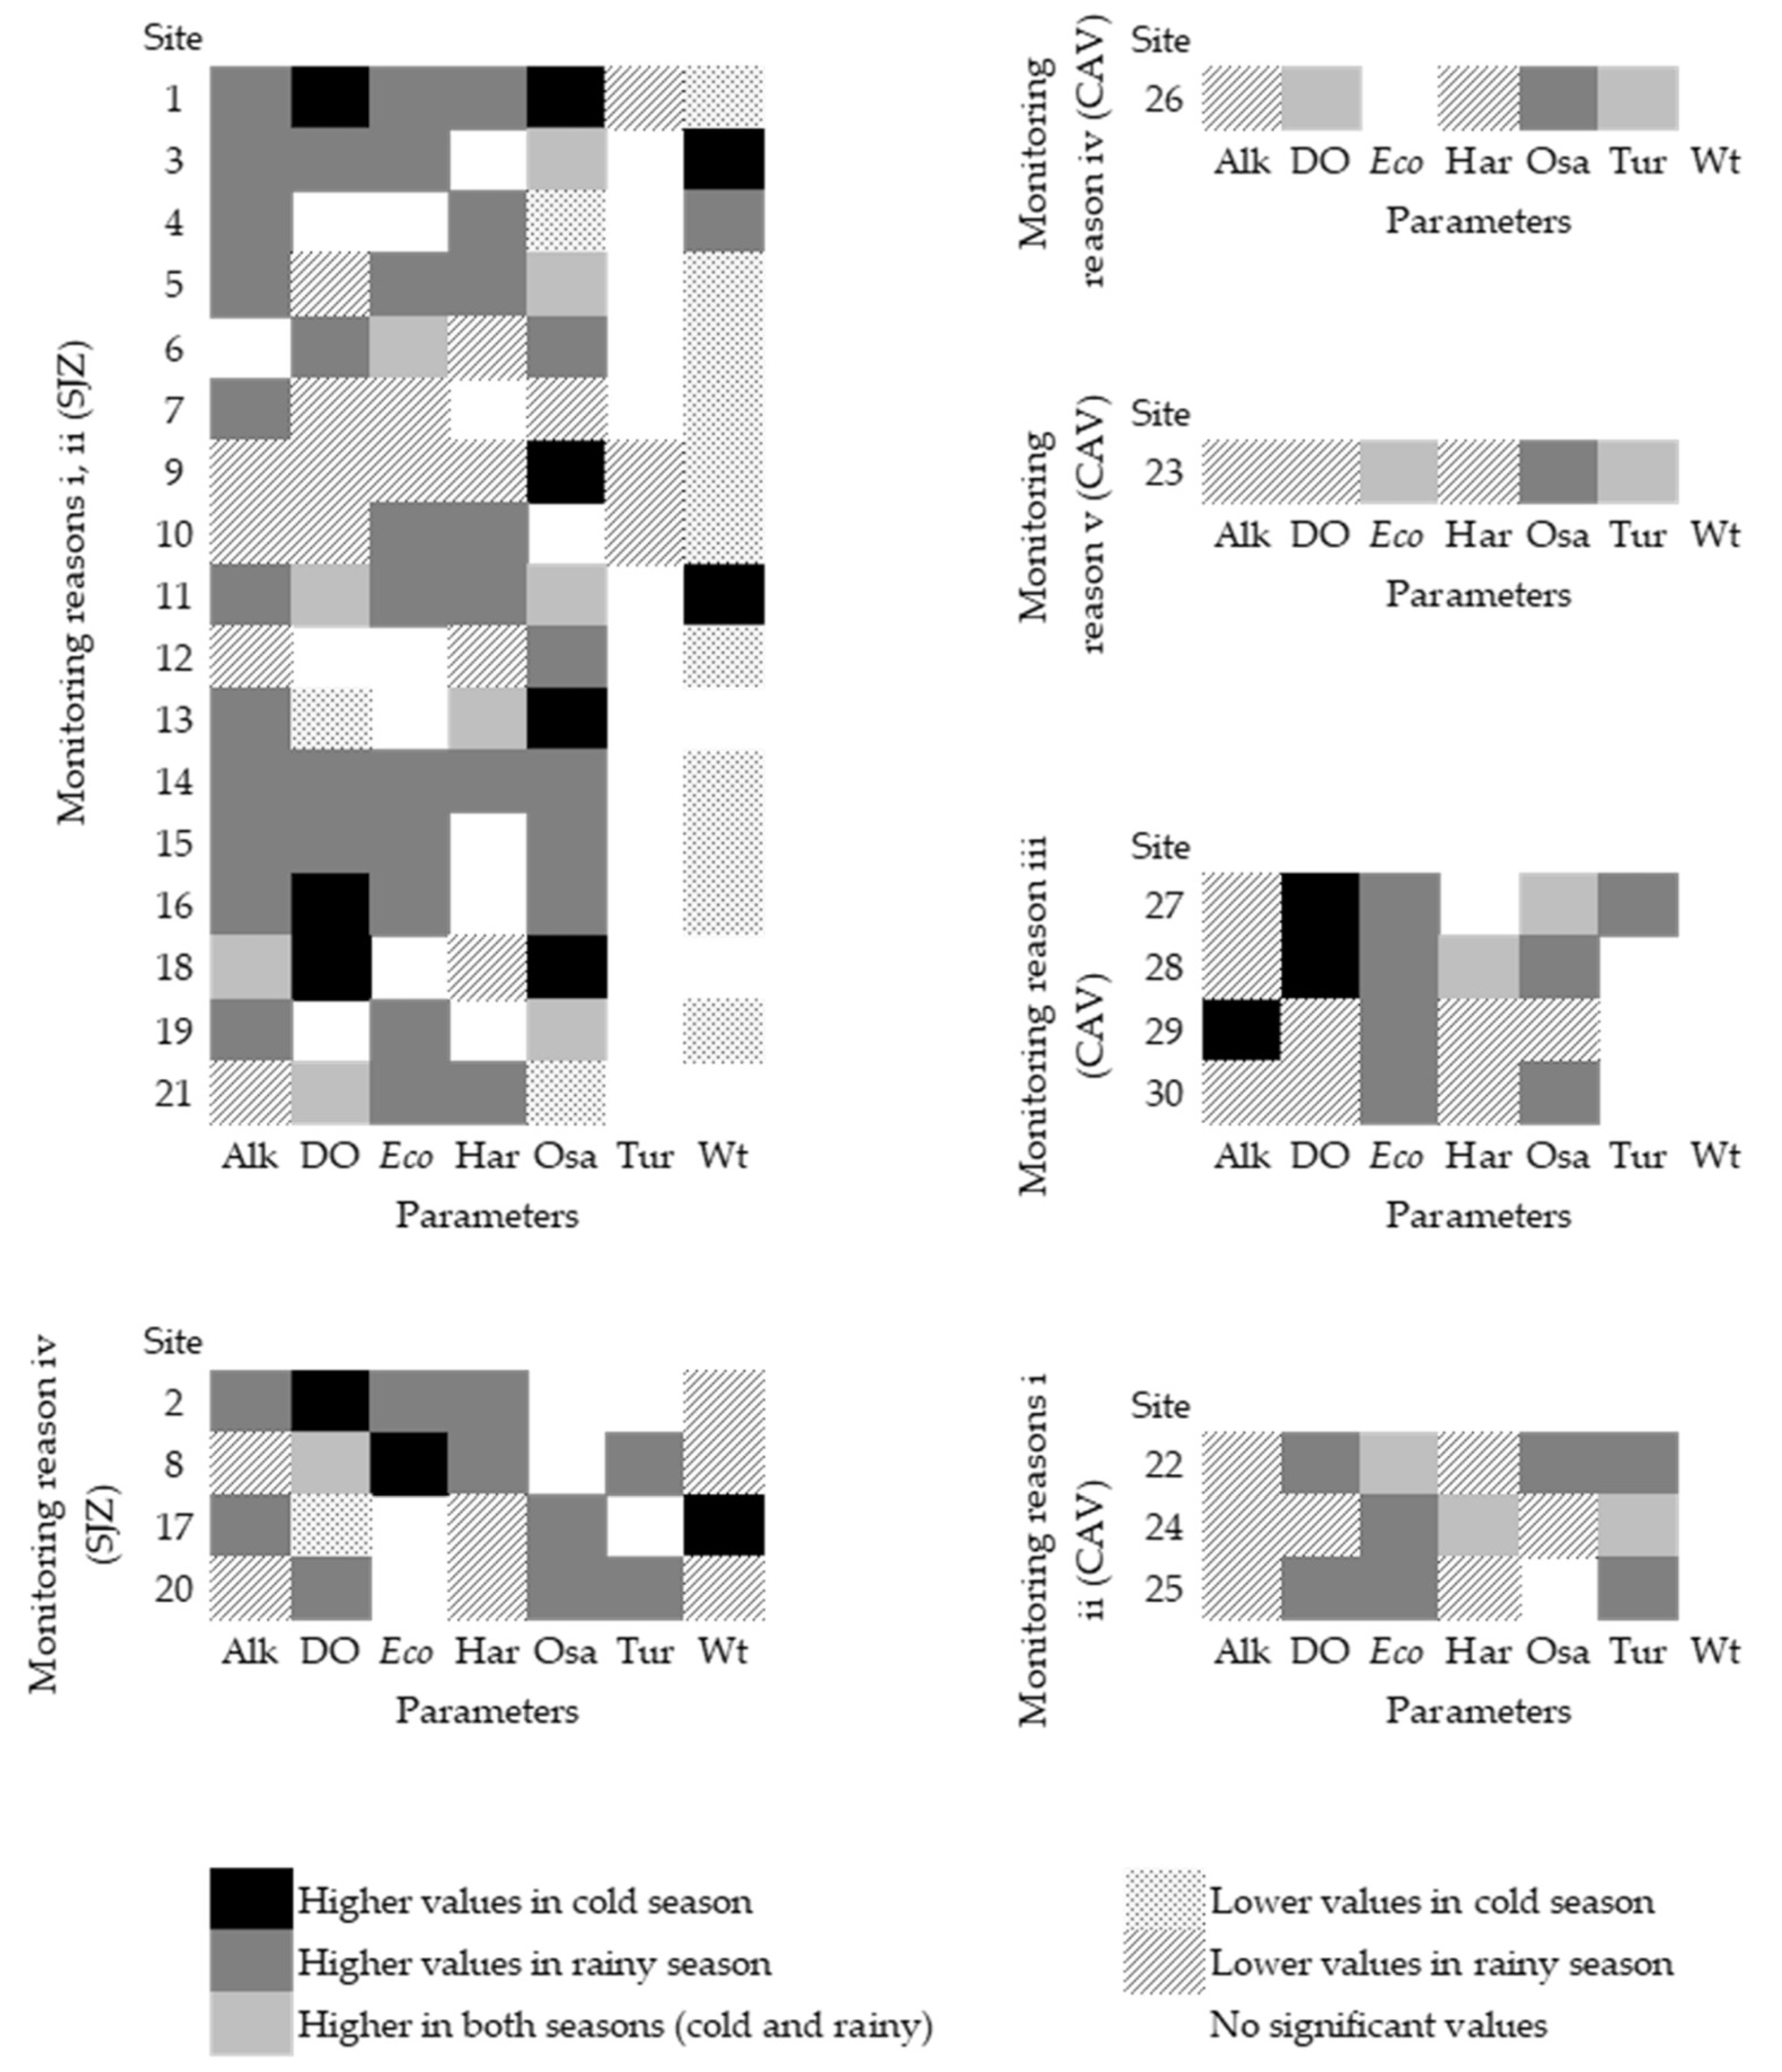
3.3. Physicochemical and Bacterial Analyses

While physicochemical values changed seasonally, the parameters for the SJZ sub-basin springs had most within acceptable ranges following the legal limits (Figure 3). These sites are used for drinking, domestic and recreational use. Ten of these 12 springs had periods of risk to humans due to high bacterial counts (Figure 4). At six of them, higher E. coli counts in the rainy season indicated contamination with fecal matter, accumulated in the surrounding area and being carried by runoff water to the springs. In contrast, in some springs E. coli counts were lower during the rainy season, indicating a ‘cleansing’ effect of the rain (Figure 3). There were two sites (Figure 4, springs 4, 5) needing attention in order to maintain the minimum alkalinity value recommended for fresh water (20 mg·L−1 following [45]).
In the SJZ sub-basin, the four stream sites monitored downstream of settlements had dissolved oxygen and oxygen saturation values lower than expected for fresh water with air contact (Figure 3). At all four, high E. coli counts made them unsuitable for drinking and other human activities (Figure 4).
The six SJZ streams monitored for domestic water supply had periods when dissolved oxygen and oxygen saturation values were lower than those recommended and could be less suitable for sustaining biodiversity as well as for human use. The lower oxygen level in the cold season may be associated with the high E. coli counts that render the water unsuitable for human activities. Two of the stream sites had hard water, resulting in an alert health risk due to illnesses associated with high calcium carbonate content of the water. Seasonal increases of sediment loads from the surrounding lands caused sites to have periods when turbidity values were in the upper acceptable ranges (e.g., site 20) (Figure 4).
Two CAV stream sites monitored to assess the condition of the fluvial network downstream of settlements (Figure 3) had dissolved oxygen concentrations lower than expected for running water. There were periods when E. coli counts were high enough make the water questionable for human consumption and contact. During the rainy season bacterial levels were lower indicating a ‘cleansing effect’ of rainwater, but as a result of sediment load, turbidity was generally greater (Figure 4). The water hardness was higher than acceptable for drinking water.
The one CAV stream site monitored to assess the fluvial network at the border between the buffer and core zones of the protected area had periods when alkalinity was lower than recommended for healthy fresh water (Figure 3), reflecting a low concentration of carbonates in the rocks of the catchment area. Similarly, turbidity sometimes exceeded the limit recommended for drinking water. At times, E. coli counts could limit use by humans probably due to the use of the protected area of activities other than conservation (e.g., grazing). At this site, lower values during the rainy season indicated the ‘cleansing effect’ of rainwater. Since this site is not usually visited by the monarch butterfly or by tourists, it may represent the local users’ impact on the water.
At all four CAV streams monitored for suitability for biodiversity, particularly for A. rivulare, the alkalinity was only marginally higher than the recommended minimum for healthy freshwater, with a possible dilution effect of rainwater (Figure 3), while in three the dissolved oxygen concentrations were lower than recommended for sustaining biodiversity. E. coli counts presented a risk for drinking and contact, particularly during the rainy season, indicating an influx of fecal matter from the surrounding lands (Figure 4). The three CAV streams monitored for suitability for domestic and recreational use (Figure 3) were generally satisfactory; however, alkalinity was lower than recommended and E. coli counts were high at times, being particularly risky for humans during the rainy season (Figure 4).
Six of the 30 sites had E. coli counts exceeding the legal limits on more than 60% of the monitoring dates (i.e., SJZ springs 1, 5, 11, and streams 6, 10; CAV stream site 24). These levels represent a real risk for human health and the sites require intervention as they are important for domestic water supplies.

4. Discussion

4.1. Data Responses to Local Concerns about Water Resources

The physicochemical and bacterial data identify factors that influence the water quality, and the WQI is an integrated value that helpsto determine the appropriate treatment for a site. The data highlight seasonal patterns of pollution and provide a warning about the risks of using the water as well as raising awareness of bad management practices.
The local people had concerns about the safety of SJZ spring water for different human activities. The monitoring data show that these concerns are warranted, as there are risks for human health [40]. They also underline the importance of taking into account seasonal factors such as rainfall, monarch ecotourism, and free/grazing cattle when developing strategies to manage sources of pollution. Interestingly, the two springs with good management practices (i.e., fences and vegetation cover) had safe water.
Poor river-management practices (i.e., channel modification, loss of riparian forests, and lack of proper sanitation) were observed at the SJZ streams, and are probably responsible for the low oxygen values and high E. coli counts, which are a threat for freshwater biodiversity. Riparian restoration along upstream reaches and proper sanitation systems can improve water quality [46,47].
The data for CAV streams underlined the impact that settlements have on downstream conditions, as well as the border between core and buffer zones of the reserve, with increased E. coli counts and high turbidity values representing a permanent risk for human health [1]. Furthermore, the low values of oxygen and alkalinity, making the water vulnerable to abrupt changes in acidity, also represent a problem with respect to freshwater biodiversity. The high E. coli counts during the rainy season (June to October) do not coincide with tourist activities (November to February), indicating the need to determine which local activities should be adjusted to meet with the conservation goals. CAV streams show high E. coli counts and turbidity values in various seasons of the year, representing a permanent risk for health [1].
Each spring is generally associated mainly with one ‘ejido’ or indigenous community since it belongs to a particular territory, and access by other people (i.e., private owners) may be requested. However, as streams cross the territories within the basin, they carry pollution along the fluvial network. Consequently, when developing effective water-management strategies one must take into account the different types of water body as well as their receiving–emitting behaviors. This information must be readily available to local inhabitants and authorities, as well as to the officials responsible for the protected area, when establishing priorities (i.e., health issues, threats to biodiversity). The databases and their interpretation are a real source of information in which institutions and local monitors have been involved.
Our findings show that the data generated by community monitoring can help address local concerns. (a) The suitable of water for drinking and recreational purposes (monitoring reasons i and ii) vary both between sites and within a site on a seasonal basis, and at times is a risk to human health, so it is necessary to understand the specific conditions at each site in order to address the pollution problems; (b) Our data also show that periods of high bacterial pollution, possibly related to tourism or the presence of free-grazing cattle, could have a negative effect of biodiversity within the habitat (monitoring reason iii). This information can be used by the officials of the reserve when developing their management plan; (c) Fluvial conditions downstream of settlements (monitoring reason iv) are most polluted, so it is important to identify the main reasons and sources (i.e., larger settlements or failure of treatment systems); (d) Similarly, data on the fluvial conditions at the border between the buffer and core zones of the protected area (monitoring reason v) indicate activities other than conservation in the core zone, so it is important to draw up new agreements and improve communication with the local inhabitants of the reserve and use this information to draw up new agreements.

4.2. Community-Based Water Monitoring (CBWM) Generation of Usable Knowledge

By responding to the concerns of local people and institutions about water quality, CBWM is contributing usable knowledge for water and land management, as follows:
  • CBWM creates databases about water conditions in socially important sites and, in the absence of long-term data, provides essential information to decision makers [14,19,43]. Citizens, volunteers, and partner institutions are helping to address this issue, not only by generating data but by making it usable for social actors, and at socially important sites [34,47,48].
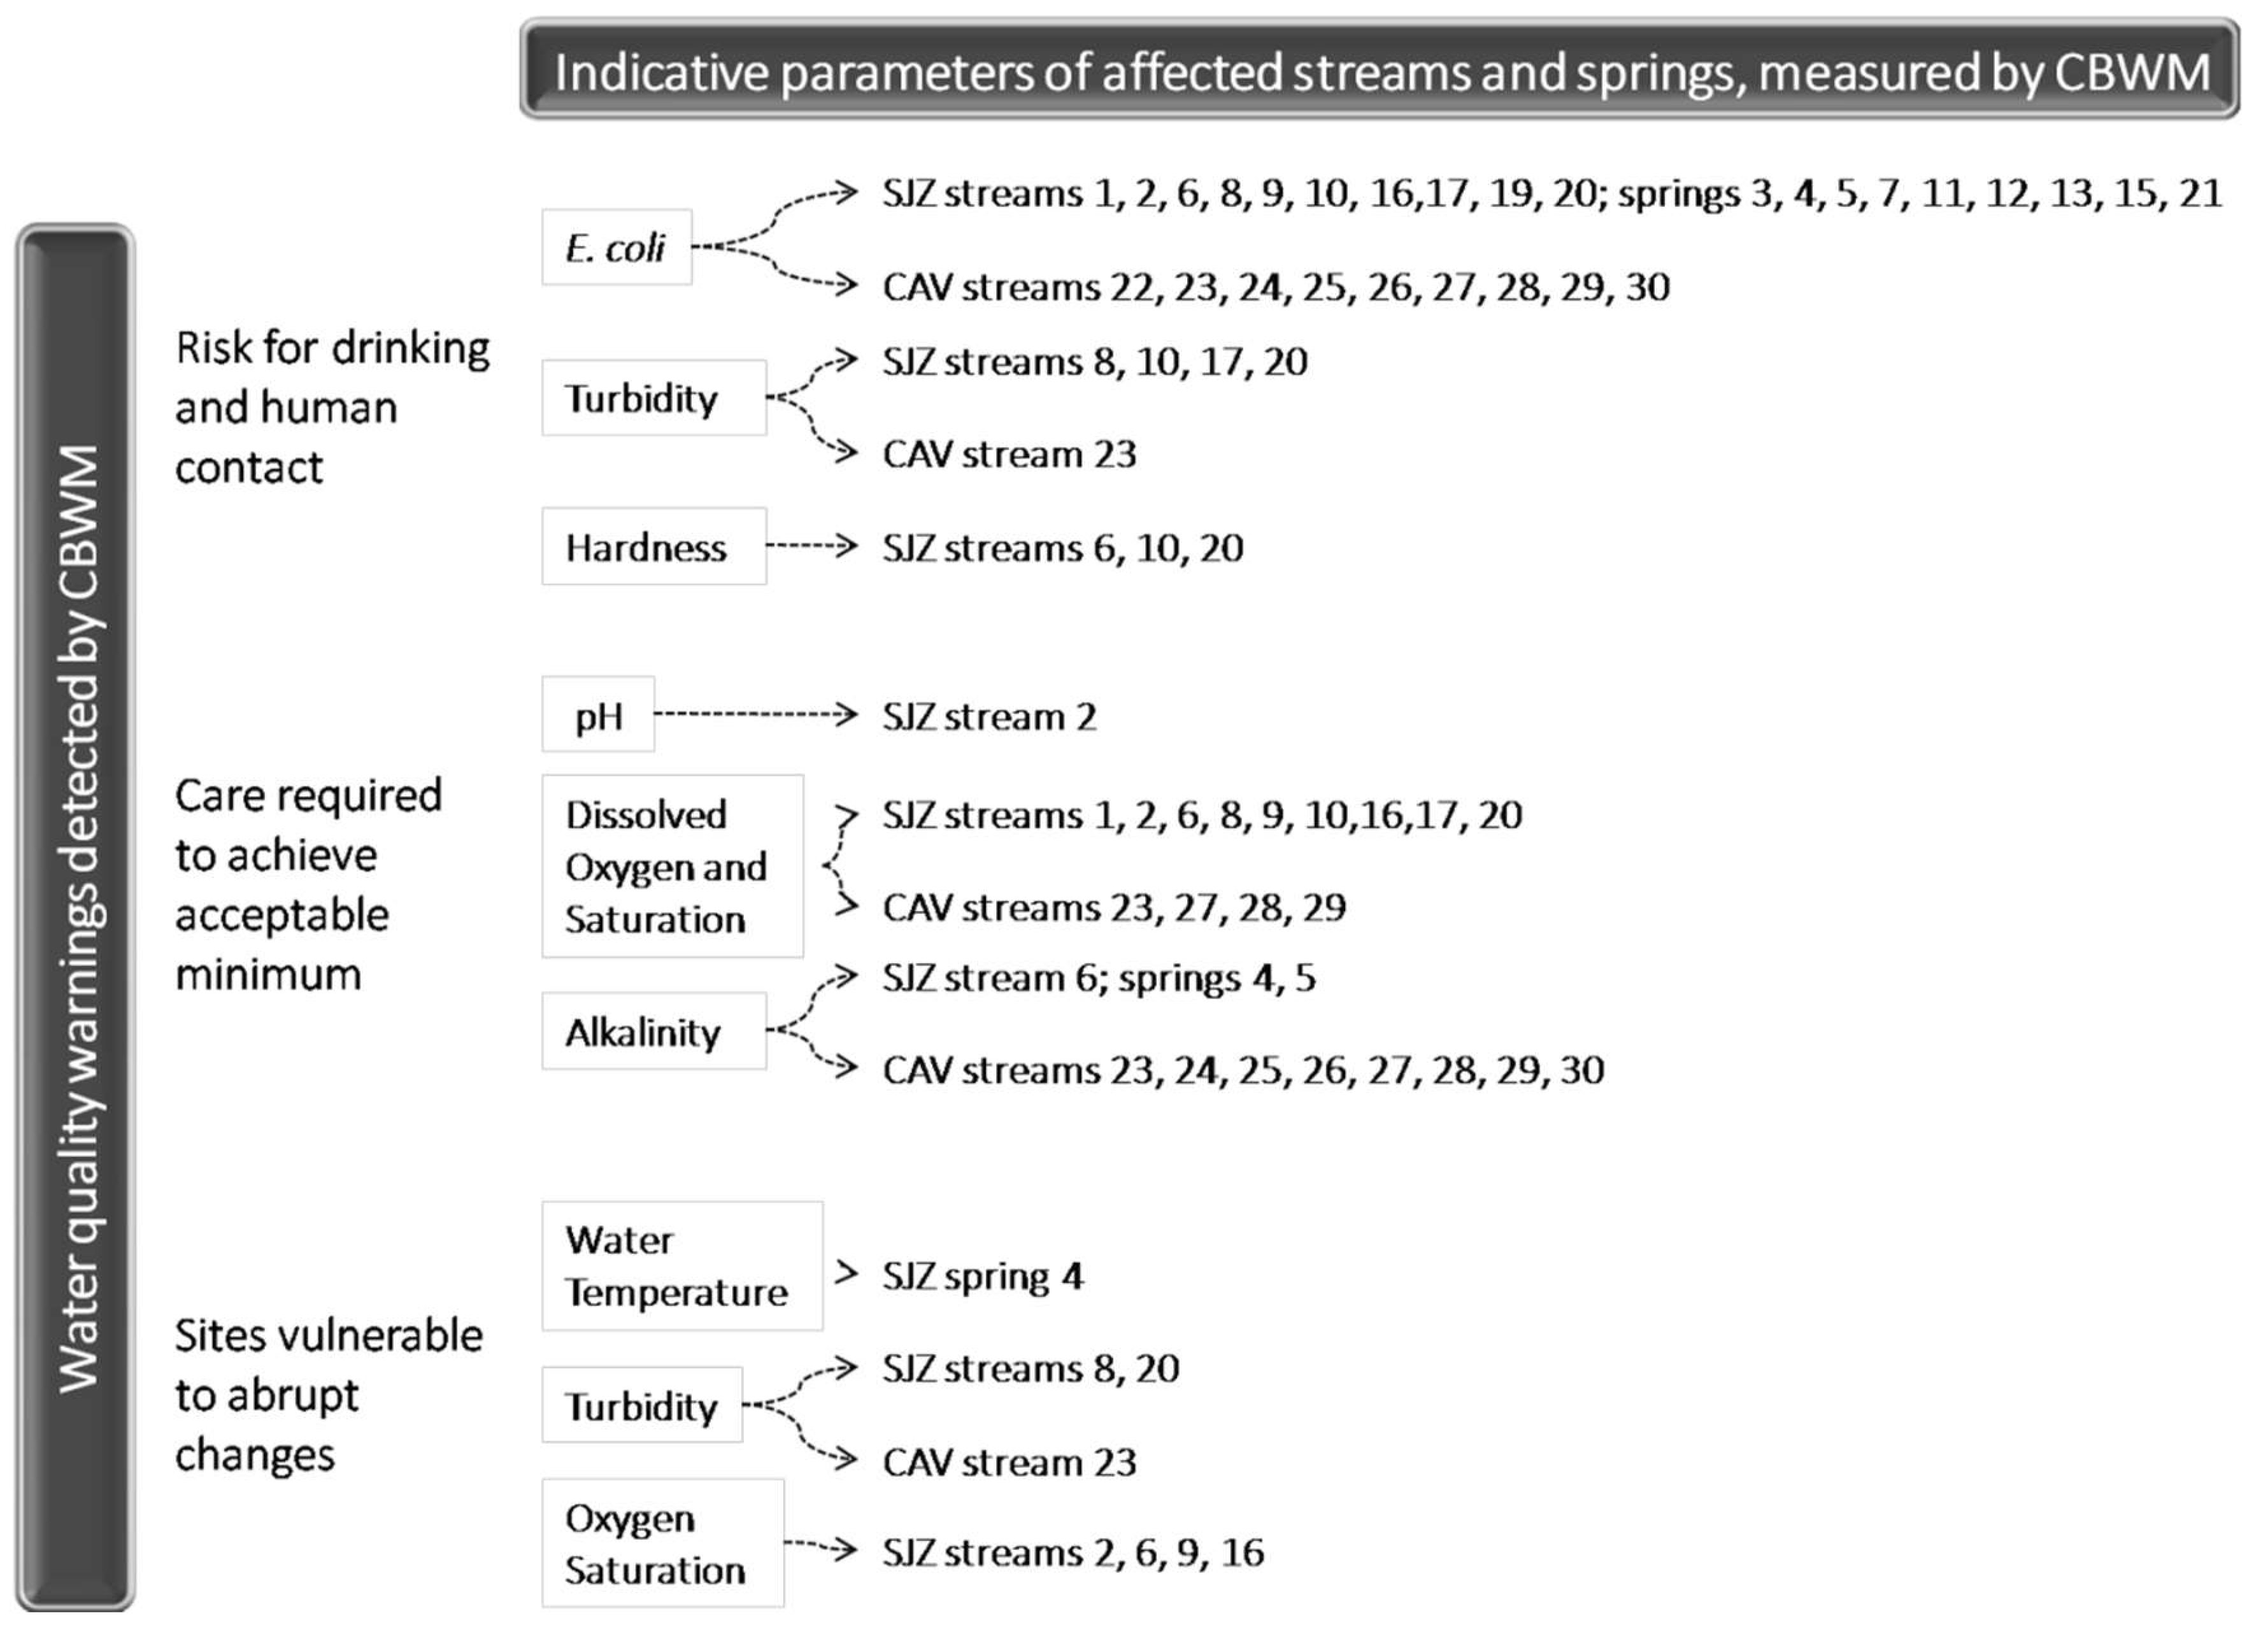
  • Analysis of specific water properties clarifies the relationships among the factors contributing to water quality [49], and the ways in which water is tied to the general management of the basin [50]. For example, within the Monarch butterfly reserve, quantification of turbidity as a proxy for erosion problems has indicated that better management practices are needed at locations higher up the basin; and the E. coli counts indicate fecal matter reaching the water, calling for proper sanitation and better livestock practices.
  • Unlike other resource monitoring, CBWM generates data that local communities and other stakeholders can use almost immediately to understand the effects of their activities on their territory [34]. Databases register the long-term behavior and trends, while single monitoring sessions allow CBWM to work as an early-warning system for local and regional stakeholders [25,28].
  • CBWM at the monarch reserve has underlined problems related to the effectiveness of current protection policy (e.g., habitat suitability for freshwater biodiversity). Clearly there is a need to revise both the management plan and the regional agreements (i.e., permitted and regulated activities), to reduce the impact of human activities on the water bodies (i.e., the tourism impact on freshwater habitat) thereby achieving a coherent protection policy.
  • CBWM usually operates as a collaborative scheme that addresses diverse interests associated with water resources. Given that fluvial systems drain and communicate across the region, they form configuring hydro-social territories shared by ‘ejidos’ and indigenous communities, private owners and protected-land authorities [51,52]. The data generated provide knowledge of water behavior, identify the sources of pollution, and emphasize the spatial connections between regions. Payments for environmental services contracts are of interest in the study region, and it is useful to understand the teleconnections among users and providers involved; and to develop them it is essential to have the data relating to water quality available to ensure effective communication among users and providers in order for all the stakeholders to achieve their own institutional goals [53,54].
  • CBWM involves the community in local decisions regarding water, by providing tools to measure and interpret data. Participation can result in new local governance schemes for local to regional decisions. The possession of credible data by means of CBWM is a tool that informs decisions and a new benefit for this region [30].
There are still challenges when using CBWM to generate usable knowledge for local to regional stakeholders.
As considerable effort is invested in the formation and maintenance of a CBWM group and the resulting database, it is necessary to have a certified process to ensure the quality of the information generated. Community monitors already have basic skills of reading and writing, and the quality assurance protocol helps in achieving credibility and confidence in data collection and interpretation.
In most rural communities, the establishment of CBWM monitoring strategies is determined by local people and their collaborative networks to address problems at specific sites. CBWM is oriented to meaningful places and concerns, and not in response to out-of-context planning. It is essential that local expertise (knowledge and cultural meaning of water) is combined with technical expertise (rigor in data collection and interpretation) [55,56] to ensure sustainability. CBWM groups must have adequate communication skills [57] (e.g., culturally adequate), to ensure that the knowledge obtained has the ‘content and format’ necessary to be readily ‘usable’ [32,57].
CBWM databases can be used to identify local community problems to be addressed internally, from those that are more regional relating to other communities and actors. Water data provide information about specific pollution problems across the basin, and these should be used when there are challenges in the land-use planning (e.g., expansion of avocado production, permitted forestry activities) so that human activities do not endanger water security [28,58,59]. In order to take care of water, land-use planning can be informed by long-term databases, showing the local to regional history of the basins [49]. In this study, longitudinal data analysis was useful both to create a baseline of water features and to determine the seasonal patterns of water-quality impairment [60,61].
Finally, local interest in water is encouraging recognition of schemes such as CBWM to address the implications for human well-being and ecosystem integrity of human activities, since such schemes supply first-hand data and in culturally appropriate contexts [61]. Knowledge generated by the CBWM does not need to be adapted to make it relevant to the problems experienced by a community, since the monitoring has been designed by the community itself. Thus, CBWM is a valuable means for generating knowledge of water resources and extending this further towards an understanding of both its interaction with the stakeholders’ knowledge systems and its validity and pertinence within management [62]. CBWM can encourage usable knowledge generation as long as it is supported not only by academics but also by collaborative multi-stakeholder networks (i.e., transdisciplinary efforts).

Author Contributions

All authors conceived and designed the analyses. Adriana C. Flores-Díaz led the analysis and the paper writing. Alexander Quevedo Chacón performed the main time series analysis, and generated the map figures; Rosaura Páez Bistrain undertook the water quality index calculation; Adriana C. Flores-Díaz, Alexander Quevedo Chacón undertook other statistical analysis; Adriana C. Flores-Díaz, Alexander Quevedo Chacón, Rosaura Páez Bistrain, M. Isabel Ramírez and Alejandra P. Larrazábal de la Vía discussed the results, and made contributions to the manuscript. Adriana C. Flores-Díaz led the analysis at the stage of paper writing.

Funding

This research was funded by the National Council for Science and Technology (CONACYT—México) for the postdoctoral grant (No. 291053, and No. 02-291222), and by the BEST-P project IAI grant CRN3095, (NSF grant GEO-1128040).

Acknowledgments

The first author thanks the National Council for Science and Technology (CONACYT—México) for the postdoctoral grant (No. 291053, and No. 02-291222) to conduct and support this research. Research activities were supported also by BEST-P project IAI grant CRN3095, (NSF grant GEO-1128040). We thank Alternare, A.C. and the Monarch Fund for providing lodging and contact with local communities. Espacio Autónomo, A.C. provided digital maps of the Cachiví sub-basin. We thank all local communities and organization partners of the Community-based Water Monitoring Network at the Monarch Butterfly Biosphere Reserve for their support in field activities and willingness to share data: civil society organizations (Biocenosis, Alternare, Espacio Autónomo, and the Mexican Fund for Nature Conservation [FMCN]), academics (Environmental Geography Research Center, [CIGA] UNAM), the local office of the National Commission for Natural Protected Areas (CONANP), and the private-government trust, the Monarch Fund. Finally, we thank Sergio Ruiz-Cordova and Bill Deutsch from Auburn University, and Miriam Ramos for their guidance in community monitoring. Thanks also go to Ann Grant and two anonymous reviewers for their comments to improve the paper.

Conflicts of Interest

The authors declare no conflict of interest. The founding sponsors had no role in the design of the study; in the collection, analyses, or interpretation of data; in the writing of the manuscript, and in the decision to publish the results.

Research Data

Data for this study is located at the website of the Global Water Watch Programme (www.globalwaterwatch.org) at Auburn University, and at the Centro de Investigaciones en Geografía Ambiental, UNAM, México. GWW recognizes every monitoring group as the owner of their data, and the graphics are available on the website for public information. The Community-Based Water Monitoring Network at the Monarch Butterfly Biosphere Reserve has allowed the use of their data for this study. Written permission to access the raw data is required, so please contact the correspondence author [AF].

References

  1. United Nations Environment Programme Global Environment Monitoring System (GEMS)/Water Programme. Water Quality for Ecosystem and Human Health. UNEP GEMS/Water. 2006. Available online: http://www.gemswater.org/ (accessed on 10 January 2018).
  2. Pimentel, D.; Berger, B.; Filiberto, D.; Newton, M.; Wolfe, B.; Karabinakis, E.; Clark, S.; Poon, E.; Abbett, E.; Nandagopal, S. Water Resources: Agricultural and Environmental Issues. BioScience 2004, 54, 909–918. [Google Scholar] [CrossRef]
  3. Holland, R.A.; Scott, K.A.; Flörke, M.; Brown, G.; Ewers, M.R.; Farmer, E.; Kapos, V.; Muggeridge, A.; Scharlemanne, P.W.J.; Taylor, G.; et al. Global impacts of energy demand on the freshwater resources of nations. Proc. Natl. Acad. Sci. USA 2015, 16, E6707–E6716. [Google Scholar] [CrossRef] [PubMed]
  4. United Nations World Water Assessment Programme/Programme Office for Global Water Assessment/Division of Water Sciences, UNESCO. The United Nations World Water Development Report 2016: Water and Jobs Facts and Figures. WWAP/UNESCO 2016. Available online: http://unesdoc.unesco.org/images/0024/002440/244041e.pdf (accessed on 2 April 2018).
  5. Gleick, H.P. Global Freshwater Resources: Soft-Path Solutions for the 21st Century. Science 2003, 302, 1524–1528. [Google Scholar] [CrossRef]
  6. Dodds, W.K.; Perkin, J.S.; Gerken, J.E. Human impact on freshwater ecosystem services: A global perspective. Environ. Sci. Technol. 2013, 47, 9061–9068. [Google Scholar] [CrossRef] [PubMed]
  7. Steffen, W.; Richardson, K.; Rockström, J.; Cornell, S.E.; Fetzer, I.; Bennett, E.; Biggs, R.; Carpenter, S.; de Vries, W.; de Wit, C.; et al. Planetary boundaries: Guiding human development on a changing planet. Science 2015, 347, 1259855. [Google Scholar] [CrossRef]
  8. United Nations Environment Programme. Towards a Pollution-Free Planet; Background Report; UNEP: Nairobi, Kenya, 2017; 124p, Available online: web.unep.org/environmentassembly/report-executive-director-towards-pollution-free-planet (accessed on 10 January 2018).
  9. Kellner, E.; Hubbart, J.A. Confounded by forgotten legacies: Effectively managing watersheds in the contemporary age of unknown unknowns. Hydrol. Processes 2017, 31, 2802–2808. [Google Scholar] [CrossRef]
  10. Whitelaw, G.; Vaughan, H.; Craig, B.; Atkinson, D. Establishing the Canadian Community Monitoring Network. Environ. Monit. Assess. 2003, 88, 409–418. [Google Scholar] [CrossRef] [PubMed]
  11. Nare, L.; Love, D.; Hoko, Z. Involvement of stakeholders in the water quality monitoring and surveillance system: The case of Mzingwane Catchment, Zimbabwe. Phys. Chem. Earth 2006, 31, 707–712. [Google Scholar] [CrossRef]
  12. Choo-In, S.; Kasemsawat, S.; Sriwilai, J.; Kuanprasert, N. The Participation of Surface Water Quality Management, Amphawa District, SamutSongkhram, Thailand. Procedia Soc. Behav. Sci. 2015, 197, 1551–1557. [Google Scholar] [CrossRef]
  13. Deutsch, W.; Ruiz-Córdova, S. Trends, challenges, and responses of a 20-year, volunteer water monitoring program in Alabama. Ecol. Soc. 2015, 20, 14. [Google Scholar] [CrossRef]
  14. Franzén, F.; Hammer, M.; Balfors, B. Institutional development for stakeholder participation in local water management—An analysis of two Swedish catchments. Land Use Policy 2015, 43, 217–227. [Google Scholar] [CrossRef]
  15. Cohn, J. Citizen Science: Can Volunteers Do Real Research? BioScience 2008, 58, 192–197. [Google Scholar] [CrossRef]
  16. Savan, B.; Morgan, A.; Gore, C. Volunteer environmental monitoring and the role of the universities: The case of citizen’s watch. Environ. Manag. 2003, 31, 561–568. [Google Scholar] [CrossRef]
  17. Conrad, C.; Daoust, T. Community-based monitoring frameworks: Increasing the effectiveness of environmental stewardship. Environ. Manag. 2008, 41, 356–358. [Google Scholar] [CrossRef] [PubMed]
  18. Dickinson, J.L.; Shirk, J.; Bonter, D.; Bonney, R.; Crain, R.L.; Martin, J.; Phillips, T.; Purcell, K. The current state of citizen science as a tool for ecological research and public engagement. Front. Ecol. Environ. 2012, 10, 291–297. [Google Scholar] [CrossRef]
  19. Flores-Díaz, A.; Ramos Escobedo, M.; Ruiz Córdova, S.; Manson, R.; Aranda, E.; Deutsch, W. Monitoreo comunitario del agua: Retos y perspectiva de Global Water Watch México. In Proceedings of the Mexican Congress on Hydrographic Basins, Xalapa, Mexico, 27 August 2013; pp. VIII3–VIII15. [Google Scholar]
  20. Storey, R.G.; Wright-Stow, A.; Kin, E.; Davies-Colley, R.; Stott, R. Volunteer stream monitoring: Do the data quality and monitoring experience support increased community involvement in freshwater decision making? Ecol. Soc. 2016, 21, 32. [Google Scholar] [CrossRef]
  21. Hage, M.; Leroy, P.; Petersen, A.C. Stakeholder participation in environmental knowledge production. Futures 2010, 42, 254–264. [Google Scholar] [CrossRef]
  22. Follett, R.; Strezov, V. An Analysis of Citizen Science Based Research: Usage and Publication Patterns. PLoS ONE 2015, 10, e0143687. [Google Scholar] [CrossRef] [PubMed]
  23. Roux, D.J.; Rogers, K.H.; Biggs, H.C.; Ashton, P.J.; Sergeant, A. Bridging the science–management divide: Moving from unidirectional knowledge transfer to knowledge interfacing and sharing. Ecol. Soc. 2006, 11, 4. [Google Scholar] [CrossRef]
  24. Deutsch, W.; Reutebuch, E.; Ruiz-Córdova, S. Validity and applications of citizen volunteer water/quality data: A case from Alabama. Water Resour. IMPACT 2007, 9, 16–20. [Google Scholar]
  25. Berkes, F. Evolution of co-management: Role of knowledge generation, bridging organizations and social learning. J. Environ. Manag. 2009, 90, 1692–1702. [Google Scholar] [CrossRef] [PubMed]
  26. Deutsch, W.; Ruiz-Córdova, S.; Duncan, B.L. (Eds.) Community-Based Water Monitoring: A Practical Model for Global Watershed Stewardship; Global Water Watch Program, Auburn University: Auburn, AL, USA, 2010. [Google Scholar]
  27. Van Steenbergen, F. Promoting local management in groundwater. Hydrogeol. J. 2006, 14, 380–391. [Google Scholar] [CrossRef]
  28. Garda, C.; Castleden, H.; Conrad, C. Monitoring, Restoration, and Source Water Protection: Canadian Community-Based Environmental Organizations’ Efforts towards Improving Aquatic Ecosystem Health. Water 2017, 9, 212. [Google Scholar] [CrossRef]
  29. Maheshwari, B.; Varua, M.; Ward, J.; Packham, R.; Chinnasamy, P.; Dashora, Y.; Dave, S.; Soni, P.; Dillon, P.; Purohit, R.; et al. The role of transdisciplinary approach and community participation in village scale groundwater management: Insights from Gujarat and Rajasthan, India. Water 2014, 6, 3386–3408. [Google Scholar] [CrossRef]
  30. McCall, M.K.; Chutz, N.; Skutsch, M. Moving from measuring, reporting, verification (mrv) of forest carbon to community mapping, measuring, monitoring (mmm): Perspectives from Mexico. PLoS ONE 2016, 11, 1–22. [Google Scholar] [CrossRef] [PubMed]
  31. Kacupu, N. Community-Based Research in Generating Usable Knowledge for Public Policy and Administration. Adm. Soc. 2016, 48, 683–710. [Google Scholar] [CrossRef]
  32. Lemos, M.C. Usable climate knowledge for adaptive and co-managed water governance. Curr. Opin. Environ. Sustain. 2015, 12, 48–52. [Google Scholar] [CrossRef]
  33. Virji, H.; Padgham, J.; Seipt, C. Capacity building to support knowledge systems for resilient development—Approaches, actions, and needs. Curr. Opin. Environ. Sustain. 2012, 4, 1–7. [Google Scholar] [CrossRef]
  34. Wilson, N.J.; Mutter, E.; Inkster, J.; Satterfield, T. Community-Based Monitoring as the practice of Indigenous governance: A case study of Indigenous-led water quality monitoring in the Yukon River Basin. J. Environ. Manag. 2018, 210, 290–298. [Google Scholar] [CrossRef]
  35. Ramírez, M.I.; Miranda, R.; Zubieta, R.; Jiménez, M. Land cover and road network map for the Monarch Butterfly Biosphere Reserve in Mexico 2003. J. Maps 2006, 3, 181–190. [Google Scholar] [CrossRef]
  36. Strahm, W.; Rao, K. Report on the Mission to the Monarch Butterfly Biosphere Reserve (Mexico) from 10/14 January, 2011. International Union for the Conservation of Nature. UNESCO World Heritage Centre. Available online: whc.unesco.org/en/list/1290/documents/ (accessed on 10 January 2018).
  37. Deutsch, W.; Busby, A.L. Alabama Water Watch Quality Assurance Plan for Bacteriological Monitoring. Alabama Water Watch, Auburn University, USA. 1999. Available online: aww.auburn.edu/Docs/manuals/QABacManual99.pdf (accessed on 10 January 2018).
  38. Deutsch, W.; Estridge, R.E. Alabama Water Watch Quality Assurance Plan for Chemical Monitoring; Auburn University: Auburn, AL, USA, 2004; 37p, Available online: aww.auburn.edu/Docs/manuals/QACheManual04.pdf (accessed on 10 January 2018).
  39. Dinius, S.H. Design of an Index of Water Quality. J. Am. Water Resour. Assoc. 1987, 23, 833–843. [Google Scholar] [CrossRef]
  40. Mexican Official Norm NOM-127-SSA1-1994. Environmental Health, Water for Use and Human Consumption. Permitted Limits of Quality and Purification Treatments. Updated: October 2000. Available online: www.salud.gob.mx/unidades/cdi/nom/m127ssa14.html (accessed on 10 January 2018).
  41. Mexican Official Norm NOM-001-CONAGUA-2011. Drinking Water Systems, Household and Sanitary Sewerage—Hermeticness—Specifications and Test Methods. Updated: February 2012. Available online: dof.gob.mx/nota_detalle.php?codigo=5234380&fecha=17/02/2012 (accessed on 10 January 2018).
  42. Verbesselt, J.; Hyndman, R.; Zeileis, A.; Culvenor, D. Phenological change detection while accounting for abrupt and gradual trends in satellite image time series. Remote Sens. Environ. 2010, 114, 2970–2980. [Google Scholar] [CrossRef]
  43. Verbesselt, J.; Hyndman, R.; Newnham, G.; Culvenor, D. Detecting trend and seasonal changes in satellite image time series. Remote Sens. Environ. 2010, 114, 106–115. [Google Scholar] [CrossRef]
  44. R Project. Available online: www.r-project.org/ (accessed on 30 November 2017).
  45. Eggleston, W. Impact of Sediment Resuspension Events on the Availability of Heavy Metals in Freshwater Sediments. Master’s Thesis, University of Michigan, Ann Arbor, MI, USA, 2012. [Google Scholar]
  46. Naiman, R.; Decamps, H.; McClain, M. Riparia. Ecology, Conservation and Management of Streamside Communities; Elsevier: Singapore, 2005; ISBN 0-12-663315-0. [Google Scholar]
  47. Roa, C.E.; Brown, S. Assessing water use and quality through youth participatory research in a rural Andean watershed. J. Environ. Manag. 2009, 90, 3040–3047. [Google Scholar] [CrossRef]
  48. Mountjoy, N.J.; Whiles, M.R.; Spyreas, G.; Lovvorn, J.R.; Seekamp, E. Assessing the efficacy of community-based natural resource management planning with a multi-watershed approach. Biol. Conserv. 2016, 201, 120–128. [Google Scholar] [CrossRef]
  49. Peters, N.E.; Meybeck, M. Water Quality Degradation Effects on Freshwater Availability: Impacts of Human Activities. Water Int. 2000, 25, 185–193. [Google Scholar] [CrossRef]
  50. Maass, M.; Cotler, H. El protocolo para el manejo de ecosistemas en cuencas hidrográficas. In El Manejo de Cuencas en México: Estudios y Reflexiones para Orientar la Política Ambiental, 2nd ed.; Cotler, H., Ed.; Natural Resources and Environment Secretary: Mexico City, Mexico, 2007; pp. 41–58. ISBN 978-968-817-861-4. [Google Scholar]
  51. Boelens, R.; Hoogesteger, J.; Swyngedouw, E.; Vos, J.; Wester, P. Hydrosocial territories: A political ecology perspective. Water Int. 2016, 41, 1–14. [Google Scholar] [CrossRef]
  52. Wilson, N. Indigenous water governance: Insights from the hydrosocial relations of the Koyukon Athabascan village of Ruby, Alaska. Geoforum 2015, 57, 1–11. [Google Scholar] [CrossRef]
  53. World Health Organization. World Health Statistics: Monitoring health for the Sustainable Development Goals. 2016. Available online: www.who.int/gho/publications/world_health_statistics/2016/en/ (accessed on 10 January 2018).
  54. McKay, A.J.; Johnson, C.J. Confronting barriers and recognizing opportunities: Developing effective community-based environmental monitoring programs to meet the needs of Aboriginal communities. Environ. Impact Assess. 2017, 64, 16–25. [Google Scholar] [CrossRef]
  55. Norgaard, R. The implication of interdisciplinary scientific assessments for environmental governance. In Policies for Sustainable Governance of Global Ecosystem Services; Ranganatha, J., Munasinghe, M., Irwin, F., Eds.; Edward Elgar: Cheltenham, UK, 2008; ISBN 978-1-84720-244-4. [Google Scholar]
  56. Mauser, W.; Klepper, G.; Rice, M.; Schmalzbauer, B.S.; Hackmann, H.; Moore, H. Transdisciplinary global change research: The co-creation of knowledge for sustainability. Curr. Opin. Environ. Sustain. 2013, 5, 420–431. [Google Scholar] [CrossRef] [Green Version]
  57. McKinley, D.C.; Miller-Rushing, A.J.; Ballard, H.L.; Bonney, R.; Brown, H.; Cook-Patton, S.C.; Evanse, D.M.; Frenchf, R.A.; Parrishg, J.K.; Ryan, S.F. Citizen science can improve conservation science, natural resource management, and environmental protection. Biol. Conserv. 2017, 208, 15–28. [Google Scholar] [CrossRef]
  58. Hophmayer-Tokich, S.; Krozer, Y. Public participation in rural area water management: Experiences from the North Sea countries in Europe. Water Int. 2008, 33, 243–257. [Google Scholar] [CrossRef]
  59. Burgos, A.; Páez, R.; Carmona, E. A systems approach to modeling Community-Based Environmental Monitoring: A case of participatory water quality monitoring in rural Mexico. Environ. Monit. Assess. 2013, 185, 10297. [Google Scholar] [CrossRef] [PubMed]
  60. Ibrahim, S.H. Sustainability Assessment of Community-Based Water Supply Multivariate Analysis. J. Water Sustain. 2017, 7, 1–16. [Google Scholar] [CrossRef]
  61. Hiwasaki, L.; Arico, S. Integrating the social sciences into ecohydrology: Facilitating an interdisciplinary approach to solve issues surrounding water, environment and people. Ecohydrol. Hydrobiol. 2007, 7, 3–9. [Google Scholar] [CrossRef]
  62. Clark, W.; van Kerkhoff, L.; Lenel, L.; Gallopín, G. Crafting usable knowledge for sustainable development. Proc. Natl. Acad. Sci. USA 2016, 113, 4570–4578. [Google Scholar] [CrossRef] [PubMed]
Figure 1. Community-based water monitoring sites in the San Juan Zitácuaro (SJZ) and Cachiví (CAV) sub-basins, at the Monarch Butterfly Biosphere Reserve (MBBR), Mexico. Settlements of more than 5000 inhabitants and fluvial networks are shown over a digital elevation model (DEM).
Water 10 00542 g001
Figure 2. Water quality index (WQI) of San Juan Zitácuaro (SJZ), and Cachiví (CAV) monitoring sites. Vertical dashed lines are water-quality categories, indicated at the x-axis: a, Excellent; b, Good; c, Fair; and d, Poor. Boxes indicate first to third quartile, and grayscale indicates monitoring reasons: (i) safety for drinking; (ii) domestic use and recreation; (iii) habitat for biodiversity; (iv) fluvial conditions downstream of settlements; and (v) fluvial conditions at the border between buffer and core zone of the protected area. Data obtained by the Community-Based Water Monitoring Network of the Monarch Butterfly Biosphere Reserve.
Water 10 00542 g002
Figure 3. Seasonal variation (p < 0.05) in water quality in the SJZ and CAV sub-basins, obtained by the community-based water monitoring network at Monarch Butterfly Biosphere Reserve (2011–2017). Parameters: alkalinity (Alk), dissolved oxygen (DO), Escherichia coli (Eco), hardness (Har), oxygen saturation (Osa), turbidity (Tur), and water temperature (Wt). Monitoring reasons: (i) safety for drinking; (ii) domestic use and recreation; (iii) habitat for biodiversity; (iv) fluvial conditions downstream of settlements; and (v) fluvial conditions at the border between buffer and core zone of the protected area. Site numbers refer to Table 1.
Water 10 00542 g003
Figure 4. Warnings detected by the Community-Based Water-Monitoring Network at the monitored sites for springs and streams of San Juan Zitácuaro (SJZ) and Cachiví (CAV) sub-basins (site numbers refer to Table 1).
Water 10 00542 g004
Table 1. Monitoring sites of the Community-Based Water Monitoring Network of the Monarch Butterfly Biosphere Reserve.
Sub-BasinEjido or Indigenous CommunityIDSiteMonitoring Reason 1
San Juan ZitácuaroFrancisco Serrato1XorejéDrink
Francisco Serrato2TamejéDownstream
Carpinteros3El AguacateDrink
Carpinteros4LomitaDrink
Carpinteros5Agua de BenitaDrink
Carpinteros6La MinaDrink
Donaciano Ojeda7Manantial 1a ManzanaDrink
Donaciano Ojeda8La SegunditaDownstream
Crescencio Morales9RemunrrejéDrink
Crescencio Morales10La EntradaDrink
San Juan Zitácuaro community11Ojo de AguaDrink
Curungueo12BorbollonesDomestic
Curungueo13La CapillaDrink
Curungueo14Ojo de Agua 1Drink
Curungueo15Ojo de Agua 2Drink
Curungueo16Arroyo Casa Grande 1Drink
Curungueo17Arroyo Casa Grande 2Downstream
San Felipe los Alzati18Ojo de Agua centroDomestic
San Felipe los Alzati19La PresaDrink
San Felipe los Alzati20Rio ObscuroDownstream
San Felipe los Alzati21Palo AmargosoDomestic
CachivíSenguio22El SaltoDomestic
Senguio23Agua Caliente—ZapateroBorder
Senguio24Los FiltrosDomestic
Chincua25Los TubosDomestic
El Calabozo26Los Ailes—TejónDownstream
Cerro Prieto27Villalobos Poza 1Biodiversity
Cerro Prieto28Villalobos Poza 8Biodiversity
Cerro Prieto29Establo Poza 6Biodiversity
Cerro Prieto30Establo Poza 8Biodiversity
1 Monitoring reasons: (Drink) safety for drinking; (Domestic) domestic use and recreation; (Biodiversity) habitat for biodiversity; (Downstream) fluvial conditions downstream of settlements; and (Border) fluvial conditions at the border between buffer and core zones of the protected area.
Table 2. Parameters measured by the Community-Based Water Monitoring Network, Monarch Butterfly Biosphere Reserve, following the Data Quality Assurance Protocols [22,23].
ParameterUnitsPrecision (%)AccuracySensitivityRange
Water temperature°C80±1.00.50–100
Air temperature°C80±1.00.50–100
pH 80±1.00.53.5–10.0
Dissolved oxygenmg/L80±2.00.20.0–20.0
Total alkalinitymg/L80±10.05.00>
Total hardnessmg/L80±20.010.00>
TurbidityJTU80±10.05.00–200
Escherichia coliUFC/100 mL95±1.01.00–200

