Impacts of Land Use Change and Summer Monsoon on Nutrients and Sediment Exports from an Agricultural Catchment
by
 and
and
Kiyong Kim
1,*, 
Bomchul Kim
2,
Jaesung Eum
2,
Bumsuk Seo
2,
Christopher L. Shope
3 and
Stefan Peiffer
1 1
Department of Hydrology, University of Bayreuth, 95440 Bayreuth, Germany
2
Department of Environmental Science, Kangwon National University, Chuncheon 24341, Korea
3
Department of Environmental Quality, Division of Water Quality, Salt Lake City, UT 84116, USA
*
Author to whom correspondence should be addressed.
Water 2018, 10(5), 544; https://doi.org/10.3390/w10050544
Submission received: 5 April 2018
/
Revised: 16 April 2018
/
Accepted: 23 April 2018
/
Published: 24 April 2018
(This article belongs to the Section Water Quality and Contamination)
Abstract
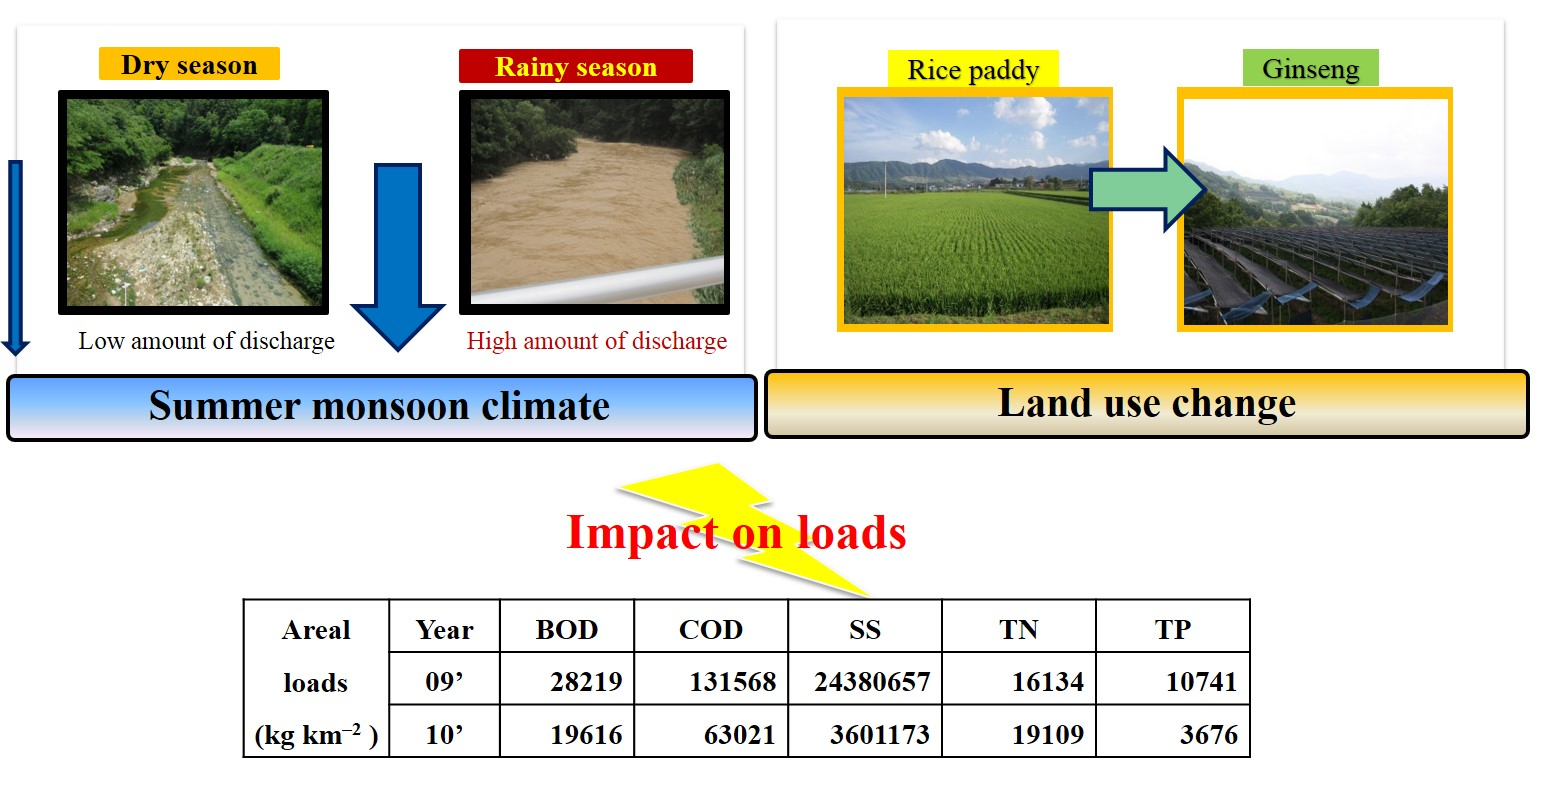
:Agricultural non-point source (NPS) pollution is a major concern for water quality management in the Soyang watershed in South Korea. Nutrients (phosphorus and nitrogen), organic matter, and sediment exports in streams were estimated in an agricultural catchment (Haean catchment) for two years. The stream water samples were taken in dry and rainy seasons to evaluate the effect of monsoonal rainfall on pollutants exports. The influence of land use changes on NPS pollution was assessed by conducting a land use census and comparing the NPS characteristic exports. Total phosphorus (TP), suspended solids (SS), biochemical oxygen demand (BOD), and chemical oxygen demand (COD) increased dramatically in rainy seasons. Land uses were changed during the study period. Dry fields and rice paddies have decreased distinctively while orchard (apple, grape, and peach) and ginseng crops showed an increase within the catchment. The TP and SS loading decreased in the streams in 2010 compared to the loading in 2009 while the BOD and NO3− did not show distinct significant change. In this study, monsoonal driven rainfalls increased exports of agricultural NPS pollutants into streams. Land use change (mostly crop and paddy fields to orchards and ginseng fields) remarkably mitigated TP and SS exports into the streams.

1. Introduction
Non-point source (NPS) pollution is the main cause of inland water deterioration and a priority issue for present water quality management worldwide [1,2]. NPS pollution is more difficult to control and to treat than pollution from point sources due to the complicated generation and formation [3,4] and concern for NPS pollution affecting lake water quality has continually increased [5,6]. Better understanding nitrogen (N) and phosphorus (P) transport from agricultural NPS to surface waters is a major focus of scientific research and environmental policy [7,8,9]. This is especially prevalent in agricultural areas where high amounts of N and P are the main NPS contamination factors into surface waters [10,11], which results in increased algal production and amplifies lake and reservoir eutrophication [12,13]. In South Korea, NPS pollution contributes to excessive sediment, nutrients, and organic matter in streams during the summer rainy season under monsoonal climate conditions. Studies conducted in monsoonal climate regions have shown that mountainous areas with intensive highland agriculture induce high nutrient (especially N and P) loading into rivers, particularly during the summer monsoonal conditions [14,15]. Soil erosion is greatly increased on high land agricultural areas with steep slopes in combination with intense rainfalls during rainy season [16]. High turbidity surface discharge due to large-scale soil erosion causes environmental deterioration that severely impacts aquatic ecosystems [17]. In recent years, studies have focused on finding practical and efficient agricultural practices that reduce agricultural NPS pollutant yields under the moniker of best management practices (BMPs) [18,19]. Efforts to identify the ideal BMPs are still in progress [20,21,22].
Among the ways to manage NPS pollution, land use change is regarded as one of the most efficient factors, by directly influencing hydrologic processes at the catchment-scale [23,24,25,26,27]. In general, land use change, such as dry field crops to orchard farms, can reduce soil erosion, which decreases fertilizer inputs and minimizes ecological disturbances in critical ecosystems.
In South Korea, the Ministry of Environment (MoE) has established comprehensive NPS pollution management measures for the four major rivers of the Han, the Nakdong, the Geum, the Yeongsan, and the Sumjin rivers since 2004. The MoE has also designated the Lake Soyang watershed, which includes our study catchment, as a special management area. These governmental policies and management directives have attempted to diminish turbidity levels in streams in South Korea. Consistent with these regulatory changes, the patterns in land use have been substantially altered in recent years, with the amount of land use for ginseng and orchard farming—that causes less soil deterioration compared to crop lands [28]—continuously increasing.
The goal of this study was to identify NPS locations and the extent of NPS pollution in an agricultural catchment with changing land use. We tried to assess the effect of exports from agricultural NPSs to streams in the catchment and attempted to evaluate the land use change impact on nutrients and sediment exports by comparing two years in which the land use significantly changed in the catchment. To achieve this goal, stream water quality of the Haean catchment, located in the Lake Soyang watershed and a hot spot of nutrients, sediments, and organic matter sources into the lake, was monitored for two years (2009–2010). Event mean concentrations (EMCs), biochemical oxygen demand (BOD), chemical oxygen demand (COD), suspended solids (SS), total nitrogen (TN), and total phosphorus (TP) loading were calculated to evaluate the water quality in streams influenced by NPS. Principal component analysis (PCA) was also used to determine the dominant factors contributing to NPS loading in the catchment. Furthermore, land use re-classification along the stream areas [29] was conducted to assess land use change effects to NPS exports into the streams in the catchment.
2. Materials and Methods
2.1. Land Use Map Survey
The land use data from a catchment-level census was used to evaluate the land use change for each stream watershed [29]. The land use data covers the whole catchment (61.52 km2) for three years (2009 to 2011) and includes both crop and non-crop areas. We reclassified the land use data according to a 11-class scheme (semi-natural, paddy, dry field, forest, inland water, urban, green house, barren, ginseng, orchard, un-surveyed land).
2.2. Study Site and Sampling Description
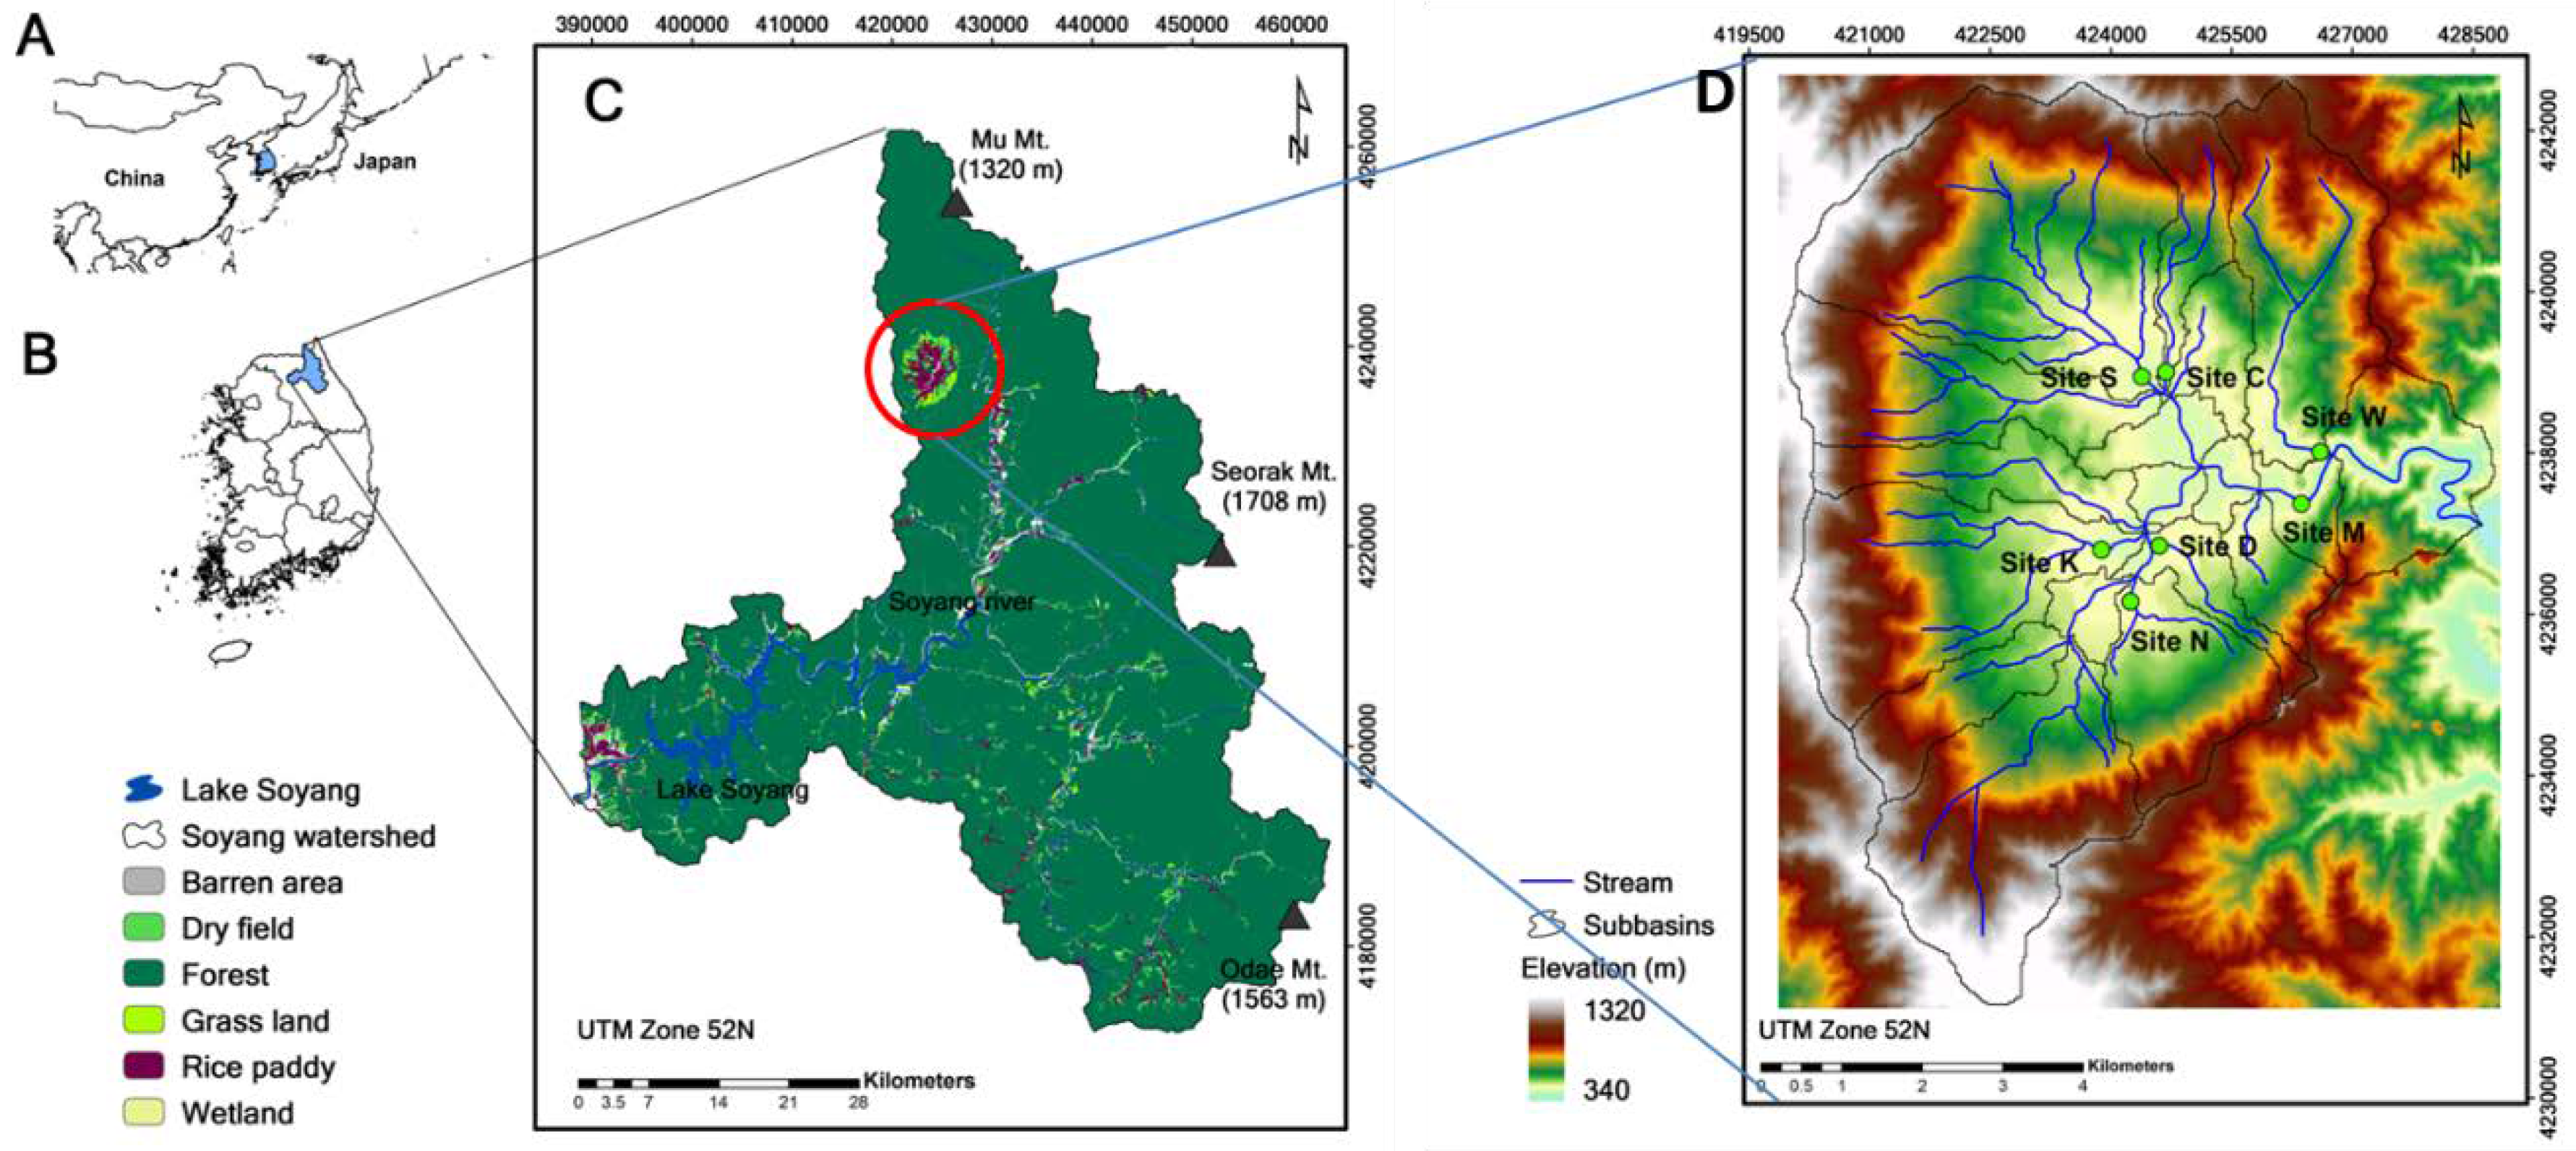
The study area encompasses the Haean catchment located in Yanggu County, Gangwon Province, South Korea. The catchment is bowl-shaped and locally known as the ‘punch-bowl’. It encompasses a mountainous headwater portion of the watershed of Lake Soyang, which supplies drinking water for the Seoul metropolitan area since construction in 1973 [30]. The elevation of the Haean catchment ranges from 339 to 1320 m (Figure 1) and the area is surrounded by high elevation Precambrian Gneiss complex while the low elevation central portion is a highly weathered Jurassic biotite granite intrusion [31].
The climate has a mean annual air temperature of 8.7 °C with winter temperatures as low as −27 °C and summer temperatures as high as 33 °C. The average annual precipitation determined by the Korea Meteorological Administration (KMA) is 1400 mm year−1 and over seventy percent of the annual precipitation falls during summer monsoon season, June to August, [32]. The catchment is largely forested, particularly at high elevations. The remaining area is comprised mostly of dry croplands and rice paddy agriculture [29]. An important land use in the region is highland agriculture, which cultivates crops (potato, radish, and cabbage) in steep slopes and the dominant nutrient sources are artificial fertilizers and livestock manure applications to cropland in the Haean catchment [33]. Highland agriculture in the Lake Soyang watershed has been shown to cause increases in soil erosion and nutrient loading into streams from nonpoint sources (NPSs) such as the overuse of organic fertilizers, resulting in turbid water [34]. The Haean catchment headwaters are one of the most problematic turbid water sources to Lake Soyang.
Seven streams were selected for water quality monitoring (Figure 1) including: Naedong (Site N), Dunjunggol (Site D), Kunjigol (Site K), Sunghwang (Site S), Wolsan (Site W), Chungryongangol (Site C), which flow to the Mandae stream (Site M), an outlet of the Haean catchment continuing toward Inbuk stream and the Soyang River flowing into Lake Soyang. Water samples were collected at each site during rainfall periods and bi-monthly during dry conditions from June to December in 2009 and monthly in 2010. For 11 individual storm events (four times in 2009 and seven times in 2010, respectively), at least 10 water samples were collected for each rainfall event (Table 1).
However, samples were not collected at Site D during the second storm event due to inaccessibility as a function of massive mudslides. Surface discharge data were also collected at each of the sites. We used a published data set for the concentrations of TP, TN, and SS at Site M [35]. Hourly precipitation data during study period were obtained from the KMA.
2.3. Laboratory Analyses
All water samples were stored in cool conditions (<4 °C) and acidified prior to laboratory analysis. Water samples were filtered through Whatman GF/C glass fiber filters (pore size 1.0 µm) to measure the concentrations of SS and dissolved N and P. Unfiltered water samples were analyzed for TP and TN and were preserved by acidifying with H2SO4 to pH < 2. TP was analyzed using the ascorbic acid method after persulfate digestion. TN was measured using the cadmium reduction method after digestion with potassium persulfate. BOD was calculated by determining the difference in dissolved oxygen (DO) concentration between in-situ conditions and after five days of incubation at 20 °C using a DO meter (YSI 58 Dissolved Oxygen Meter, Yellow Springs, OH, USA, YSI incorporated). The KMnO4 method was used for COD analysis. Turbidity was measured using a nephelometer (Hach). All of the analysis methods for water samples were completed according to references in Standard Methods 20th Ed. [36]. We used an electronic flow meter (Flo-MateTM 2000 Flow Meter, Frederick, MD, USA, Marsh-MacBirney) to estimate discharge with the velocity-area method, which is commonly used to measure discharge in open channels [37]. Using this method, the flow velocity and cross sectional area are measured separately for each stream in the catchment [38]. Stream discharge during both rainy and dry conditions were measured at least 10 times at each of the stream monitoring locations and rating curves were developed to describe the relationship between discharge and water level for each stream. When water samples were collected at each monitoring location, discharge was estimated using a stage/discharge rating curve.
Detailed description and equations about flow measurement method are shown below (Equations (1) and (2)).
2.4. Calculation for Discharges, Event Mean Concentration (EMC), and Pollutant Loading
2.4.1. Surface Water Discharge
Equation (1)
where Wi is the distance to measurement points along the transect, Vi is stream velocity, Hi is water depth and i is the subarea dimension, which is typically 20–25 measurements across the stream width.
Equation (2)
where Vi is stream velocity and Ai is the integrated stream area.
2.4.2. EMC (Event Mean Concentration)
Pollutant export equations or EMC values are fundamental and effective approaches used in water quality assessment for examining changes in stream chemistry during rainfall events [39]. EMC is the total loading divided by the total discharge volume for a storm event. EMC is defined as
Equation (3)
where C(t) and Q(t) are the concentration of a solute and runoff measured during a storm event, M is the mass and V is the discharge volume, respectively. The EMC results in a flow-weighted average and does not simply represent a time average of the solute concentration.
2.4.3. Constituent Loading
Loading of nutrients to receiving waters is estimated by the product of EMC and surface water discharge. The EMC values are expressed as milligrams per liter (mg L−1) and can be used to calculate the pollutant load. Annual mean loading of pollutants was estimated as the total loading multiplied by the ratio of annual rainfall to total rain fall for the storm event. The annual total load of pollutants per area (km2) for each sub-catchment was estimated as the annual total loading divided by area of each catchment.
2.4.4. Principal Component Analysis (PCA)
PCA analysis was used to identify major factors contributing to NPS pollution in the catchment. We analyzed the EMC data of TP, TN, NO3−, BOD, COD, SS, and rainfall related factors (rainfall intensity (RI), rainfall amount (RA), and stream discharge) as explanatory variables. The PCA analysis produces a new variable set including information on the water quality data set. The analysis provides the principal components, their eigenvalues and the proportions of the explained variances by them. If eigenvalues are higher than one, we considered the corresponding components as significant. Note that we centered and normalized the explanatory variables before the PCA analysis was carried out.
3. Results
3.1. Precipitation Variations
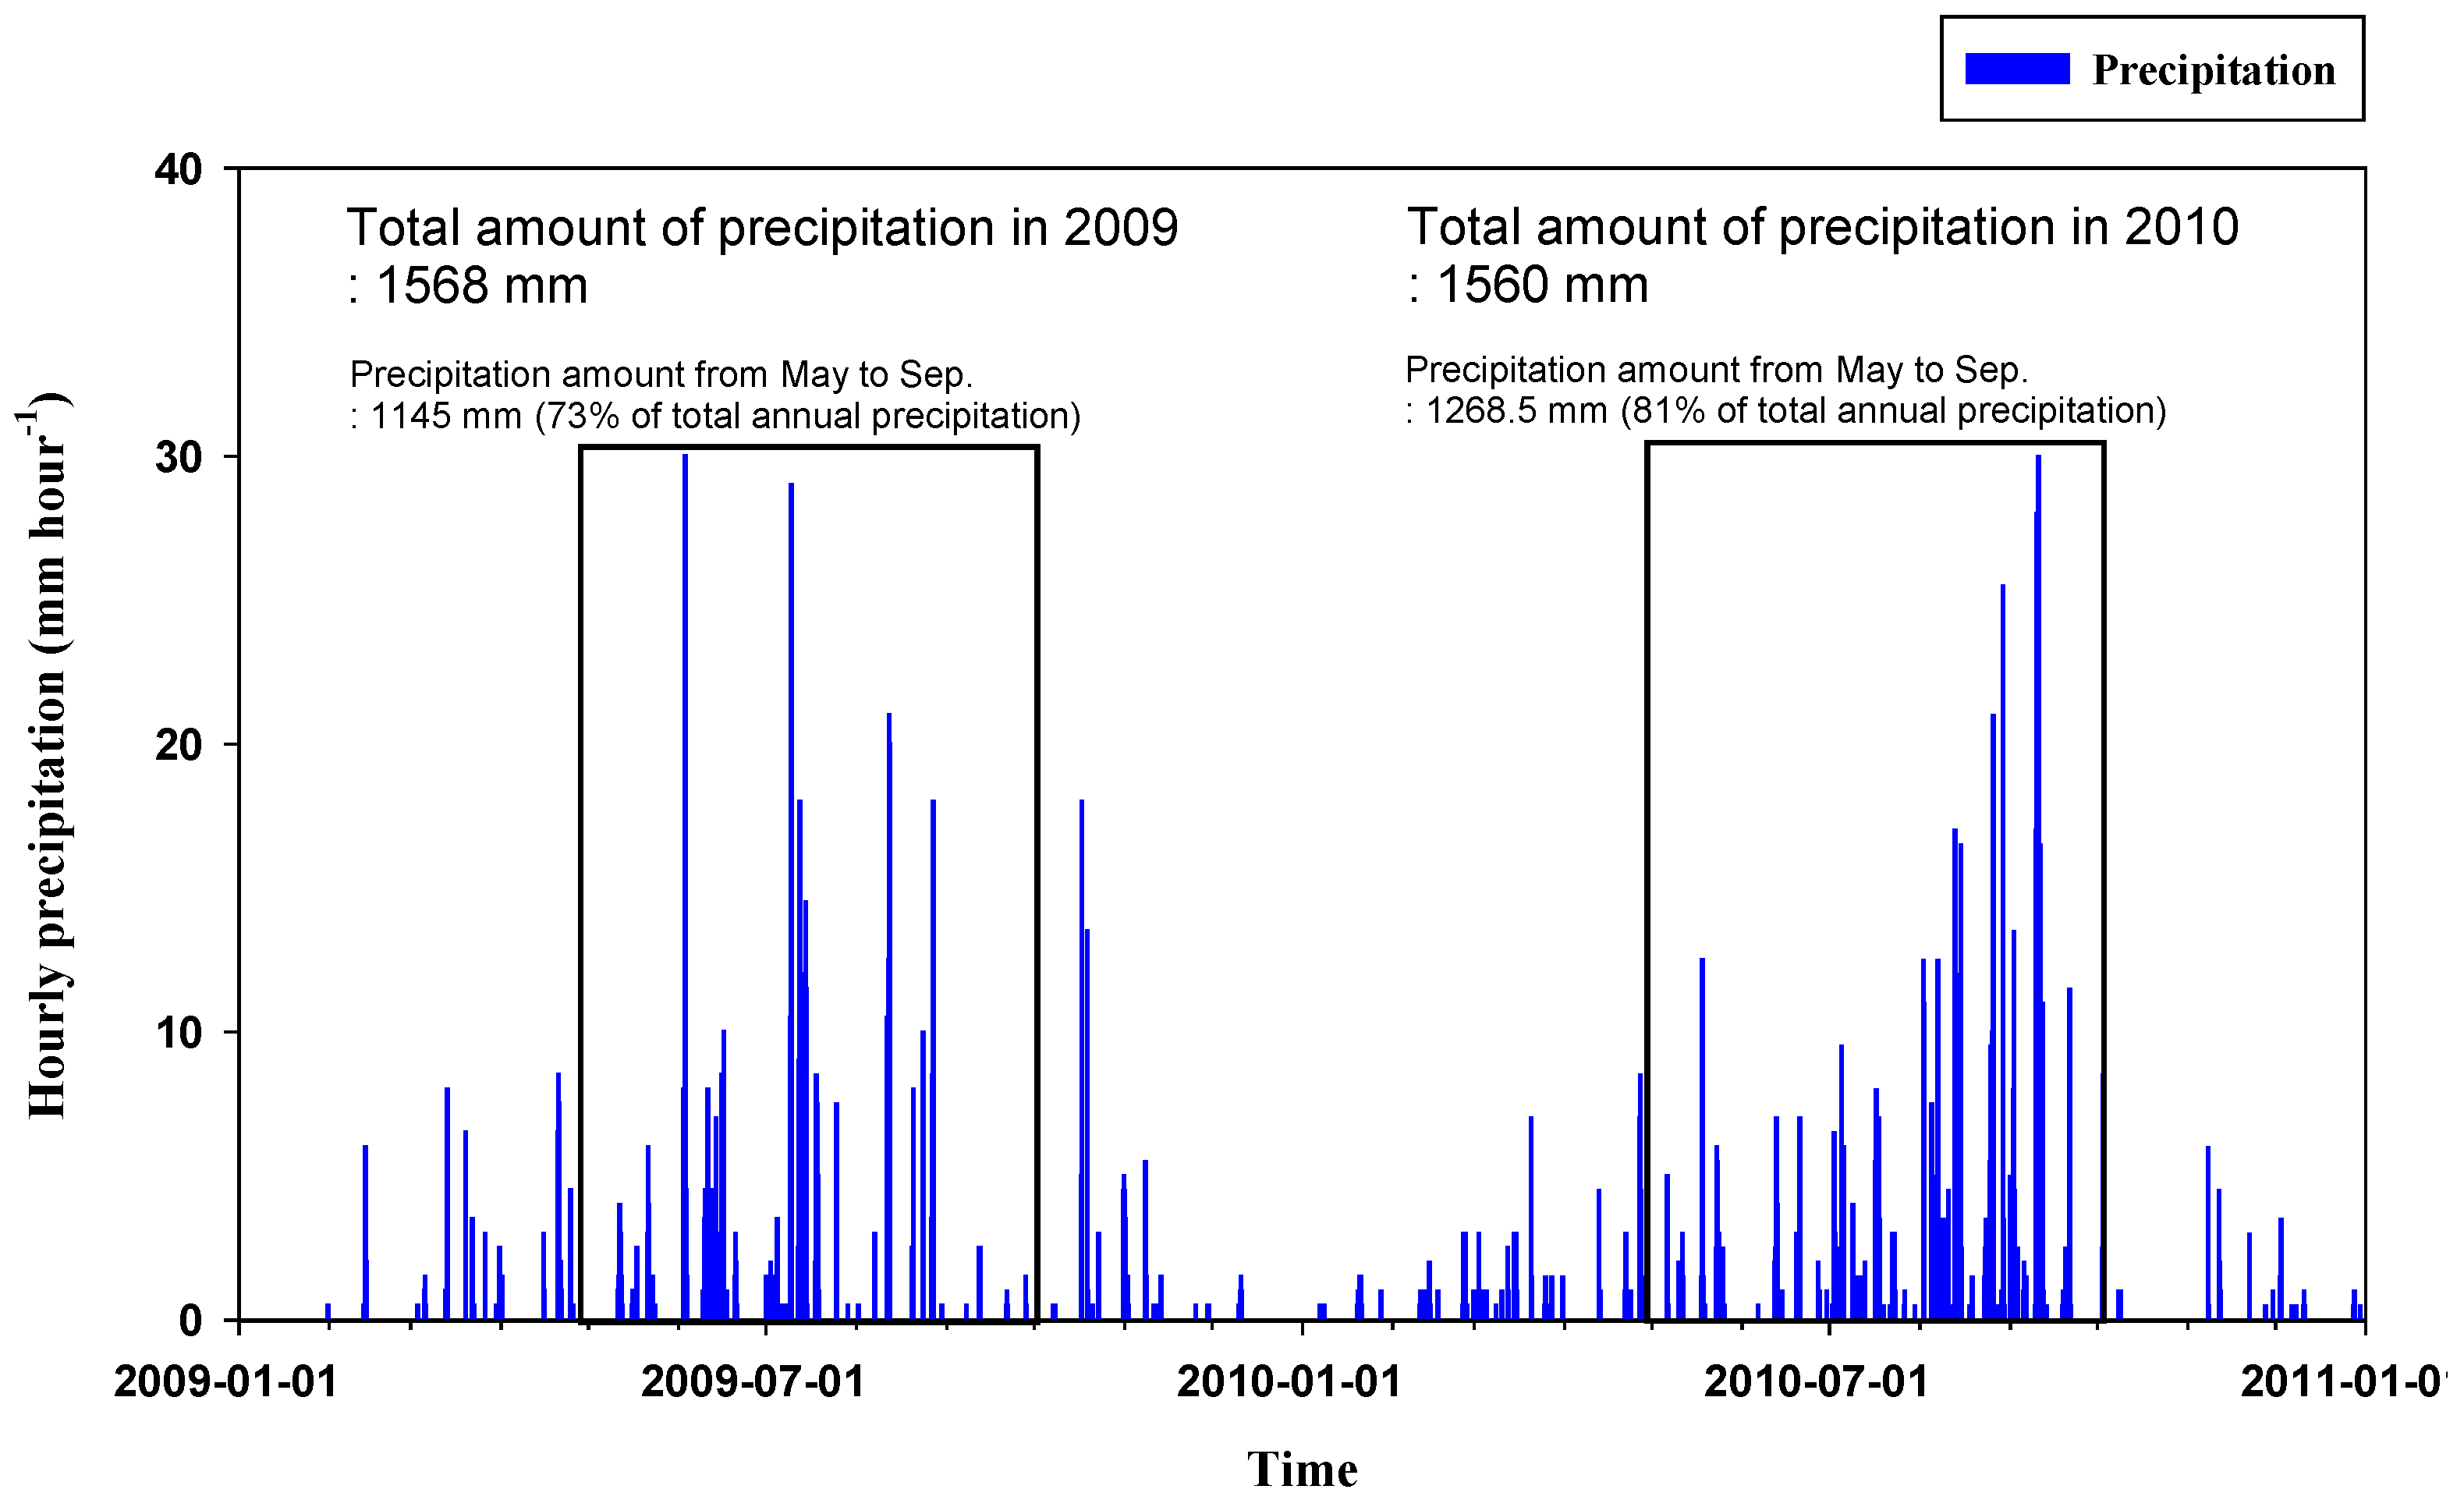
More than half of the annual precipitation is concentrated in the summer season (May to September) based on 10 years of data (2002–2011) within the Haean catchment. In both study years (2009–2010), over 70% of annual precipitation amount occurred during each of the summer monsoon seasons (73% in 2009 and 81% in 2010, respectively; Figure 2).
The maximum intensity was 9.5 mm h−1 during the 4th rain event in 2009 and overall, the intensity was stronger and the volume of rainfall for each event was greater in 2009 relative to 2010 (Table 1). In case of the 2nd event in 2009 and the 10th event in 2010, the intensities and the amounts of precipitation between the two events were similar (2.7 mm h−1 with total 118.0 mm for the 2nd event and 2.7 mm h−1 with total 117.0 mm for the 10th event, respectively; Table 1).
3.2. Land Use Changes
For the two years between 2009 and 2010, significant land use changes occurred in dry fields (mostly white radish and potato), rice paddy fields, orchards (mostly apple, grape, and peach), and ginseng crops throughout the catchment (Table 2).
Dry and rice paddy fields decreased from 16.97% (10.67 km2) to 12.65% (7.95 km2) and from 8.71% (5.47 km2) to 8.24% (5.18 km2), respectively. In contrast, more profitable orchards and ginseng farms increased from 0.32% (0.20 km2) to 1.51% (0.95 km2) and from 0.79% (0.49 km2) to 2.57% (1.59 km2), respectively in the catchment for the same two years (Table 2). Semi natural (e.g., fallow field) also increased in the catchment from 11.53% (7.24 km2) to 14.43% (9.07 km2). Previous studies have shown [30] that the spatial footprint of ginseng farming has increased the most from 0.69% (0.03 km2) to 9.16% (0.36 km2) of the watershed in the region of Site N, among all of the watersheds of the study streams. Orchards also increased from 0.01% to 0.82% in the same watershed (Table 2).
3.3. Variations of Water Quality Parameters
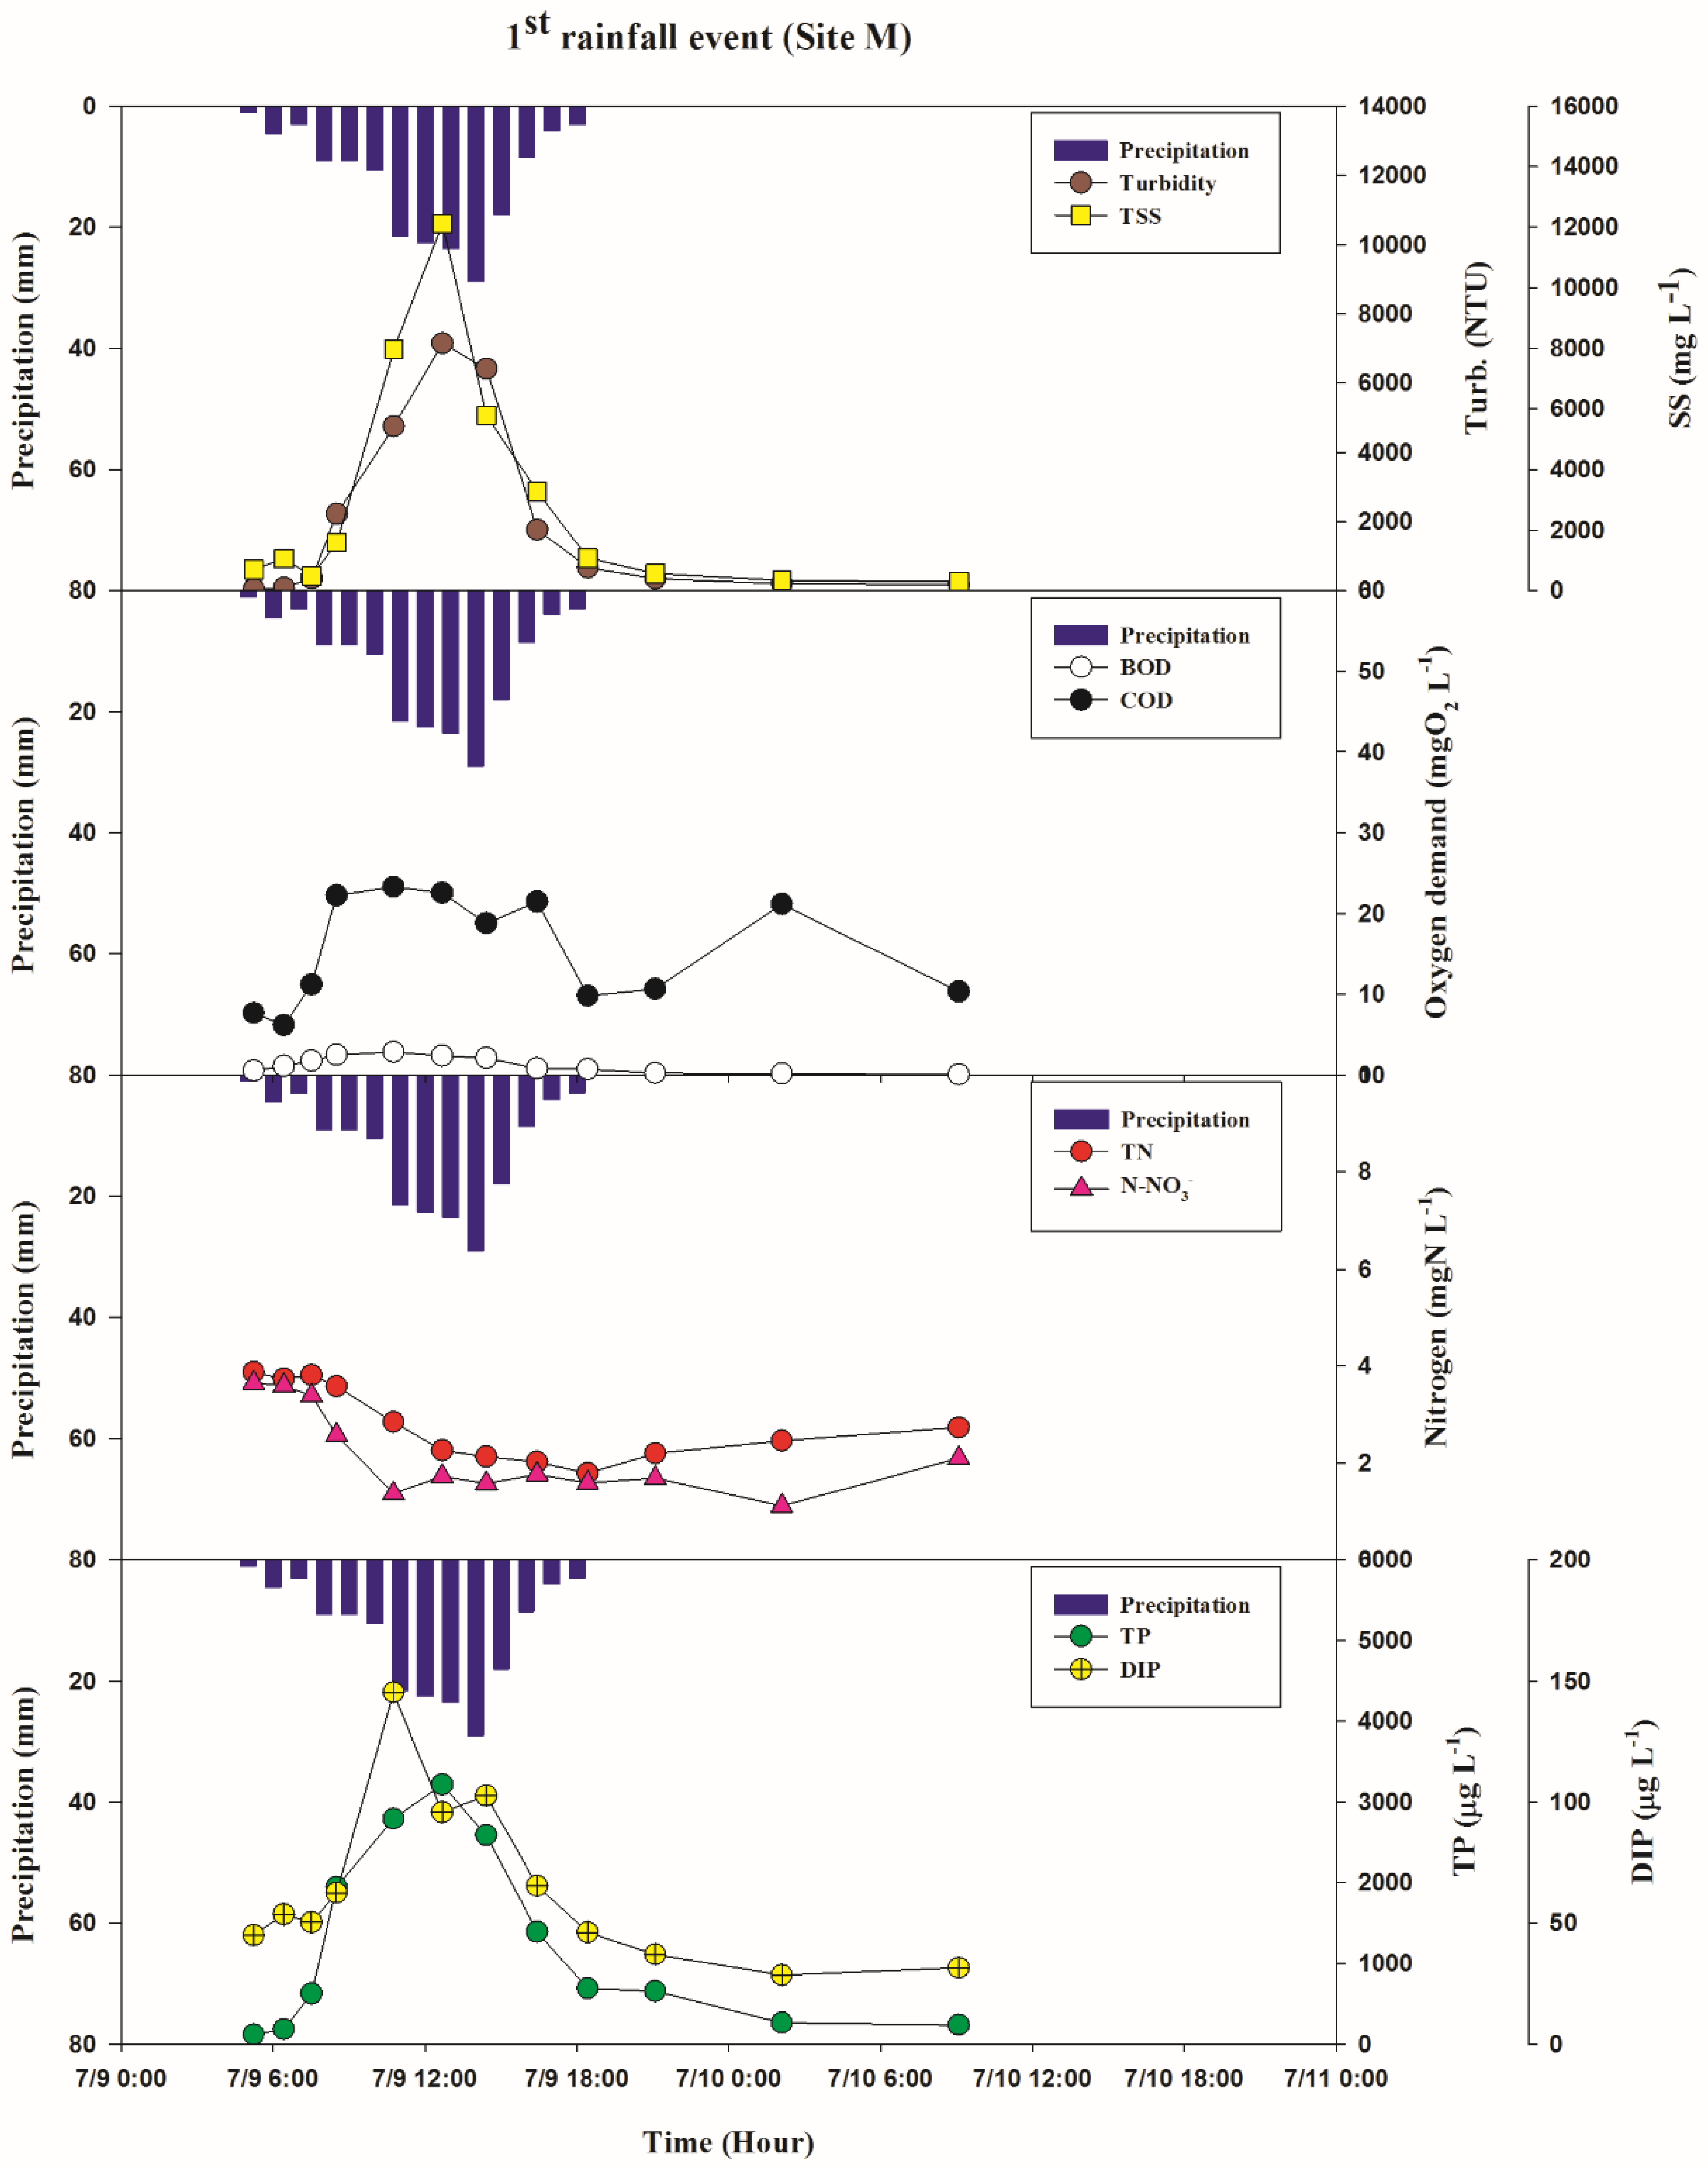
During the dry (non-monsoon) period, no significant variations of TN, NO3−, and BOD were evident in either of the years, whereas TP and SS varied widely at all of the sampling sites. At Site N, the average values of TN, NO3− and BOD were 5.1 (±0.7, n = 44), 4.5 (±0.6, n = 41) and 1.0 (±0.6, n = 48), respectively while the annual averages of SS and TP were 84.2 (±302.1, n = 48) and 78.1 (±125.2, n = 47) with wider ranges of changes during dry period. Throughout the rainy season, the concentrations of pollutants varied during all of the rainfall events. For the first precipitation event in 2009, the average concentrations of SS, TN, and TP at Site M (the outlet of the Haean catchment) were 2934 (range 288–12,115) mg L−1, 2.8 (range 1.8–3.9) mgN L−1, and 1.2 (range 0.1–3.2) mgP L−1, respectively (Figure 3).
The average concentrations of BOD and COD were 1.3 (range 0.1–2.9) mgO2 L−1 and 15.4 (range 6.2–23.3) mgO2 L−1, respectively during the same event (Figure 3). Similar variations were found at Site N, in which the average concentrations of SS, TN, and TP were 3187 (range 400–11,440) mg L−1, 2.9 (range 1.6–4.5) mgN L−1, and 1.4 (range 0.4–3.2) mgP L−1 for the same event, respectively. The other studied streams showed similar patterns of concentrations for most of the parameters with the exception of TP, which remained below 2 mgP L−1 at the other sites. The maximum concentration of SS at Site K was 18,150 mg L−1 for the first rain event and was the highest concentration of SS among the measured SS concentrations in all of the study streams in the catchment in 2009. The average TP concentration for the first rain event at the Site W was 0.9 mgP L−1, which is the lowest concentration for the event in 2009. For the fourth event in 2009, the average concentrations of SS, TN, and TP peaked in all of the streams, with the exception of Site W. The fifth rainfall event with the most intense precipitation caused the maximum average concentrations of the SS, TN, and TP, as well as BOD and COD at all study sites in 2010. The patterns of variations for the each parameter showed similar variations during storm events between 2009 and 2010. Notably, TP, SS, and turbidity increased with increasing discharge and steadily decreased after rainfall cessation for both 2009 and 2010 years. However the variation in patterns of N concentrations (TN and NO3−) differed during each event and no consistent patterns were observed for either of the years.
3.4. EMC and Pollutant Loading
3.4.1. EMC (Event Mean Concentration)
The EMCs of SS, TN, and TP at Site M were 3804 mg L−1, 3.4 mgN L−1, and 1.6 mgP L−1, respectively for the fourth rain event in 2009 (Table 3).
The EMC of SS was higher at each of the study sites during the 4th storm event relative to the other rain events in 2009. At Site K, the highest EMC of SS (8763 mg L−1) was recorded for the fourth rain event in 2009. At site S, which has a greater watershed area than the other sites, the EMC of SS (2971 mg L−1) was lower than the smaller streams, in which the EMCs of SS were 3787 mg L−1 at Site D and 4872 mg L−1 at Site C, respectively, for the fourth event. The EMCs of TN (2.5 mgN L−1) and TP (1.6 mgP L−1) were lower at Site W than the EMCs of TN and TP at site K (3.5 mgN L−1 and 2.5 mgP L−1, respectively) with similar watershed area for the same event. The EMC of BOD was highest at all study sites for the first rainfall event (5th rain event) in 2010. The EMC of BOD at site M was 9.8 mgO2 L−1 at the same time. Comparing the results of EMCs between all of the stream sites between 2009 and 2010, EMCs of SS and TP remained lower at all sites in 2010 while EMCs of TN, BOD increased over the two consecutive years. Of particular importance, an average EMC of SS at all of the streams drastically plunged in 2010, compared to the average EMC of SS in 2009 (Table 3).
3.4.2. Areal Pollutant Loading Throughout Stream Watersheds in the Catchment
Overall, the total areal loads of SS and TP in 2009 were higher relative to 2010 (Table 4). The areal loads of SS and TP at Site M were 1,148,377 kg km−2 and 558 kgP km−2, respectively in 2009 and 169,526 kg km−2 and 209 kgP km−2, respectively in 2010. The total loads of SS and TP at Site D were the lowest among the study sites with total SS and TP loads of 762,641 kg km−2 and 379 kgP km−2, respectively, in 2009 and 138,284 kg km−2 and 157 kgP km−2 respectively in 2010. Site K transported the most SS, N, and P into Site M among all of the streams in the catchment. The loads of SS, TN, and TP were lower at Site W than the amount of loads at Site N, although the area of Site W watershed was bigger than the watershed area of Site N. The calculated annual load per total watershed area, based on the rainfall ratio between the two years indicated that loads of all parameters were higher in 2009 than in 2010 (Table 4).
3.4.3. Statistical Analysis—PCA
In the PCA analysis, the first two principal components (PC 1 and PC 2) showed eigenvalues higher than one (2.04 and 1.48, respectively) (Table 5).
These components explained more than 70% of total variance in the data. Therefore, we used PC1 and PC2 for further analysis. PC1 had high weights for EMC of TSS, COD, and TP as well as rainfall indices (rainfall intensity (RI) and rainfall amount (RA)) (Figure 4).
PC2 had large negative weights with TN, NO3−, and BOD. In other words, PC 1 can be regarded as a factor representing high loading of TP, SS, and rainfall parameters and PC2 can be regarded as a factor that represents negative N and BOD loadings. In Figure 4, the events measured in 2009 were all located in the upper right quadrant and the events in 2010 were located in the lower left quadrant. The final three events (from 9th to 11th event) were all located in the upper left quadrant.
4. Discussion
4.1. Characteristics of Agricultural NPS Pollution in the Catchment
The average concentration of SS and TP of each stream under dry conditions was much lower than during rain events (Table 6), suggesting that primary transport processes are rainfall/runoff flushing of terrestrial sources [40].
In general, the average concentrations of BOD in all of the study streams in the Haean catchment during dry conditions was within the management guidelines as suggested by the Korean MoE (Table 7).
However, the average concentration of TN in all of the study streams was higher than the criteria of TN for lake water quality (Table 6 and Table 7). The fertilizer seemed to cause the high N concentration in the streams as reported in many studies in agricultural areas of Asian countries [41]. Of particular importance, SS and TP concentrations were much higher (with wider variability) than the Korean water quality standard during dry periods at many locations (Table 6). It appears that government-driven treatment facility construction to reduce turbidity in surface water, which was constructed in 2009, ironically increased soil disturbance over the catchment. In terms of nutrients and sediment concentrations in stream water during precipitation events, the quality throughout stream sites in the Haean catchment were generally lower than water quality results from previous studies, which were conducted in the other main river systems in Korea and also at the same stream as Site M (Table 8).
Three sites, located in the forest area of Gum River watershed in Korea, displayed lower SS, TN, and TP concentrations than the Haean sites during storm events (Table 8). Two streams located in the Lake Soyang watershed (Jawoon and Naerin streams) displayed lower SS and TP concentrations compared to the monitoring locations of this study, although TN was similar (Table 8). The concentration of TP at Site N was higher than the TP concentration at other monitoring locations, which seems the result of the government driven construction in the watershed of Site N. The watershed of Site N was identified as the primary subject area for turbid water control, therefore it seemed that P in the soil is exported into streams during the construction period. During the fourth event, which produced the highest volume and intensity of rainfall during the study period, all parameters peaked with the highest concentrations at all steams except for Site N, clearly showing the rainfall impact on pollutant exports. However, the rainfall effect seems mitigated by the land use at Site W, of which the watershed is dominated by forest.
During all storm events over the two years of 2009 and 2010, the average EMCs of SS, TN, TP, and BOD were all the lowest at Site W among the monitoring locations, indicating that forest land use exports less nutrients and soil into streams during runoff [52]. There was no clear difference among EMCs of pollutants based on the stream watershed sizes but the EMCs of TP and SS remained lower at Site W than the EMCs at Site K, which had a similar watershed area as Site W. These results again indicate that forested land use can potentially mitigate soil erosion and phosphorus exports [53,54,55]. Comparing the average EMCs of pollutants at the outlet site (Site M) between 2009 and 2010, the average EMC of TN increased while the average EMCs of TP and SS decreased. We hypothesize that the decreased intensity of rainfall in 2010, reducing soil erosion processes, is one of the possible reasons for the decreased SS and TP, which are usually exported concurrently from agricultural fields [56]. Additionally, the government-driven construction of new facilities to diminish turbid water generation in the catchment seemed to decrease soil loss from the catchment. However, the extent of SS export is still higher than the export from other stream sites, therefore consistent soil management protecting erosion, such as reducing soil inverting and mountainous soil disturbance for new crop land, should be implemented [57]. The highest EMCs of BOD in all of the sites throughout the study period can be explained by a ‘first flush’ effect. The antecedent non-rainfall period was the longest at that time allowing for accumulation of biodegradable OM sources on the soil. Perhaps, the most interesting results were found in the variability of BOD and COD, which display inverse relationships over the studied two years. BOD increased in the watershed, which can be interpreted as elevated biodegradable organic matter (i.e., manure) within the catchment. On the other hand, we hypothesized that non-biodegradable (recalcitrant) organic matter (OM) was decreased in 2010 relative to 2009, based on the decreased EMC of COD. The results suggest that lower OM is exported from the forest area, which usually consists of forest detritus, leaf litter and woody debris that containing lignin and cellulose substance, due to less intensive rainfall in 2010. In comparison with EMCs investigated in previous studies in Korea and overseas, the EMCs for SS and TP were much higher than the other localities, regardless of rainfall intensity and land use distribution (Table 8). The EMC of TP at Site M in this study was much higher compared to streams in other regions, which displayed similar summer monsoonal rainfall characteristics such as rainfall intensity and periods in Korea (Table 8). Also comparing to results from locations in other countries, the EMCs were higher (Table 8). These results imply that the runoff into streams throughout the Haean catchment, transported a significant amount of suspended sediment with attached P into the receiving reservoir, Lake Soyang. The effects of turbid water inflow are well studied in the Soyang reservoir. The turbid water inflow deteriorated water transparency and the high amount of P, which is the primary limiting factor in most inland waters of Korea, also prompted eutrophic conditions in the reservoir [47].
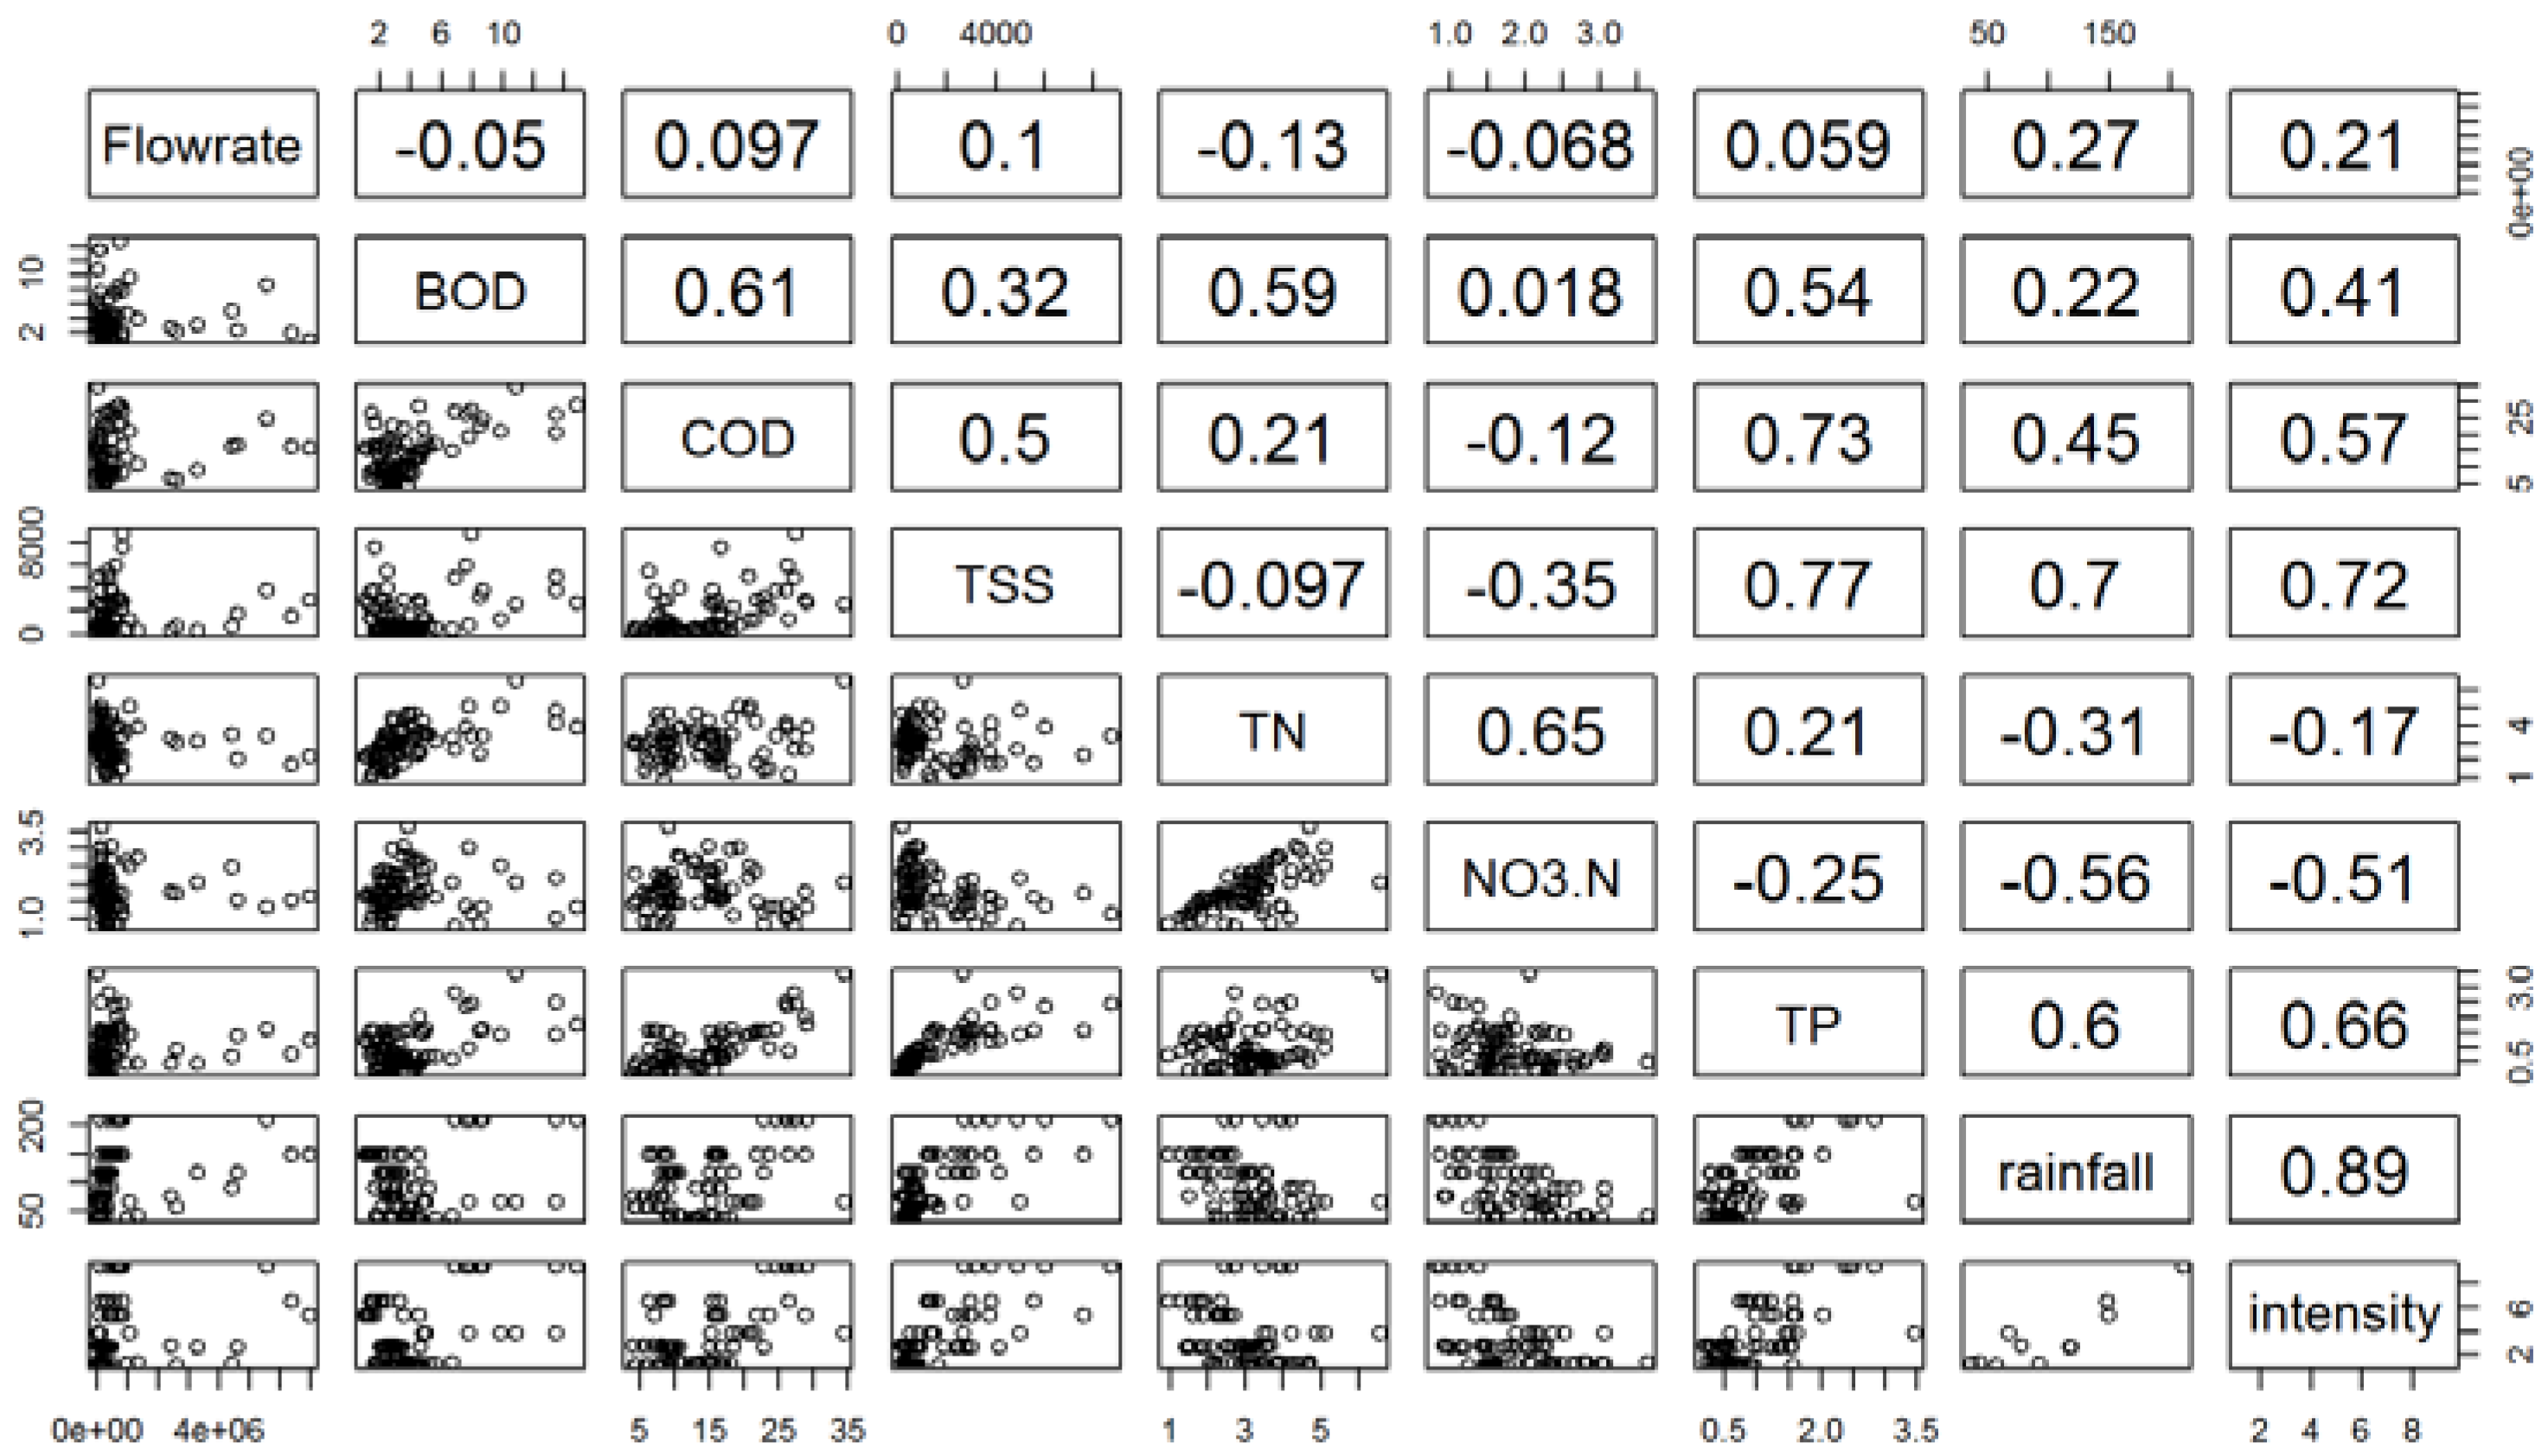
The relationship in EMCs of TN and NO3− at all monitoring locations were relatively well correlated with a correlation coefficient of 0.65 (Figure 5).
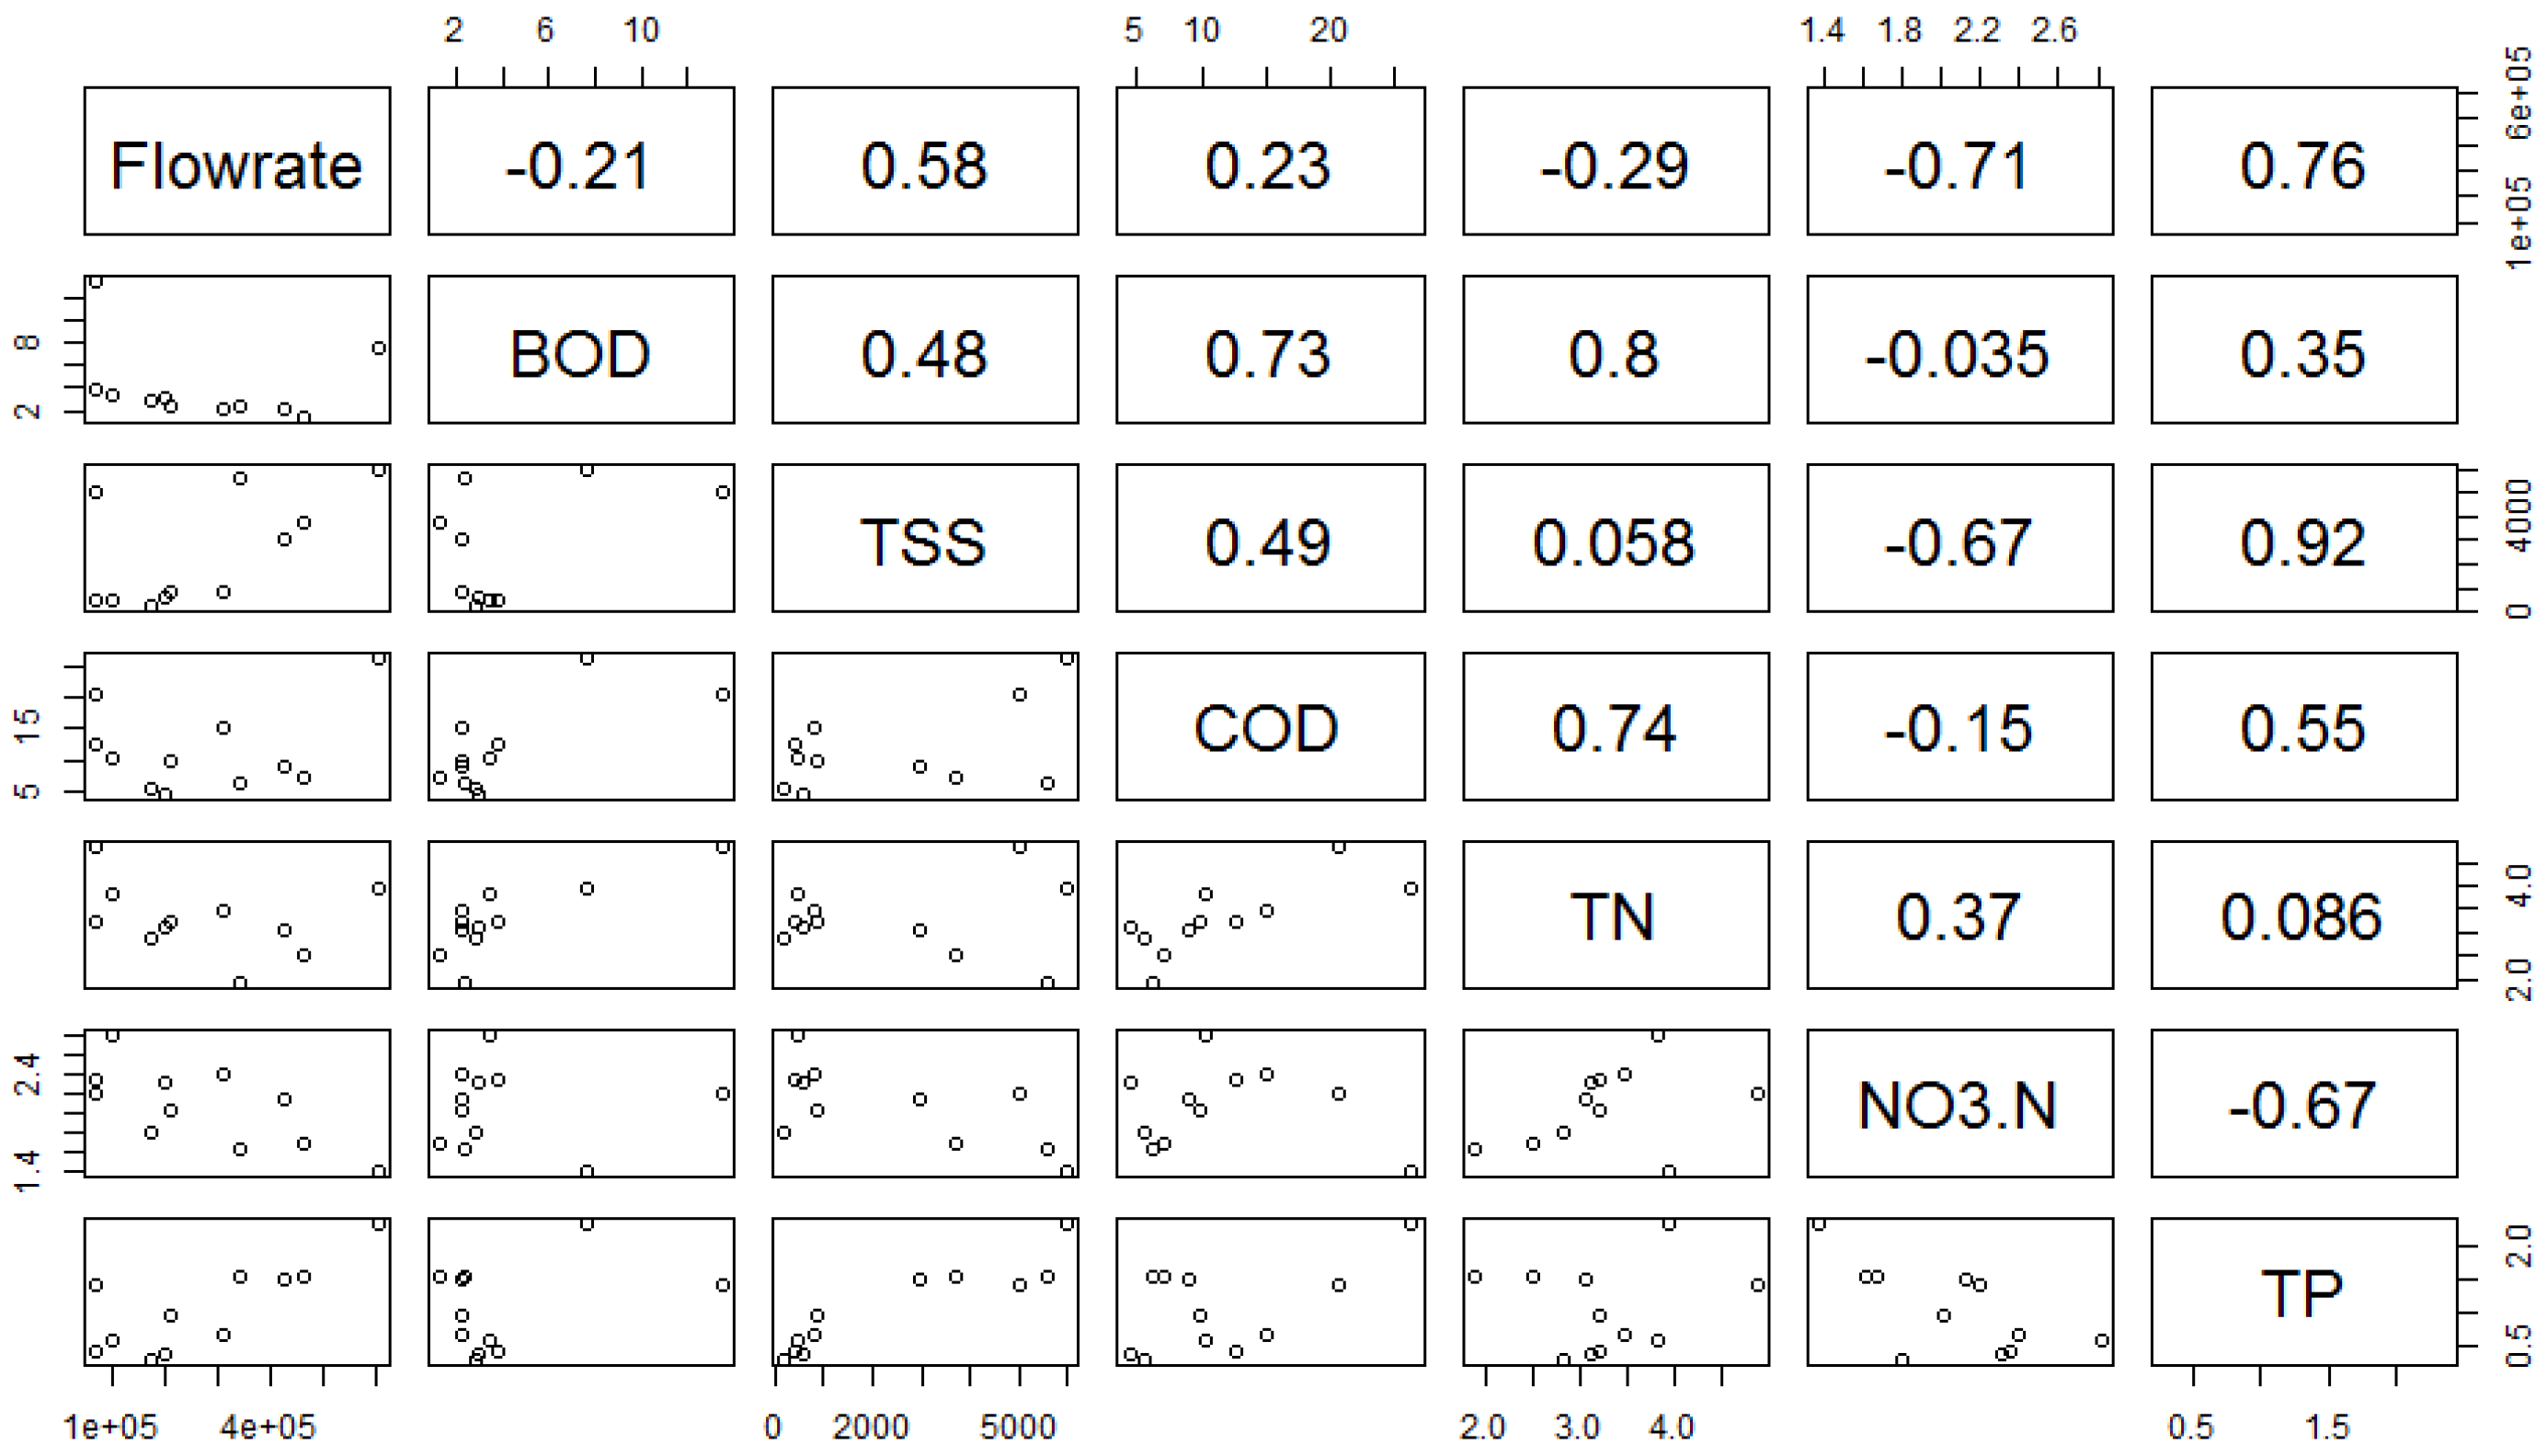
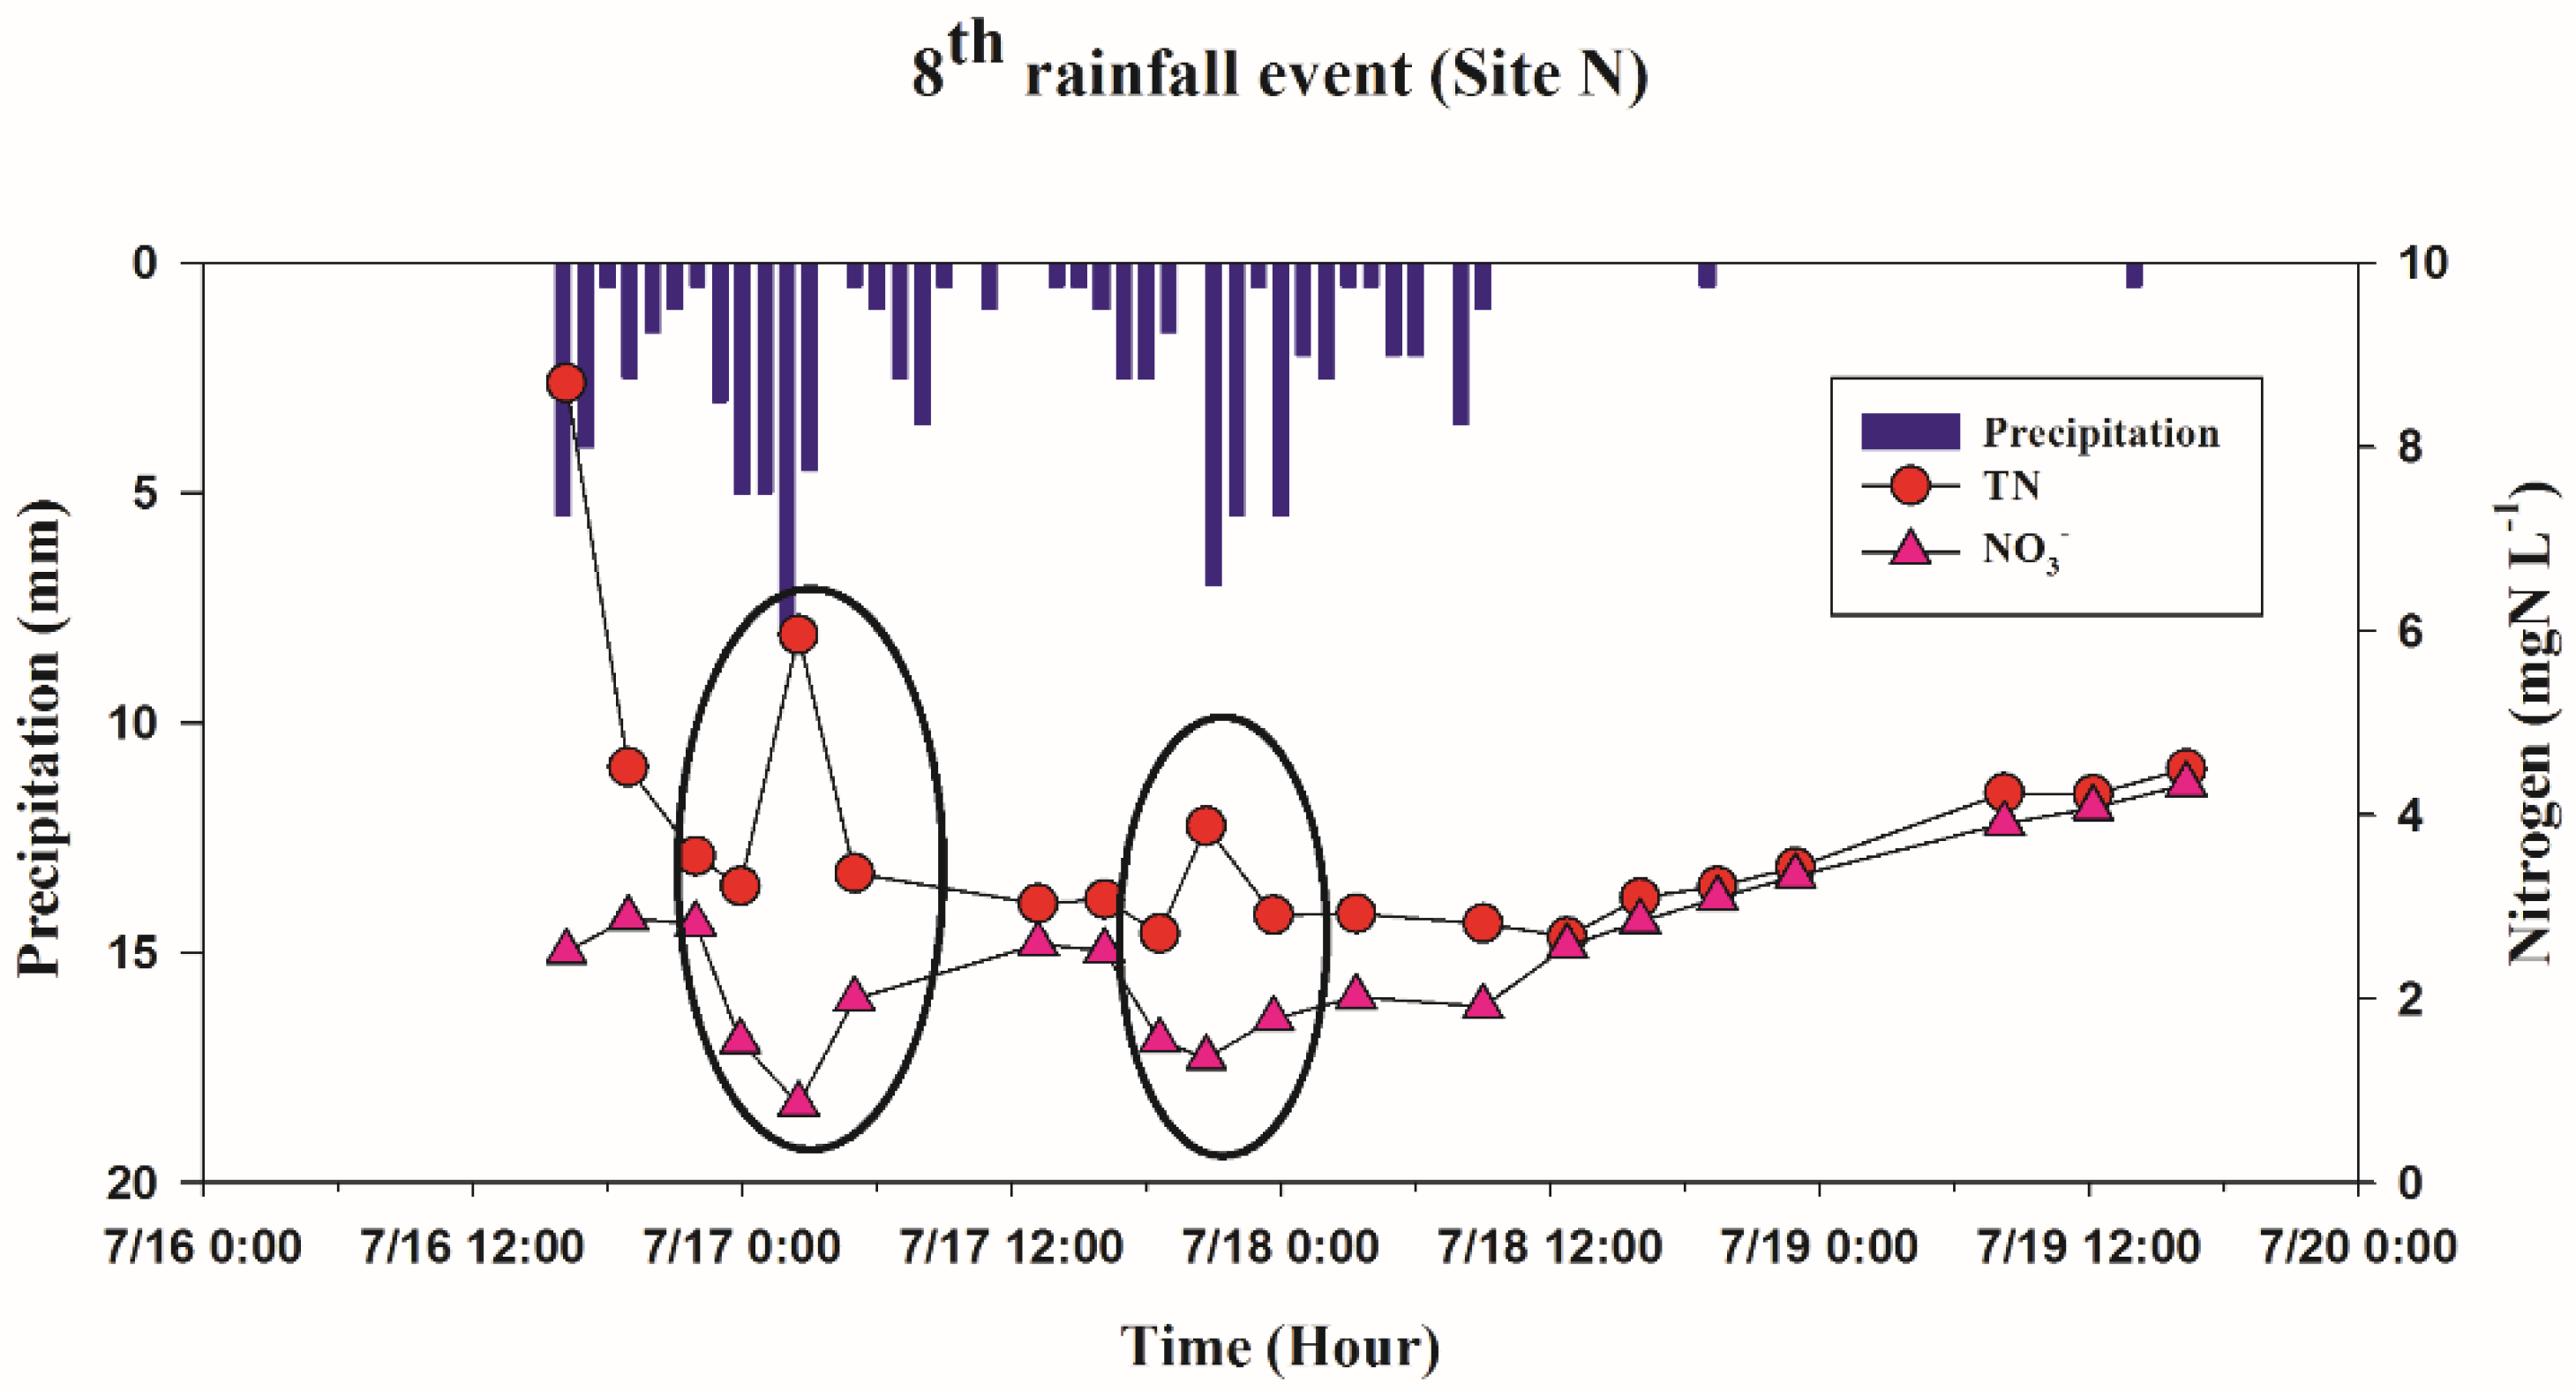
However, the NO3− and TN relationship at Site N was not evident with a lower correlation coefficient (0.37; Figure 6) and the patterns showed high temporal variations of TN and NO3− in some of the investigated rain events (Figure 7).
It appears that there was a huge loss of organic N from Site N and the high correlation coefficient between TN and BOD, which also can explain biodegradable organic matter amounts such as manure and organic fertilizer, supports this assumption (Figure 6). However, the patterns differed temporally, which can perhaps be attributed to the effect of different time scales of organic fertilizer application.
4.2. Monsoonal Climate Effects on the Watershed
Similar results were reported in other monsoonal climate areas [12,58]. Especially, the losses of TP and SS into the streams were influenced most by the rainfall among the water quality parameters [59] and the losses of TP and SS is generated mostly during the summer monsoon season in Korea [14,60]. In combination with crop cultivation under high slopes in the area, the effect of monsoonal rainfall is amplified, producing higher annual SS loading relative to other SS loss estimations in Korea and other countries [61,62]. Comparing the export patterns of EMCs according to differences in the storm event intensities, the exports rates of all of the investigated pollutants were consistent with rainfall intensities that displayed high p-values (Figure 5). This is commonly observed in studies that focused on agricultural NPS pollution exports, especially in monsoonal climate areas. However, the EMCs of TN and NO3− were not strongly correlated with the rain factors (Figure 5). It appears that the variations of N parameters during storm events depend on a variety of factors—including fertilizer application period, manure production, and N loss to the air through denitrification processes—compared to the other investigated parameters [63].
The results of our PCA analysis showed the relationship of monsoonal rainfall on SS and TP exports to streams. The PC1, which explained 46.4% of variance and is positively influenced by TP, SS, and rainfall factors (Table 5), displays a positive relationship with the relatively intense rain events (all events in 2009 and also the fifth event in 2010) (Figure 5).
4.3. Land Use Change Effect
Among all of the experimental sites, the increase in ginseng farming area was most prominent in the Naedong watershed (Site N). This is primarily due to the fact that the governmental restoration project had been focused in this area, which fostered ginseng cultivation in this area. Comparing the EMCs of SS and TP between 2009 and 2010, the EMCs drastically decreased at Site N and also at the main outlet stream. More specifically, between the 2nd and the 10th rainfall events, in which the amounts and the intensities of rainfalls were similar (Table 2), the EMCs of TP and SS at Site N decreased significantly, which suggests that land use change influenced sediment and P exports at the site (Table 9).
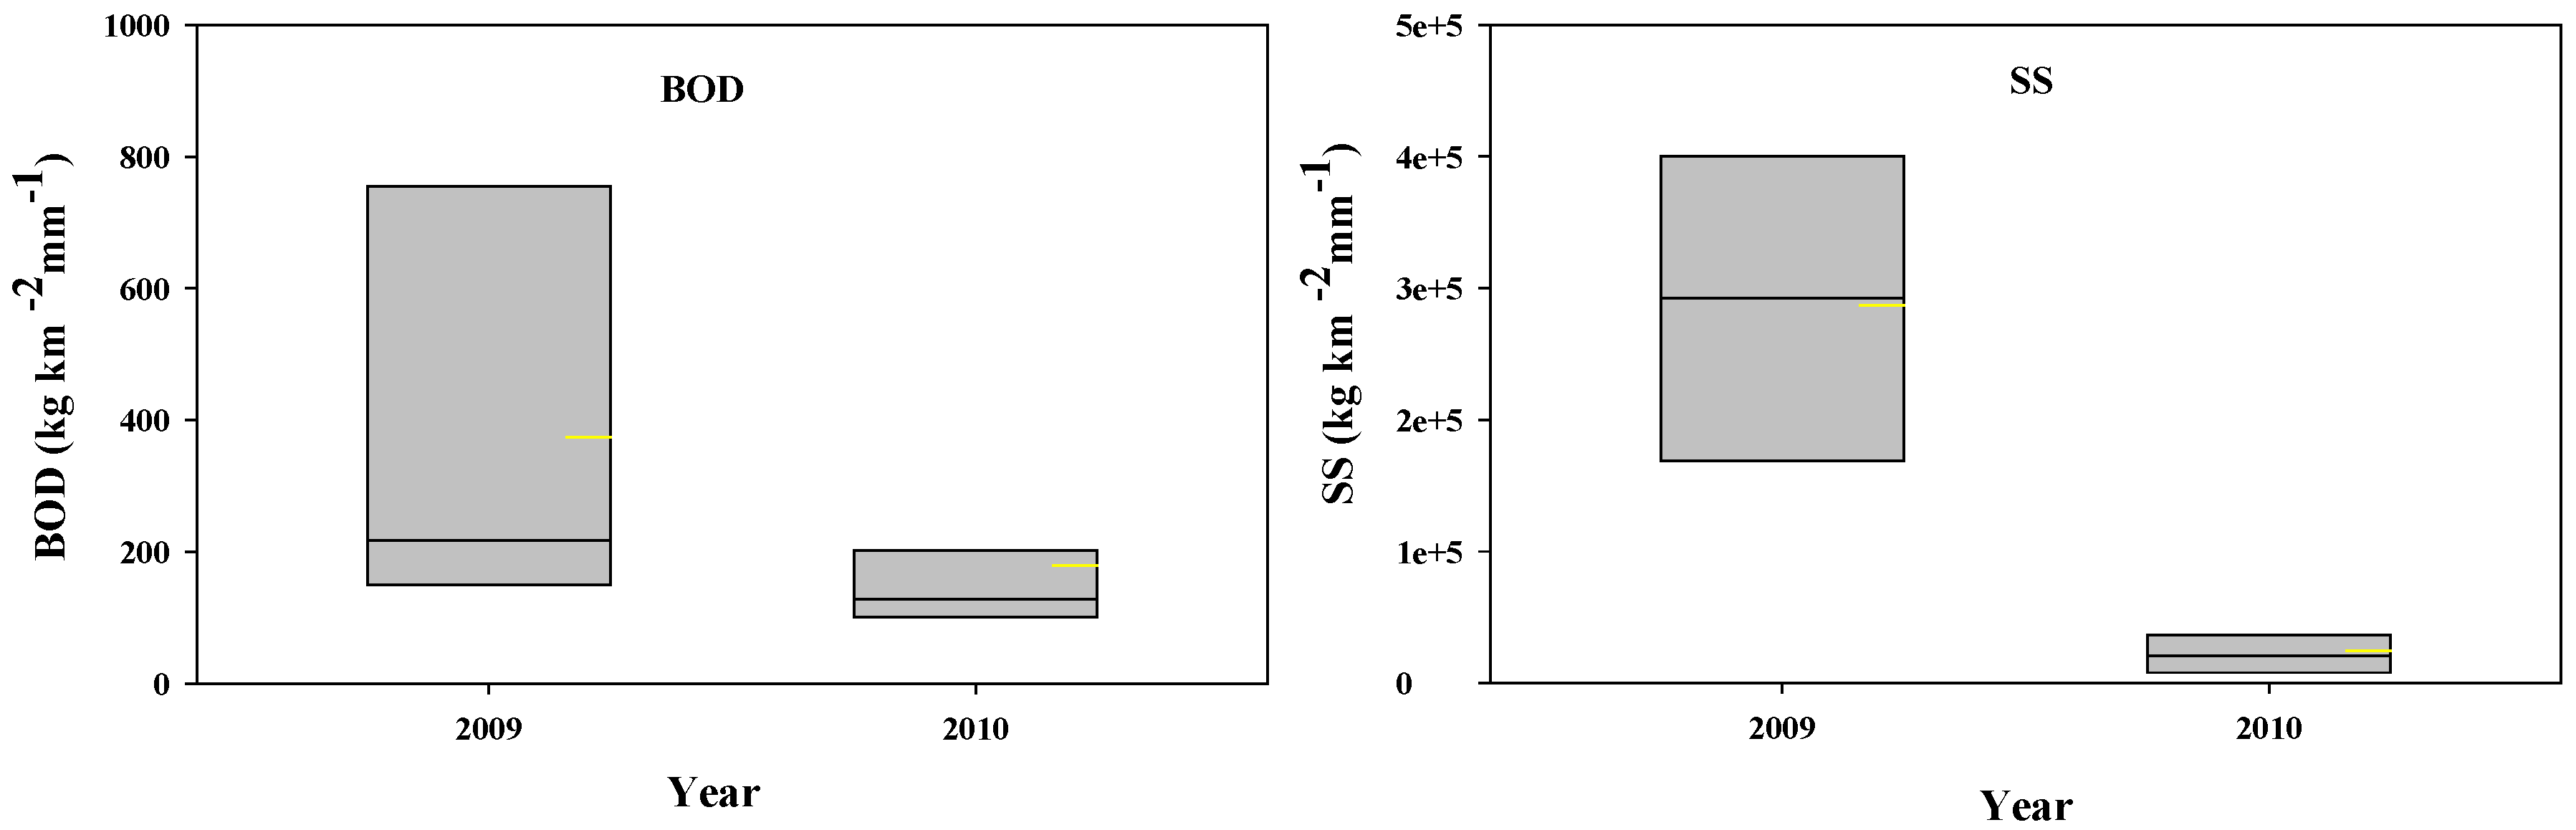
We also examined the relationship between areal pollutant exports per rainfall amounts for each year at Site N to identify land use effects on pollutant export by offsetting the rainfall amount effect between the two years. BOD was decreased from 755 (±488, n = 4) kg km−2 mm−1 to 374 (±57, n = 7) kg km−2 mm−1 while SS decreased dramatically from 434,954 (±260,085, n = 4) km−2 mm−1 in 2009 to 32,571 (±31,067, n = 7) km−2 mm−1 in 2010 (Figure 8).
The effect of the land use change over the entire watershed also showed a relationship between each rain event (from the 1st to the 11th events) and areal loadings of SS and TP per rainfall amounts at Site M for two years (Figure 8. SS and TP clearly decreased in 2010, while the other water quality parameters (BOD, COD, TN, and NO3−) showed no clear differentiation between 2009 and 2010. The results imply that mitigating soil disturbance and erosion through land use changes, efficiently reduces P export [64]. However, the EMCs of NO3− and TN increased minimally, showing that land use change did not mitigate those parameters because these pollutants are less related to soil erosion processes relative to TP and SS.
5. Conclusions
The Haean catchment is located in an upstream area of the Lake Soyang watershed that supplies metropolitan drinking water. Following rain events, the Haean catchment discharges turbid water containing elevated nutrient concentrations resulting from nonpoint sources. The mean concentrations of SS, TN, and TP at Site M (the catchment outlet stream) were much higher than observed in other streams in Korea and locations overseas, indicating that the streams in the headwater catchment transport elevated amounts of sediment and nutrient to downstream areas. During dry periods, concentrations of SS, TN, and TP were lower than the Korean standard criteria for streams in all of the monitoring locations. During the dry season, these headwaters do not appear to impose a substantial impact on water quality; however, monsoonal rainfall events increased the NPS discharge impacts on stream water quality. A government implemented project altered land use in the catchment dramatically since 2000s. As result of this project, many turbid water abatement facilities were constructed and less detrimental land use practices have been recommended, with many of these best management practices (BMP) initiated within the past few years. We compared two events (the 2nd and the 10th storm events), in which the rainfall amounts and intensities were similar, to evaluate the land use change impact to pollutant loads in the catchment and the results indicated that the land use change resulted in reduced amounts of sediment and TP transports to the stream sites. However, BOD and TN increased, which can be expected as the parameters are less related to soil erosion than TP and SS. BOD and TN are more related to other management factors, such as the annual spatial changes in manure application over the catchment and the temporal variability of fertilizer applications. In the future, more specific studies on manure and fertilizer applications are suggested to identify the role these processes have on headlands water quality and transport.
Author Contributions
Bomchul Kim and Stefan Peiffer designed and supervised the entirety of the field work and edited the article. Jaesung Eum and Bumsuk Seo conducted field work and statistically analyzed data. Christopher L. Shope edited the paper and interpreted data. Kiyong Kim conducted field work, analyses, and data interpretation and also wrote the paper.
Funding
This study was carried out in the framework of the International Research Training Group TERRECO (GRK 1565/2), funded by the Deutsche Forschungsgemeinschaft (DFG) at the University of Bayreuth (Germany). This study was also supported by the Korean Ministry of Environment, the Korea Research Foundation, and Kangwon National University.
Conflicts of Interest
The authors declare no conflict of interest. The founding sponsors had no role in the design of the study; in the collection, analyses, or interpretation of data; in the writing of the manuscript or in the decision to publish the results.
References
- Rhee, H.-P.; Yoon, C.-G.; Lee, S.-J.; Choi, J.-H.; Son, Y.-K. Analysis of nonpoint source pollution runoff from urban land uses in South Korea. Environ. Eng. Res. 2012, 17, 47–56. [Google Scholar] [CrossRef]
- Duncan, R. Regulating agricultural land use to manage water quality: The challenges for science and policy in enforcing limits on non-point source pollution in New Zealand. Land Use Policy 2014, 41, 378–387. [Google Scholar] [CrossRef]
- Berka, C.; Schreier, H.; Hall, K. Linking water quality with agricultural intensification in a rural watershed. Water Air Soil Pollut. 2001, 127, 389–401. [Google Scholar] [CrossRef]
- Shen, Z.; Hong, Q.; Chu, Z.; Gong, Y. A framework for priority non-point source area identification and load estimation integrated with APPI and PLOAD model in Fujiang Watershed, China. Agric. Water Manag. 2011, 98, 977–989. [Google Scholar] [CrossRef]
- Qin, B.; Xu, P.; Wu, Q.; Luo, L.; Zhang, Y. Environmental issues of lake Taihu, China. Hydrobiologia 2007, 581, 3–14. [Google Scholar] [CrossRef]
- Gantidis, N.; Pervolarakis, M.; Fytianos, K. Assessment of the quality characteristics of two lakes (Koronia and Volvi) of N. Greece. Environ. Monit. Assess. 2007, 125, 175–181. [Google Scholar] [CrossRef] [PubMed]
- Vadas, P.A.; Kleinman, P.J.A.; Sharpley, A.N.; Turner, B.L. Relating soil phosphorus to dissolved phosphorus in runoff. J. Environ. Qual. 2005, 34, 572–580. [Google Scholar] [CrossRef] [PubMed]
- Hart, M.R.; Quin, B.F.; Nguyen, M. Phosphorus runoff from agricultural land and direct fertilizer effects. J. Environ. Qual. 2004, 33, 1954–1972. [Google Scholar] [CrossRef] [PubMed]
- Park, Y.S.; Lim, K.J.; Yang, J.E.; Kim, K.-S. Modelling of Best Management Practices in Agricultural Areas. In Agroecology; InTech: London, UK, 2015. [Google Scholar]
- Lou, H.; Yang, S.; Zhao, C.; Zhou, Q.; Bai, J.; Hao, F.; Wu, L. Phosphorus risk in an intensive agricultural area in a mid-high latitude region of China. Catena 2015, 127, 46–55. [Google Scholar] [CrossRef]
- Elçi, Ş.; Selçuk, P. Effects of basin activities and land use on water quality trends in Tahtali Basin, Turkey. Environ. Earth Sci. 2013, 68, 1591–1598. [Google Scholar] [CrossRef]
- Correll, D.L. The role of phosphorus in the eutrophication of receiving waters: A review. J. Environ. Qual. 1998, 27, 261–266. [Google Scholar] [CrossRef]
- Ma, X.; Li, Y.; Zhang, M.; Zheng, F.; Du, S. Assessment and analysis of non-point source nitrogen and phosphorus loads in the Three Gorges Reservoir Area of Hubei Province, China. Sci. Total Environ. 2011, 412, 154–161. [Google Scholar] [CrossRef] [PubMed]
- Park, J.-H.; Duan, L.; Kim, B.; Mitchell, M.J.; Shibata, H. Potential effects of climate change and variability on watershed biogeochemical processes and water quality in Northeast Asia. Environ. Int. 2010, 36, 212–225. [Google Scholar] [CrossRef] [PubMed]
- Wang, X.; Hao, F.; Cheng, H.; Yang, S.; Zhang, X.; Bu, Q. Estimating non-point source pollutant loads for the large-scale basin of the Yangtze River in China. Environ. Earth Sci. 2011, 63, 1079–1092. [Google Scholar] [CrossRef]
- Jain, C.K. A hydro-chemical study of a mountainous watershed: The Ganga, India. Water Res. 2002, 36, 1262–1274. [Google Scholar] [CrossRef]
- Lee, J.-Y.; Kim, J.-K.; Owen, J.S.; Choi, Y.; Shin, K.; Jung, S.; Kim, B. Variation in carbon and nitrogen stable isotopes in POM and zooplankton in a deep reservoir and relationship to hydrological characteristics. J. Freshw. Ecol. 2013, 28, 47–62. [Google Scholar] [CrossRef]
- Chiang, L.C.; Chaubey, I.; Hong, N.M.; Lin, Y.P.; Huang, T. Implementation of BMP strategies for adaptation to climate change and land use change in a pasture-dominated watershed. Int. J. Environ. Res. Public Health 2012, 9, 3654–3684. [Google Scholar] [CrossRef] [PubMed]
- Dechmi, F.; Skhiri, A. Evaluation of best management practices under intensive irrigation using SWAT model. Agric. Water Manag. 2013, 123, 55–64. [Google Scholar] [CrossRef] [Green Version]
- Yulianti, J.S.; Lence, B.J.; Johnson, G.V.; Takyi, A.K. Non-point source water quality management under input information uncertainty. J. Environ. Manag. 1999, 55, 199–217. [Google Scholar] [CrossRef]
- Gitau, M.W.; Gburek, W.J.; Bishop, P.L. Use of the SWAT model to quantify water quality effects of agricultural BMPs at the farm-scale level. Trans. ASABE 2008, 51, 1925–1936. [Google Scholar] [CrossRef]
- Liu, R.; Zhang, P.; Wang, X.; Chen, Y.; Shen, Z. Assessment of effects of best management practices on agricultural non-point source pollution in Xiangxi River watershed. Agric. Water Manag. 2013, 117, 9–18. [Google Scholar] [CrossRef]
- Johnes, P.J. Evaluation and management of the impact of land use change on the nitrogen and phosphorus load delivered to surface waters: The export coefficient modelling approach. J. Hydrol. 1996, 183, 323–349. [Google Scholar] [CrossRef]
- Sargaonkar, A. Estimation of land use specific runoff and pollutant concentration for Tapi river basin in India. Environ. Monit. Assess. 2006, 117, 491–503. [Google Scholar] [CrossRef] [PubMed]
- You, Y.Y.; Jin, W.B.; Xiong, Q.X.; Xue, L.; Ai, T.C.; Li, B.L. Simulation and Validation of Non-point Source Nitrogen and Phosphorus Loads under Different Land Uses in Sihu Basin, Hubei Province, China. Procedia Environ. Sci. 2012, 13, 1781–1797. [Google Scholar] [CrossRef]
- Fučík, P.; Novák, P.; Žížala, D. A combined statistical approach for evaluation of the effects of land use, agricultural and urban activities on stream water chemistry in small tile-drained catchments of south Bohemia, Czech Republic. Environ. Earth Sci. 2014, 72, 2195–2216. [Google Scholar] [CrossRef]
- Ren, C.; Wang, L.; Zheng, B.; Holbach, A. Total Nitrogen Sources of the Three Gorges Reservoir—A Spatio-Temporal Approach. PLoS ONE 2015, 10, e0141458. [Google Scholar] [CrossRef] [PubMed]
- Wang, J.; Fu, B.; Qiu, Y.; Chen, L. Soil nutrients in relation to land use and landscape position in the semi-arid small catchment on the loess plateau in China. J. Arid Environ. 2001, 48, 537–550. [Google Scholar] [CrossRef]
- Seo, B.; Bogner, C.; Poppenborg, P.; Martin, E.; Hoffmeister, M.; Jun, M.; Koellner, T.; Reineking, B.; Shope, C.L.; Tenhunen, J. Deriving a per-field land use and land cover map in an agricultural mosaic catchment. Earth Syst. Sci. Data 2014, 6, 339–352. [Google Scholar] [CrossRef]
- Kim, B.; Choi, K.; Kim, C.; Lee, U.-H.; Kim, Y.-H. Effects of the summer monsoon on the distribution and loading of organic carbon in a deep reservoir, Lake Soyang, Korea. Water Res. 2000, 34, 3495–3504. [Google Scholar] [CrossRef]
- Kwon, Y.-S.; Lee, H.-Y.; Han, J.; Youm, S.-J. Terrain analysis of Haean Basin in terms of earth science. J. Korea Earth Sci. Soc. 1990, 11, 236–241. [Google Scholar]
- Bartsch, S.; Peiffer, S.; Shope, C.L.; Arnhold, S.; Jeong, J.-J.; Park, J.-H.; Eum, J.; Kim, B.; Fleckenstein, J.H. Monsoonal-type climate or land-use management: Understanding their role in the mobilization of nitrate and DOC in a mountainous catchment. J. Hydrol. 2013, 507, 149–162. [Google Scholar] [CrossRef]
- Kettering, J.; Park, J.-H.; Lindner, S.; Lee, B.; Tenhunen, J.; Kuzyakov, Y. N fluxes in an agricultural catchment under monsoon climate: A budget approach at different scales. Agric. Ecosyst. Environ. 2012, 161, 101–111. [Google Scholar] [CrossRef]
- Jung, S.; Jang, C.; Kim, J.-J.; Kim, B. Characteristics of water quality by storm runoffs from intensive highland agriculture area in upstream of Han River basin. J. Korean Soc. Water Qual. 2009, 25, 102–111. (In Korean) [Google Scholar]
- Reza, A.; Eum, J.; Jung, S.; Choi, Y.; Owen, J.S.; Kim, B. Export of non-point source suspended sediment, nitrogen and phosphorus from sloping highland agricultural fields in the East Asian monsoon region. Environ. Monit. Assess. 2016, 188, 692. [Google Scholar] [CrossRef] [PubMed]
- APHA-AWWA-WEF. Standard Methods for the Examination of Water and Wastewater, 20th ed.; American Public Health Association: Washington, DC, USA, 1998; ISBN 0875532357. [Google Scholar]
- Shope, C.L.; Bartsch, S.; Kim, K.; Kim, B.; Tenhunen, J.; Peiffer, S.; Park, J.-H.; Ok, Y.S.; Fleckenstein, J.; Koellner, T. A weighted, multi-method approach for accurate basin-wide streamflow estimation in an ungauged watershed. J. Hydrol. 2013, 494, 72–82. [Google Scholar] [CrossRef]
- Buchanan, T.J.; Somers, W.P. Stage Measurement at Gaging Stations; U.S. Government Printing Office: Washington, DC, USA, 1968.
- Hu, H.; Huang, G. Monitoring of Non-Point Source Pollutions from an Agriculture Watershed in South China. Water 2014, 3828–3840. [Google Scholar] [CrossRef]
- Su, J.; Du, X.; Li, X.; Wang, X.; Li, W.; Zhang, W.; Wang, Z.; Wu, Z.; Zheng, B. Development and application of watershed-scale indicator to quantify non-point source P losses in semi-humid and semi-arid watershed, China. Ecol. Indic. 2016, 63, 374–385. [Google Scholar] [CrossRef]
- Giri, S.; Qiu, Z. Understanding the relationship of land uses and water quality in Twenty First Century: A review. J. Environ. Manag. 2016, 173, 41–48. [Google Scholar] [CrossRef] [PubMed]
- Kwak, D.-H.; Yoo, S.-J.; Kim, J.-H.; Lim, I.-H.; Kwon, J.-Y.; Chung, P.-G. Characteristics of non-point pollutant discharges from upper watershed of Seomjin Dam during rainy season. J. Korean Soc. Water Wastewater 2008, 22, 39–48. (In Korean) [Google Scholar]
- Park, S.-C.; Oh, C.-R.; Jin, Y.-H.; Kim, D.-S. Study on runoff characteristics of non-point source in rural area of Seomjin watershed. J. Environ. Sci. 2005, 14, 1057–1062. (In Korean) [Google Scholar]
- Kim, G.; Chung, S.; Lee, C. Water quality of runoff from agricultural-forestry watersheds in the Geum River Basin, Korea. Environ. Monit. Assess. 2007, 134, 441–452. [Google Scholar] [CrossRef] [PubMed]
- Choi, Y.-Y.; Jung, S.-Y.; Choi, J.-W. Nonpoint pollutants sources characteristics of initial surface runoff on the land use types. J. Environ. Sci. 2011, 20, 417–426. (In Korean) [Google Scholar] [CrossRef]
- Yang, H. Runoff characteristics of non-point source pollutants in storm event—Case study on the upstream and downstream of Kokseong River, Korea. Korean Geogr. Soc. 2006, 41, 418–434. (In Korean) [Google Scholar]
- Kim, B.; Jung, S. Turbid storm runoff in Lake Soyang and their environmental effect. J. Korean Soc. Environ. Eng. 2007, 29, 1185–1190. (In Korean) [Google Scholar]
- Jung, S.-M. Characteristics of Nonpoint Source Pollution in the Han River and Effects of Turbid Water on Aquatic Ecosystem. Ph.D. Thesis, Kangwon National University, Chuncheon, Korea, June 2012. [Google Scholar]
- Sharma, D.; Gupta, R.; Singh, R.K.; Kansal, A. Characteristics of the event mean concentration (EMCs) from rainfall runoff on mixed agricultural land use in the shoreline zone of the Yamuna River in Delhi, India. Appl. Water Sci. 2012, 2, 55–62. [Google Scholar] [CrossRef]
- Gentry, L.E.; David, M.B.; Royer, T.V.; Mitchell, C.A.; Starks, K.M. Phosphorus transport pathways to streams in tile-drained agricultural watersheds. J. Environ. Qual. 2007, 36, 408–415. [Google Scholar] [CrossRef] [PubMed]
- McKergow, L.A.; Weaver, D.M.; Prosser, I.P.; Grayson, R.B.; Reed, A.E.G. Before and after riparian management: Sediment and nutrient exports from a small agricultural catchment, Western Australia. J. Hydrol. 2003, 270, 253–272. [Google Scholar] [CrossRef]
- Zhuang, Y.; Hong, S.; Zhan, F.B.; Zhang, L. Influencing factor analysis of phosphorus loads from non-point source: A case study in central China. Environ. Monit. Assess. 2015, 187, 718. [Google Scholar] [CrossRef] [PubMed]
- Peterjohn, W.T.; Correll, D.L. Nutrient dynamics in an agricultural watershed: Observations on the role of a riparian forest. Ecology 1984, 65, 1466–1475. [Google Scholar] [CrossRef]
- Wang, Y.; Li, Y.; Liu, X.; Liu, F.; Li, Y.; Song, L.; Li, H.; Ma, Q.; Wu, J. Relating land use patterns to stream nutrient levels in red soil agricultural catchments in subtropical central China. Environ. Sci. Pollut. Res. 2014, 21, 10481–10492. [Google Scholar] [CrossRef] [PubMed]
- Yao, X.; Yu, J.; Jiang, H.; Sun, W.; Li, Z. Roles of soil erodibility, rainfall erosivity and land use in affecting soil erosion at the basin scale. Agric. Water Manag. 2016, 174, 82–92. [Google Scholar] [CrossRef]
- Kim, S.-W.; Park, J.-S.; Kim, D.; Oh, J.-M. Runoff characteristics of non-point pollutants caused by different land uses and a spatial overlay analysis with spatial distribution of industrial cluster: A case study of the Lake Sihwa watershed. Environ. Earth Sci. 2014, 71, 483–496. [Google Scholar] [CrossRef]
- Baumhardt, R.L.; Stewart, B.A.; Sainju, U.M. North American Soil Degradation: Processes, Practices and Mitigating Strategies. Sustainability 2015, 7, 2936–2960. [Google Scholar] [CrossRef]
- Wu, L.; Long, T.; Liu, X.; Guo, J. Impacts of climate and land-use changes on the migration of non-point source nitrogen and phosphorus during rainfall-runoff in the Jialing River Watershed, China. J. Hydrol. 2012, 475, 26–41. [Google Scholar] [CrossRef]
- Fraser, A.I.; Harrod, T.R.; Haygarth, P.M. The effect of rainfall intensity on soil erosion and particulate phosphorus transfer from arable soils. Water Sci. Technol. 1999, 39, 41–45. [Google Scholar]
- Chun, J.A.; Cooke, R.A.; Kang, M.S.; Choi, M.; Timlin, D.; Park, S.W. Runoff losses of suspended sediment, nitrogen and phosphorus from a small watershed in Korea. J. Environ. Qual. 2010, 39, 981–990. [Google Scholar] [CrossRef] [PubMed]
- Montgomery, D.R. Soil erosion and agricultural sustainability. Proc. Natl. Acad. Sci. USA 2007, 104, 13268–13272. [Google Scholar] [CrossRef] [PubMed]
- Arnhold, S.; Lindner, S.; Lee, B.; Martin, E.; Kettering, J.; Nguyen, T.T.; Koellner, T.; Ok, Y.S.; Huwe, B. Conventional and organic farming: Soil erosion and conservation potential for row crop cultivation. Geoderma 2014, 219–220, 89–105. [Google Scholar] [CrossRef]
- Jenkinson, D.S. The impact of humans on the nitrogen cycle, with focus on temperate arable agriculture. Plant Soil 2001, 228, 3–15. [Google Scholar] [CrossRef]
- Ouyang, W.; Song, K.; Wang, X.; Hao, F. Non-point source pollution dynamics under long-term agricultural development and relationship with landscape dynamics. Ecol. Indic. 2014, 45, 579–589. [Google Scholar] [CrossRef]
Figure 1.
A map of study area and sampling sites ((A) a map of northeastern Asia, (B) Korea peninsula, (C) Lake Soyang watershed, and (D): Haean catchment).
Figure 1.
A map of study area and sampling sites ((A) a map of northeastern Asia, (B) Korea peninsula, (C) Lake Soyang watershed, and (D): Haean catchment).

Figure 2.
Variation of hourly precipitation in Haean catchment over two years, 2009–2010.

Figure 3.
Variations of water quality parameters at Site M in the first rain event.

Figure 4.
Loadings of two principal components for the target rain events (2009 and 2010).

Figure 5.
Scatter plots among water quality parameters and r values among the parameters at all study sites during storm events for two years.
Figure 5.
Scatter plots among water quality parameters and r values among the parameters at all study sites during storm events for two years.

Figure 6.
Scatter plots among water quality parameters and r values among the parameters at Site N during storm events for two years.
Figure 6.
Scatter plots among water quality parameters and r values among the parameters at Site N during storm events for two years.

Figure 7.
Variations of TN and nitrate concentrations at Site N during eighth storm event.

Figure 8.
Averages of areal loadings of BOD and SS per rainfall amounts in 2009 and 2010.


Table 1.
Dates, rainfall amounts, and rainfall intensities during studied rain events.
| No. of Event | Date | Total Amount (mm) | Average Intensity (mm h−1) | Intensity Order |
|---|---|---|---|---|
| 1 | 9–10 July 2009 | 149.0 | 5.4 | 3 |
| 2 | 12–13 July 2009 | 118.0 | 2.7 | 7 |
| 3 | 14–15 July 2009 | 148.0 | 6.6 | 2 |
| 4 | 11–12 August 2009 | 210.0 | 9.5 | 1 |
| 5 | 18–19 May 2010 | 67.5 | 3.8 | 4 |
| 6 | 23–25 May 2010 | 43.0 | 1.5 | 8 |
| 7 | 2–3 July 2010 | 36.5 | 1.3 | 10 |
| 8 | 16–19 July 2010 | 91.5 | 1.3 | 9 |
| 9 | 7–8 August 2010 | 56.5 | 1.2 | 11 |
| 10 | 25–27 August 2010 | 117.0 | 2.7 | 6 |
| 11 | 2–3 September 2010 | 77.5 | 2.8 | 5 |
Table 2.
Percentages of main land uses of Haean catchment in 2009 and 2010.
| Site | Year | Semi | Paddy | Dry | Ginseng | Orchard |
|---|---|---|---|---|---|---|
| M | 09′ | 12.7 | 9.9 | 19.1 | 0.9 | 0.4 |
| 10′ | 15.8 | 9.4 | 14.4 | 2.7 | 1.7 | |
| W | 09′ | 9.2 | 4.2 | 9.5 | 0.1 | 0.0 |
| 10′ | 12.1 | 4.2 | 5.5 | 2.5 | 1.0 | |
| K | 09′ | 9.7 | 14.1 | 15.7 | 0.7 | 0.0 |
| 10′ | 13.4 | 12.2 | 11.2 | 1.5 | 1.8 | |
| D | 09′ | 22.2 | 19.3 | 29.6 | 1.0 | 0.0 |
| 10′ | 26.6 | 17.9 | 24.6 | 4.8 | 0.1 | |
| N | 09′ | 18.3 | 7.1 | 24.9 | 0.7 | 0.0 |
| 10′ | 21.9 | 6.8 | 18.9 | 9.2 | 0.8 | |
| C | 09′ | 9.8 | 6.7 | 21.2 | 0.0 | 0.2 |
| 10′ | 11.5 | 6.7 | 18.6 | 3.5 | 0.4 | |
| S | 09′ | 10.7 | 10.6 | 16.7 | 1.2 | 0.1 |
| 10′ | 12.7 | 10.0 | 13.4 | 1.9 | 2.7 | |
| Total | 09′ | 11.5 | 8.7 | 17.0 | 0.8 | 0.3 |
| 10′ | 14.4 | 8.2 | 12.6 | 2.5 | 1.5 |
Table 3.
EMC (event mean concentration) at Site M for rain events (mg L−1).
| Event No. | BOD | COD | SS | TN | N-NO3 | TP |
|---|---|---|---|---|---|---|
| 1 | 1.0 | 16.15 | 2954 | 2.24 | 1.67 | 1.27 |
| 2 | 2.3 | 16.77 | 1837 | 2.08 | 1.56 | 1.37 |
| 3 | 2.0 | 16.56 | 1587 | 1.76 | 1.53 | 0.81 |
| 4 | 8.7 | 24.76 | 3804 | 3.43 | 1.37 | 1.62 |
| 5 | 9.8 | 20.92 | 1281 | 5.08 | 2.52 | 1.45 |
| 6 | 4.0 | 10.97 | 304 | 3.90 | 2.78 | 0.49 |
| 7 | 4.6 | 13.19 | 427 | 3.77 | 2.68 | 0.46 |
| 8 | 5.1 | 16.40 | 661 | 3.54 | 2.48 | 0.71 |
| 9 | 2.1 | 6.36 | 738 | 3.04 | 1.76 | 0.95 |
| 10 | 3.2 | 8.96 | 332 | 3.16 | 2.05 | 0.46 |
| 11 | 2.8 | 6.80 | 313 | 3.25 | 1.80 | 0.48 |
Table 4.
Areal loadings of pollutants (BOD, COD, SS, TN and TP) at study sites during rain events (kg km−2).
Table 4.
Areal loadings of pollutants (BOD, COD, SS, TN and TP) at study sites during rain events (kg km−2).
| Site | Year | BOD | COD | SS | TN | TP |
|---|---|---|---|---|---|---|
| M | 09′ | 1496 | 8246 | 1,148,377 | 1056 | 558 |
| 10′ | 1250 | 3529 | 169,526 | 1072 | 209 | |
| W | 09′ | 1404 | 7384 | 901,661 | 643 | 446 |
| 10′ | 613 | 2472 | 103,351 | 566 | 106 | |
| K | 09′ | 1425 | 6430 | 2,377,372 | 931 | 629 |
| 10′ | 893 | 3195 | 153,741 | 968 | 163 | |
| D | 09′ | 1320 | 4430 | 762,641 | 654 | 379 |
| 10′ | 701 | 2269 | 138,284 | 585 | 157 | |
| N | 09′ | 1768 | 6404 | 2,172,759 | 1397 | 850 |
| 10′ | 981 | 3055 | 258,560 | 979 | 185 | |
| C | 09′ | 2386 | 15281 | 1,873,577 | 1170 | 1100 |
| 10′ | 1218 | 3819 | 233,318 | 1263 | 238 | |
| S | 09′ | 1450 | 4267 | 481,667 | 580 | 320 |
| 10′ | 500 | 1435 | 73,204 | 563 | 96 | |
| Total | 09′ | 1496 | 8246 | 1,148,377 | 1056 | 558 |
| 10′ | 1250 | 3529 | 169,526 | 1072 | 209 | |
| Annual loads | 09′ | 28,219 | 131,568 | 24,380,657 | 16,134 | 10,741 |
| 10′ | 19,616 | 63,021 | 3,601,173 | 19,109 | 3676 |
Table 5.
Results of PCA (principal component analysis) with the measured variables.
| Factors | PC 1 | PC 2 |
| Eigenvalue | 2.04 | 1.48 |
| Proportion | 0.46 | 0.24 |
| Cumulative portion | 0.46 | 0.71 |
| Loadings | ||
| Parameters | PC 1 | PC 2 |
| SS | 0.41 | 0.03 |
| TP | 0.42 | −0.19 |
| TN | −0.03 | −0.63 |
| NO3− | −0.24 | −0.44 |
| BOD | 0.26 | −0.45 |
| COD | 0.36 | −0.26 |
Table 6.
Average concentrations of BOD, COD, SS, TN, and TP in the study sites during dry periods (mg L−1).
Table 6.
Average concentrations of BOD, COD, SS, TN, and TP in the study sites during dry periods (mg L−1).
| Site | Average | BOD | COD | SS | TN | TP |
|---|---|---|---|---|---|---|
| M | Avg. | 1.4 | 3.1 | 22.8 | 4.9 | 65.3 |
| s.d. | 0.5 | 1.9 | 42.8 | 0.9 | 67.2 | |
| W | Avg. | 0.9 | 2.9 | 16.5 | 2.8 | 29.9 |
| s.d. | 0.5 | 3.3 | 71.5 | 0.8 | 88.3 | |
| K | Avg. | 1.1 | 2.5 | 23.9 | 4.4 | 47.2 |
| s.d. | 0.6 | 1.8 | 51.2 | 0.7 | 59.2 | |
| D | Avg. | 1.0 | 3.0 | 13.6 | 4.0 | 29.1 |
| s.d. | 0.6 | 2.5 | 21.6 | 0.8 | 35.9 | |
| N | Avg. | 1.0 | 3.0 | 84.2 | 5.1 | 78.1 |
| s.d. | 0.6 | 3.3 | 302.2 | 0.7 | 125.2 | |
| C | Avg. | 2.0 | 4.3 | 19.2 | 3.3 | 61.5 |
| s.d. | 1.4 | 3.1 | 67.1 | 0.9 | 82.4 | |
| S | Avg. | 1.2 | 2.6 | 36.8 | 4.4 | 55.0 |
| s.d. | 0.8 | 1.7 | 112.5 | 1.0 | 113.8 |
Table 7.
Classification of water quality levels according to Korean regulations (mg L−1).
| Notch | For Streams | For Lakes | ||
|---|---|---|---|---|
| BOD | SS | TP | TN | |
| 1 | ≤1 | ≤25 | ≤0.01 | ≤0.2 |
| 2 | ≤3 | ≤25 | ≤0.03 | ≤0.4 |
| 3 | ≤6 | ≤25 | ≤0.05 | ≤0.6 |
| 4 | ≤8 | ≤100 | ≤0.10 | ≤1.0 |
| 5 | ≤10 | No trash | ≤0.15 | ≤1.5 |
Table 8.
EMCs of BOD, COD, SS, TN, and TP of streams in South Korea (literature reviews) (mg L−1).
| Site (Year) | Primary Land Use (%) | BOD | COD | SS | TN | TP | Sources |
|---|---|---|---|---|---|---|---|
| In South Korea | |||||||
| Imsilstream | Forest (over 70%) | 2.7 | 6.9 | 75.9 | 2.7 | 0.19 | Kwak et al. 2008 [42] |
| Seomjin River | 2.6 | 5.1 | 46.5 | 2.3 | 0.13 | ||
| Three Sites in Seomjin River Watershed | Forest | 3.1–5.7 | 3.4–12.7 | 2.1–30.0 | 0.9–2.9 | 0.02–0.13 | Park et al. 2005 [43] |
| Paddy | 8.2–15.5 | 15.6–33.4 | 3.2–7.2 | 0.21–0.42 | |||
| Dry field | 4.6–11.8 | 6.7–17.6 | 2.3–3.7 | 0.03–0.44 | |||
| Sutong | Forest (99.5%) | - | - | - | 0.9 | 0.28 | Kim et al. 2007 [44] |
| Sansuchon | Forest (94.2%) | - | - | - | 0.9 | 0.16 | |
| Daegokchon | Forest (82.3%) | - | - | - | 2.1 | 0.62 | |
| Sinheung | Agriculture (35.9%) | - | - | - | 4.9 | 1.36 | |
| Two Sites in Sangju Basin | Paddy & forest (58.6%) | 26.0 | - | 11.1 | - | - | Choi et al. 2011 [45] |
| Paddy & forest (55.5%) | 22.6 | - | 17.6 | - | - | ||
| Streams in Kokseong River System | Forest (100%) | 0.6 | 1.5 | 1.7 | 0.0 | 0.48 | Yang 2006 [46] |
| Forest (71.9%) | 2.9 | 4.8 | 63.5 | 0.2 | 1.67 | ||
| Jawoon Stream | Forest (85.6%) | 1.8 | - | 207 | 4.0 | 0.27 | Jung et al. 2009 [34] |
| Soyang River 2004 | Forest (85%) | 1.4 | 8.9 | 199 | 1.6 | 0.20 | Kim and Jung 2007 [47] |
| Soyang River 2005 | 0.8 | 4.2 | 303 | 2.1 | 0.10 | ||
| Soyang River 2006 | 1.7 | 10.1 | 531 | 2.4 | 0.24 | ||
| Mandae Stream 2004 | (same site as the Site M in this study) | 1.3 | 11.8 | 436 | 2.8 | 0.36 | Jung 2012 [48] |
| Mandae Stream 2006 | 1.6 | 9.0 | 387 | 2.7 | 0.34 | ||
| International Publication | |||||||
| Siheshui Watershed, China | Forest & agriculture | 3.1 | 5.8 | 58.3 | 3.5 | 0.26 | Hu and Huang 2014 [38] |
| River Yamuna, India | Agriculture | 21.8 | 73.5 | 77.6 | 15.3 | - | Sharma et al. 2012 [49] |
| Embarras River, USA (1997–2003) | Agriculture | - | - | - | - | 0.14–0.35 | Gentry et al. 2007 [50] |
| Lake Fork Watershed, USA (1998–2003) | Agriculture | - | - | - | - | 0.11–0.21 | |
| Big Ditch Watershed, USA (2001–2003) | Agriculture | - | - | - | - | 0.19–0.38 | |
| North Willyung Catchment, Australia | Cattle | 9.9 Med | 2.5 Med. | 0.48 Med. | McKergow et al. 2003 [51] | ||
| Site M | Forest & agriculture | 3.5 | 18.6 | 2545 | 2.4 | 1.27 | This study |
| Site M | 4.5 | 11.9 | 579 | 3.7 | 0.71 | ||
Table 9.
Comparisons with EMC (event mean concentrations) of pollutants in between 2nd and 10th event.
Table 9.
Comparisons with EMC (event mean concentrations) of pollutants in between 2nd and 10th event.
| Site | BOD | COD | SS | TN | N-NO3 | TP |
|---|---|---|---|---|---|---|
| M | +40.5 | −46.6 | −81.9 | +51.7 | +31.5 | −66.4 |
| W | −12.3 | −50.7 | −89.8 | +26.8 | −10.8 | −80.2 |
| K | −17.1 | −24.3 | −94.7 | +53.2 | +46.5 | −76.8 |
| N | +6.3 | +9.2 | −70.3 | +5.1 | −5.2 | −36.6 |
| C | +10.6 | −56.5 | −79.4 | +79.2 | +22.3 | −63.0 |
| S | −48.9 | −37.5 | −88.1 | +41.6 | +32.9 | −65.5 |
© 2018 by the authors. Licensee MDPI, Basel, Switzerland. This article is an open access article distributed under the terms and conditions of the Creative Commons Attribution (CC BY) license (http://creativecommons.org/licenses/by/4.0/).
Share and Cite
MDPI and ACS Style
Kim, K.; Kim, B.; Eum, J.; Seo, B.; Shope, C.L.; Peiffer, S. Impacts of Land Use Change and Summer Monsoon on Nutrients and Sediment Exports from an Agricultural Catchment. Water 2018, 10, 544. https://doi.org/10.3390/w10050544
AMA Style
Kim K, Kim B, Eum J, Seo B, Shope CL, Peiffer S. Impacts of Land Use Change and Summer Monsoon on Nutrients and Sediment Exports from an Agricultural Catchment. Water. 2018; 10(5):544. https://doi.org/10.3390/w10050544
Chicago/Turabian StyleKim, Kiyong, Bomchul Kim, Jaesung Eum, Bumsuk Seo, Christopher L. Shope, and Stefan Peiffer. 2018. "Impacts of Land Use Change and Summer Monsoon on Nutrients and Sediment Exports from an Agricultural Catchment" Water 10, no. 5: 544. https://doi.org/10.3390/w10050544
Note that from the first issue of 2016, this journal uses article numbers instead of page numbers. See further details here.