Topography-Related Glacier Area Changes in Central Tianshan from 1989 to 2015 Derived from Landsat Images and ASTER GDEM Data


1
School of Geography and Planning, and Guangdong Key Laboratory for Urbanization and Geo-Simulation, Sun Yat-sen University, Guangzhou 510275, China
2
State Key Laboratory of Desert and Oasis Ecology, Xinjiang Institute of Ecology and Geography, Chinese Academy of Sciences, Urumqi 830011, China
*
Author to whom correspondence should be addressed.
Water 2018, 10(5), 555; https://doi.org/10.3390/w10050555
Submission received: 13 March 2018
/
Revised: 18 April 2018
/
Accepted: 23 April 2018
/
Published: 25 April 2018
(This article belongs to the Special Issue Applications of Remote Sensing and GIS in Hydrology)
Abstract
:
Studies have investigated the glacier projected area (2D Area) on a horizontal plane, which is much smaller than the glacier topographic surface extent (3D Area) in steep terrains. This study maps the glacier outline in Central Tianshan using Landsat images from four periods, i.e., 1989, 2002, 2007 and 2015, by an object-based classification approach, and analyzes the glacier 2D and 3D area changes related to topographic factors based on Advanced Spaceborne Thermal Emission and Reflection Radiometer (ASTER) Global DEM data. This approach shows an accuracy of 90.8% for clean ice mapping. The derived clean ice outlines are in good agreement with the 2nd Chinese Glacier Inventory (CGI2) and the Global Land Ice Measurements from Space (GLIMS). The fields with a northern aspect receive the least surface solar radiation, leading to dominant existing glaciers. Glaciers are near evenly distributed in slope zones of 0° to 50° and have a mean slope angle of 28.8°, resulting in a 30.3% larger 3D area than the 2D area in 2015 in Central Tianshan. The glacier 2D area decreased by 404 km2 (−8.1%) between 1989 and 2015, while the 3D area declined by 516 km2 (−7.9%). The glacier 2D area showed a reduction of −1.8% between 1989 and 2002, −3.8% between 2002 and 2007, and −2.7% between 2007 and 2015, and these retreating rates closely responded to the variations of regional mean air temperature and precipitation. Topographically, most reductions occurred in elevation bands of 3000–4000 m and in slope zones of 10–20° and 40–50°, and in the eastern aspect fields. The northern Tekes River catchment had the largest shrinking rate of −17.0% (2D area), followed by the southern Karasu River (−14.2%) and Muzart River (−7.7%) catchments. In contrast, glaciers in the Kumerik/Aksu and Tailan River catchments in the Tuomuer region showed little change (−2%).
1. Introduction
Glaciers and snow in Central Tianshan are crucial water resources in this arid and semiarid region [1,2]. Almost all oasis agriculture and residents in the surrounding areas are set up along river valleys and are dependent on water resources from the upper Tianshan Mountains, where glacier melt water contributes a significant share of stream inputs and is a buffer against severe drought [3]. The contributions of glacier melt to runoff vary from 3.5% to 67.5% (mean 24.0%) among the twenty-four catchments in Tianshan Ranges, and the annual runoff stability increases with the glacier area ratio following a power function curve [4]. A small change in the glacier area ratio may cause dramatic changes in hydrologic regimes. Glaciers are sensitive to the rising air temperature and are among the best natural indicators of climatic change [5,6]. Accurate estimation of glacier variation is significant for water resource prediction and planning [7,8]. Repetitive mapping of glacier areas in different time periods could better assess glacier-climate interactions and predict the future runoff variations in glacierized catchments [9,10].
The full glacier inventories in the Tianshan Mountains has been produced primarily by the First and Second Chinese Glacier Inventory (CGI1 and CGI2) data, and World/Randolph Glacier Inventory (WGI/RGI), Global Land Ice Measurements from Space (GLIMS), and Glacier Area Mapping for Discharge from the Asian Mountains (GAMDAM, or GGI) by manual mapping from Landsat images [11,12]. CGI1 and CGI2 are the original data sources for WGI and GLIMS within China, GGI is the source data of RGI in High Mountains Asia, and RGI is a parallel inventory to GLIMS [11,13,14,15].
CGI1 was compiled mainly from different aerial photographs acquired during the 1950s–1980s, and CGI2 was derived from Landsat images acquired mainly from 2006–2010 [16]. Wang et al. (2011a) analyzed 3000 glaciers (total 9035) in the Chinese Tianshan Mountains based on CGI1 and CGI2 and found the glacier areas declined by −11.5% from the 1960s to 2009 [17]. In contrast, by using the same CGI1 and CGI2 data, Xu et al. (2015) found that the glacier areas (1511 km2 in 1970s) decreased by −22.0% in the Tekes River catchment of Central Tianshan [18]. There are large uncertainties in evaluating glacier changes by direct comparison of CGI1 and CGI2 and other glacier inventories due to their different data sources and glacier classification methods applied.
Glacier change detection can be best estimated by comparison of glacier areas derived from a same classification approach and similar image sources. Numerous studies have identified different change rates of individual glaciers at a catchment scale in the Tianshan Mountains mainly by using airborne photos and satellite images. Seasonal snow cover and the hanging cloud on high mountains are the two dominant factors that constrain optical sensors to map glacier change in catchment studies and further limit knowledge of the glacier status at a regional level [5]. Nonetheless, studies focusing on a catchment could identify detailed variations with high confidence. For example, in Central Tianshan, the glacier areas showed little changes during 1999–2007 in the Inylchek Glacier, Kyrgyzstan [19], while the glacier areas decreased by −12.6% (−0.29% a−1) between 1965 and 2003 in the eastern Terskey-Alatoo Range, Kyrgyzstan [5], and by −7.8% (−1.30% a−1) in the Muzart Glacier catchment, China during 2007–2013 [20]. In Northern Tianshan, the glacier areas decreased from 91.3 km2 in 1964 to 77.4 km2 in 2004 (−0.38% a−1) in the Jinghe River Basin, China [21], while they dramatically decreased from 142.8 km2 to 109.0 km2 (−1.02% a−1) from 1989 to 2012 in the Karatal River Basin, Kazakhstan [22]. The largest shrinkage rate was found to be −1.67% a−1 between 2007 and 2013 in the Mountain Karlik of Eastern Tianshan, China [23]. In contrast, in Central Tianshan of China territory, Landsat images identified that Qinbingtan Glacier No. 74 advanced ~90 m and the glacier area increased by 6.4% between 2002 and 2010, and the West Qongterang Glacier had a significant volume gain in the central part of the glacier tongue although it lost mass in the upper part, a typical characteristic of glacier surge [24]. Those studies demonstrate large spatial heterogeneity of glacier variations in the Tianshan Mountains, while there is a limited overall budget of the glacier areas at a regional scale based on the same approach in the Landsat images era, e.g., in Central Tianshan.
Moreover, glacier inventories and most previous investigations are based on the planar area in two horizontal dimensions (2D area) projected onto the ellipsoid Earth surface, which is defined within the glacier ice mass balance community [25], rather than the real topographic surface extent (3D area) projected onto the slope normal, which is practiced within the snow cover community [26]. Accordingly, their thickness is defined as the vertical length measured parallel to the horizontal normal (glacier thickness) and slope normal (snow depth), separately [20]. Geometrically, the 3D area is 5% larger than the 2D area as the slope angle is larger than 18°, 15% larger for 30°, and 41% larger for 45°. For instance, the mean slope angle is 31.5° in the Muzart Glacier Catchment, resulting in a 38.1% larger glacier 3D area than the 2D area [20]. The mean glacier surface slope angle of CGI2 in China is 19.9°, while over one third of the surface slope angles are greater than 30° in steep terrains, such as the Central Tianshan, Pamir Plateau, Qilian Mountains and Altai Mountains [16]. It is worth investigating the distribution of the differences between the glacier 3D area and 2D area and how they are related to glaciers retreating, especially in the high Asian mountain glaciers with steep slopes.
The primary objectives of this study are to (1) map and quantify the glacier 2D and 3D area distribution and difference in Central Tianshan by using topographic data (ASTER GDEM V2) and an object-based classification approach from Landsat images in four time periods: 1989, 2002, 2007 and 2015; and (2) investigate how glacier area changes are related to topography such as surface slope zones, elevation bands, aspect fields (orientation), and natural glacier catchments. Thus, a whole budget of the glacier area variations can be best assessed at a regional wide and in the five major glacier (river) catchments over the entire Central Tianshan, the water tower of Central Asia.
2. Study Area and Data
2.1. Study Area
Central Tianshan (also called Tien Shan in some literature) mainly lies in Northwest China (in Xinjiang Uygur Autonomous Region), Kazakhstan and Kyrgyzstan, extending from 41.5° N to 43.0° N and 79.0° E to 82.5° E (Figure 1). The mountain ranges run mainly from northeast to southwest, with the highest peaks of 7010 m (Tuomuer) and 7439 m (Jengish Chokusu). The study areas are constrained above the 2500-m elevation contour, where most perennial snow and ice occur. The total study areas are 23,000 km2, and about 20% of the study areas are covered by glaciers or perennial snow. According to the World Glacier Inventory (WGI) in 2012, there are a total of 2600 glaciers and over 6000 km² in this region, i.e., about 40% of the total glacier areas in the entire Tianshan ranges [5]. Most of these glaciers are valley glaciers (~80%) or hanging glaciers within rugged and steep terrains. Consequently, the glacier 3D surface area is 38.1% larger than their 2D planar area in the Muzart Glacier Catchment [20]. There are the two largest debris-covered glaciers in China around the Tuomuer Peak. The Tuomuer Glaciers had a debris-covered area of 63 km2 (17% of its total area), and the Tugbelqi glaciers had a debris-covered area of 39 km2 (13% of its total area) [16].
Central Tianshan provides critical water resources for the surrounding streams, oasis wetland, farmland, industry and urban areas via summer rainfall runoff, snow and glacier melting. The annual precipitation in the high mountains (400–600 mm) is two to three times as much as it is in the lowland valley [5]. Over 70% of the streamflow in the Tarim River (south) comes from Central Tianshan via its main tributaries of Aksu River, Tailan River and Muzart River [27]. In the Ili River Basin (north), the Tekes River collects surface runoff from the northern sides of Central Tianshan, contributes the primary streamflow for the downstream Ili River, and finally flows into the Lake Balkhash in Kazakhstan. The west-facing and V-shaped Ili River Valley is surrounded by the Tianshan Mountains on three sides, which form a humid and temperate climate in spite of being distant from oceans. This valley is the precipitation center of the Tianshan Mountains [18]. Glacier melt is a good buffer against severe droughts, and glacier changes in the high mountains considerably affect the regional water supply in the surrounding lowland areas [3,18].
2.2. Data Sets
Multiple Landsat images are acquired to map the glacier area changes from 1989 to 2015, including Landsat 5 thematic mapper (TM), Landsat 7 enhanced thematic mapper plus (ETM+), and Landsat 8 operational land imager (OLI) (Table 1). All Landsat images are downloaded from the USGS Global Visualization Viewer (http://glovis.usgs.gov). They are orthorectified images and re-projected into 1984 World Geodetic System (WGS) Universal Transverse Mercator (UTM) zone N44 projection. Four tiles of Landsat images are needed to cover the entire study areas (Figure 1), and most of glaciers distribute within the image of 147/031 (path/row, Table 1). These images in each time period span two to three years in order to select the optimal ones with minimum cloud and seasonal snow cover. Both cloud and seasonal snow cover are the most important factors affecting the accuracy of glacier classifications [28]. Meanwhile, a suitable high-resolution GeoEye01 (nominal 4-m spatial resolution) acquired on 29 July 2013 is downloaded to validate the glacier outline derived from Landsat images acquired on 31 July 2013.
The derived glacier areas in this study are also compared to those from WGI (CGI1) and GLIMS (CGI2). CGI1 and CGI2 are downloaded from the West Data Center for Glaciology and Geocryology(WDCGG), Lanzhou, China at http://wdcdgg.westgis.ac.cn/ [29]. WGI and GLIMS) are downloaded from the US National Snow and Ice Data Center (NSIDC, http://nsidc.org). Table 2 summarizes the features of those products [13,14,15].
CGI1 was compiled mainly from different aerial photographs acquired during the 1950s–1980s (simplified as 1970s hereafter), which spans a long period and cannot easily represent the contemporary glacier status in China. CGI2 was derived from 218 Landsat TM/ETM+ scenes (30 m of spatial resolution) acquired mainly from 2006 to 2010 by using the band ratio segmentation method [16]. Those images of 2006–2007 used in this study are the same as those used in CGI2. Glacier positioning errors were about 10 m for clean-ice outlines and 30 m for debris-covered outlines, and area errors were 3.2% [16]. Both CGI1 and CGI2 are the original data sources of WGI and GLIMS in China.
WGI contains over 130,000 glaciers and is based primarily on aerial photographs and maps like CGI1. Inventory parameters normally include geographic location, 2D area, length, orientation, elevation, and classification, whereas most original glaciers have one data entry and are viewed as a snapshot of the glacier distribution in the second half of the 20th century [15]. GLIMS is an international joint effort with over 60 institutes world-wide to repeatedly survey of the world’s 200,000 glaciers from space. The primary data sources used in GLIMS are collected by the Advanced Spaceborne Thermal Emission and Reflection Radiometer (ASTER) instrument aboard the Terra satellite and the Landsat series of satellites, along with historical information derived from maps and aerial photographs (Table 2). The goal of GLIMS is to create a globally comprehensive inventory of land ice including measurements of glacier area, geometry, surface velocity, and snow line elevation [14].
The ASTER Global Digital Elevation Model (GDEM) Version 2 (V2) data were downloaded from Japan Space Systems (http://gdem.ersdac. jspacesystems.or.jp/), and had a 30-m spatial resolution, 17-m vertical accuracies and 71-m horizontal accuracies [30] (Frey and Paul, 2012). It is used to establish the Triangulated Irregular Network (TIN) 3D surface model, delineate the glacier catchment, compute slopes and aspects, and classify elevation bands in this study.
The daily precipitation and daily mean air temperature data were downloaded from the Global Historical Climatology Network (GHCN), http://www.ncdc.noaa.gov/oa/climate/. These GHCN stations are distributed at lower elevation ranges below the study area in Xinjiang Uygur Autonomous Region of China, and the two nearby stations are located in Paicheng County of the lower Muzart River Basin and in Aksu County of the lower Aksu River Basin (Figure 1). The time spans from 1961 to 2015.
3. Analytical Methods
3.1. Extraction of Glacier Outlines
3.1.1. Object-Based Image Classification
The actual terminus of supraglacial debris cover is difficult to delineate by general image classification because of their similar spectral signature with adjacent periglacier debris [9]. Although there are large areas of debris-covered glaciers (729 km2 in 2007) in the Central Tianshan (Southern Inylchek, Tomur, and Koxkar glacier) and their surface thinning is considerable, their areas were relatively stable and only shrank slightly by 1.7 ± 4.8% from 1975 to 2008 [27,31]. Therefore, this study only focuses on clean ice mapping and change analysis from Landsat images using the object-based classification approach, which makes full use of the image reflectance, texture and topographic information and is efficient in manual correction after the initial classification [20].
It is quite advanced to map the clean ice glaciers based on optical satellite images, such as the normalized difference of snow cover index (NDSI) used in the MODIS snow cover product [32], band ratios of b3/b5 used in CGI2 [16], and object-based classification [33,34,35,36]. The object-based classification approach is applied in this study to delineate the glacier area in software eCognition 9.0 (Trimble Inc., Sunnyvale, CA, USA). The specific procedures are illustrated in Figure 2.
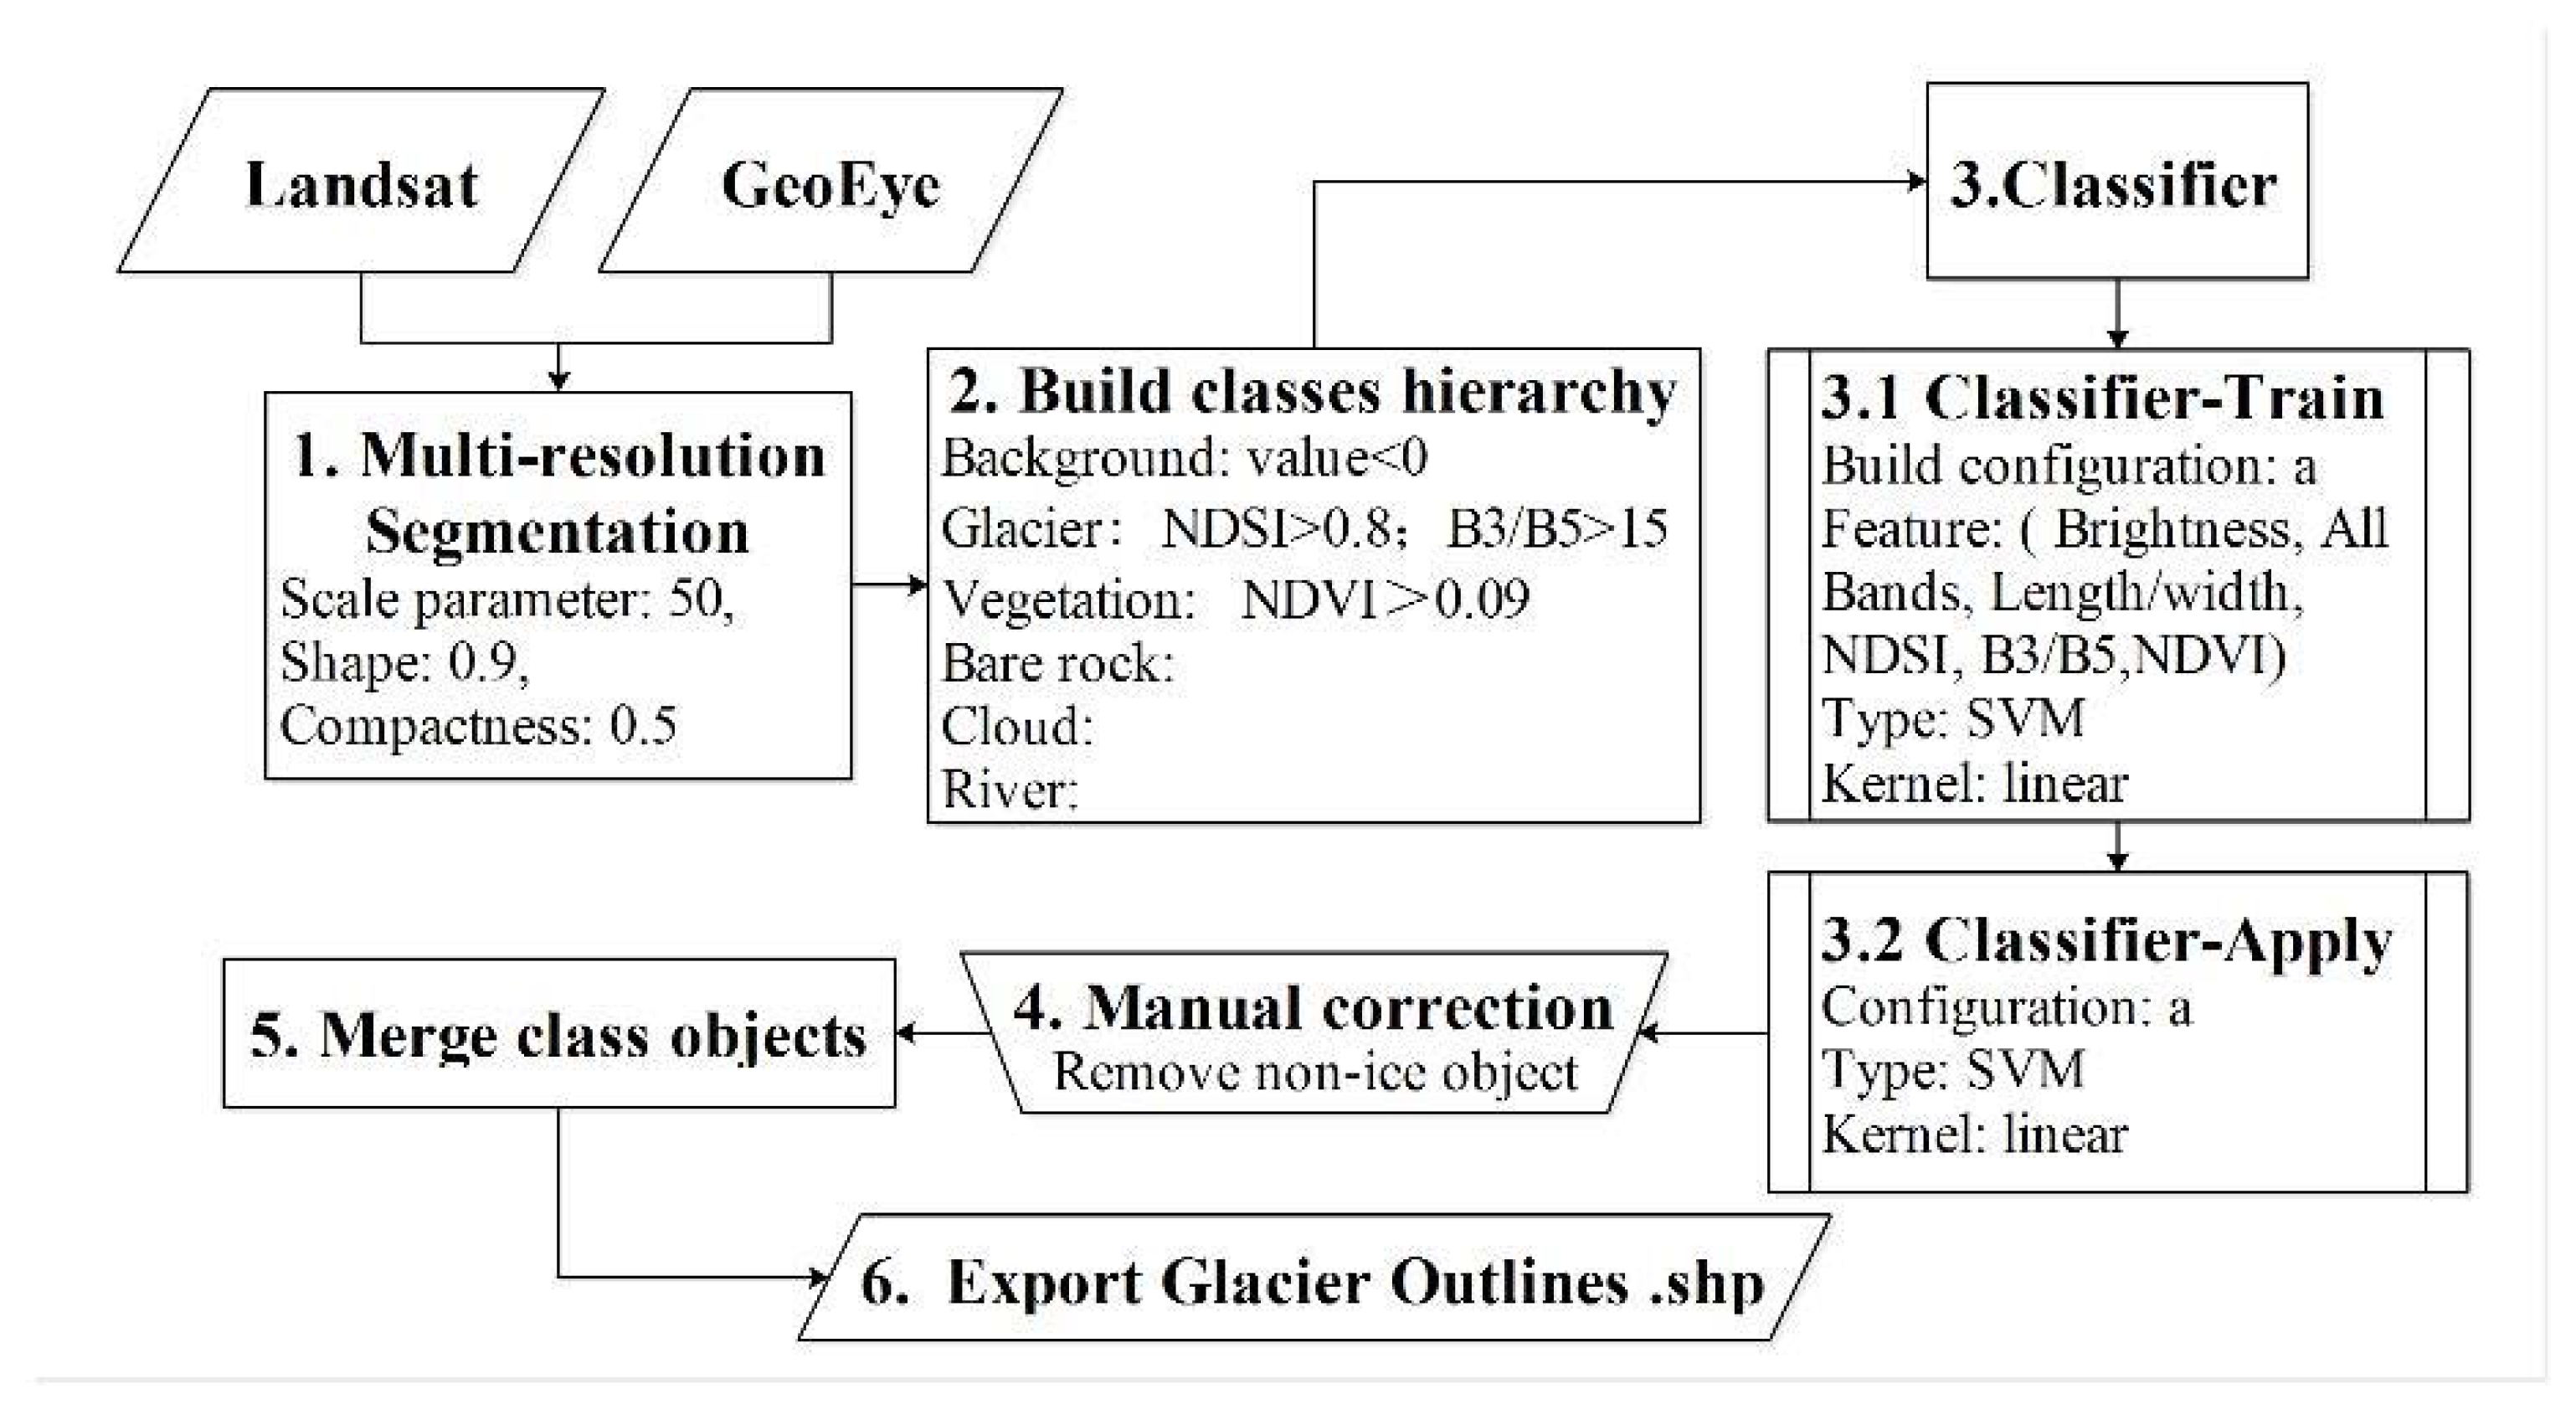
The object-based image classification method mainly includes three steps [37]. The first step is image segmentation with a multi-resolution segmentation method. It minimizes the mean heterogeneity of image objects for a given resolution and maximizes their respective homogeneity by a bottom-up segmentation algorithm. The original Landsat (GeoEye01) images are first segmented into different pixel patches (objects) using a scale parameter of 50, shape factor of 0.9 and compactness factor of 0.5. The scale parameter determines the size of image objects and is obtained by using try-and-error analysis. The value of the Shape factor determines the weight of the Shape and Color criteria, here Shape = 0.9 (allowed maximum value), and Color = 1-Shape = 0.1, which indicates that objects are optimized for spatial homogeneity or shape, instead of color. The value of the Compactness factor = 0.5, which indicates a neutral option between compact and non-compact objects.
The second step is to build the class hierarchy, which determines the classified classes’ name and variable thresholds in the classification. All pixels within an object are classified into 6 classes. Background: value < 0, non classification area; Glaciers: NDSI > 0.8 and B3/B5 > 15, the criteria for class Glaciers; Vegetation: NDVI > 0.09, the criteria for class Vegetation; Other classes such as Bare rock, Cloud and River do not set classification criteria and will be determined using known features during the Classifier-training.
The third step is to build and apply the classifier. The first step is to train a classifier using the classified objects in the class hierarchy domain. Then, build the configuration: a, which is a self-built classification configuration using the class hierarchy and various features. The classifier-Train is built using the Support Vector Machine (SVM) with a linear kernel [38] based on features such as Brightness, Reflectance from all bands, Length/Width, NDSI, B3/B5, and NDVI of the classified objects. The built configuration is then applied to classify all pixels within each segment into glaciers and non-glaciers such as vegetation, bare rock, river and cloud using SVM and the linear kernel.
The classified images are manually corrected by visual comparison with images acquired in different years. Finally, the classified objects are merged and exported to vector polygons for further visually checking and manual edition in ArcMap, eliminating misclassified pro-glacial water and shadow areas by overlaying with DEM data and Google Earth images [20]. The unidentified and cloud-blocked areas (~3% of total glacier areas) in any time period are excluded for the area change analysis for the four periods.
3.1.2. Glacier Combination from Different Tiles
The time of summer minimum snow cover in these areas was in August and early September based on our analysis using the improved daily cloud-free MODIS snow cover product [39]. In order to obtain the optimal images for minimum cloud and snow cover, the selected four Landsat images (tiles) covering the study areas were acquired on different dates and even in different years (Table 1). The four images have about 10% overlap among their boundaries, and image 147/031 and image 146/031 have most glaciers (Figure 1). Therefore, each Landsat image is first subjected to glacier classification separately, and then the four classification images are combined into one image to cover the study area based on a priority scheme. Images of 147/031 (Path/Row), 146/031, 146/030 and 147/030 have the first, second, third and fourth priority in combination, respectively. In other words, the final glacier map is primarily (85%) based on the image 147/031, and the gap areas are complemented by the image 146/031, 146/030 and 147/030 subsequently.
3.2. Assessment of Glacier Outlines
The object-based classification approach is first validated by comparing glacier outlines derived from a high resolution GeoEye01 image acquired on 29 July 2013 and those derived from Landsat images on 31 July 2013 in the upper Koxqar Baqi Glacier Catchment (Figure 1), since there was no high spatial resolution image available on the date of the Landsat images, i.e., on 24 August 2007 or 15 August 2015 for the image 147/031. The selected validation images were constrained by the limited cloud-free high spatial resolution images and the Landsat images on the same summer date in the study area. The GeoEye01 image was also processed through the object-based image classification method.The derived glacier outlines are illustrated for detailed comparisons with CGI2 and GLIMS in the Tuomuer and Mushketoy Glacier Catchments. Glaciers are also compared with those of CGI2/GLIMS on the entire Central Tianshan. This study only maps clean ice, while both GLIMS and CGI2 include debris-covered glaciers. For better comparison, the debris-covered glaciers are cut off from GLIMS and CGI2 by manually delineating the lower edge of clean ice over Landsat images (bands combination of 5, 4, 3) [9]. All glacier comparisons are carried out by spatial intersection and are summarzied in an error matrix table.
The uncertainty of glacier position caused by the comparison among different image cources is limited [40]. The spatial resolutions are 28.5 m for Landsat images and 4 m for GeoEye01 images, and the mean error of images geolocation is 19.5 m. According to the uncertainty computation equation used in Ye et al. [41], the uncertainty for glacier comparison between Landsat images and GeoEye01 images is computed as 0.012 km2, and 0.016 km2 for those between Landsat images in different time. These uncertainties due to different image sources are relatively small compared to the large glacier areas of about 4000 km2 [41,42]. Glacier areas are rounded to 0.1 km2 for validation and 1 km2 for change analysis on Central Tianshan in different periods.
3.3. Computation of 3D Surface Areas
The solid 3D earth surface is usually represented by a raster model like Digital Elevation Model (DEM) or a Triangulated Irregular Network (TIN) model. DEM is a continuous raster surface interpolated from discrete grid elevation by bilinear interpolation [43]. The 3D surface area in each grid can be estimated from its 2D area and slope (called raster areas), or directly calculated from 8 3-dimensional triangles that are generated from the elevation of a 3 × 3 grid window by connecting each grid center point with the center points of the 8 adjacent grids [44]. TINs are continuous vector surfaces, and the 3D surface area can be precisely measured from the facets of TINs (called polygon areas) and clipped to a certain polygon. The 3D surface areas calculated from a 3 × 3 grid window of DEM are consistently close (error < 0.1%) to the TIN-based area value at grid counts above 250 [44]. The raster surface area is lower than that computed from a 3 × 3 grid window and the TIN-based polygon areas by −1.38% for a 2D area of 162 km2 and a slope of 28.5°, and the relative difference is even larger for smaller areas [45].
Although the raster surface areas are much faster in computing and are better for neighborhood analysis, they are not accurate in clipping to a specific polygon, especially for small polygons. Therefore, glacier 3D surface areas in this study are computed by the TIN surface for the entire study area, the 500-m elevation bands from 2500 to 6000 m, the 10-degree slope zones from 0–90 degree, the eight aspect fields, and the natural glacier catchments (Figure 1), i.e., Tekes (North), Kumeric/Aksu (West), Tailan, Muzart and Karasu Rivers (South), respectively. The TIN surface is established using the ASTER GDEM V2 data based on a Delaunay triangulation with an elevation tolerance of 5 m, ~1/1000 of the elevation range from 2500 to 7400 m [43,44]. The glacier outlines are first clipped into different elevation bands, slope zones, aspect fields and river catchments. The elevation bands are directly grouped from GDEM data and are converted into polygons. Slope zones and aspect fields are reclassified from the slope raster and aspect raster computed from GDEM data and are converted into polygons. Then, the 3D polygon areas are computed by overlapping the clipped glacier polygons onto the TIN surface via the Polygon Volume tool in software ArcMap 10.3.
The elevation tolerance of 5 m in building TIN surface from GDEM data is relatively large compared to values used in the literature [43,44]. It is constrained by the allowed maximum number of computing points (~20 million) in ArcMap 10.3 because of the small grid size (30 m) and large study area (23,000 km2). Nevertheless, taking the glacier polygon in 2015 as an example, the glacier 3D areas computed using the TIN surface built by tolerances of 5, 10, 50 and 100 m are 5982, 5973, 5848 and 5774 km2, respectively. The 3D areas from the latter three tolerances are only −0.2%, −2.2% and −3.5% smaller than those by a tolerance of 5 m. This indicates that the TIN surface built by the tolerance of 5 m (and up to 10 m) can obtain a a relatively stable surface extent value, which is likely attributed to the large elevation range (4900 m) and a huge number of computing points/grids (>20 million).
4. Results
4.1. Glacier 2D Area Validation and Comparisons
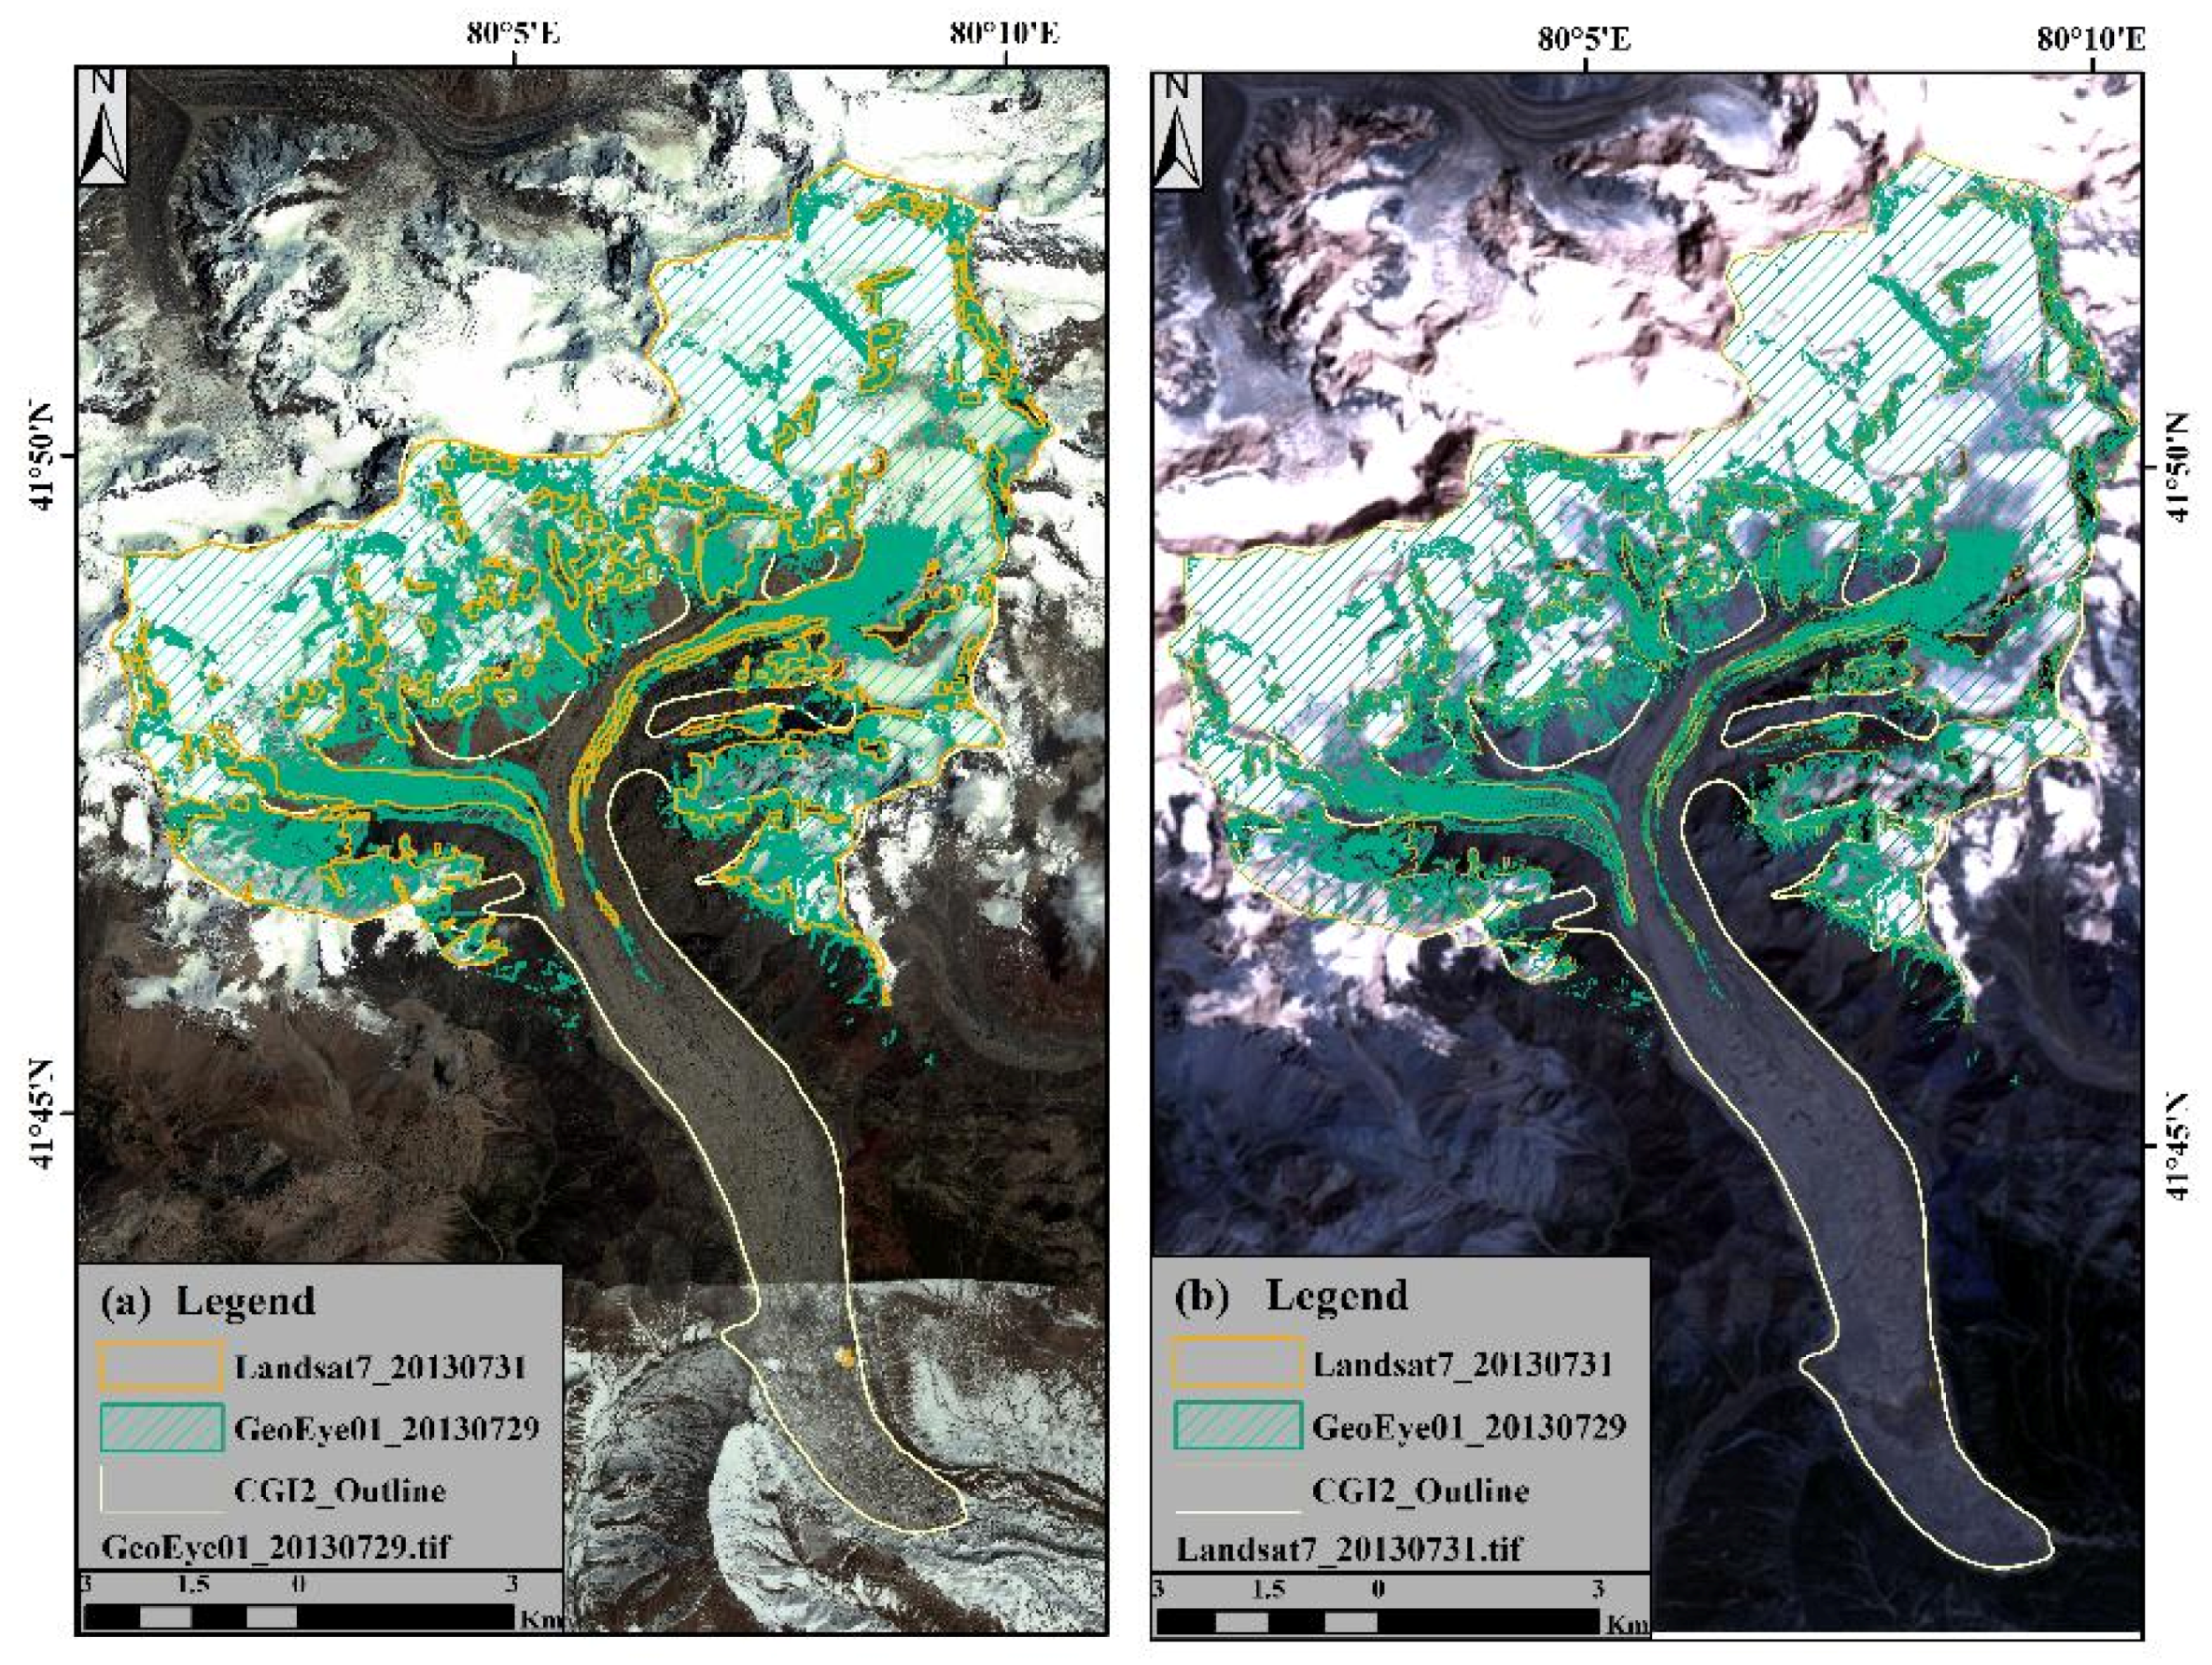
The object-based classification approach utilized in this study is first validated by comparing the glacier areas derived by this approach from a high spatial resolution GeoEye01 image (29 July 2013) and a Landsat image (31 July 2013) in the upper Koxqar Baqi glacier catchment (Figure 1). Their neighboring dates can minimize the impact of seasonal snow cover on glacier identification. Near half of the selected GeoEye01 image area is covered by perennial snow and glacier, and the glacier areas have an agreement of 90.8% by spatial intersection (Table 3). The commission error of the object-based classification approach is 16.7%, which is likely related to the transition pixels and the coarser resolution of Landsat images. The glacier outlines derived from the GeoEye01 image have a similar spatial pattern with those from the Landsat image, and can better capture the smaller glaciers and especially the glaciers’ lower edges/terminus due to their fine spatial resolution (Figure 3), which is also reflected by the omission error of 9.2% from Landsat images.
Compared to CGI2, the glaciers classified in this study only include the clean ice/perennial snow, and a large part of the debris-covered glaciers (18.9 km2) are not included in this study’s glacier classification (Figure 3). Excluding the debris-covered glaciers in CGI2 and by spatial intersection, the 2D areas of clean ice in CGI2 have an agreement of 84.0% with those derived from Landsat images in this study (Table 3). CGI2 has a larger glacier area than that derived in this study, and the omission error is 16.0%. Part of the area difference may be attributed to the glacier melting during the 6 years between 2007 and 2013, while other factors such as classification methods, the existence of the seasonal snow cover on different dates and the identified debris-covered glaciers also contribute to the discrepancy. The commission error is 5.1%, which is much less than that (16.7%) against the GeoEye01 image.
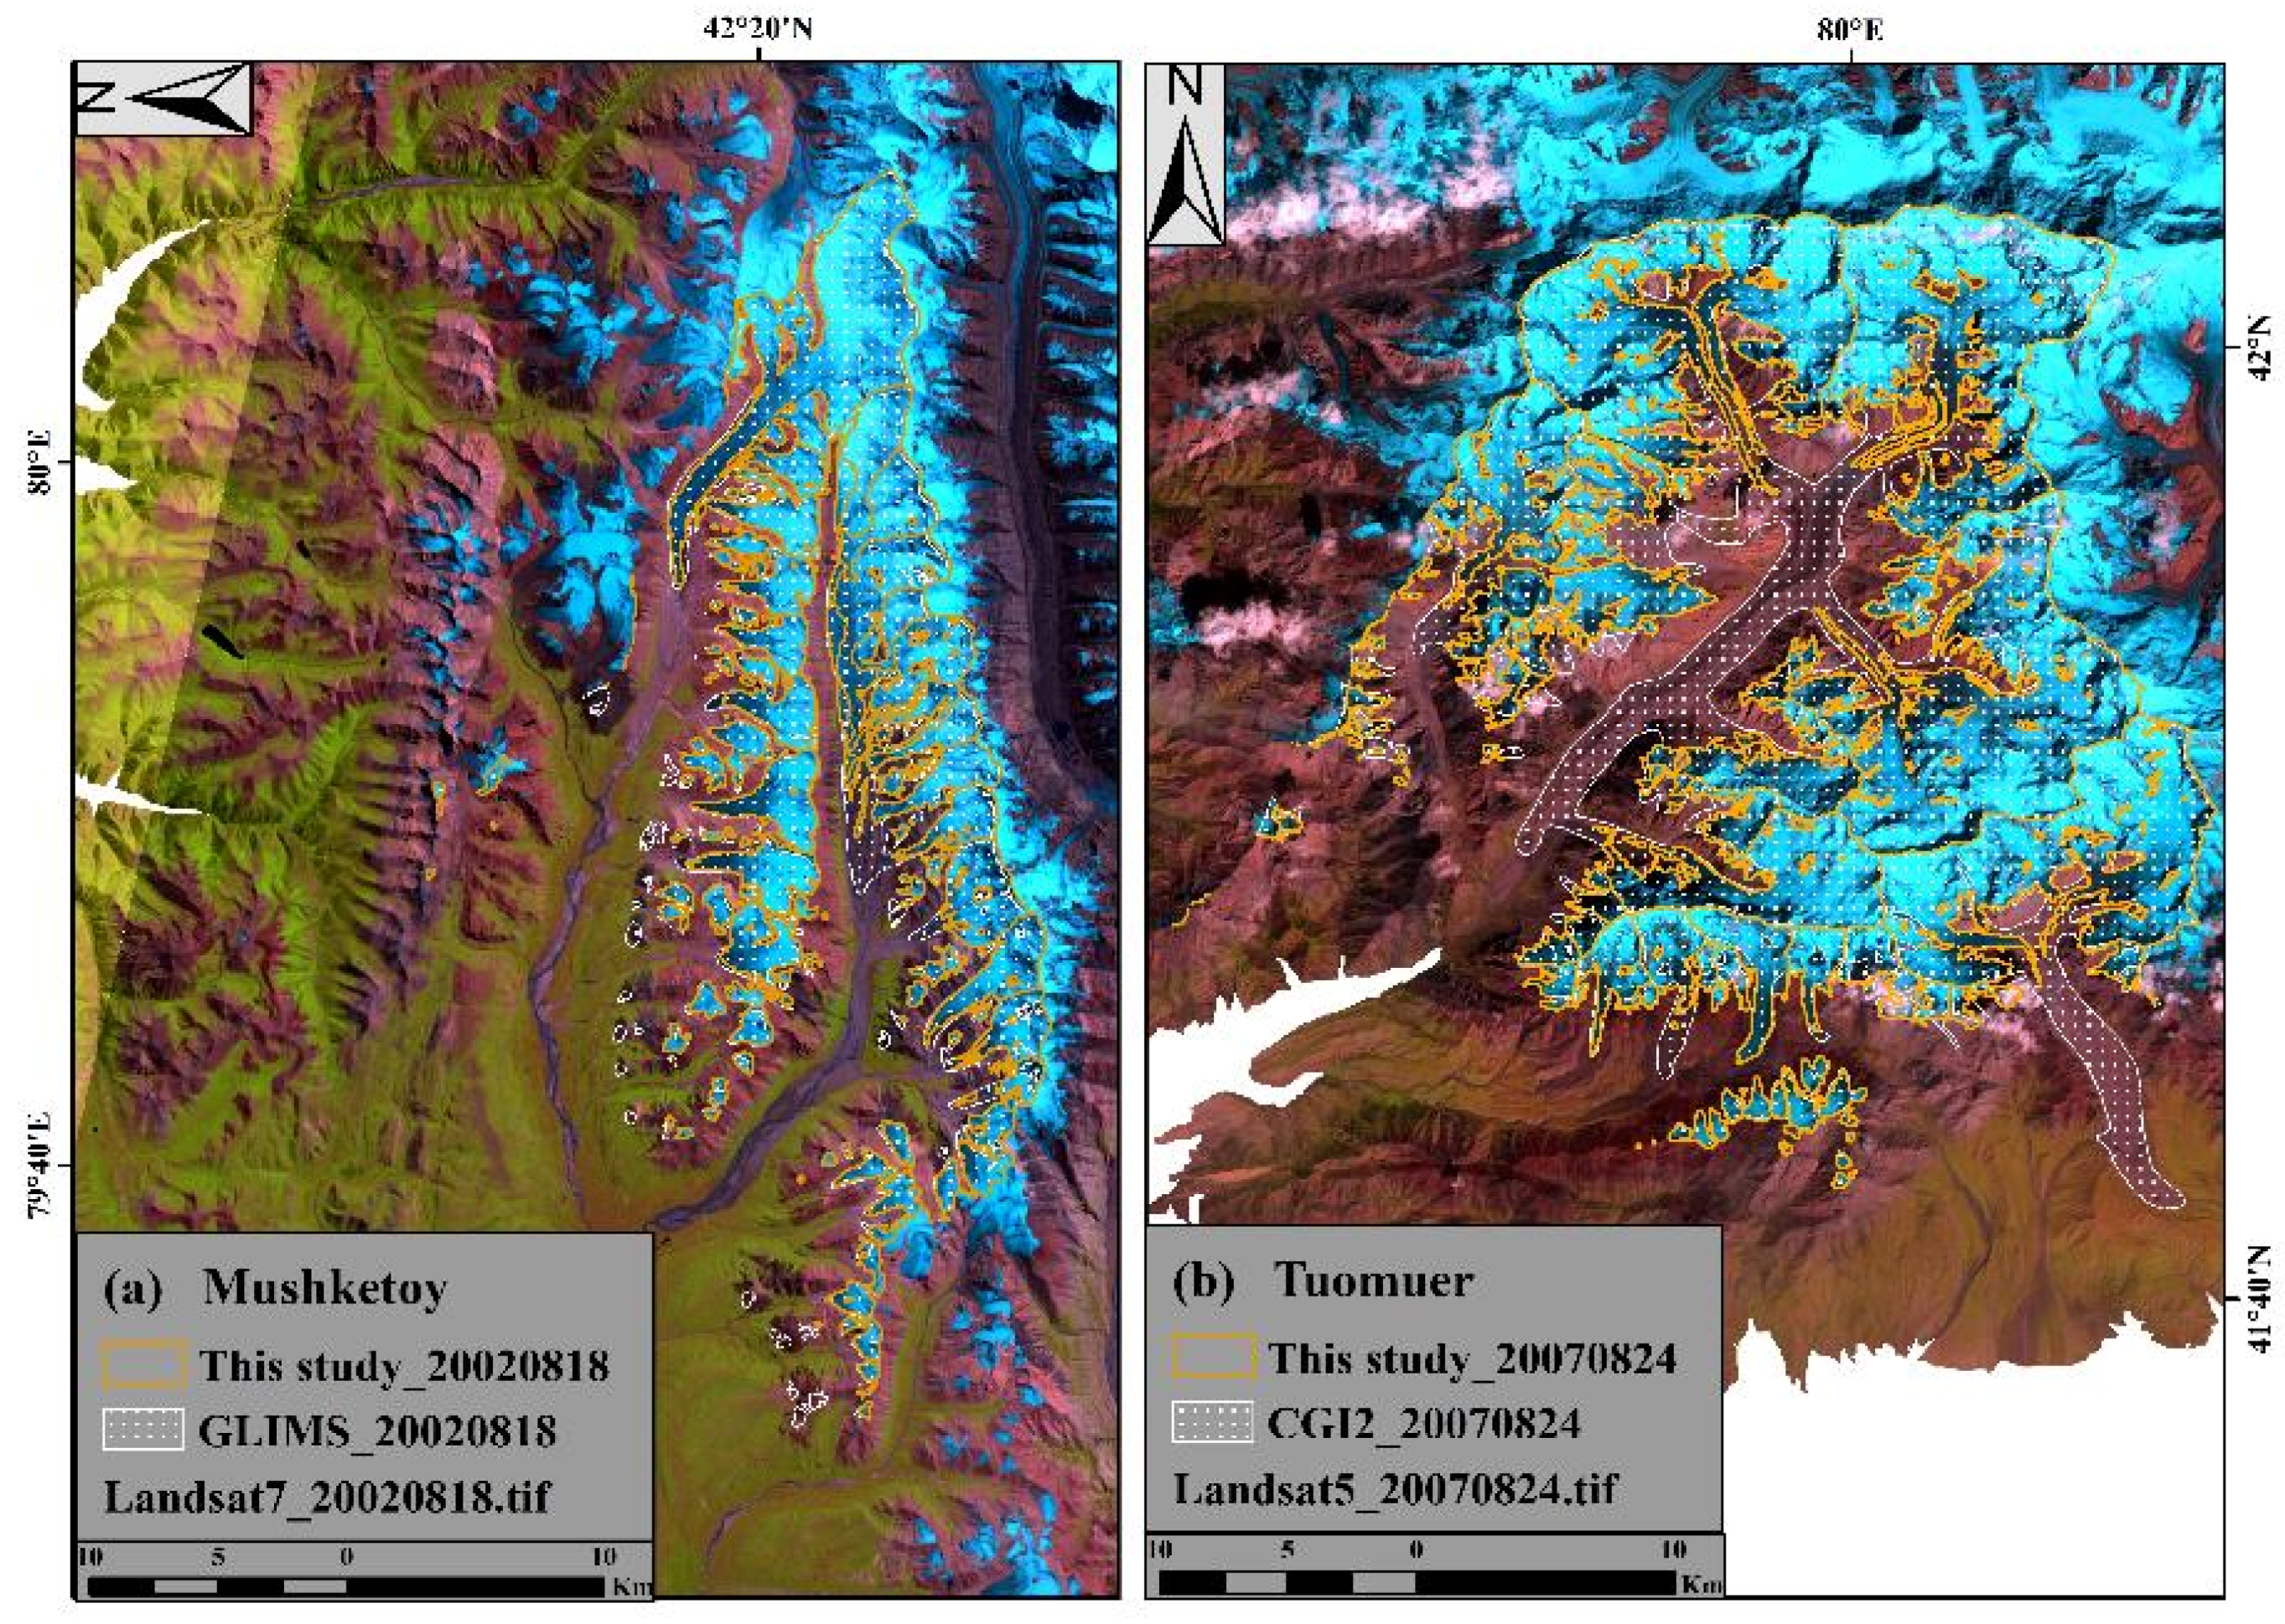
The glacier areas derived from this study are further compared to CGI2 and GLIMS in the Mushketoy and Tuomuer Glacier Catchments (Figure 4 and Table 4). The Mushketoy Glacier Catchment mainly faces west in Kyrgyzstan. They are typically hanging glaciers. The total glacier areas are 236 km2, including 23 km2 (9.8%) of debris-covered glaciers according to GLIMS. The glacier outlines derived in this study have a good spatial agreement with GLIMS (Figure 4a) except for the debris-covered glaciers at the lower edges and about 30 small isolated hanging glaciers labeled in GLIMS and identified in Google Earth images at the northern sides. There are 222 km2 of clean ice derived in this study using the same Landsat image acquired on 18 August 2002 as GLIMS, and their agreement is 97.7% by spatial intersection (Table 4).
The Tuomuer Glacier Catchment lies in China and mainly faces south and southwest (Figure 4b). They are valley glaciers and have 116 km2 (18.8%) of debris-covered glaciers among the total 613 km2 glaciers according to CGI2 (Table 4). The glacier outliness derived in this study have an agreement of 93.4% by spatial intersection with the clean ice of CGI2 after excluding the debris-covered glacier, while their total clean-ice areas have an agreement of 98.8% (Figure 4b).
In the entire Central Tianshan, the clean ice areas derived in this study in 2007 had an agreement of 88.6% by spatial intersection with those of CGI2 and GLIMS after excluding the debris-covered glaciers, which were 729 km2 and 13.5% of the total glacier areas (Table 4). A similar ratio of debris-covered glaciers (14%) was reported in this region according to CGI2 (Guo et al., 2015). Their total clean-ice areas in 2007 were almost the same (Table 4, Figure 5). The complex topography, shadowing, seasonal snow and cloud cover together make it challenging to accurately delineate the glacier outlines at the regional scale.
4.2. Glaciers Changes
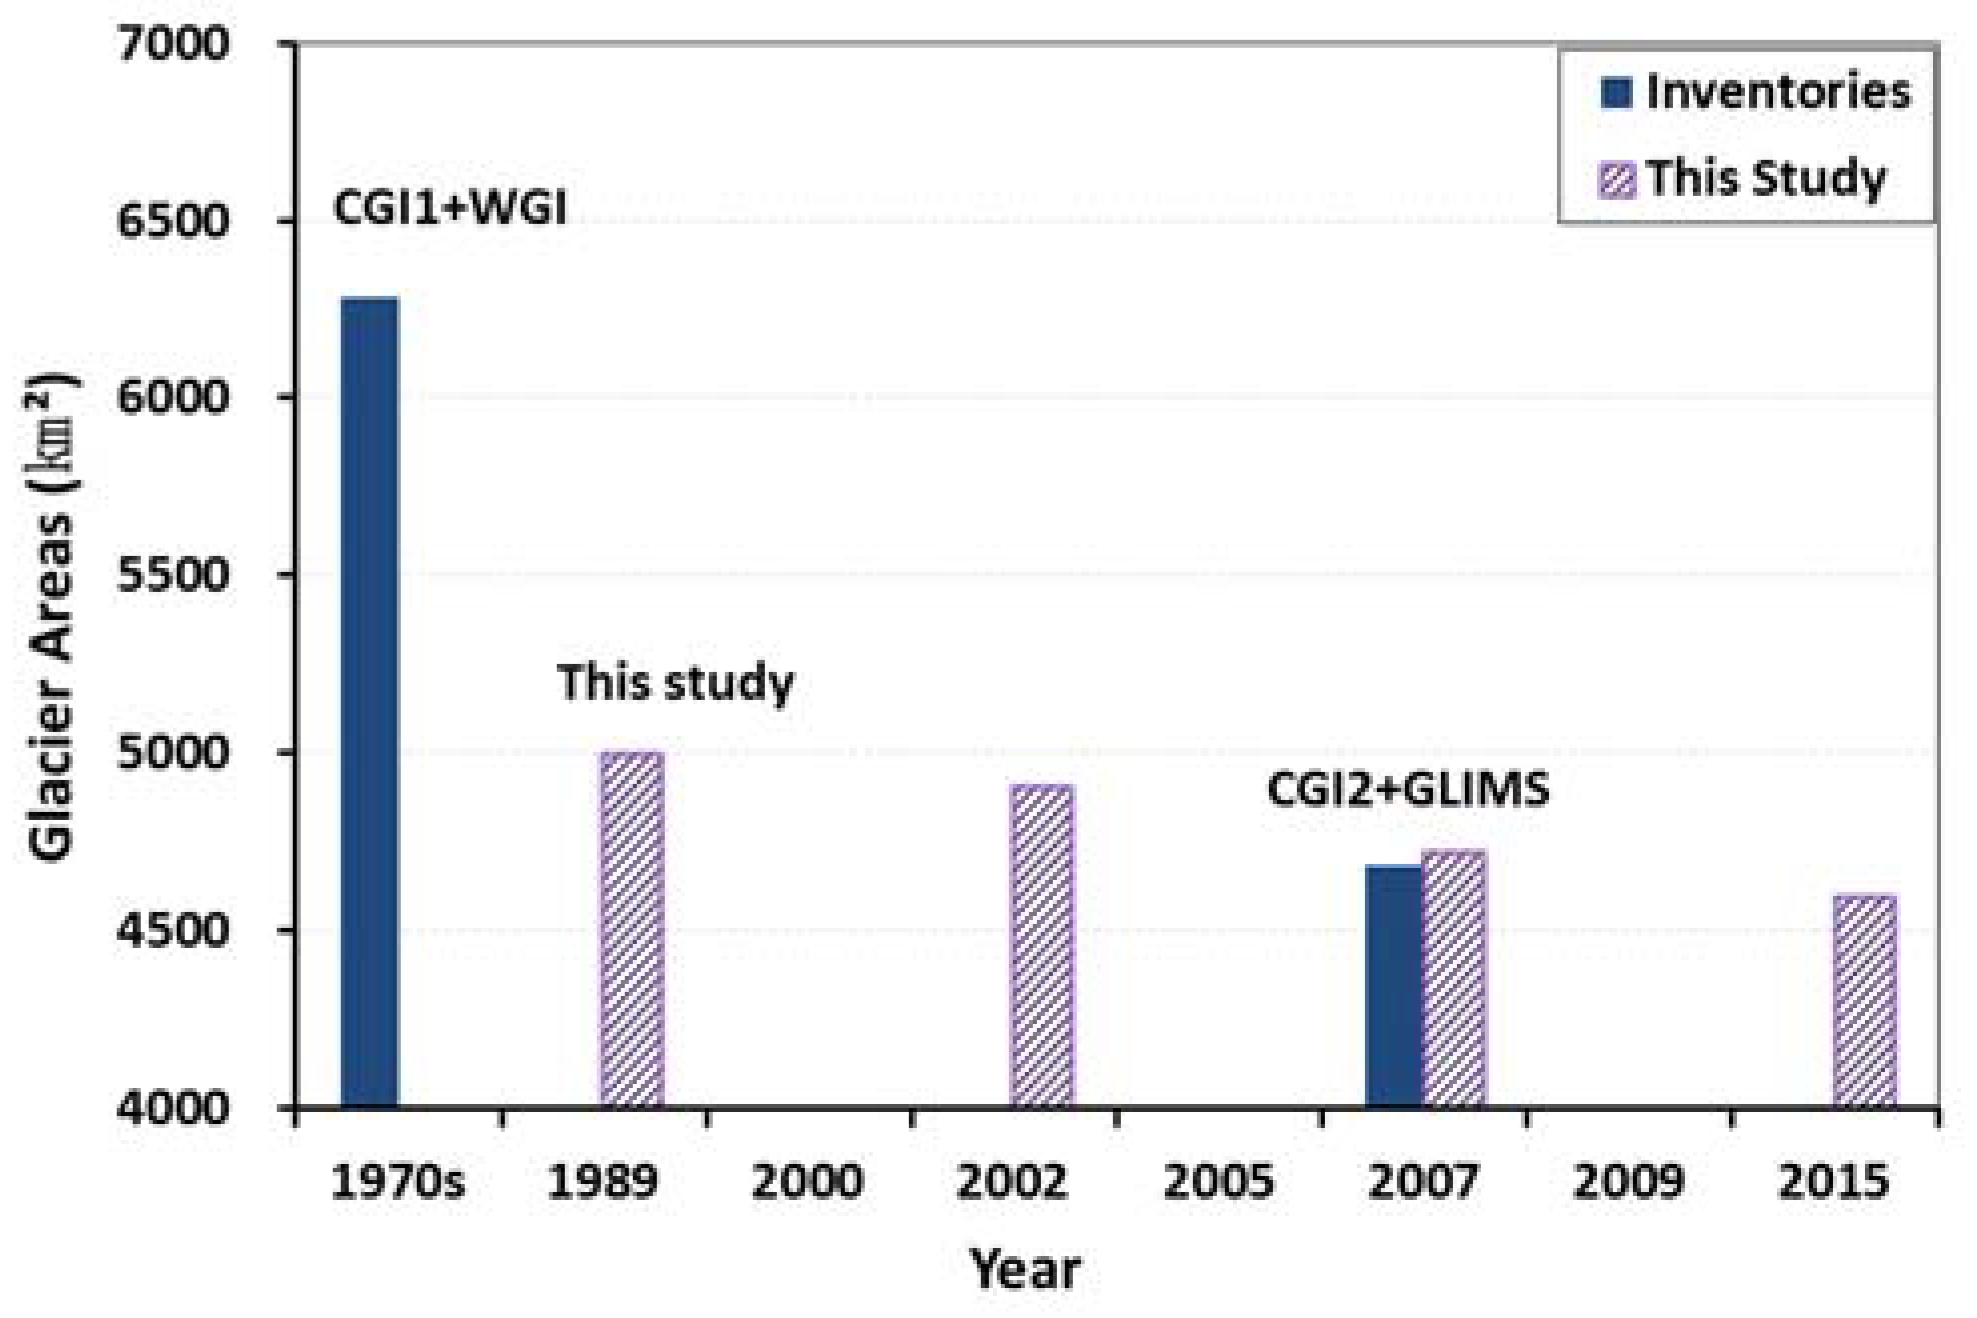
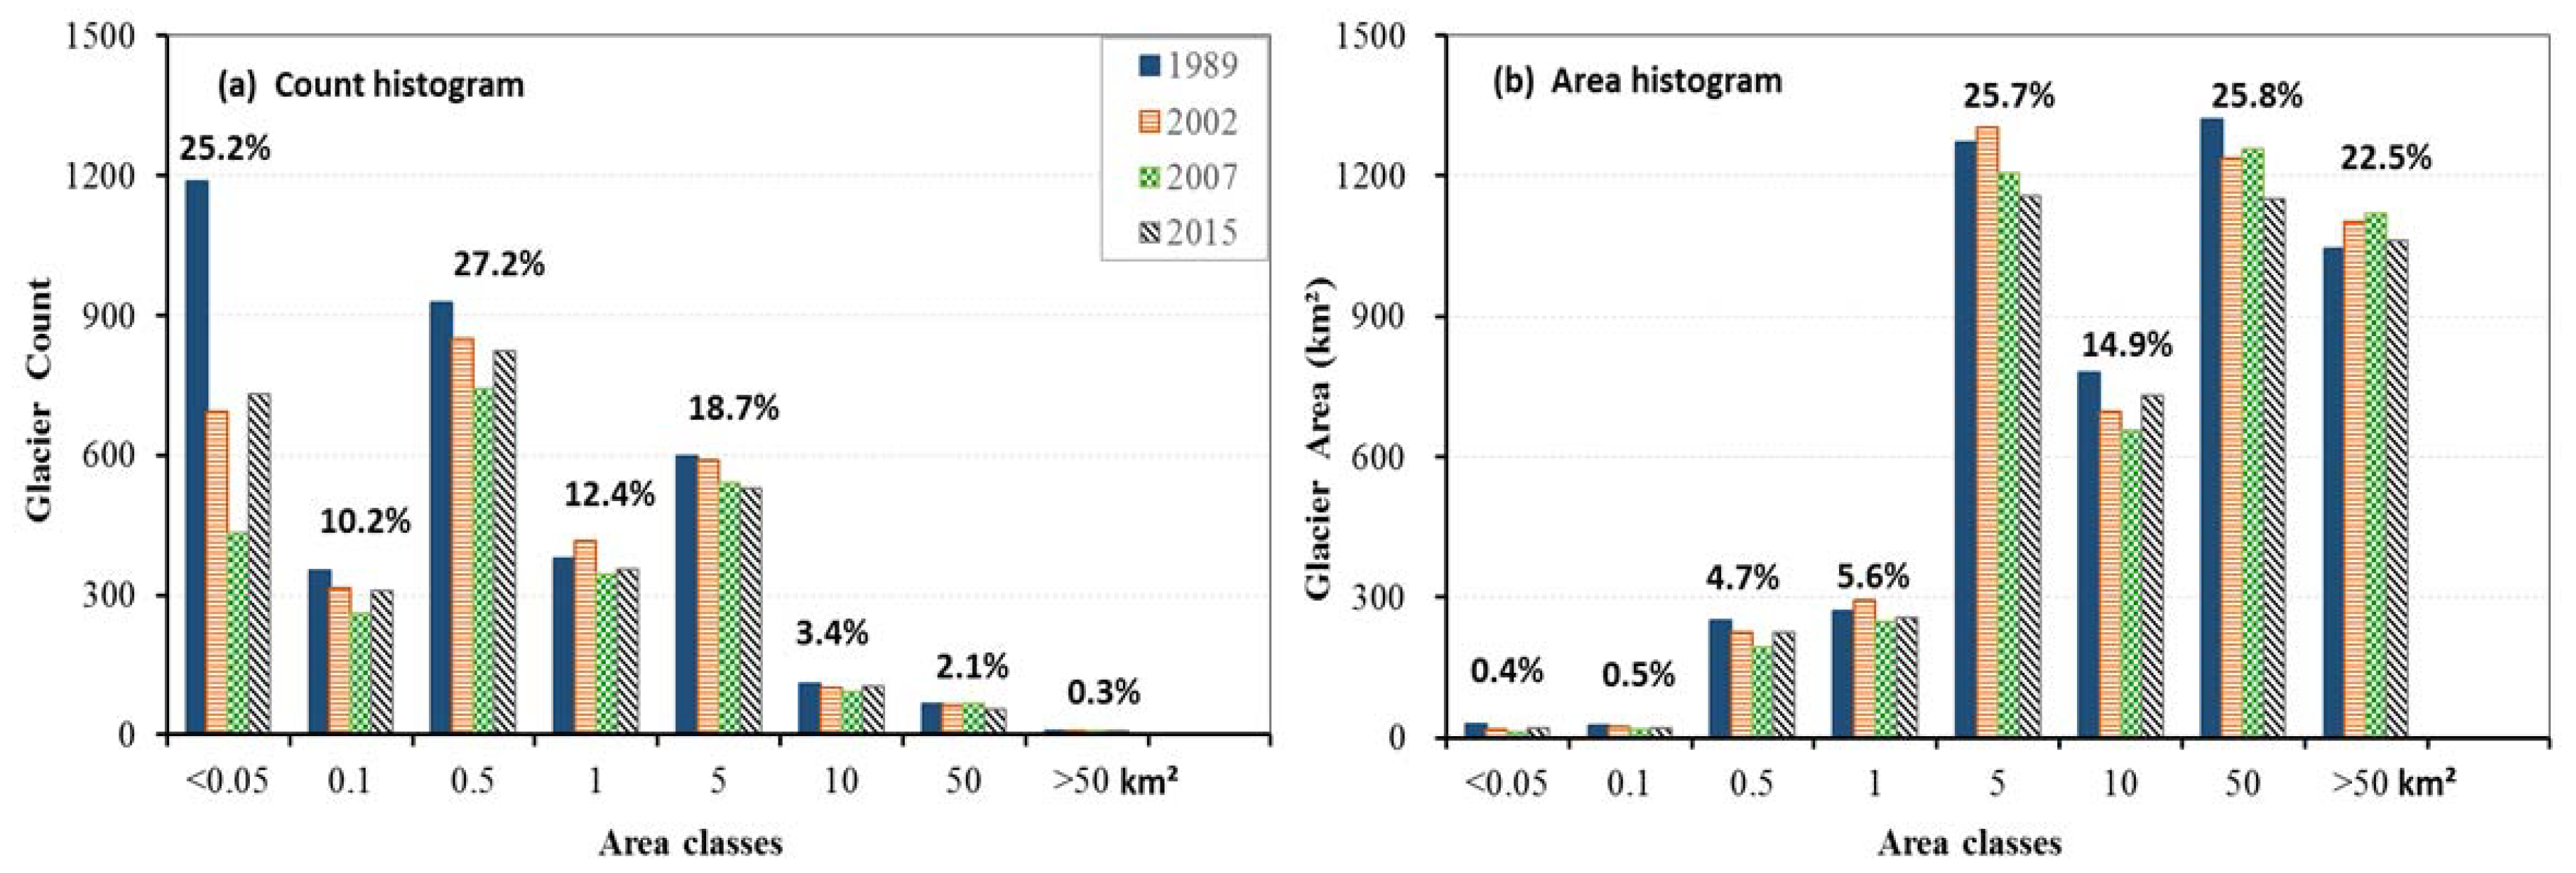
There are over three thousands of glaciers in Central Tianshan. The small glaciers dominate the number (i.e., count), while the large glaciers have the most areas (Figure 6). Those with areas < 1 km2 contribute 75.5% in terms of the number of glaciers, but only 11.2% in terms of area. Those with areas > 10 km2 contribute 2.4% in terms of the number of glaciers and cover 48.3% of the area. Both the glacier number and area have been changing dynamically. According to GLIMS+CGI1 and GLIMS+CGI2, the glacier areas have shrunk −25.1% from 7233 km2 in the 1970s to 5415 km2 in 2007 in Central Tianshan (Table 5). Since both glacier inventories are derived from different sources and methods, it is difficult to assess the exact changes of glaciers by their direct comparison.
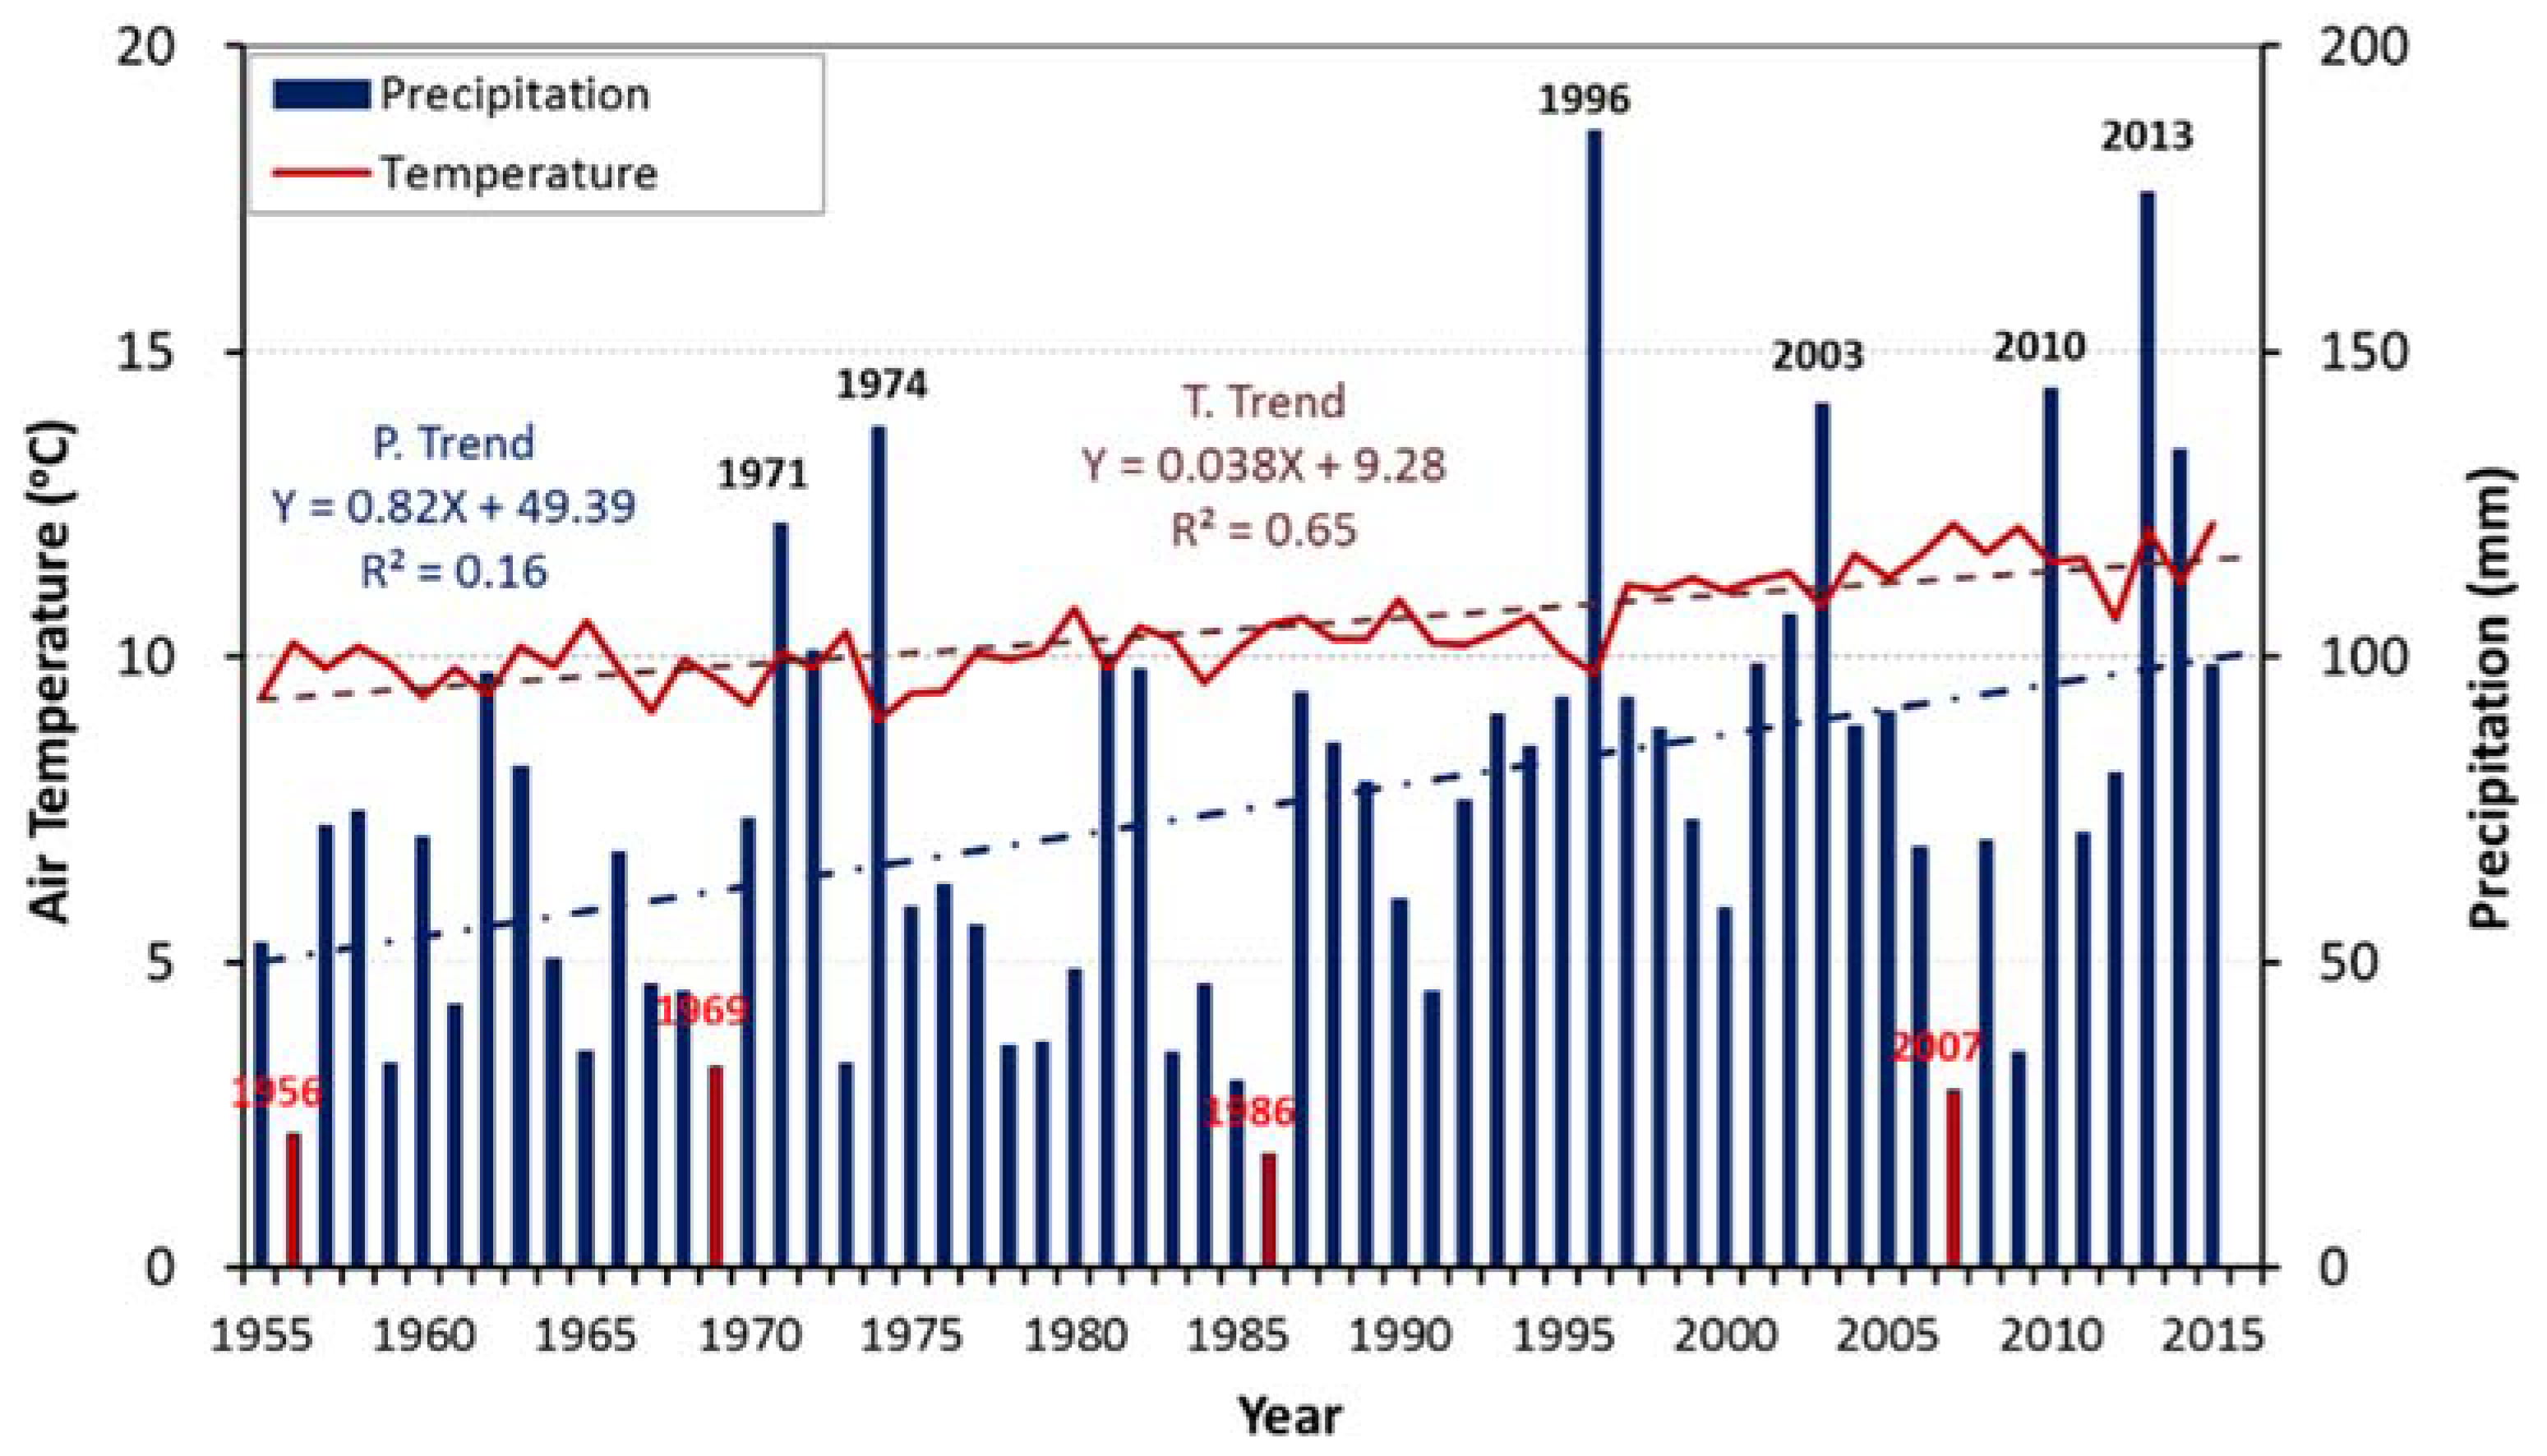
According to the glacier outlines derived from Landsat images by using the same approach in this study, the glacier count (>0.01 km2, clean ice) dramatically declined from 3629 to 2920 (count), and glacier 2D area decreased by −8.1% from 4997 km2 to 4593 km2 between 2015 and 1989 (Figure 5 and Figure 6, Table 5). The number of small glaciers with area < 0.05 km2 have the largest reduction from 1989 to 2002, and the total areas of the small glaciers also shrunk at a much large rate than the large ones (Figure 6). During those four periods, the total glacier areas in Central Tianshan were relatively stable (−1.8%) during the first 13 years between 2002 and 1989, and decrased by −3.8% during the 5 years between 2007 and 2002, and −2.7% during 8 years between 2015 and 2007. The overall retreating trend and varying rates of glacier areas can be explained by the increase trend and fluctuations of air temperature and precipitation (Figure 7). It was a relatively wet and cool decade in the 1990s, especially the record low air temperature and high precipitation 1996, leading to stable glaciers at the regional scale between 2002 and 1989; in contrast, the record high air temperature and low precipitation in 2007 resulted in the fast reduction of glaciers between 2007 and 2002. With increasing precipitation and declining air temperature as in 2010 and 2013, the shrinkage rates of glaciers slowed down during 2007 and 2015. This further confirms the reliability of the glacier 2D areas derived from Landsat images by the object-based classification in this study.
4.3. Glacier 2D and 3D Area Comparison and Change Analysis
4.3.1. Glacier 3D Area Computation
Glacier 3D areas in this study are computed by the most accurate TIN 3D surface model [44]. Zhang et al. [45] reported that the raster 3D area is −1.4% smaller than the polygon 3D areas computed from a TIN surface model. Our investigations confirm that the raster 3D areas tend to produce smaller 3D areas in two steps (Table 6). In the first step of converting the glacier polygon into glacier raster, e.g., in 2015 over Central Tianshan, the converted raster 2D areas (4341 km2) were −5.5% (−252 km2) smaller than the polygon 2D areas (4593 km2). Consequently, in the second step, the raster 3D areas computed from the raster 2D areas (4341 km2) were −5.9% (−352 km2) smaller than the polygon 3D areas. This results in a much smaller relative difference (RD = 22.6%) of the raster 3D areas compared to their initial 2D polygon areas (4593 km2), while having slightly smaller RD (29.7%) than the TIN polygon 3D areas if they are compared to the converted 2D raster areas (4341 km2). A much larger area loss occurred during the polygon to raster conversions for steep terrains and for smaller polygons due to the fact that grids located cross the polygon boundary are ignored during the conversion [45]. Therefore, it is evident that the polygon 3D area based on the TIN surface model in this study is more accurate than the raster 3D areas, especially for glacier analysis clipping into different elevation bands, slope zones and aspect zones.
4.3.2. Glacier Area Change in Slope Zones
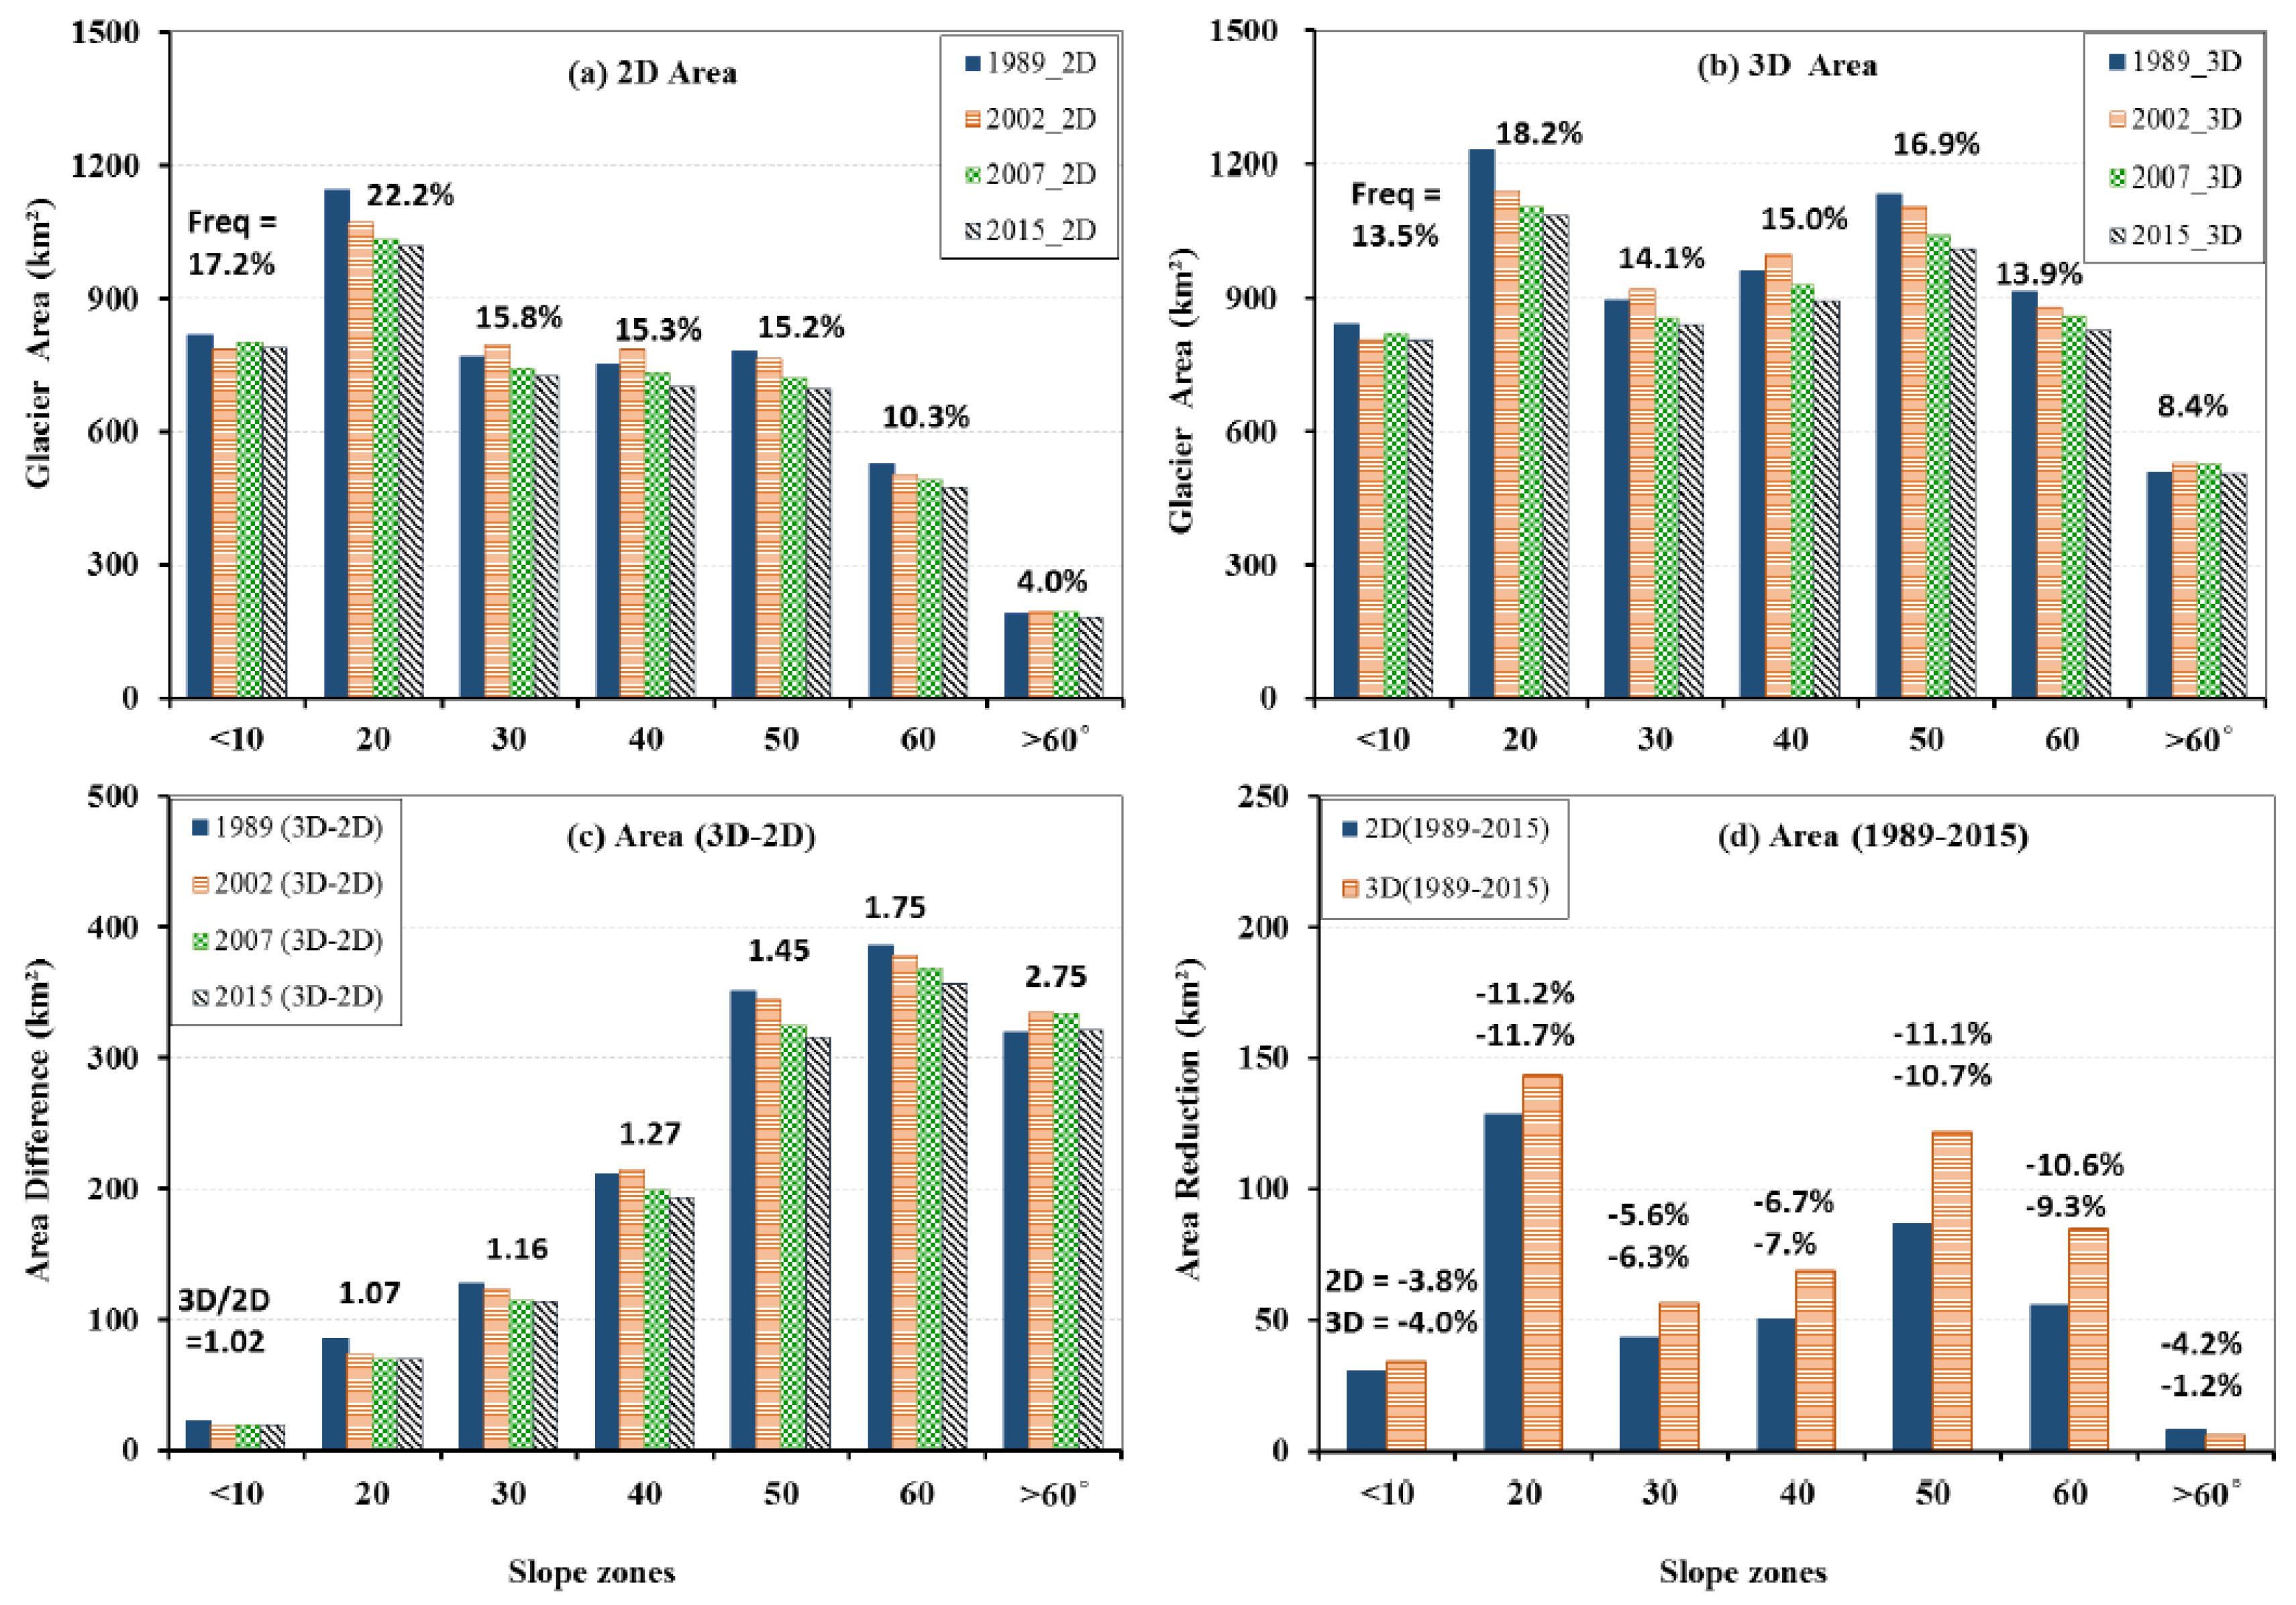
The ratio of the glacier 3D surface extent to the 2D planar areas is determined by and increases with slopes (Figure 8c). Geometrically, the 3D area is 15% larger than the 2D area when the slope angle exceeds 30° and even doubles as it exceeds 60°. For example, there are 44.8% of glaciers’ 2D areas distributed on slope angles larger than 30°, resulting in total of 30.3% larger 3D areas than the 2D area in Central Tianshan in 2015 (Table 5, Figure 8a–c). The shrinkage rates of the 2D areas (−8.1%) were slightly larger than those of the 3D areas (−7.9%) between 2015 and 1989, although their absolute shrinkage areas (−404 km2) were 112 km2 smaller than the 3D area reduction (Figure 8d). The relative difference (RD) between 3D and 2D areas slightly increased from 30.1% in 1989 to 30.3% in 2015 since most of the ice melt occurred at the lower elevation areas with gentler slopes, which is supported by the much smaller RD (27.8%) for the melted ice 3D and 2D areas. The dominant reductions occurred in slope zones of 10–20° and 40–50°.
4.3.3. Glacier Area Change in Elevation Bands
Most (~93%) glaciers were distributed in the elevation bands ranging from 3000 m to 5000 m, especially 39.1% in the 3500–4000 m band (Figure 9a,b), where the 3D areas are 5%, 11%, 22% and 38% larger than their 2D areas within each 500-m elevation band (Figure 9c). From 1989 to 2015, the glaciers demonstrated an overall declining trend in those areas lower than 4500 m. As expected, glaciers in the lower elevation bands had larger shrinkage rates, with the largest retreating areas in the bands of 3000–3500 m. Within elevation zones higher than 4500 m, the glacier areas (18%) were quite stable during the study periods.
4.3.4. Glacier Area Change in Aspect Fields
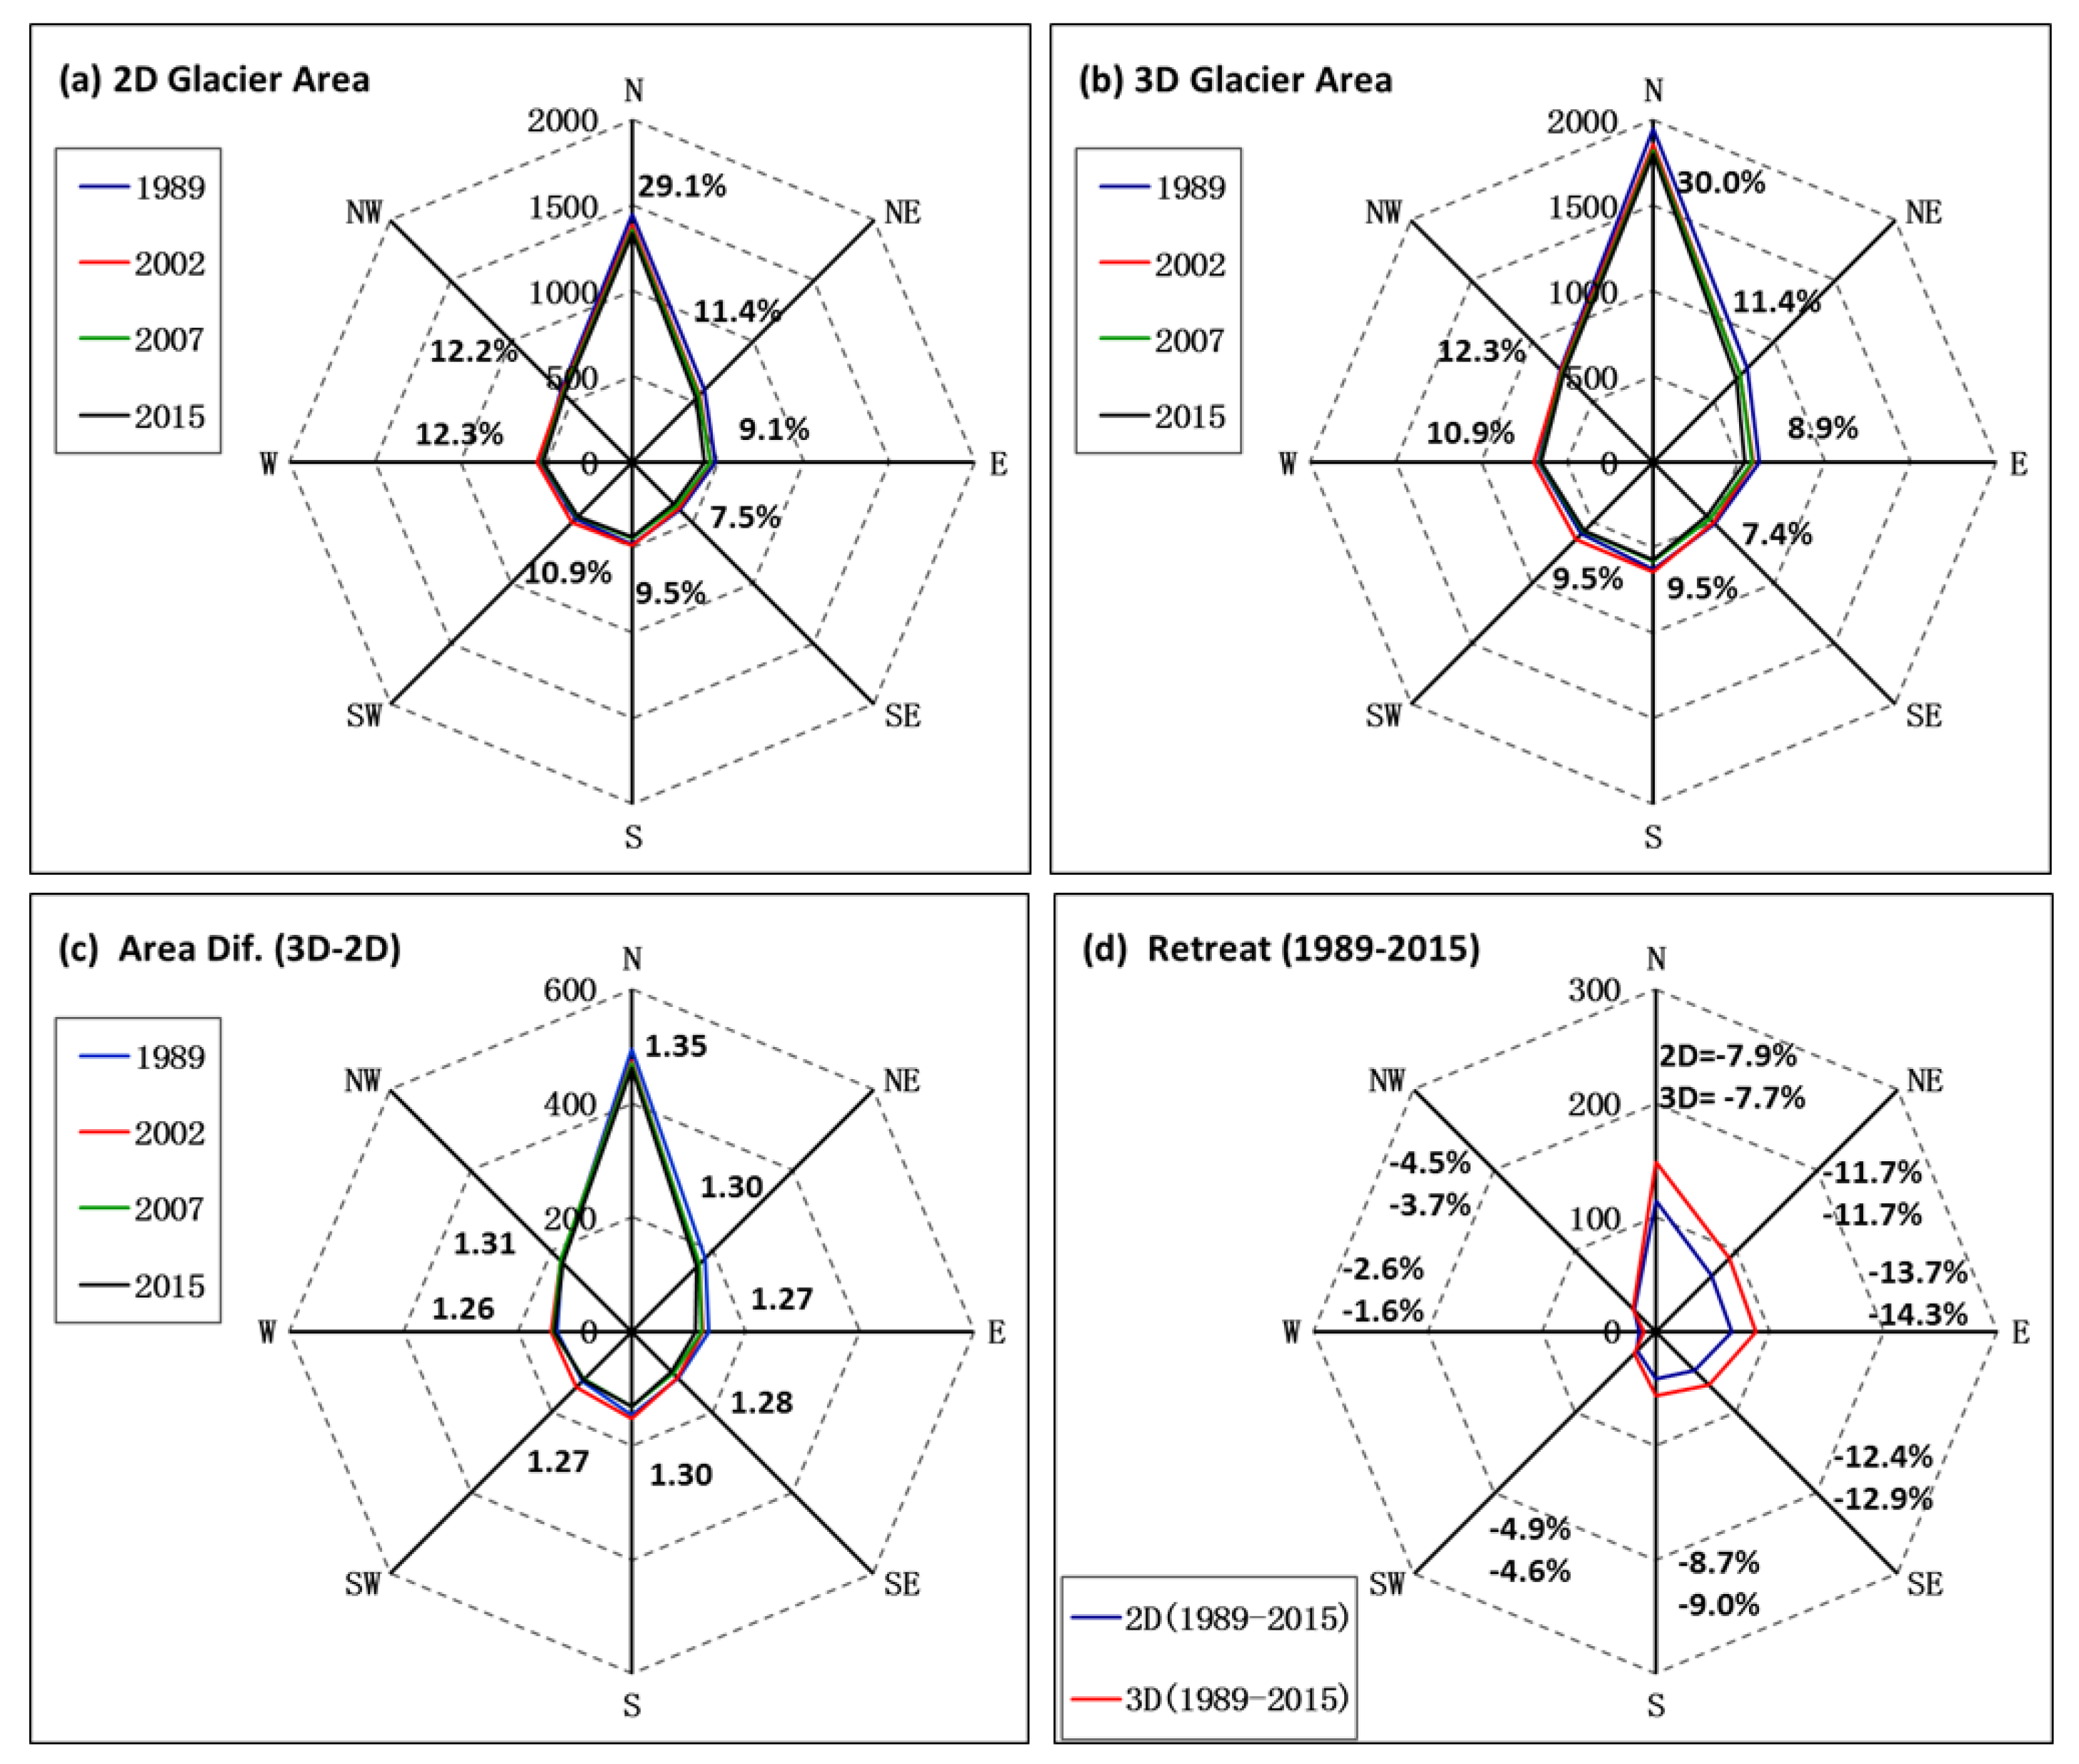
Aspect fields are closely related to the intensity of surface solar radiation, which determines the melting rate of glaciers to some degree. The northern aspect receives the least surface solar radiation, leading to dominant existing glaciers (29.1% in 2015) in the long run, while the southern aspect fields have fewer glaciers (Figure 10a). The northern field also has the largest ratio (3D/2D = 1.35), i.e., the steepest glacier slope, while the western field has the smallest ratio (1.26) or the gentlest slope (Figure 10c). This is not distinguishable for glacier 2D and 3D areas during the four periods, which indicates they have a similar distribution pattern within each aspect field/orientation. The northern and eastern fields had larger area reduction than the western fields (Figure 10d). The glacier areas in the southern, southwestern and western fields in 2002 were even slightly larger than those in 1989, which is consistent with the identified glacier surges, for example, Qingbintan Glacier No. 74 and Qongterang Glaciers [24].
4.3.5. Glacier Area Change in River Catchments
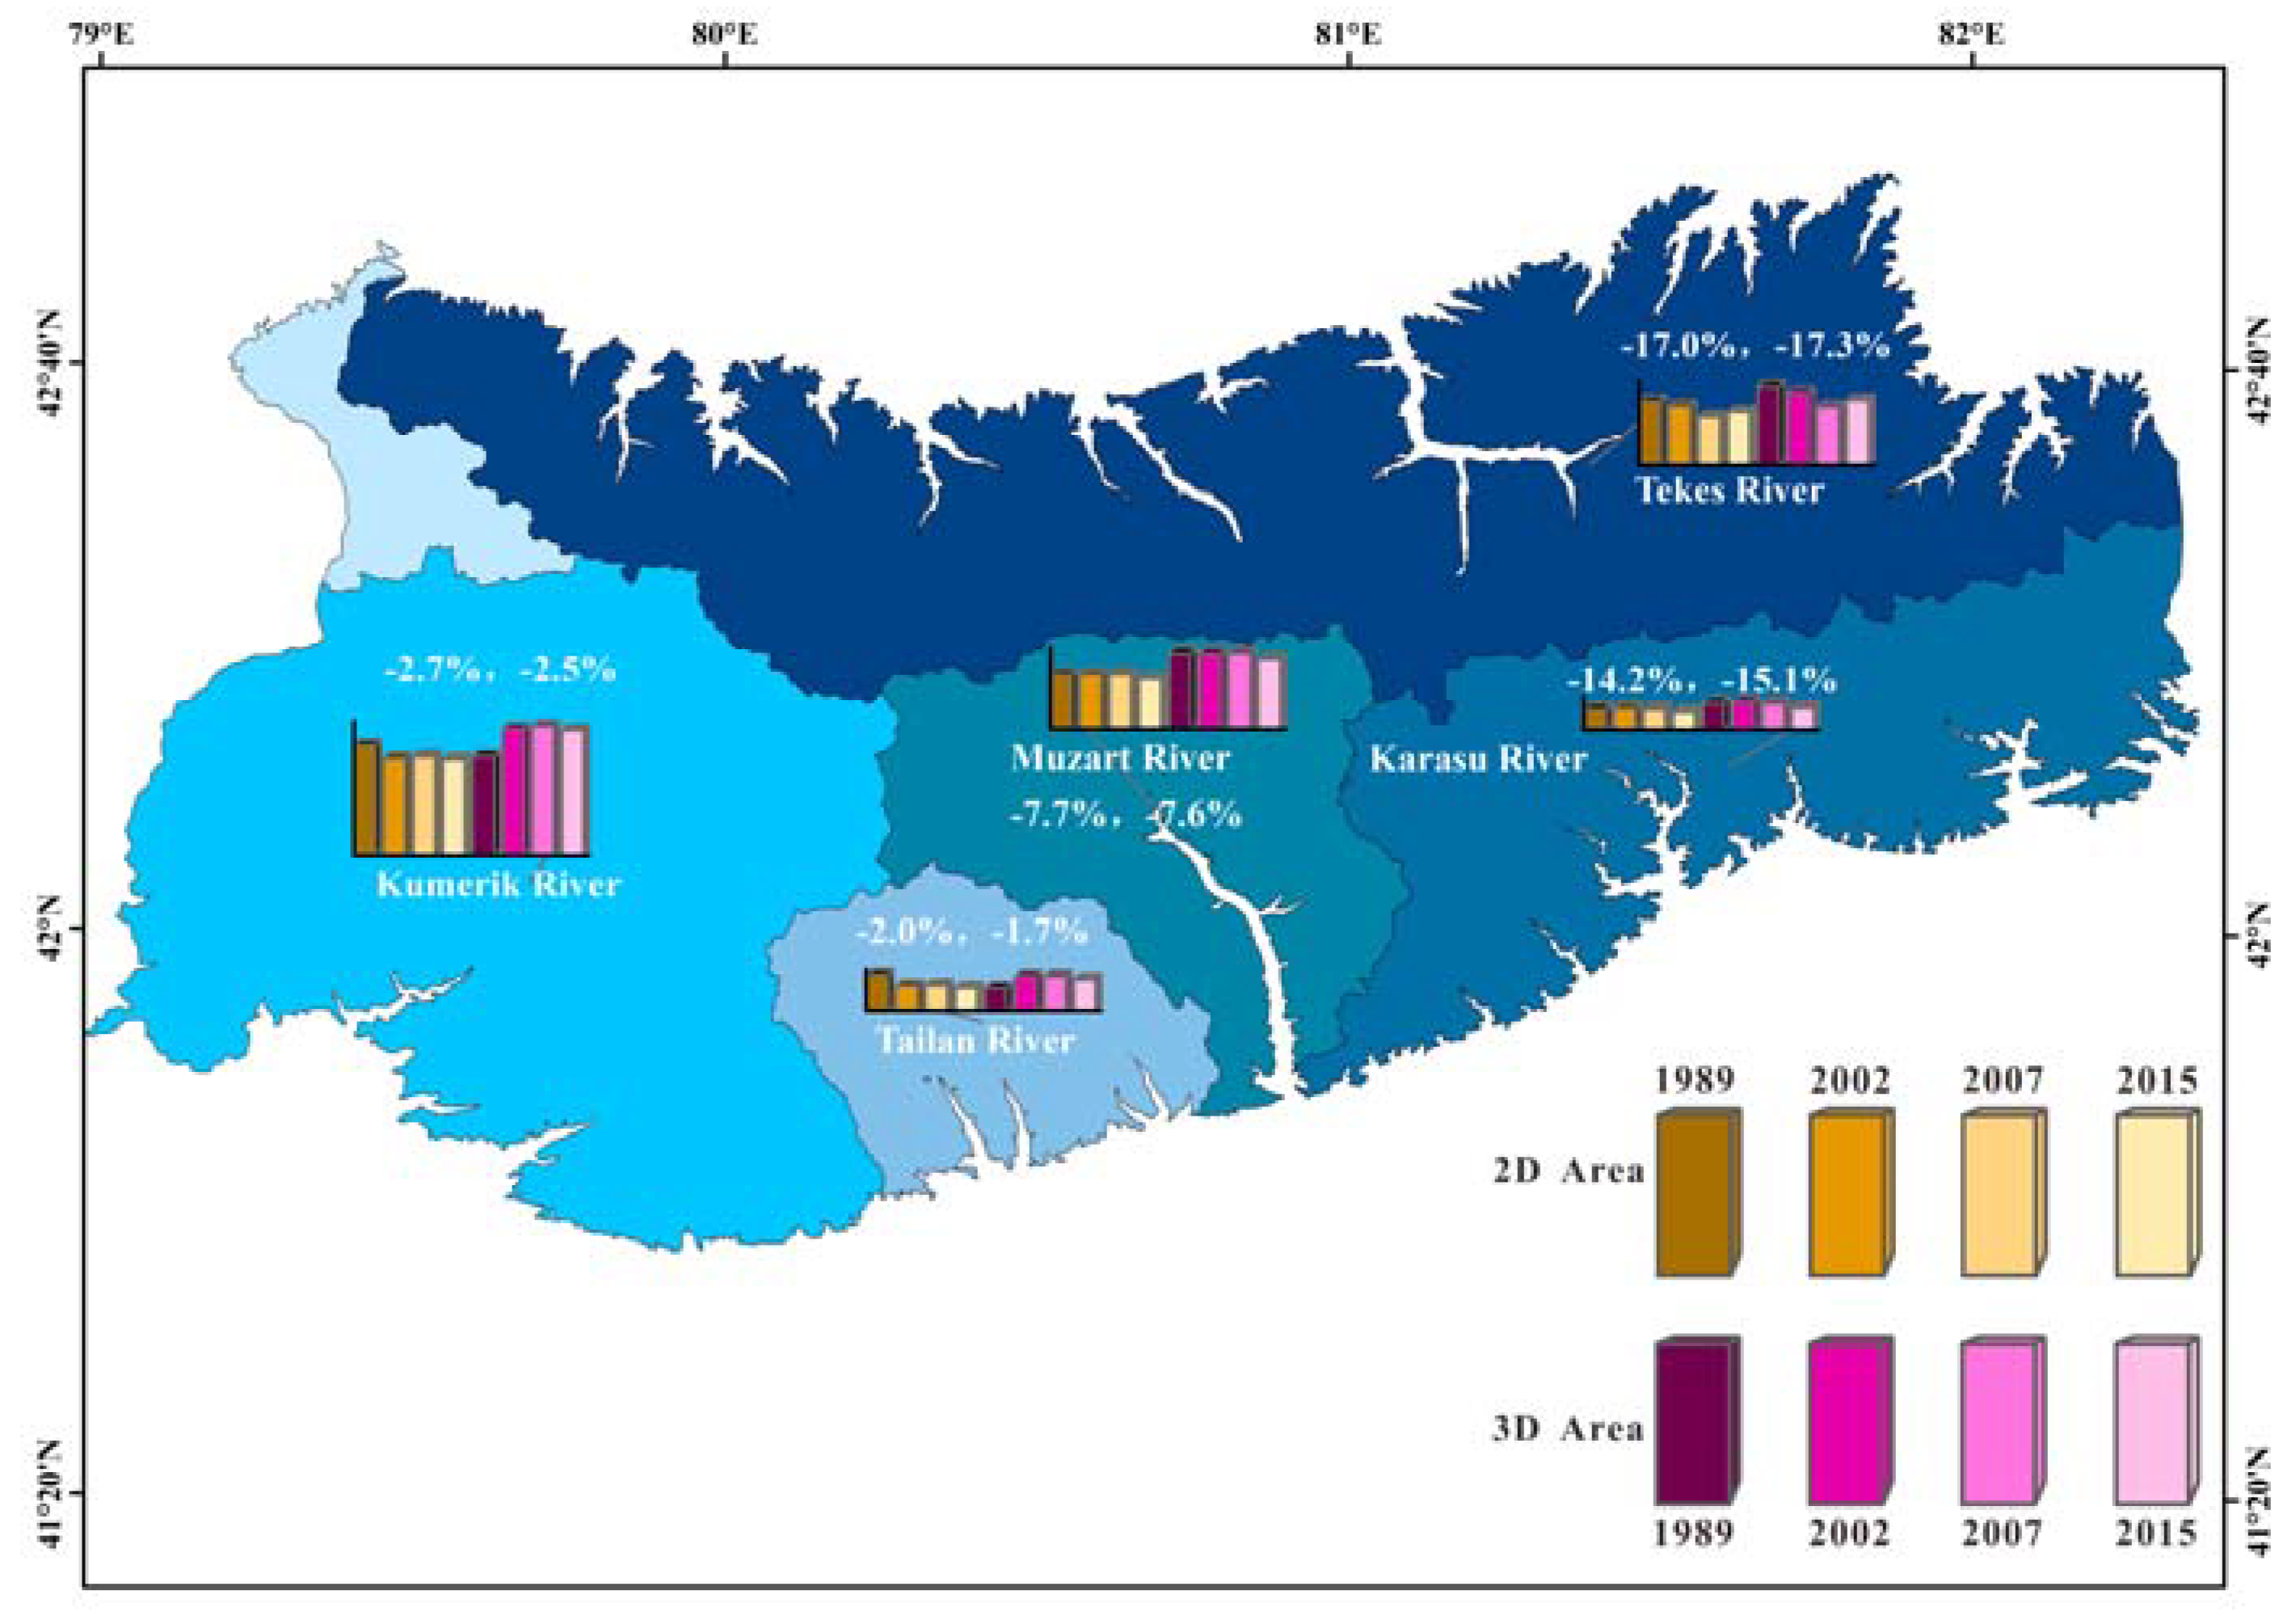
The study area is divided into five river catchments, i.e., Tekes River (North), Kumeric/Aksu River (West), Tailan River, Muzart River and Karasu Rivers (South) (Figure 1 and Figure 11). Topographic and glaciers characteristics of the five glacier catchments within the study area of Central Tianshan are summarized in Table 7.
The Tekes River catchment has the largest land area of 8142 km2, the Kumerik/Aksu River catchment had the highest glacier area of 1883 km2 in 1989, and the Muzart River catchment has the steepest terrain, with a mean slope of 32.6° (Table 7, Figure 11). The mean slope for glacier surface in the five catchments is 28.8°, leading to a 30.3% larger glacier 3D area than the 2D area. The mean glacier coverage (2D area) was 20.6% in 2015, with the largest value of 37.4% in the Muzart River catchment and the lowest of 9.3% in the Karasu River catchment. The Tekes River catchment had the second lowest glacier coverage (2D area) by 12.4% in 2015, while it had the largest shrinking rate of −17.0% between 1989 and 2015. The second largest shrinking rate occurred in the Karasu River catchments, i.e., −14.2%, followed by the Muzart River catchment: −7.7%. The glacier area in the Kumerik and Tailan River catchments near the Tuomuer region remained relatively stable (−2%) during this period.
5. Discussion
5.1. Glacier Mapping
Manual correction is an important step to obtain relatively accurate glacier outlines in rugged terrains. The glacier outline accuracy is affected by many factors, such as cloud, shadow, seasonal snow and debris cover. At the catchment scale, manual delineation of glacier outlines is widely utilized with the help of high resolution images and topographic data [5,39,46,47]. The assessment of the GLIMS framework confirmed that artificial interpretation remains the best tool for extracting glaciers from satellite images, especially when the mapping is conducted by the same person using a combination of different types of imagery [39,48]. The glacier outlines in this study were corrected by comparing the images acquired in different years, seasons and time, on a 3D surface view for shade verification and on GoogleEearth. The clean ice accuracy (90.8%) against the high resolution GeoEye01 image in 2013 is similar to that reported in the literature, e.g., 89.3% in the Muzart Glacier Catchment [20], 93% for clean ice in the Mount Manaslu in Nepal using object-based classification from Landsat images [35], ~95% for clean ice by the band ratio method in European Alps and Chugach Mountains, Alaska [49]. The relatively larger difference (~10%) in this study is mainly attributed to the coarser Landsat image (30 m) against the higher spatial resolution of the GeoEye01 image (4 m), which can detect more small glaciers, glacier edges and terminus than the former. Compared to the clean ice outlines from CGI2 and GLIMS by spatial intersection (Table 4), their agreements range from 88.6% over the entire Central Tianshan to 97.7% in the Mushketoy glacier catchment. Their total glacier areas have a very similar value. Overall, the derived glacier outlines in this study achieve similar accuracy as CGI2 and GLIMS. They are suitable to be used to demonstrate the general status and change rates in different river catchments and over the entire Central Tianshan from 1989–2015.
5.2. Glacier 2D and 3D Area Difference
Glacier 2D areas are the virtual/uniform surface projected to the horizontal earth surface although they are close to the actual 3D surface extents in flat terrains, such as the large ice sheets in Greenland and Antarctica. Geometrically, the ratio between 3D area and 2D area increases with slope angles at the reciprocal of cosine (slope). The ratio enlarges dramatically when the slope angle is larger than 20°. In the steep Muzart Glacier Catchment with a mean slope angle of 32.6°, glacier 3D areas are 39% larger than the 2D areas (Table 7). In the entire Central Tianshan analyzed in this study, the mean value of the glacier slope angle is 28.8°, resulting in 30.3% larger 3D areas than 2D areas. Such large area differences also exist for other alpine glaciers in other steep mountains, such as the eastern, northern and western Tianshan Mountains, Altai Mountains, Pamir Plateau, Qilian Mountains and Tibetan Plateau [16].
Glacier 2D areas had been adopted in the glacier community for a long period [25], and many documents, statistics and applications had been established based on them. For example, the empirical Volume-Area (V-A) power law equations have been applied to estimate glaciers total volumes at a catchment scale worldwide by using glacier 2D areas since there were few in situ measurements of ice volume using modern techniques, such as sounding echo, ground radar or gravity methods [50,51]. The V-A functions often produce large errors that may exceed 50% in volume estimation of individual glaciers [52]. The glacier 2D area change does not closely correspond to ice thickness changes, e.g., an increase in the accumulation zone and a decrease in the ablation zone, resulting in even larger errors, especially in estimating the ice volume changes by using glacier 2D areas in different years [1,20]. Thus, a potential application of glacier 3D areas could be applied to improve the V-A functions for a better ice volume estimate since 3D areas have glacier surface altitude information [50,51,53,54]. That is under our consideration but might divert the focus of this study.
In addition, glacier 3D areas in the four periods are computed using glacier 2D areas in the four periods and the TIN 3D model built from the same GDEM data that were derived from ASTER images in 2009. The bed rock/ice surface slope is the main contribution to the difference between glacier 3D and 2D areas. It is impossible to derive glacier 3D area changes caused by glacier thickness changes using one-time GDEM data, while the TIN 3D model can describe glacier 3D area changes caused by glacier terminal retreat. There were few ice surface elevation data with high accuracy and fine resolution (30 m of GDEM) at the global/regional scale before GDEM data. Our preliminary analysis also indicates that the glacier 3D area difference due to ice thickness change between 2000 and 2009 is much smaller than the uncertainties caused by the vertical accuracy of GDEM (2009) and SRTM data (2000). It is an ideal situation that the real ice surface extent is computed by the ice surface elevation data within each investigation period. That may be possible in the near future with the rapid development of satellite lidar and radar survey and mapping techniques.
5.3. Glacier 2D Areas Changes
There were 16,000 glaciers with a total area of 15,400 km2 before the 1970s in the Tianshan Mountains according to glaciers of Union of Soviet Socialist Republics (USSR) and the first Chinese Glacier Inventory [47]. They were relatively stable from the late 1950s to the early 1970s [10]. In recent years, with the help of airborne photos and satellite images, glaciers in this region have been intensively investigated with relatively high confidence at different spatial scales and between various temporal periods (Table 8). The glacier number and areas show an overall declining trend with large spatial heterogeneity and temporal variations during the past half century (Table 8, Figure 11).
The glaciers in the outer ranges had faster shrinking rates (Table 8). In the eastern Tianshan Ranges, for instance, there were 150 glaciers with total 2D areas of 48.7 km2 in 1964 in the upper Urumqi River Catchment (Glacier No. 1), and they decreased to 32.1 km2 (−34.1%, or 0.83% a−1) in 2005 [55]. Glacier area reductions of −15.2% (−0.38% a−1) and −21.9% (−0.61% a−1) were reported respectively in the upper Jinghe River Catchment between 1964 and 2004 [21] and in the Karlik Mountain between 1977 and 2013 [23]. In the Northern Ranges, the glacier areas in the Zailiyskiy-Kungey Alatau (Ala-Too) decreased by −32.1% (−0.73% a−1) during 1955–1999 [56], while a −4% reduction was found in the same region during 1990 and 2003 [5]; glacier areas decreased by −23.5% (−1.02% a−1) in the Karatal River Basin from 1989 to 2012 [22] and by −16.1% (−0.43% a−1) in the Ili-Kungoy region from 1970 to 2007 [57]. In the Western Ranges, glacier area declined by −15.8% (−0.43% a−1) in the At-Bashy region from 1970 to 2007 [57]. In the Southern side of Central Tianshan, glacier areas decreased by −8.0% (−1.14% a−1) in the Muzart Glacier Catchment just in six years from 2007 to 2013 [20]. The largest reduction rate (−1.67% a−1) was found in the Karlik Mountain of Eastern Tianshan between 2007 and 2013 [23].
The glaciers in the Central Tianshan had relatively slower shrinking rates with large local variations (Table 8, Figure 11). In the Tuomuer region, glacier areas decreased by −8.8% (−0.23% a−1) within four decades from 1964 to 2003, while they were more stable (−0.3%) in the high Tuomuer Glaciers [55]. In the Aksu Catchment, glacier areas only retreated by −3.6% (−0.11% a−1) between 1975 and 2008 [27], which were confirmed (−2%) by our analysis in the Kumerik and Tailan River catchments between 1989 and 2015 (Table 6 and Table 8, Figure 11). Regarding the Inylchek glaciers in the upper Aksu Catchment, glacier areas even advanced slightly (0.2%) between 1975 and 2007 [19]. Glacier surges were also observed on the southern side of Central Tianshan, e.g., in the Qingbingtan Glacier No. 74, glacier areas expanded 6.5% from 2002 to 2010 [24]. The Ak-shirak glaciers in Central Tianshan (West Side) retreated by −12.5% (−0.23% a−1) from 424.7 km2 in 1944 to 371.6 km2 in 2003 [47]. Wang et al. (2011a) investigated 1800 glaciers and reported a reduction of −11.5% (−0.23% a−1) between 1960 and 2009 within the China part of Central Tianshan [47]. In the Ili River Basin, mainly consisting of glaciers in the northern side of Central Tianshan, glacier areas decreased faster by −15.5% (−0.42% a−1) between 1970s and 2007 [17], and by −22.0% (−0.59% a−1) in the Tekes River Basin, the main tributary of the upper Ili River [18], where we also found a similar reduction rate of −17.0% (−0.66% a−1) between 1989 and 2015.
Using the same object-based classification method and Landsat images, a reduction rate of −0.31% a−1 was found over the entire Central Tianshan between 1989 and 2015. The largest retreat rate (−0.76% a−1) occurred between 2002 and 2007, when the annual mean air temperature increased from 11.4 °C to 12.2 °C and annual precipitation decreased from 107 mm to 29 mm (lowest record since 1986) at the southern foot (Aksu and Paicheng) of Central Tianshan (Table 5 and Table 8, Figure 7). The air temperature and precipitation changes were traced back to 1996, when it recorded the highest annual precipitation (186.2 mm) since 1955 and lowest temperature (9.7 °C) since 1986. Air temperature and precipitation are the two dominant factors controlling the advance or ablation rate of glaciers in Central Tianshan, and the area reductions always lag behind the air temperature increase for a few years [47].
The regional mean shrinkage rate (−0.31% a−1) considers all situations in Central Tianshan, while large spatial heterogeneity exists in each catchment (Table 7 and Figure 11). The northern Tekes River catchment had the largest shrinkage rate, followed by the southeastern Karasu and Muzart River catchments, and those areas had larger changes and risk in the future perennial snow/glacier fed runoff [2,3]. In contrast, glaciers in the Kumerik and Tailan River catchments in the Tuomuer regions did not show evident change.
6. Summary
The glacier outlines derived by the object-based classification approach in this study have good agreement with CGI2 and GLIMS. They are suitable to be used to investigate the general status and change rates during different periods over the entire Central Tianshan. The glacier number and areas had an overall declining trend with large spatial heterogeneity and temporal variations during the past half century. Glacier 2D areas were reduced by −8.1% between 1989 and 2015 in Central Tianshan. They were relatively stable during 1989–2002, and a large reduction occurred during 2002–2007, which could be explained by the increasing air temperature and decreasing precipitation. The northern Tekes River catchment had the largest shrinkage rate of −17.0% between 1989 and 2015, followed by the southeastern Karasu River −14.2% and Muzart River −7.7% catchments. In contrast, glaciers in the Kumerik and Tailan River catchments in the Tuomuer regions did not show evident change (−2%).
Glacier area distributions and changes were closely related to topographic factors such as slope, elevation and aspects. The northern aspect fields receive the least surface solar radiation, leading to dominant existing glaciers. The glaciers were near evenly distributed in slope zones of 0° to 50°, and only 4% occurred in areas with slopes larger than 60°. The area-weighted mean slope angle is 28.8°, resulting in 30.3% larger 3D areas than 2D areas. The slope zones of 10–20° and 40–50° had dominant area reduction. Two thirds of the glacier area occurred in elevation bands of 3500–4500 m, and 85% reductions occurred in the elevation bands of 3000–4000 m. Glaciers located above 4500 did not show evident change. The northern aspect field had the largest glaciers (29.1%), while the southeastern fields had the smallest (7.5%). The northern and eastern aspect fields had larger area reduction than the western fields.
Author Contributions
X.W. designed the experiments, analyzed the results and wrote the manuscript; H.C. processed the data, analyzed the results and wrote part of the manuscript; Y.C. improved the experiments and results analysis.
Funding
This study is funded by the Natural Science Foundation of China (#41371404, #41630859), Open Foundation of the State Key Laboratory of Desert and Oasis Ecology, Xinjiang Institute of Ecology and Geography, Chinese Academy of Sciences (#G2014-02-06), and the Fundamental Research Funds from Sun Yat-sen University (#15lgzd06).
Acknowledgments
We thank the World Data Center for Glaciology and Geocryology in Lanzhou, China, US NASA, ESA, Japan Space Systems and the Google Earth and DigitalGlobe companies for providing the WGI, CGI1/2, GLIMS, Landsat and GeoEye01 images, ASTER GDEM and other data support of our research work. Without these data, it is impossible to carry out such analysis as in this study. The suggestions and comments from three anonymous reviewers greatly improved this manuscript and are highly appreciated.
Conflicts of Interest
The authors declare no conflicts of interest.
References
- Adhikari, S.; Marshall, S.J. Glacier volume-area relation for high-order mechanics and transient glacier states. Geophys. Res. Lett. 2012, 39, 132–133. [Google Scholar] [CrossRef]
- Farinotti, D.; Longuevergne, L.; Moholdt, G.; Duethmann, D.; Mölg, T.; Bolch, T.; Vorogushyn, S.; Güntner, A. Substantial glacier mass loss in the Tien Shan over the past 50 years. Nat. Geosci. 2015, 8, 716–722. [Google Scholar] [CrossRef]
- Pritchard, H.D. Asia’s glaciers are a regionally important buffer against drought. Nature 2017, 545, 169–174. [Google Scholar] [CrossRef] [PubMed]
- Zhang, Y.; Yi, L.; Lin, S.; Liu, S.; Xi, C.; Wang, X. Using glacier area ratio to quantify effects of melt water on runoff. J. Hydrol. 2016, 538, 269–277. [Google Scholar] [CrossRef]
- Kutuzov, S.; Shahgedanova, M. Glacier retreat and climatic variability in the eastern Terskey–Alatoo, inner Tien Shan between the middle of the 19th century and beginning of the 21st century. Glob. Planet. Chang. 2009, 69, 59–70. [Google Scholar] [CrossRef]
- Wang, Y.; Hou, S.; Liu, Y. Glacier changes in the Karlik Shan, eastern Tien Shan, during 1971/72–2001/02. Ann. Glaciol. 2009, 50, 39–45. [Google Scholar] [CrossRef]
- Hagg, W.; Braun, L.N.; Kuhn, M.; Nesgaard, T.I. Modelling of hydrological response to climate change in glacierized Central Asian catchments. J. Hydrol. 2007, 332, 40–53. [Google Scholar] [CrossRef] [Green Version]
- Hagg, W.; Mayer, C.; Lambrecht, A.; Kriegel, D.; Azizov, E. Glacier changes in the Big Naryn basin, Central Tian Shan. Glob. Planet. Chang. 2013, 110, 40–50. [Google Scholar] [CrossRef]
- Haireti, A.; Tateishi, R.; Alsaaideh, B.; Gharechelou, S. Multi-criteria technique for mapping of debris-covered and clean-ice glaciers in the Shaksgam valley using Landsat TM and ASTER GDEM. J. Mt. Sci. 2016, 13, 703–714. [Google Scholar] [CrossRef]
- Sorg, A.F.; Bolch, T.; Stoffel, M.; Solomina, O.; Beniston, M. Climate change impacts on glaciers and runoff in Tien Shan (Central Asia). Nat. Clim. Chang. 2012, 2, 725–731. [Google Scholar] [CrossRef]
- Nuimura, T.; Sakai, A.; Taniguchi, K.; Nagai, H.; Lamsal, D.; Tsutaki, S.; Kozawa, A.; Hoshina, Y.; Takenaka, S.; Omiya, S.; et al. The GAMDAM Glacier Inventory: A quality-controlled inventory of Asian glaciers. Cryosphere 2015, 9, 849–864. [Google Scholar] [CrossRef]
- Pfeffer, W.T.; Arendt, A.A.; Bliss, A.; Bolch, T.; Cogley, J.G.; Gardner, A.S.; Hagen, J.O.; Hock, R.; Kaser, G.; Kienholz, C.; et al. The Randolph Glacier Inventory: A globally complete inventory of glaciers. J. Glaciol. 2014, 60, 537–552. [Google Scholar] [CrossRef] [Green Version]
- RGI Consortium. Randolph Glacier Inventory. 2017. Available online: http://www.glims.org/RGI/randolph.html (accessed on 8 August 2017).
- GLIMS; National Snow and Ice Data Center (NSIDC). GLIMS Glacier Database, [Central Asia]. NSIDC: Boulder, CO, USA, 2012. Available online: http://dx.doi.org/10.7265/N5V98602 (accessed on 12 August 2016).
- WGMS; National Snow and Ice Data Center (NSIDC). World Glacier Inventory, Version 1. [Central Asia]. NSIDC: Boulder, CO, USA, 1999. Updated 2012. Available online: http://dx.doi.org/10.7265/N5/NSIDC-WGI-2012-02 (accessed on 16 May 2016).
- Guo, W.; Liu, S.; Xu, J.; Wu, L.; Shangguan, D.; Yao, X.; Wei, J.; Bao, W.; Yu, P.; Liu, Q.; et al. The second Chinese glacier inventory: Data, methods and results. J. Glaciol. 2015, 61, 357–372. [Google Scholar] [CrossRef]
- Wang, S.; Zhang, M.; Li, Z.; Wang, F.; Li, H.; Li, Y.; Huang, X. Response of Glacier Area Variation to Climate Change in Chinese Tianshan Mountains in the Past 50 Years. Acta Geogr. Sin. 2011, 82, 247–261. [Google Scholar]
- Xu, B.; Lu, Z.; Liu, S.; Jing, L.; Xie, J.; Long, A.; Yin, Z.; Zou, S. Glacier changes and their impacts on the discharge in the past half-century in Tekes watershed, Central Asia. Phys. Chem. Earth 2015, 89–90, 96–103. [Google Scholar] [CrossRef]
- Shangguan, D.H.; Bolch, T.; Ding, Y.J.; Kröhnert, M.; Pieczonka, T.; Wetzel, H.U.; Liu, S.Y. Mass changes of Southern and Northern Inylchek Glacier, Central Tian Shan, Kyrgyzstan, during ~1975 and 2007 derived from remote sensing data. Cryosphere 2015, 9, 703–717. [Google Scholar] [CrossRef]
- Wang, X.; Chen, H.; Chen, Y. Large Differences between Glacier 3D Surface Extents and 2D Planar Areas in Central Tianshan. Water 2017, 9, 282. [Google Scholar] [CrossRef]
- Wang, L.; Zhong, L.; Wang, F.; Li, H.; Wang, P. Glacier changes from 1964 to 2004 in the Jinghe River basin, Tien Shan. Cold Reg. Sci. Technol. 2014, 102, 78–83. [Google Scholar] [CrossRef]
- Kaldybayev, A.; Chen, Y.; Evgeniy, V. Glacier change in the Karatal river basin, Zhetysu (Dzhungar) Alatau, Kazakhstan. Ann. Glaciol. 2016, 57, 11–19. [Google Scholar] [CrossRef]
- Du, W.; Li, J.; Bao, A.; Wang, B. Mapping changes in the glaciers of the eastern Tienshan Mountains during 1977–2013 using multitemporal remote sensing. J. Appl. Remote Sens. 2014, 8. [Google Scholar] [CrossRef]
- Pieczonka, T.; Bolch, T.; Wei, J.; Liu, S. Heterogeneous mass loss of glaciers in the Aksu-Tarim Catchment (Central Tien Shan) revealed by 1976 KH-9 Hexagon and 2009 SPOT-5 stereo imagery. Remote Sens. Environ. 2013, 130, 233–244. [Google Scholar] [CrossRef] [Green Version]
- Cogley, J.; Hock, R.; Rasmussen, L.; Arendt, A.; Bauder, A.; Braithwaite, R.; Jansson, P.; Kaser, G.; Möller, M.; Nicholson, L.; et al. Glossary of Glacier Mass Balance and Related Terms; IHP-VII Technical Documents in Hydrology No. 86, IACS Contribution No. 2; UNESCO-IHP: Paris, France, 2011. [Google Scholar]
- Fierz, C.; Armstrong, R.L.; Durand, Y.; Etchevers, P.; Greene, E.; McClung, D.M.; Nishimura, K.; Satyawali, P.K.; Sokratov, S.A. The International Classification for Seasonal Snow on the Ground; IHP-VII Technical Documents in Hydrology No. 83, IACS Contribution No. 1; UNESCO-IHP: Paris, France, 2009. [Google Scholar]
- Pieczonka, T.; Bolch, T. Region-wide glacier mass budgets and area changes for the Central Tien Shan between ~1975 and 1999 using Hexagon KH-9 imagery. Glob. Planet. Chang. 2015, 128, 1–13. [Google Scholar] [CrossRef]
- Wang, X.W.; Xie, H.J. New methods for studying the spatiotemporal variation of snow cover based on combination products of MODIS Terra and Aqua. J. Hydrol. 2009, 371, 192–200. [Google Scholar] [CrossRef]
- World Data Center for Glaciology and Geocryology (WDCGG), Lanzhou, 2015. Available online: http://wdcdgg.westgis.ac.cn/ (accessed on 12 October 2015).
- Frey, H.; Paul, F. On the suitability of the SRTM DEM and ASTER GDEM for the compilation of topographic parameters in glacier inventories. Int. J. Appl. Earth Obs. Geoinf. 2012, 18, 480–490. [Google Scholar] [CrossRef]
- Wang, L.; Li, Z.; Wang, F. Spatial distribution of the debris layer on glaciers of the Tuomuer Peak, western Tian Shan. J. Earth Sci. 2011, 22, 528–538. [Google Scholar] [CrossRef]
- Wang, X.; Xie, H.; Liang, T. Evaluation of MODIS snow cover and cloud mask and its application in Northern Xinjiang, China. Remote Sens. Environ. 2008, 112, 1497–1513. [Google Scholar] [CrossRef]
- Kraaijenbrink, P.D.A.; Shea, J.M.; Pellicciotti, F.; Jong, S.M.D.; Immerzeel, W.W. Object-based analysis of unmanned aerial vehicle imagery to map and characterise surface features on a debris-covered glacier. Remote Sens. Environ. 2016, 186, 581–595. [Google Scholar] [CrossRef]
- Nijhawan, R.; Garg, P.; Thakur, P. A comparison of classification techniques for glacier change detection using multispectral images. Perspect. Sci. 2016, 8, 377–380. [Google Scholar] [CrossRef]
- Robson, B.A.; Nuth, C.; Dahl, S.O.; Hölbling, D.; Strozzi, T.; Nielsen, P.R. Automated classification of debris-covered glaciers combining optical, SAR and topographic data in an object-based environment. Remote Sens. Environ. 2015, 170, 372–387. [Google Scholar] [CrossRef]
- Bajracharya, S.R.; Maharjan, S.B.; Shrestha, F. The status and decadal change of glaciers in Bhutan from the 1980s to 2010 based on satellite data. Ann. Glaciol. 2014, 55, 159–166. [Google Scholar] [CrossRef]
- Trimble. Documentation: eCognition Developer 9.0; Reference Book; Trimble Germany GmbH: Munich, Germany, 2014. [Google Scholar]
- Huang, C.; Davis, L.S.; Townshend, J.R.G. An assessment of support vector machines for land cover classification. Int. J. Remote Sens. 2002, 23, 725–749. [Google Scholar] [CrossRef]
- Wang, A.X.; Zheng, H.; Chen, Y.; Liu, H.; Liu, L.; Huang, H.; Liu, K. Mapping snow cover variations using a MODIS daily cloud-free snow cover product in northeast China. J. Appl. Remote Sens. 2014, 8. [Google Scholar] [CrossRef]
- Thakuri, S.; Salerno, F.; Smiraglia, C.; Bolch, T.; D’Agata, C.; Viviano, G.; Tartari, G. Tracing glacier changes since the 1960s on the south slope of Mt. Everest (central Southern Himalaya) using optical satellite imagery. Cryosphere 2014, 8, 1297–1315. [Google Scholar] [CrossRef] [Green Version]
- Ye, Q.; Kang, S.; Chen, F.; Wang, J. Monitoring glacier variations on Geladandong mountain, central Tibetan Plateau, from 1969 to 2002 using remote-sensing and GIS technologies. J. Glaciol. 2006, 52, 537–545. [Google Scholar] [CrossRef]
- Hall, D.K.; Bayr, K.J.; Schöner, W.; Bindschadler, R.A.; Chien, J.Y.L. Consideration of the errors inherent in mapping historical glacier positions in Austria from the ground and space (1893–2001). Remote Sens. Environ. 2003, 86, 566–577. [Google Scholar] [CrossRef]
- Wang, K.; Lo, C.P. An Assessment of the Accuracy of Triangulated Irregular Networks (TINs) and Lattices in ARC/INFO. Trans. GIS 1999, 3, 161–174. [Google Scholar] [CrossRef]
- Jenness, J.S. Calculating landscape surface area from digital elevation models. Wildl. Soc. Bull. 2004, 32, 829–839. [Google Scholar] [CrossRef]
- Zhang, Y.; Zhang, L.N.; Yang, C.D.; Bao, W.D.; Yuan, X.X. Surface area processing in GIS for different mountain regions. For. Ecosyst. 2011, 13, 311–314. [Google Scholar] [CrossRef]
- Petrakov, D.; Shpuntova, A.; Aleinikov, A.; Kääb, A.; Kutuzov, S.; Lavrentiev, I.; Stoffel, M.; Tutubalina, O.; Usubaliev, R. Accelerated glacier shrinkage in the Ak-Shyirak massif, Inner Tien Shan, during 2003–2013. Sci. Total Environ. 2016, 562, 364–378. [Google Scholar] [CrossRef] [PubMed]
- Aizen, V.B.; Kuzmichenok, V.A.; Surazakov, A.B.; Aizen, E.M. Glacier changes in the Tien Shan as determined from topographic and remotely sensed data. Glob. Planet. Chang. 2007, 56, 328–340. [Google Scholar] [CrossRef]
- Raup, B.; Kargel, J.S.; Bishop, M.P.; Hamilton, G.; Lee, E.; Paul, F.; Rau, F.; Soltesz, D.; Khalsa, S.J.S.; Beedle, M.; et al. Remote sensing and GIS technology in the Global Land Ice Measurements from Space (GLIMS) Project. Comput. Geosci. 2007, 33, 104–125. [Google Scholar] [CrossRef]
- Paul, F.; Barrand, N.E.; Baumann, S.; Berthier, E.; Bolch, T.; Casey, K.; Frey, H.; Joshi, S.P.; Konovalov, V.; Le Bris, R.; et al. On the accuracy of glacier outlines derived from remote-sensing data. Ann. Glaciol. 2013, 54, 171–182. [Google Scholar] [CrossRef] [Green Version]
- Farinotti, D.; Huss, M. An upper-bound estimate for the accuracy of volume-area scaling. Cryosphere 2013, 7, 1707–1720. [Google Scholar] [CrossRef]
- Farinotti, D.; Huss, M.; Bauder, A.; Funk, M.; Truffer, M. A method to estimate the ice volume and ice-thickness distribution of alpine glaciers. J. Glaciol. 2009, 55, 422–430. [Google Scholar] [CrossRef]
- Meier, M.F.; Dyurgerov, M.B.; Rick, U.K.; O’Neel, S.; Pfeffer, W.T.; Anderson, R.S.; Anderson, S.P.; Glazovsky, A.F. Glaciers dominate eustatic sea-level rise in the 21st century. Science 2007, 317, 1064–1067. [Google Scholar] [CrossRef] [PubMed]
- Bahr, D.B.; Pfeffer, W.T.; Kaser, G. A review of volume-area scaling of glaciers. Rev. Geophys. 2015, 53, 95–140. [Google Scholar] [CrossRef] [PubMed]
- Bahr, D.B.; Mark, D.; Meier, M.F. Sea-level rise from glaciers and ice caps: A lower bound. Geophys. Res. Lett. 2009, 36, 151–157. [Google Scholar] [CrossRef]
- Li, Z.; Li, K.; Wang, L. Study on Recent Glacier Changes and Their Impact on Water Resources in Xinjiang, North Western China. Quat. Sci. 2010, 30, 96–106. [Google Scholar]
- Bolch, T. Climate change and glacier retreat in northern Tien Shan (Kazakhstan/Kyrgyzstan) using remote sensing data. Glob. Planet. Chang. 2007, 56, 1–12. [Google Scholar] [CrossRef]
- Narama, C.; Kääb, A.; Duishonakunov, M.; Abdrakhmatov, K. Spatial variability of recent glacier area changes in the Tien Shan Mountains, Central Asia, using Corona (~1970), Landsat (~2000), And ALOS (~2007) satellite data. Glob. Planet. Chang. 2010, 71, 42–54. [Google Scholar] [CrossRef]
Figure 1.
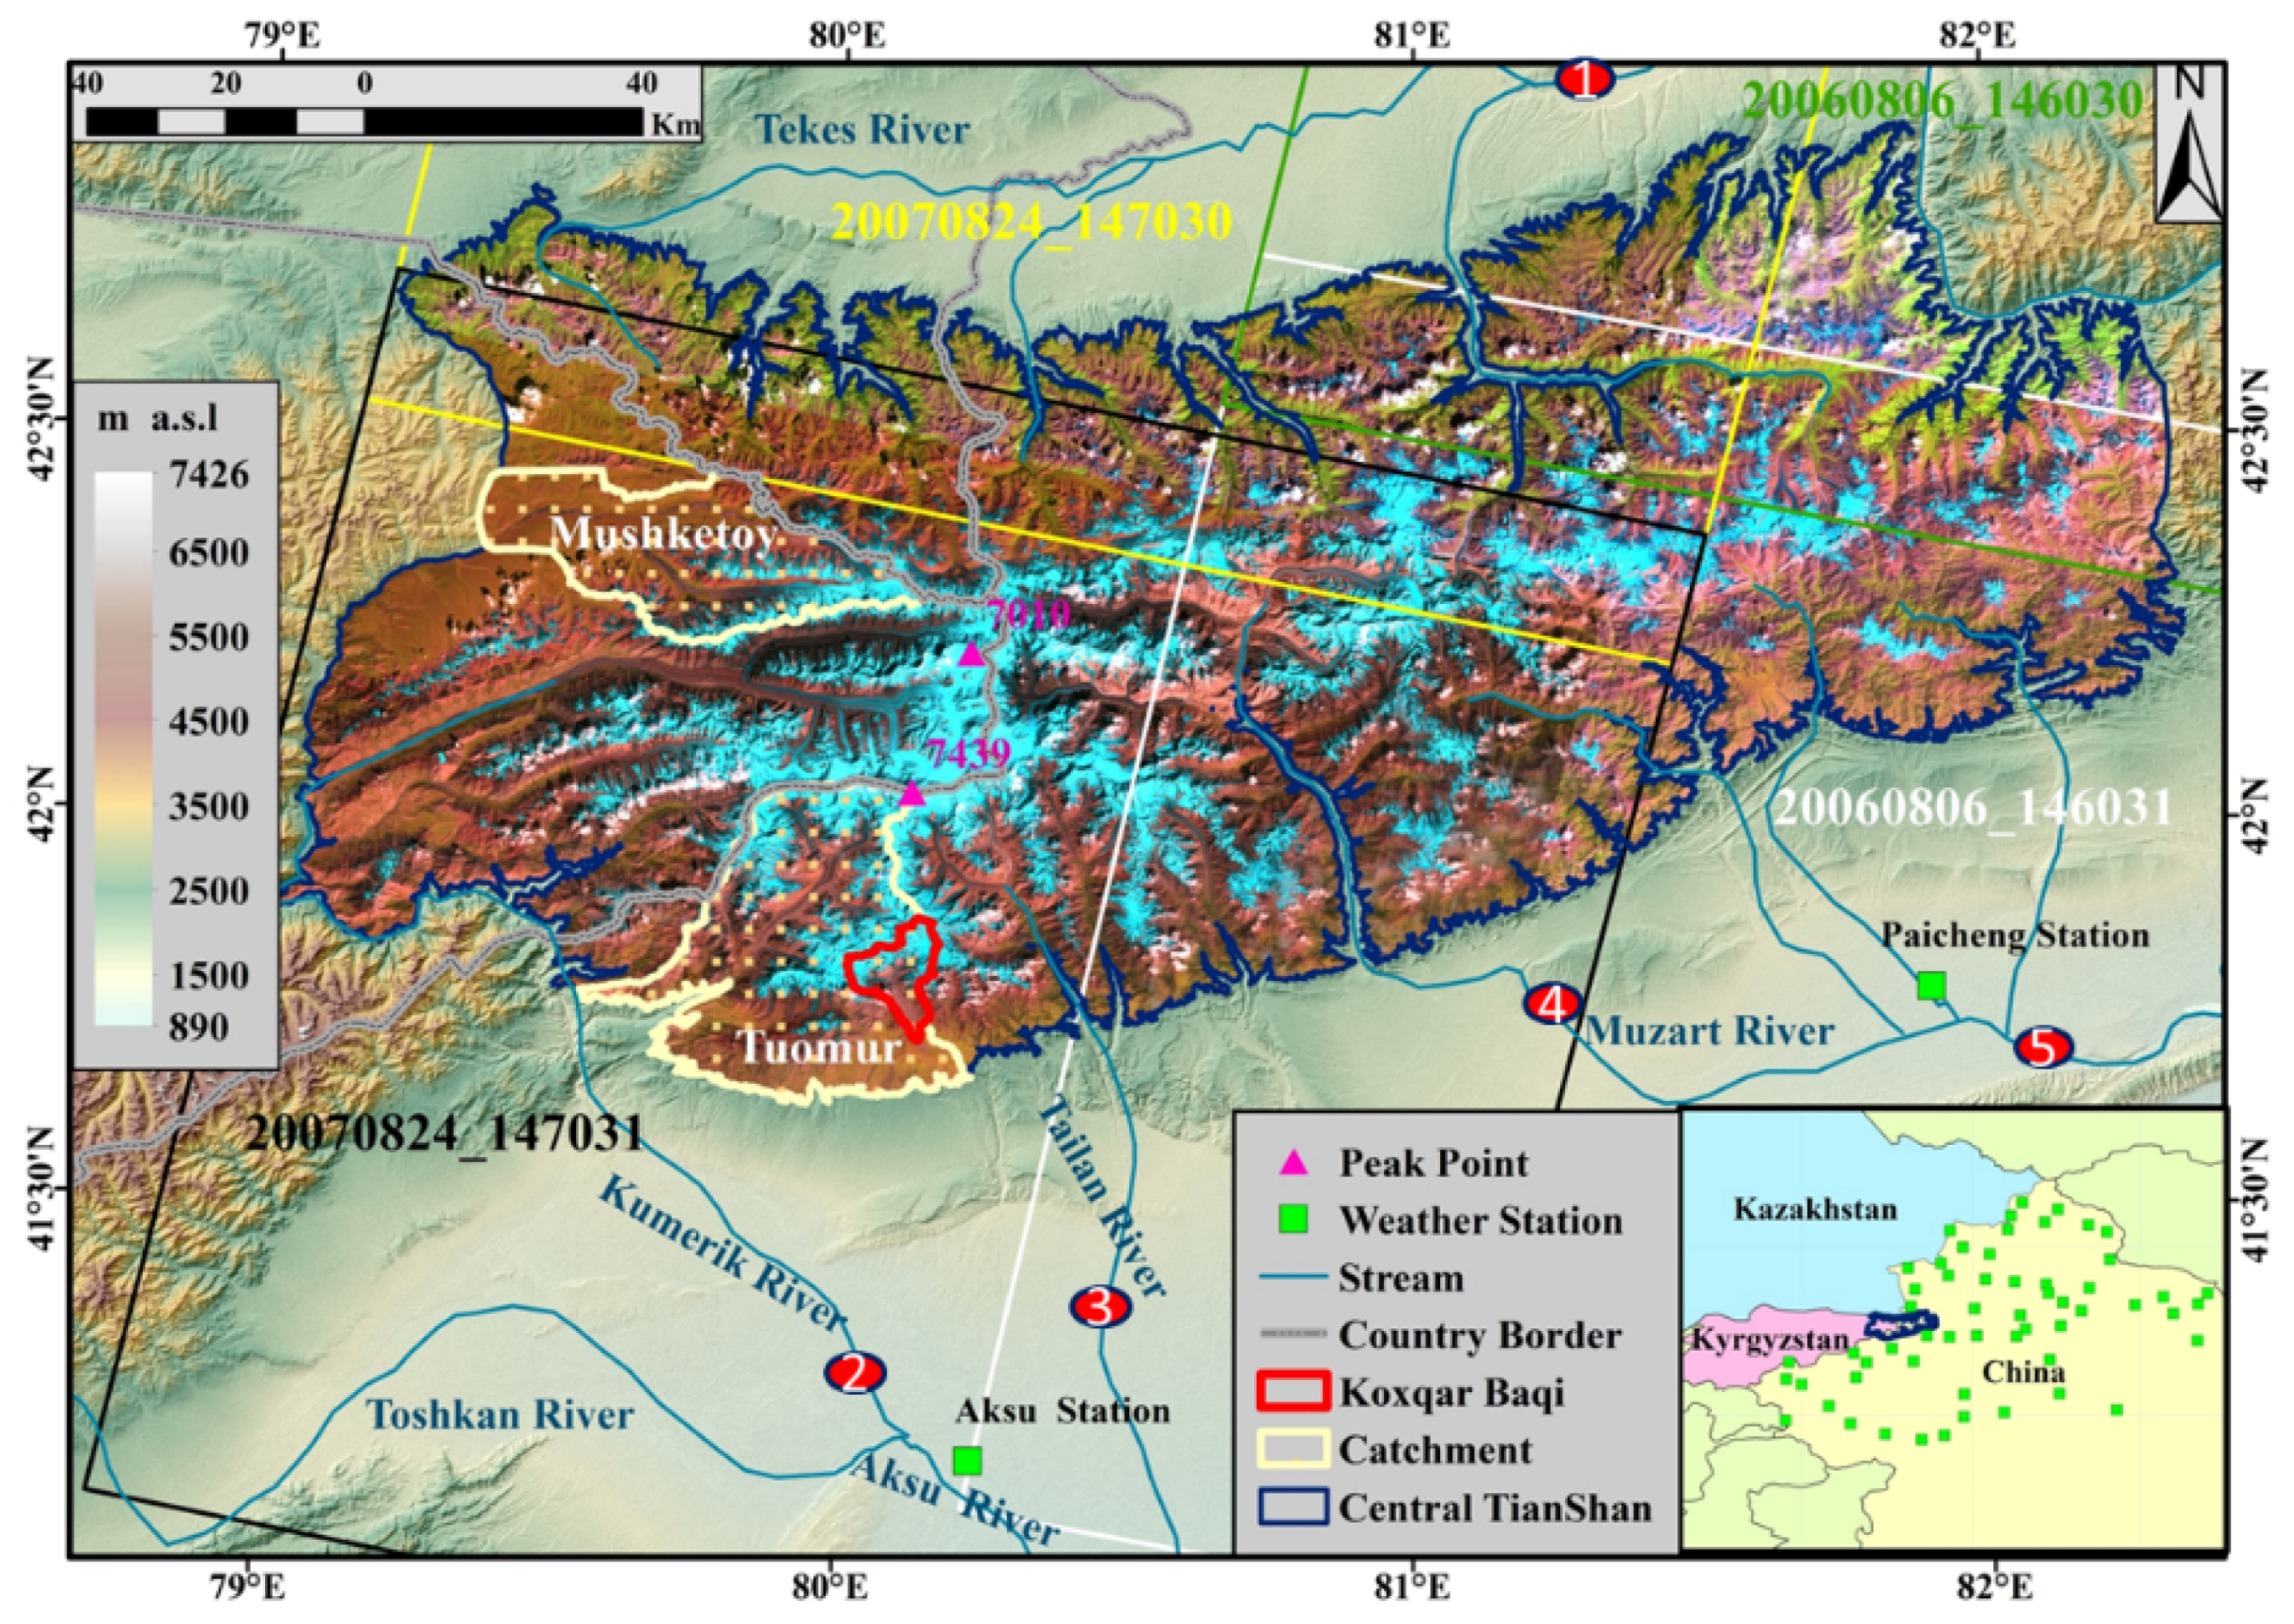
Study areas in the Central Tianshan Mountains. The analyzed areas are constrained by the 2500-m elevation contour (dark blue line). The crossing straight lines are the outlines of four Landsat images (background, composite bands 5, 4, 3) used in 2006–2007. Two glacier catchments (white polygons: Mushketoy and Tuomur) and the red polygon in the Tuomur Glacier Catchment are used to compare the glacier areas derived from Landsat images and those from GLIMS, CGI2 products and GeoEye images, respectively. The five major river catchments (red circles) are applied for glacier area change analysis.
Figure 1.
Study areas in the Central Tianshan Mountains. The analyzed areas are constrained by the 2500-m elevation contour (dark blue line). The crossing straight lines are the outlines of four Landsat images (background, composite bands 5, 4, 3) used in 2006–2007. Two glacier catchments (white polygons: Mushketoy and Tuomur) and the red polygon in the Tuomur Glacier Catchment are used to compare the glacier areas derived from Landsat images and those from GLIMS, CGI2 products and GeoEye images, respectively. The five major river catchments (red circles) are applied for glacier area change analysis.

Figure 2.
Flowcharts of glacier outline delineation using object-based image classification (Edited from Wang et al., 2017 [20]).
Figure 2.
Flowcharts of glacier outline delineation using object-based image classification (Edited from Wang et al., 2017 [20]).

Figure 3.
Glacier outlines derived from (a) GeoEye01 images (blue polygon and background images), CGI2 (white polygon), and (b) Landsat images (yellow polygons and composite bands 1, 2, 3) using object-based classification in the upper Koxqar Baqi Glacier Catchment.
Figure 3.
Glacier outlines derived from (a) GeoEye01 images (blue polygon and background images), CGI2 (white polygon), and (b) Landsat images (yellow polygons and composite bands 1, 2, 3) using object-based classification in the upper Koxqar Baqi Glacier Catchment.

Figure 4.
Comparison of glacier outlines of GLIMS and CGI2 (white polygon) against those derived in this study (yellow polygons and background Landsat images in composite bands 5, 4, 3) in the (a) Mushketoy and (b) Tuomuer Glacier catchments from Landsat images acquired on 18 Aug 2002 and 24 August 2007, respectively. The debris-covered glaciers were 23 km2 (9.8%) and 115 km2 (18.8%) in both glacier catchments according to GLIMS and CGI2.

Figure 5.
Comparisons of glacier 2D area (clean ice) from inventories and those derived in this study from Landsat images over Central Tianshan from 1989 to 2015. The debris-covered glaciers in CGI2 and GLIMS are manually separated following the method of Haireti et al. [9].
Figure 5.
Comparisons of glacier 2D area (clean ice) from inventories and those derived in this study from Landsat images over Central Tianshan from 1989 to 2015. The debris-covered glaciers in CGI2 and GLIMS are manually separated following the method of Haireti et al. [9].

Figure 6.
The count (a) and 2D area (b) histograms of glaciers derived from Landsat images in this study for four periods (1989, 2002, 2007 and 2015) over Central Tianshan within different area intervals. The numbers above each column are the four-period mean frequency percentages of glaciers count (a) and total areas (b) within each area category, respectively.

Figure 7.
Annual mean air temperature and total precipitation from 1955 to 2015 in Paicheng and Aksu at the southern foot of the Central Tianshan Mountain.
Figure 7.
Annual mean air temperature and total precipitation from 1955 to 2015 in Paicheng and Aksu at the southern foot of the Central Tianshan Mountain.

Figure 8.
Histograms of Glacier 2D area (a), 3D area (b), area differences between 3D and 2D (c) and area retreat between 1989 and 2015 (d) based on the glacier outlines derived from Landsat images in this study for the four periods (1989, 2002, 2007 and 2015) over Central Tianshan within different slope angle zones. The numbers above columns in (a,b) are the frequency percentages in 2015, area ratio of 3D to 2D in 2015 (c), and (d) shrinkage rates ((2015–1989)/1989) within each slope zone.

Figure 9.
Histograms of Glacier 2D area (a), 3D area (b), area differences between 3D and 2D (c), and area retreat between 1989 and 2015 (d) based on the glacier outlines derived from Landsat images in this study for four periods (1989, 2002, 2007 and 2015) over Central Tianshan within different elevation bands. The numbers above columns in (a,b) are the frequency percentages in 2015, area ratio of 3D to 2D in 2015 (c), and shrinking rates ((2015–1989)/1989) within each elevation band.

Figure 10.
Glacier 2D area (a), 3D area (b), area differences (km2) between 3D and 2D (c), and area retreat between 1989 and 2015 (d) based on the glacier outlines derived from Landsat images in this study for four periods (1989, 2002, 2007 and 2015) over Central Tianshan within eight aspect fields. The numbers within each aspect field in (a,b) are their frequency percentages in 2015, area ratio of 3D to 2D (c), and shrinkage rates ((2015–1989)/1989).

Figure 11.
Glacier 2D and 3D area (km2) in four years of 1989, 2002, 2007 and 2015 and their shrinkage rates between 1989 and 2015 in the five river catchments.
Figure 11.
Glacier 2D and 3D area (km2) in four years of 1989, 2002, 2007 and 2015 and their shrinkage rates between 1989 and 2015 in the five river catchments.


Table 1.
Landsat image tiles and their glacier 2D area/percentage used in this study.
| Landsat Image Tiles (Path/Row) | 146/030 | 146/031 | 147/030 | 147/031 | |
|---|---|---|---|---|---|
| Glacier 2D areas in 2007 (km²) | 60 | 498 | 126 | 4016 | |
| Percentage to total glaciers | 1.3% | 10.6% | 3.1% | 85.1% | |
| Acquiring year and dates of Landsat images | 1989 | 1990/8/2 | 1990/8/2 | 1989/8/22 | 1989/8/22 |
| 2002 | 2000/8/5 | 2000/8/5 | 2002/8/18 | 2002/8/18 | |
| 2007 | 2006/8/6 | 2006/8/6 | 2007/8/24 | 2007/8/24 | |
| 2015 | 2013/8/1 | 2013/8/1 | 2016/9/1 | 2015/8/14 | |
Table 2.
Description of glacier products investigated in this study.
| Short Name | Full Name | Image Time | Agency/Source | Resolution (m) | Area(km²) |
|---|---|---|---|---|---|
| CGI1 +WGI | World Glacier Inventory | 1950–1980s | USGS/China Aerial photos | - | 7233 |
| CGI2 | The 2nd Chinese Glacier Inventory | 2007 | WDCGG, China, Landsat images | 30 | 5415 * |
| GLIMS | GLIMS Inventory | 2002–2007 | GLIMS, ASTER, Landsat images | 30 | 5415 * |
Note: * This value is computed using CGI2 within China and GLIMS in Kazakhstan and Kyrgyzstan and includes the debris-covered glaciers.
Table 3.
Error matrix of glacier 2D areas (clean ice) derived from Landsat images in this study and from the CGI2 and GeoEye01 image in the upper Koxqar Baqi Glacier catchment. The debris-covered glaciers in this catchment were 18.9 km2 according to CGI2.
Table 3.
Error matrix of glacier 2D areas (clean ice) derived from Landsat images in this study and from the CGI2 and GeoEye01 image in the upper Koxqar Baqi Glacier catchment. The debris-covered glaciers in this catchment were 18.9 km2 according to CGI2.
| Reference | GeoEye01 on 29 July 2013 (km2) | CGI2 from Landsat on 24 Augst 2007 (km2) | |||
|---|---|---|---|---|---|
| Glacier | Non-Glacier | Glacier | Non-Glacier | ||
| 54.4 | 56.3 | 67.4 | 43.3 | ||
| Landsat on 31 July 2013 | Glacier | 49.4 | 9.4 | 56.6 | 2.2 |
| 90.8% | 16.7% | 84.0% | 5.1% | ||
| Non-glacier | 5.0 | 46.9 | 10.8 | 41.1 | |
| 9.2% | 83.3% | 16.0% | 94.9% | ||
Table 4.
Comparisons of glacier 2D areas derived from this study against GLIMS and CGI2 in Mushketoy and Tuomuer Glacier Catchments and Central Tianshan by spatial intersection. The source images of GLIMS and CGI2 were acquired on 18 August 2002 and 24 August 2007. This study uses the same Landsat images but different classification methods to determine glaciers. According to CGI2 and Landsat images, the debris-covered glaciers were 23.0 km2, 116.0 km2 and 729 km2 in the three respective regions. Intersection Agreement = Intersection/Ref., Total area Agreement = This study/Ref., Ref. represents the clean ice area of GLIMS or CGI2.
| Glacier Catchments | Sources | All (km2) Glaciers | Clean Ice (km2) | Intersection (km2) | Intersection Agreement | Total Area Agreement |
|---|---|---|---|---|---|---|
| Mushketoy (Hanging glaciers) | GLIMS in 2002 | 236 | 213 | 208 | 97.7% | 104.2% |
| This study in 2002 | n/a | 222 | ||||
| Tuomuer (Valley glaciers) | CGI2 in 2007 | 613 | 497 | 464 | 93.4% | 98.8% |
| This study in 2007 | n/a | 491 | ||||
| Central Tianshan | GLIMS + CGI2 in 2002/2007 | 5415 | 4686 | 4151 | 88.6% | 100.7% |
| This study in 2007 | n/a | 4720 |
Table 5.
Statistics of glacier 2D and 3D areas (km2) based on GLIMS/CGI2 and those extracted from Landsat images in Central Tianshan during 1989–2015.
Table 5.
Statistics of glacier 2D and 3D areas (km2) based on GLIMS/CGI2 and those extracted from Landsat images in Central Tianshan during 1989–2015.
| Glaciers | Central Tianshan (km2) | |||
|---|---|---|---|---|
| 2D Area (km2) | 3D Area (km2) | Relative Difference (RD) (3D-2D)/2D | ||
| WGI+CGI1 (all) in 1970s | 7233 | n/a | n/a | |
| GLIMS+CGI2 (all) in 2002/2007 | 5415 | 6862 | 26.7% | |
| GLIMS+CGI2 (clean ice) | 4686 | n.a. | n.a. | |
| Differencece (CGI2-CGI1) | −1818 | |||
| RD: (CGI2-CGI1)/CGI1 | −25.1% | |||
| This study | 1989 | 4997 | 6497 | 30.0% |
| 2002 | 4906 | 6395 | 30.4% | |
| RD: (2002–1989)/1989 | −1.8% | −1.6% | ||
| 2007 | 4720 | 6149 | 30.3% | |
| RD: (2007–2002)/2002 | −3.8% | −3.8% | ||
| 2015 | 4593 | 5982 | 30.2% | |
| RD: (2007–2015)/2015 | −2.7% | −2.7% | ||
| Difference (2015–1989) RD: (2015–1989)/1989 | −404 | −516 | 27.6% | |
| −8.1% | −7.9% | |||
Table 6.
Comparisons of the glacier 3D area computed from DEM raster and TIN polygon surface models using glacier polygons in Central Tianshan in 2015.
Table 6.
Comparisons of the glacier 3D area computed from DEM raster and TIN polygon surface models using glacier polygons in Central Tianshan in 2015.
| Methods | Polygon 2D Areas (km2) | Raster 2D Areas (km2) | Area Loss | 3D Area (km2) | (3D-2D)/2D |
|---|---|---|---|---|---|
| Raster Surface | 4593 | 4341 | −5.5% | 5630 | 29.7%, * 22.6% |
| Polygon Surface | 4593 | n.a. | n.a. | 5982 | 30.3% |
| (Raster-Polygon)/Polygon | −5.9% | ||||
Note: * The second ratio is computed against the original glacier polygon 2D areas, while the first ratio is compared to the converted raster 2D areas.
Table 7.
Topographic and glacier (Gla) characteristics of the five river catchments in Central Tianshan (TS).
Table 7.
Topographic and glacier (Gla) characteristics of the five river catchments in Central Tianshan (TS).
| Catchment Name | Tekes | Kumerik | Tailan | Muzart | Karasu | Total/Mean |
|---|---|---|---|---|---|---|
| TS 2D area (km2) | 8142 | 6336 | 1602 | 2552 | 3703 | 22,336 |
| TS 3D area (km2) | 9851 | 7798 | 2056 | 3462 | 4695 | 27,862 |
| TS land slope (degree) | 27.9 | 26.6 | 30.6 | 32.6 | 31.3 | 28.78 |
| TS glacier slope (degree) | 26.0 | 28.6 | 31.5 | 31.3 | 27.2 | 28.82 |
| TS land 3D/2D | 1.21 | 1.23 | 1.28 | 1.36 | 1.27 | 1.25 |
| TS glacier 3D/2D | 1.23 | 1.30 | 1.34 | 1.39 | 1.25 | 1.30 |
| Gla 2D area 1989 (km2) | 1214 | 1883 | 465 | 1035 | 400 | 4997 |
| Gla 2D area 2015 (km2) | 1007 | 1832 | 456 | 954 | 343 | 4593 |
| Gla 3D area 1989 (km2) | 1492 | 2444 | 623 | 1435 | 503 | 6497 |
| Gla 3D area 2015 (km2) | 1234 | 2382 | 612 | 1326 | 427 | 5982 |
| Gla 2D fraction 2015 | 12.4% | 28.9% | 28.5% | 37.4% | 9.3% | 20.6% |
| Gla 3D fraction 2015 | 12.5% | 30.5% | 29.8% | 38.3% | 9.1% | 21.5% |
| 2D(2015–1989)/1989 | −17.0% | −2.7% | −2.0% | −7.7% | −14.2% | −8.1% |
| 3D(2015–1989)/1989 | −17.3% | −2.5% | −1.7% | −7.6% | −15.1% | −7.9% |
Table 8.
The glacier 2D area changes reported from different studies surrounding Central Tianshan (TS). * Area 1 and Area 2 are the glacier 2D areas in the beginning and end years of investigations, respectively. The capital letters after Central TS are their orientation relative to Central Tianshan. Bold fonts are those reported in this study for comparison.
| Glaciers/Location | Region | Period | * Area 1 (km2) | * Area 2 (km2) | Area Chg. (%) | Chg. Rate (%.a−1) | Document Source |
|---|---|---|---|---|---|---|---|
| Jinghe River Basin | Eastern TS | 1964–2004 | 91.3 | 77.4 | −15.2 | −0.38 | Wang et al., 2014 |
| Urumqi River No.1 | Eastern TS | 1964–2005 | 48.7 | 32.1 | −34.1 | −0.83 | Li et al., 2010 |
| Mt. Karlik | Eastern TS | 1977–2013 | 136.8 | 106.8 | −21.9 | −0.61 | Du et al., 2014 |
| Mt. Karlik | Eastern TS | 2007–2013 | 118.6 | 106.8 | −9.9 | −1.66 | Du et al., 2014 |
| Karatal River Basin | Northern TS | 1989–2012 | 142.8 | 109.3 | −23.5 | −1.02 | Kaldybayev et al., 2016 |
| Ili-Kungoy | Northern TS | 1970–2007 | 672.2 | 564.2 | −16.1 | −0.43 | Narama et al., 2010 |
| Kungey Alatau | Northern TS | 1955–1999 | 243.5 | 165.4 | −32.1 | −0.73 | Bolch, 2007 |
| At-Bashy region | Western TS | 1970–2007 | 113.6 | 95.7 | −15.8 | −0.43 | Narama et al., 2010 |
| Ak-Shirak glacier | Central TS, W | 2003–2013 | 373.2 | 351.2 | −5.9 | −0.59 | Petrakov et al., 2016 |
| Ak-shirak glacier | Central TS, W | 1944–2003 | 424.7 | 371.6 | −12.5 | −0.20 | Aizen et al., 2007b |
| Ak-Shirak glacier | Central TS, W | 1975–2008 | 381.0 | 348 | −8.7 | −0.26 | Pieczonka et al., 2015 |
| E. Terskey Ala-Too | Central TS, W | 1990–2003 | 341.7 | 328 | −4.0 | −0.31 | Kutuzov & Shahgedanova, 2009 |
| S. Muzart Glacier | Central TS, S | 2007–2013 | 1036 | 953 | −8.0 | −1.14 | Wang et al., 2017 |
| S. Muzart Glacier | Central TS, S | 1989–2015 | 1035 | 954 | −7.7 | −0.30 | This study |
| Qinbingtan No. 72 | Central TS | 1964–2008 | 7.27 | 5.62 | −22.7 | −0.52 | Li et al., 2010 |
| Qinbingtan No. 74 | Central TS, SW | 2002–2010 | 6.2 | 6.6 | 6.5 | 0.81 | Pieczonka et al., 2013 |
| Tekes River Basin | Central TS, N | 1970s–2007 | 1511 | 1179 | −22.0 | −0.59 | Xu et al., 2015 |
| Tekes River Basin | Central TS, N | 1989–2015 | 1214 | 1007 | −17.0 | −0.66 | This study |
| Ili River Basin | Central TS | 1970s–2007 | n.a. | n.a. | −15.5 | −0.42 | Wang et al., 2011a |
| Inylchek Glacier | Central TS | 1975–2007 | 665 | 666.3 | 0.2 | 0.01 | Shangguan et al., 2015 |
| Tuomuer Glacier | Central TS | 1964–2003 | 310.4 | 309.4 | −0.3 | −0.01 | Li et al., 2010 |
| Tuomuer region | Central TS | 1964–2003 | 2268 | 2067 | −8.8 | −0.23 | Li et al., 2010 |
| Aksu Catchment | Central TS | 1975–2008 | 3539 | 3410 | −3.6 | −0.11 | Pieczonka et al., 2015 |
| Kumerik/Aksu | Central TS | 1989–2015 | 1883 | 1832 | −2.7 | −0.10 | This study |
| Tianshan | TS in China | 1960–2009 | n.a. | n.a. | −11.5 | −0.23 | Wang et al., 2011a |
| Central Tianshan | Central TS | 2002–2007 | 4906 | 4720 | −3.8 | −0.76 | This study |
| Central Tianshan | Central TS | 1989–2015 | 4997 | 4593 | −8.1 | −0.31 | This study |
© 2018 by the authors. Licensee MDPI, Basel, Switzerland. This article is an open access article distributed under the terms and conditions of the Creative Commons Attribution (CC BY) license (http://creativecommons.org/licenses/by/4.0/).
Share and Cite
MDPI and ACS Style
Wang, X.; Chen, H.; Chen, Y. Topography-Related Glacier Area Changes in Central Tianshan from 1989 to 2015 Derived from Landsat Images and ASTER GDEM Data. Water 2018, 10, 555. https://doi.org/10.3390/w10050555
AMA Style
Wang X, Chen H, Chen Y. Topography-Related Glacier Area Changes in Central Tianshan from 1989 to 2015 Derived from Landsat Images and ASTER GDEM Data. Water. 2018; 10(5):555. https://doi.org/10.3390/w10050555
Chicago/Turabian StyleWang, Xianwei, Huijiao Chen, and Yaning Chen. 2018. "Topography-Related Glacier Area Changes in Central Tianshan from 1989 to 2015 Derived from Landsat Images and ASTER GDEM Data" Water 10, no. 5: 555. https://doi.org/10.3390/w10050555
Note that from the first issue of 2016, this journal uses article numbers instead of page numbers. See further details here.