Influence of Straw Amendment on Soil Physicochemical Properties and Crop Yield on a Consecutive Mollisol Slope in Northeastern China


College of Resources and Environment, Northeast Agricultural University, 600 Changjiang Street, XiangFang District, Harbin 150030, China
*
Author to whom correspondence should be addressed.
Water 2018, 10(5), 559; https://doi.org/10.3390/w10050559
Submission received: 8 March 2018
/
Revised: 19 April 2018
/
Accepted: 24 April 2018
/
Published: 26 April 2018
(This article belongs to the Special Issue Innovation Issues in Water, Agriculture and Food)
Abstract
:Straw amendment (SA) can be used to increase soil organic matter and decrease dioxide carbon emissions. However, the impact of SA on the crop yield is still subject to debate in different areas. In this study, soil temperature (ST), soil moisture (SM), soil bulk density, soil-available-nitrogen (AN), soil-available-phosphorus (AP), crop growth and yield were measured in SA and NSA (no straw amendment) at slope positions of a 130-m-long consecutive Mollisol slope during the maize (Zea mays) growth stages in the North Temperate Zone of China. Compared with NSA, the influence of SA on ST and SM was not consistent, while AN typically increased on the top slope. However, SA conventionally increased AP, increased daily ST and monthly ST (2.4–7.9%), and increased daily SM and monthly SM (2.1–12.5%) on the back slope. SA increased crop yield by 1–9.8% and 55.6–105.1% on the top and back slopes, respectively. At the bottom, SA conventionally decreased ST (0.20–1.48 °C in July and August), SM (3.5–29.6% from May to August), AN and AP, and decreased crop yield (4.1–30.6%). In conclusion, SA changed the equilibrium of ST and SM, influenced the dynamics of AN and AP on the consecutive slopes, and increased yield on both the top and back slopes but decreased yield at the bottom.
1. Introduction
Crop residues are the main by-products in agriculture, especially in maize cultivation [1]. The management of crop residues significantly influences soil quantity and environment [2,3,4]. In terms of management strategies, several options are available, including burning, incorporation, direct drilling-in of surface residues, under-sowing crops, and baling and removing of crop residues for use as stock feed, building material, fuel, livestock bedding, composting for mushroom cultivation, bedding for plants, and sources of chemicals [5]. Straw amendment (residue mulch or residue incorporation) added to soils is usually considered the most efficient method to increase soil organic carbon (SOC) and decrease salinity, gas emissions, and soil loss [3,5,6,7,8,9,10,11]. However, the impacts of straw amendment (SA) on crop yield are still subject to debate in different areas [9,10,11,12,13,14,15], especially considering different regions under different soil types and climatic conditions.
Effects of SA on the dynamics of soil water, runoff, infiltration, soil temperature, nutrients and soil water use and productivity are contradictory because of soil characteristics, climate and crop and soil management practices which vary enormously [9,12,13,14]. Generally, residue incorporation reduces surface runoff, increases SM, crop transpiration and WUE (crop water use efficiency), and decreases ST; the extent to which this happens is mainly determined by the growth stage and the amount of residue returned to the soil [9,16,17,18,19]. Furthermore, intensified straw application significantly reduces evapotranspiration at the grain-filling to the maturity stages, and significantly increases surface SM at the grain-filling stage and considerably improves rainfall-use efficiency (RUE) during the whole growth period [20]. However, in another study, ditch-buried straw return decreases SM, but increases mean ST in a humid, mid-subtropical monsoon climate and increases soil microbial activity [21]. In addition, the positive effects of residue incorporation on water balance and crop yield are more pronounced at dry sites than at wet sites. Residue incorporation can be an effective adaptation option for mitigating the impacts of climate change on winter crops by improving WUE, and it is particularly effective in narrow-leaf cropping systems in hot and dry environments [11]. Compared with NSA (no straw amendment), SA typically decreases the uptake of soil nitrogen, while higher levels of mineral N addition can mitigate the harmful effects of SA [3,15,22]. It is also reported that plant growth can be immediately enhanced by plant residues with a low C/N ratio, even under drought-stress conditions [23]. Furthermore, SA increases soil organic matter, decreases soil bulk density, reduces the stability of aggregates, water infiltration, saturated/unsaturated hydraulic conductivity, and air permeability, and thereby increases soil and water loss; SA changes the dynamics of SM and ST, and influences the activity of microbe and nutrient transformation [3]. However, most studies evaluating the impacts of straw amendment on soil physicochemical properties have been mainly carried out on flat or sloping plots [12,21,24], while the precise impacts of straw amendment in fields with consecutive slopes remain unknown.
In Northeast China, crop residues are typically burned after harvest, a practice which has been applied for several hundred years. In recent years, SA has been widely adopted in this Mollisol region, and SA typically decreases the crop yield in the flat area [12]. However, it is not clear how straw amendment influences crop yield in a sloped field. It is the premise of this study that crop yield influenced by SA was different between a sloped and flat field. In the study, crop yield and its main driving factors, e.g., SM, ST, soil available nutrients, were monitored in a field with consecutive slopes over a period of two years. We aim to determine how SA changes soil physicochemical properties and influences crop growth and yield in the Mollisol region of Northeast China. The information from the results of the impacts of straw amendment on crop yield can be used for the development of local residue management and can also be transferred to other Mollisol regions, such as the mid-latitudes of North America, Eurasia, and South America with larger Mollisol areas [25].
2. Materials and Methods
2.1. Research Location
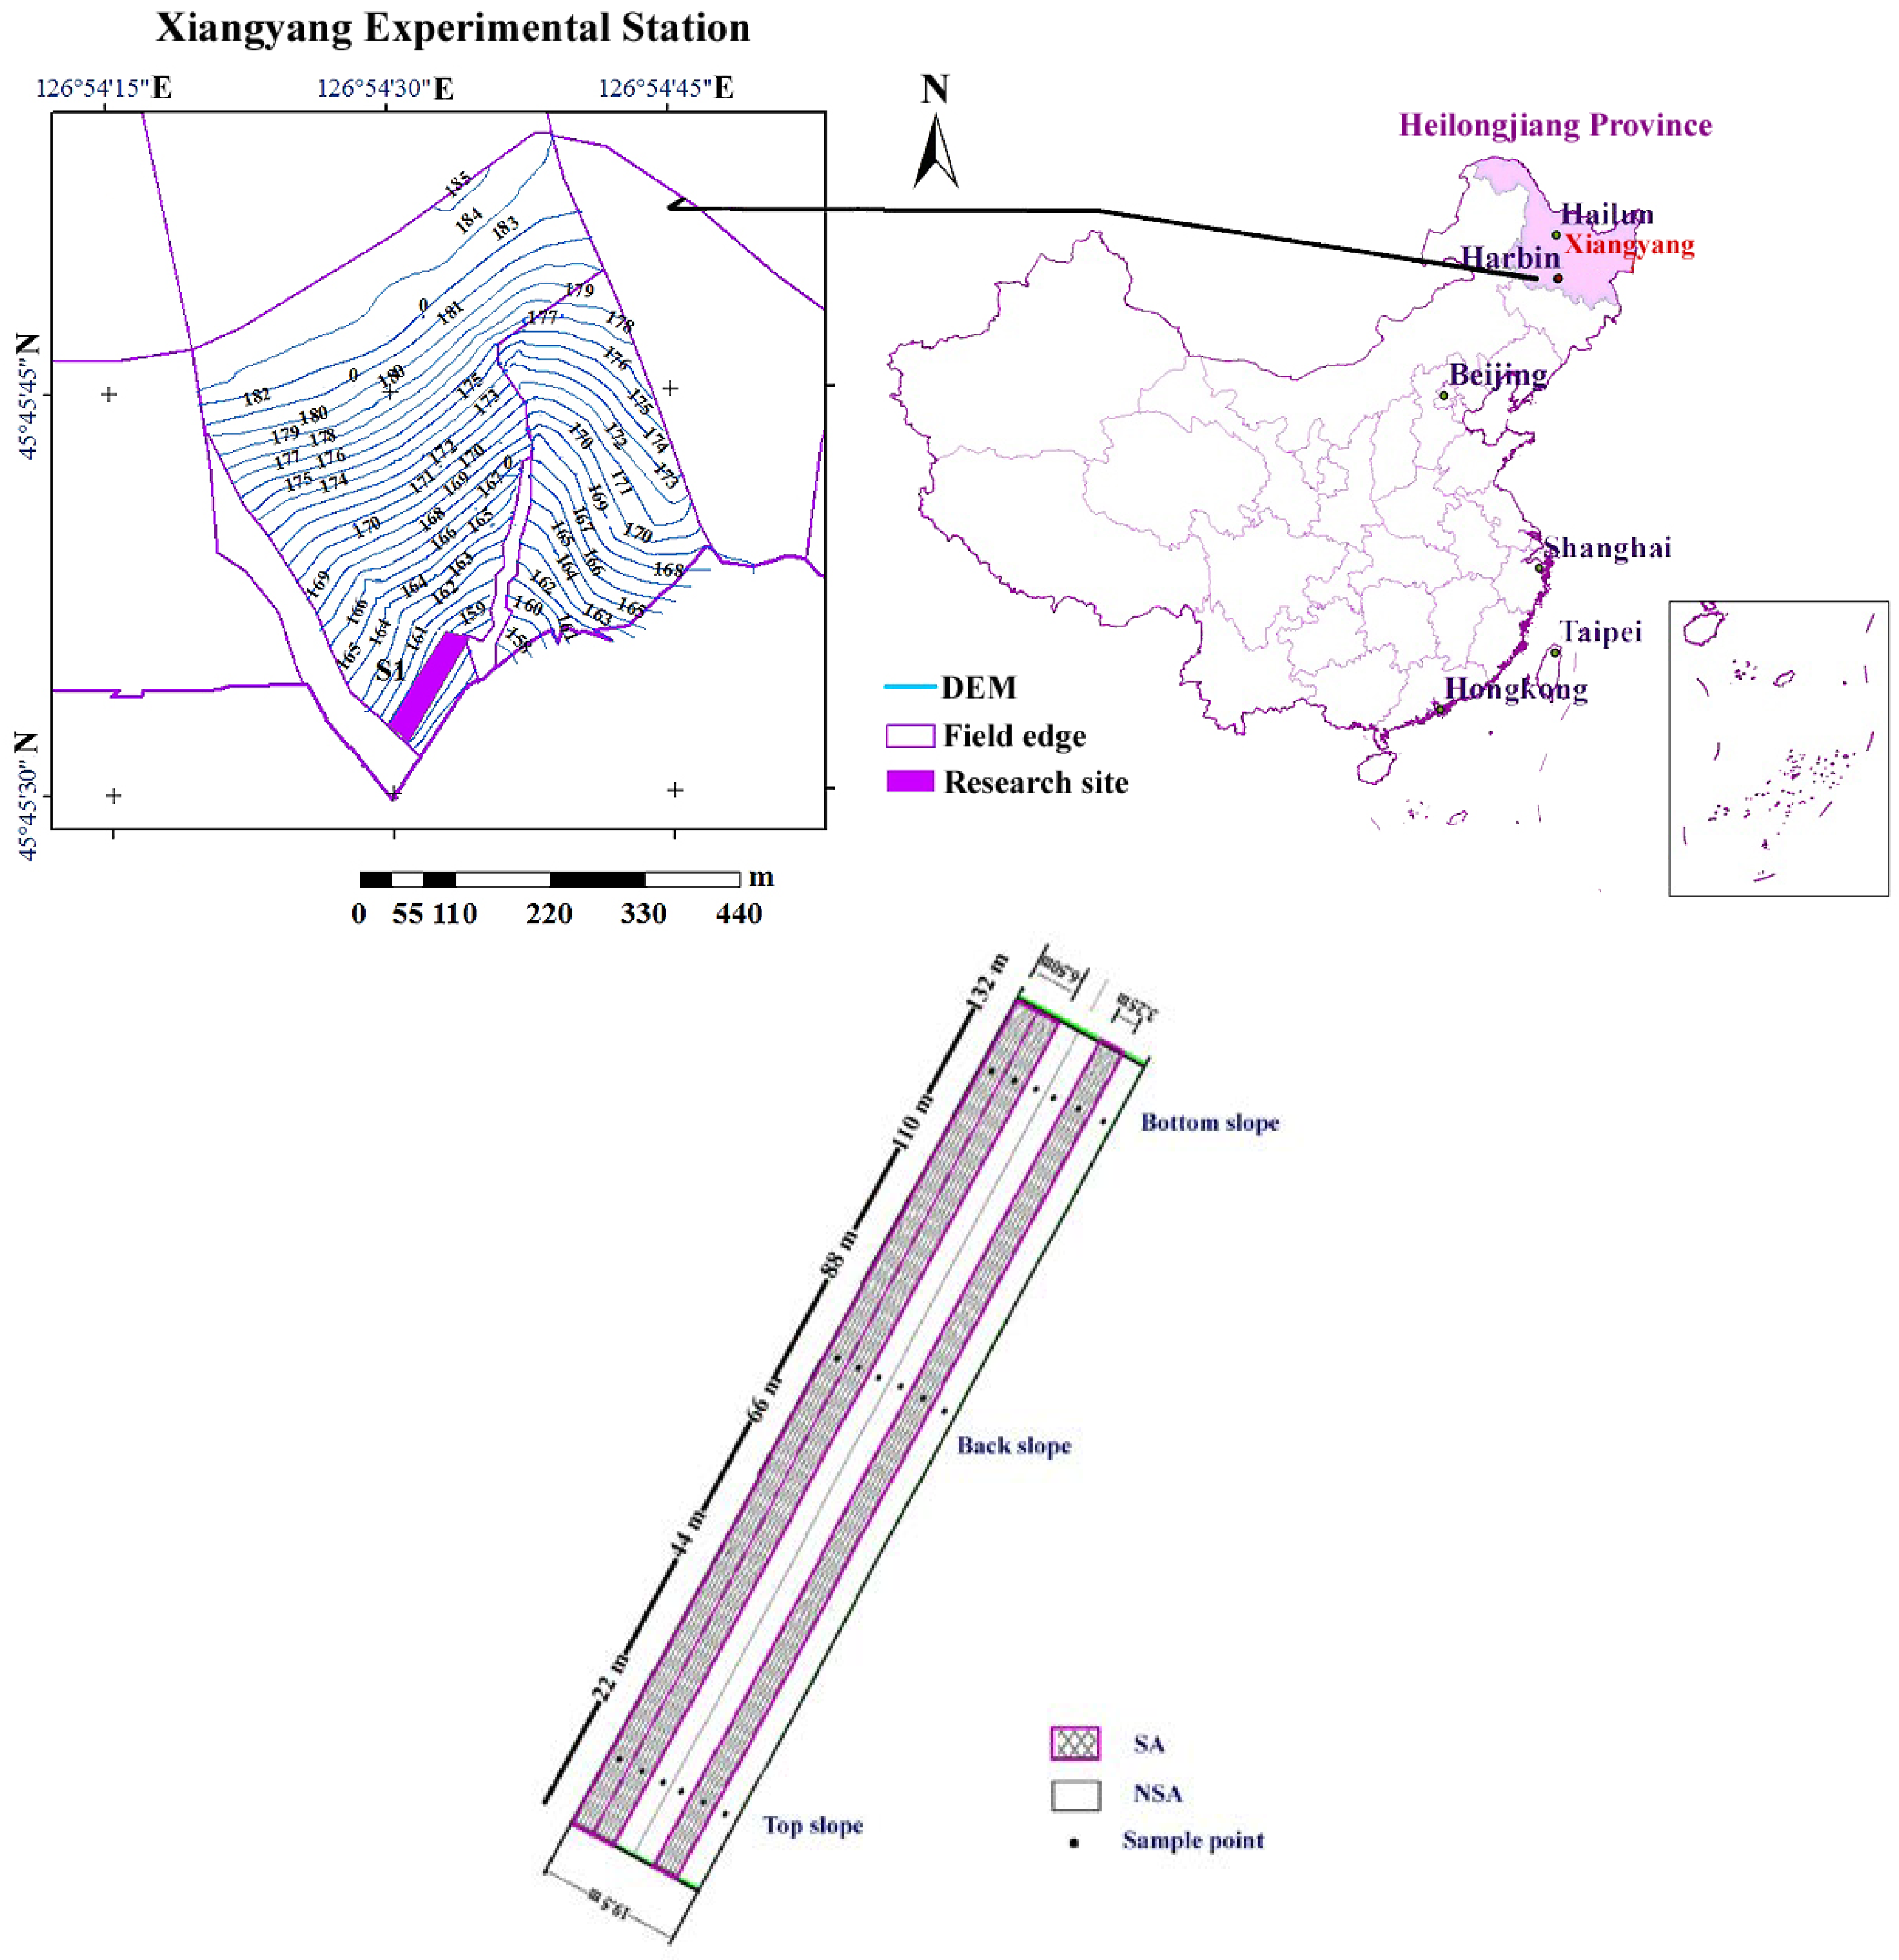
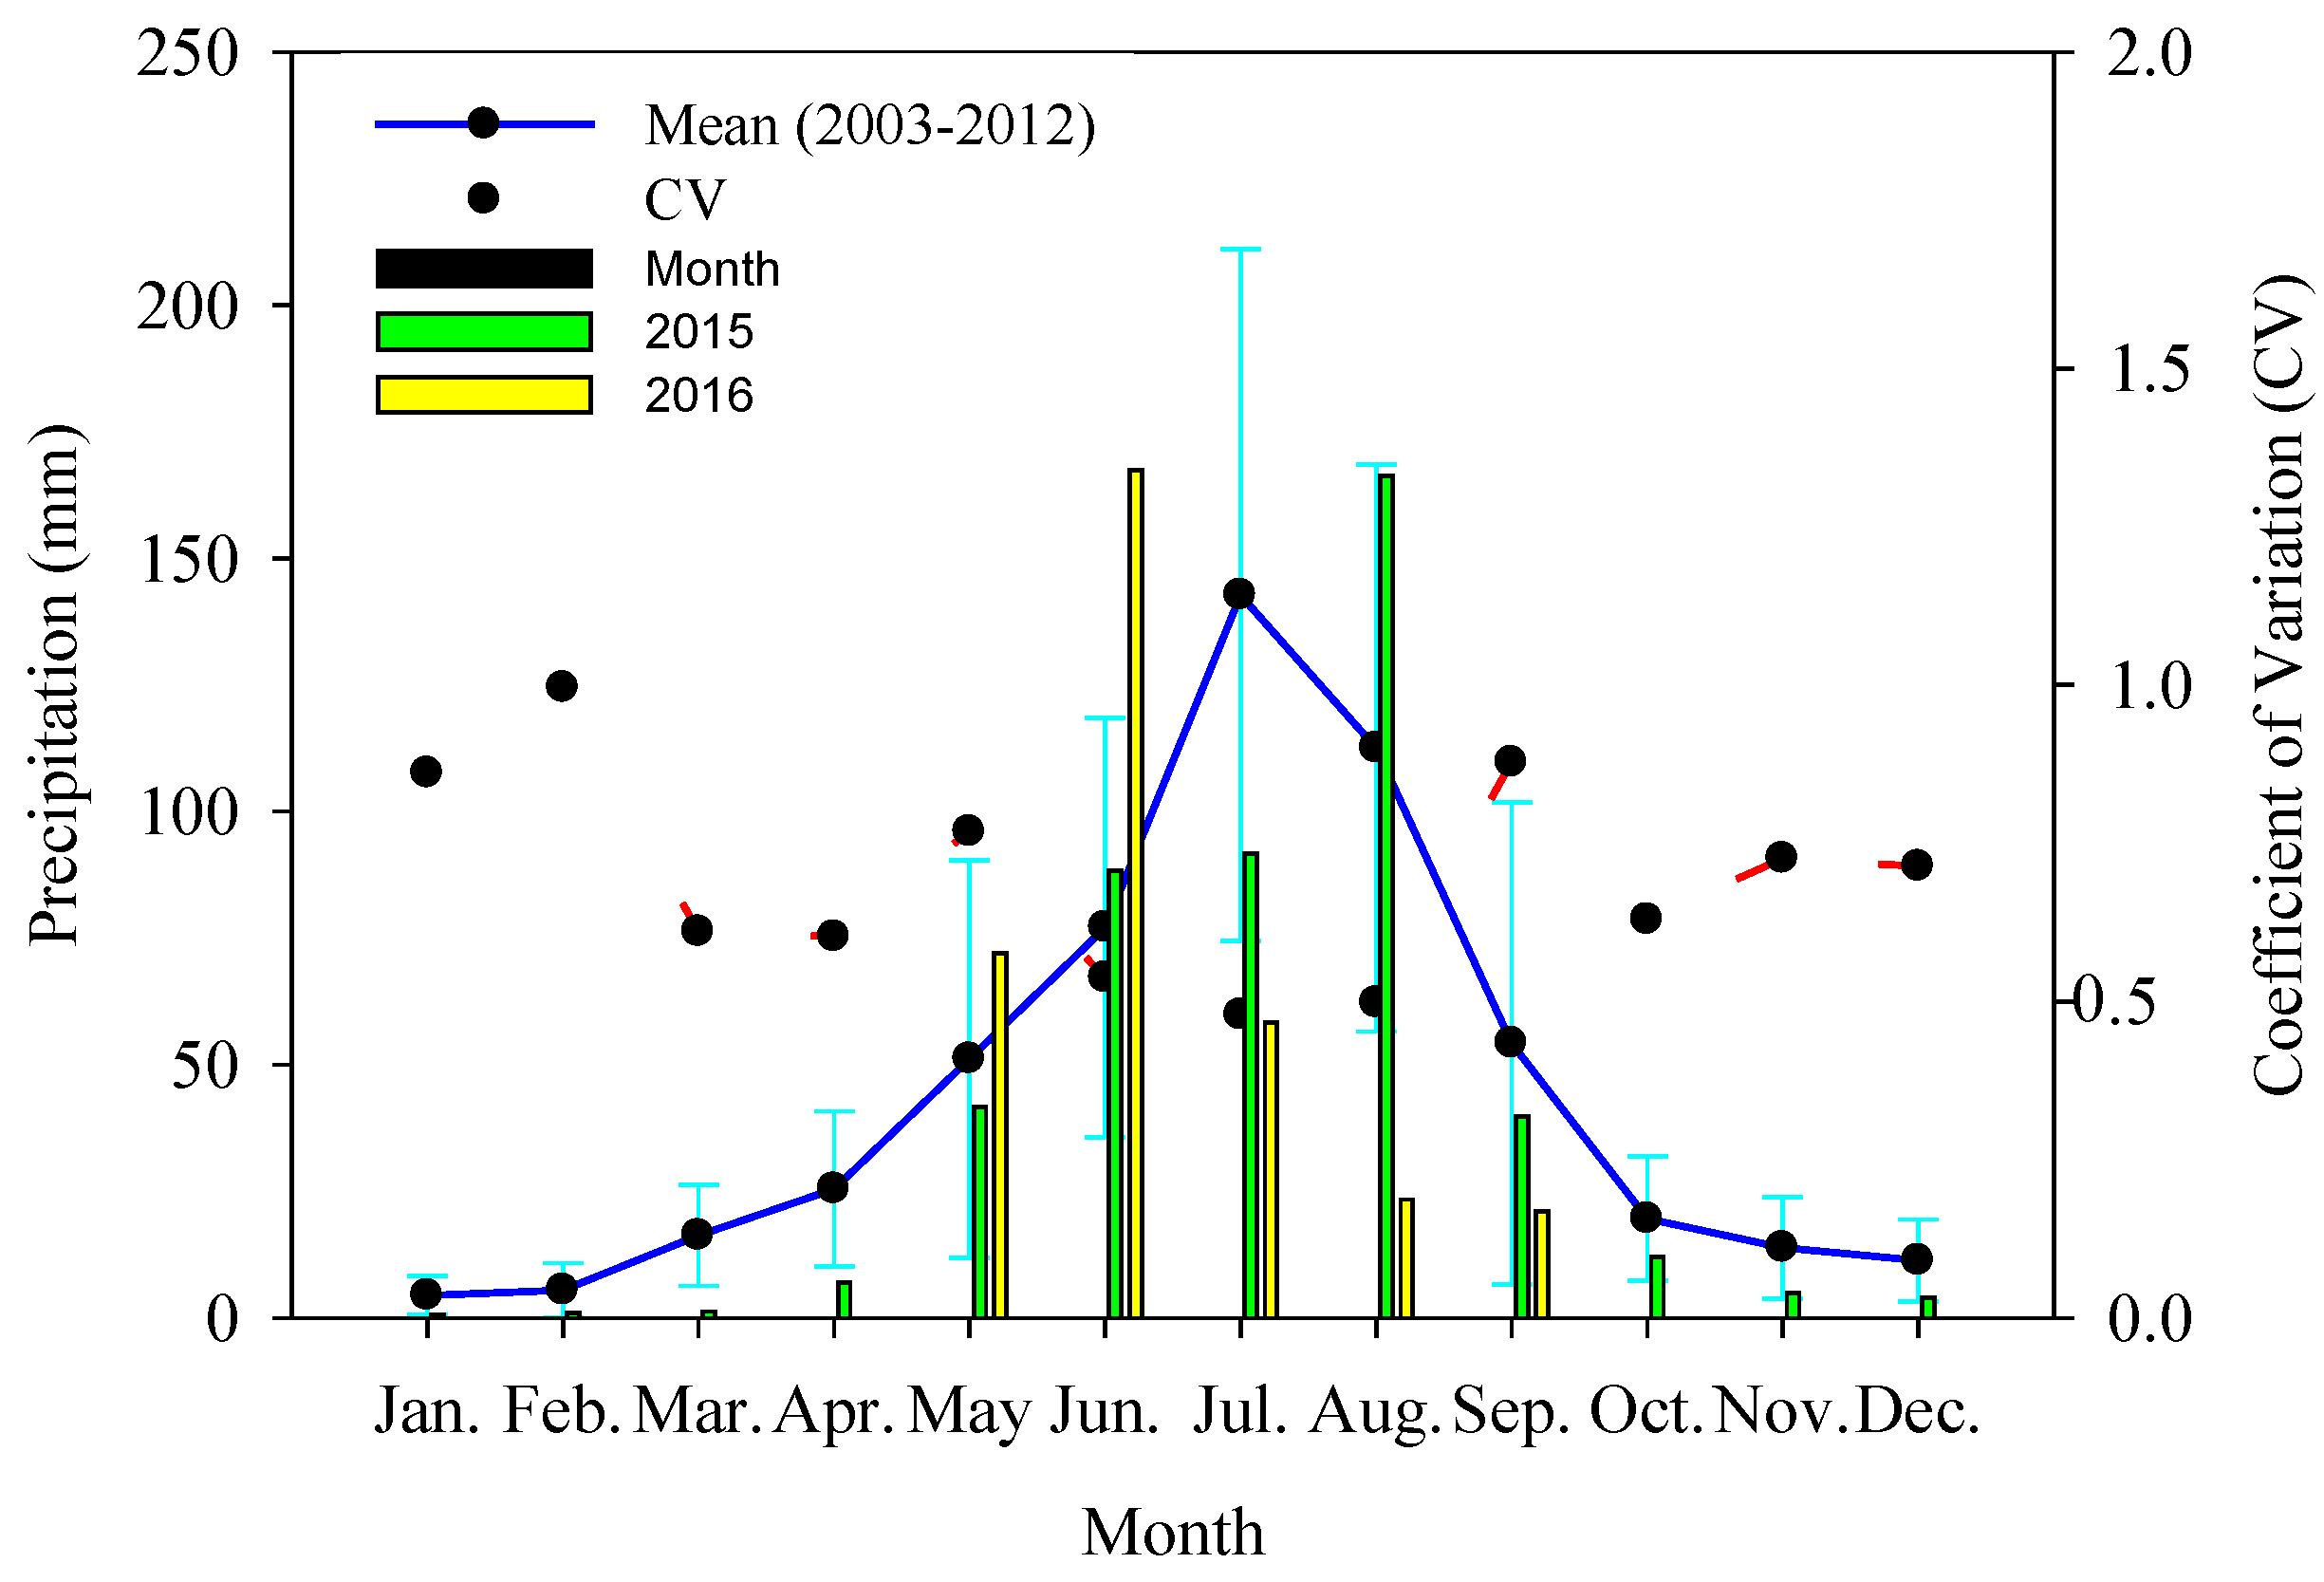
Our research site (45°45′35.82″ N, 126°54′34.35″ E) is in the Xiangyang experimental station of Northeast Agricultural University (45°45′27″–45°46′33″ N, 126°35′44″–126°55′54″ E), Harbin city, Heilongjiang province in Northeast China (Figure 1). The experimental station is located in the North Temperate Zone of China. This area has a continental monsoon climate with hot and rainy conditions in the summer, and cold and arid weather in the winter. The average annual temperature is 3.5 °C and annual sunshine duration averages between 2400 and 2500 h. Total annual solar radiation is 4718.7 MJ m−2, and the annual average available accumulated temperature (≥10 °C) is 2558 °C. Average annual precipitation (rainfall and snow) is 534 mm (coefficient of variation = 2%) and annual rainfall is 497 mm (coefficient of variation = 2%) over a 20-year period. Average annual rainfall is 457.3 mm (coefficient of variation = 3.8%), with 65% of rainfall falling in June, July and August over the 10 years from 2003 to 2013 (Figure 2).
Formation of soils in the study area began during the Quaternary period on loess deposits under natural grasses and now have a rich, dark organic layer (mean depth of 30 cm) and are classified as Black soil by the Chinese Soil Taxonomy (CST), Phaeozems by the World Reference Base for Soil Resources (WRB), and Mollisols by the US Soil Taxonomy (USST) [26]. Generally, the most slopes are inclined at less than 5°, but are more 100 meters in length. These soils have a silty clay-loam texture with high productivity. The mean soil physicochemical properties of the research sites are shown in Table 1.
2.2. Experimental Design
This experimental station was built in 2014, while most of the experiments were run from 2010. Corn (Zea mays) was planted without organic fertilizers (only inorganic fertilizers were used), and all crop residues were burned in the autumn from 2010 to 2014. The field is on a northeastern-facing slope (steepness of 5°) that was classified into three slope positions (top, back slope and bottom) at intervals of 44 m down the length of the slope (132 m). All consecutive slope positions from top to bottom were considered to reflect the effect of the straw amendment on the dynamics of SM and ST along the whole slope. Before the experiment was initiated, soils at a depth of 0–30 cm in the same slope position (22 m wide across the altitude) were mixed evenly by tractors in the autumn of 2014. A randomized complete block experimental design with three replications was established on the slope at the end of 2014, and the new ridges were formed in the spring of 2015. Each plot of the experimental site was 3.25 m wide across the slope and 130 m long up and down the slope; crop rows were planted 0.65 m apart. Treatment systems included SA and NSA. In the SA treatment, all crop residues were cut into lengths less than 20 cm by the harvester (John Deere), and then all crop residues were directly, evenly, and completely incorporated into 0–30 cm soil depth after harvest, and new ridges (0.65 m wide) were formed at the same time in the autumn. In the NSA treatment, all crop residues were removed from the field at harvest, and then the plots were rotated (30 cm deep), and new ridges (0.65 m wide) were formed at the same time in the autumn. Corn cultivars Xianyu 335 (Zea mays) and Pengcheng 216 (Zea mays) were planted in spring of 2015 and 2016, respectively (Table 2). All seeds were coated with an insecticide consisting of Sanmate (15%), Thiram (10%), and Carbofuran (10%) (40 kg of seed coated with 1 kg insecticide). Seeding and fertilization were done mechanically in the same operation. No other insect and disease control methods were used during the rest of the crop growing season.
2.3. Measurements and Calculations
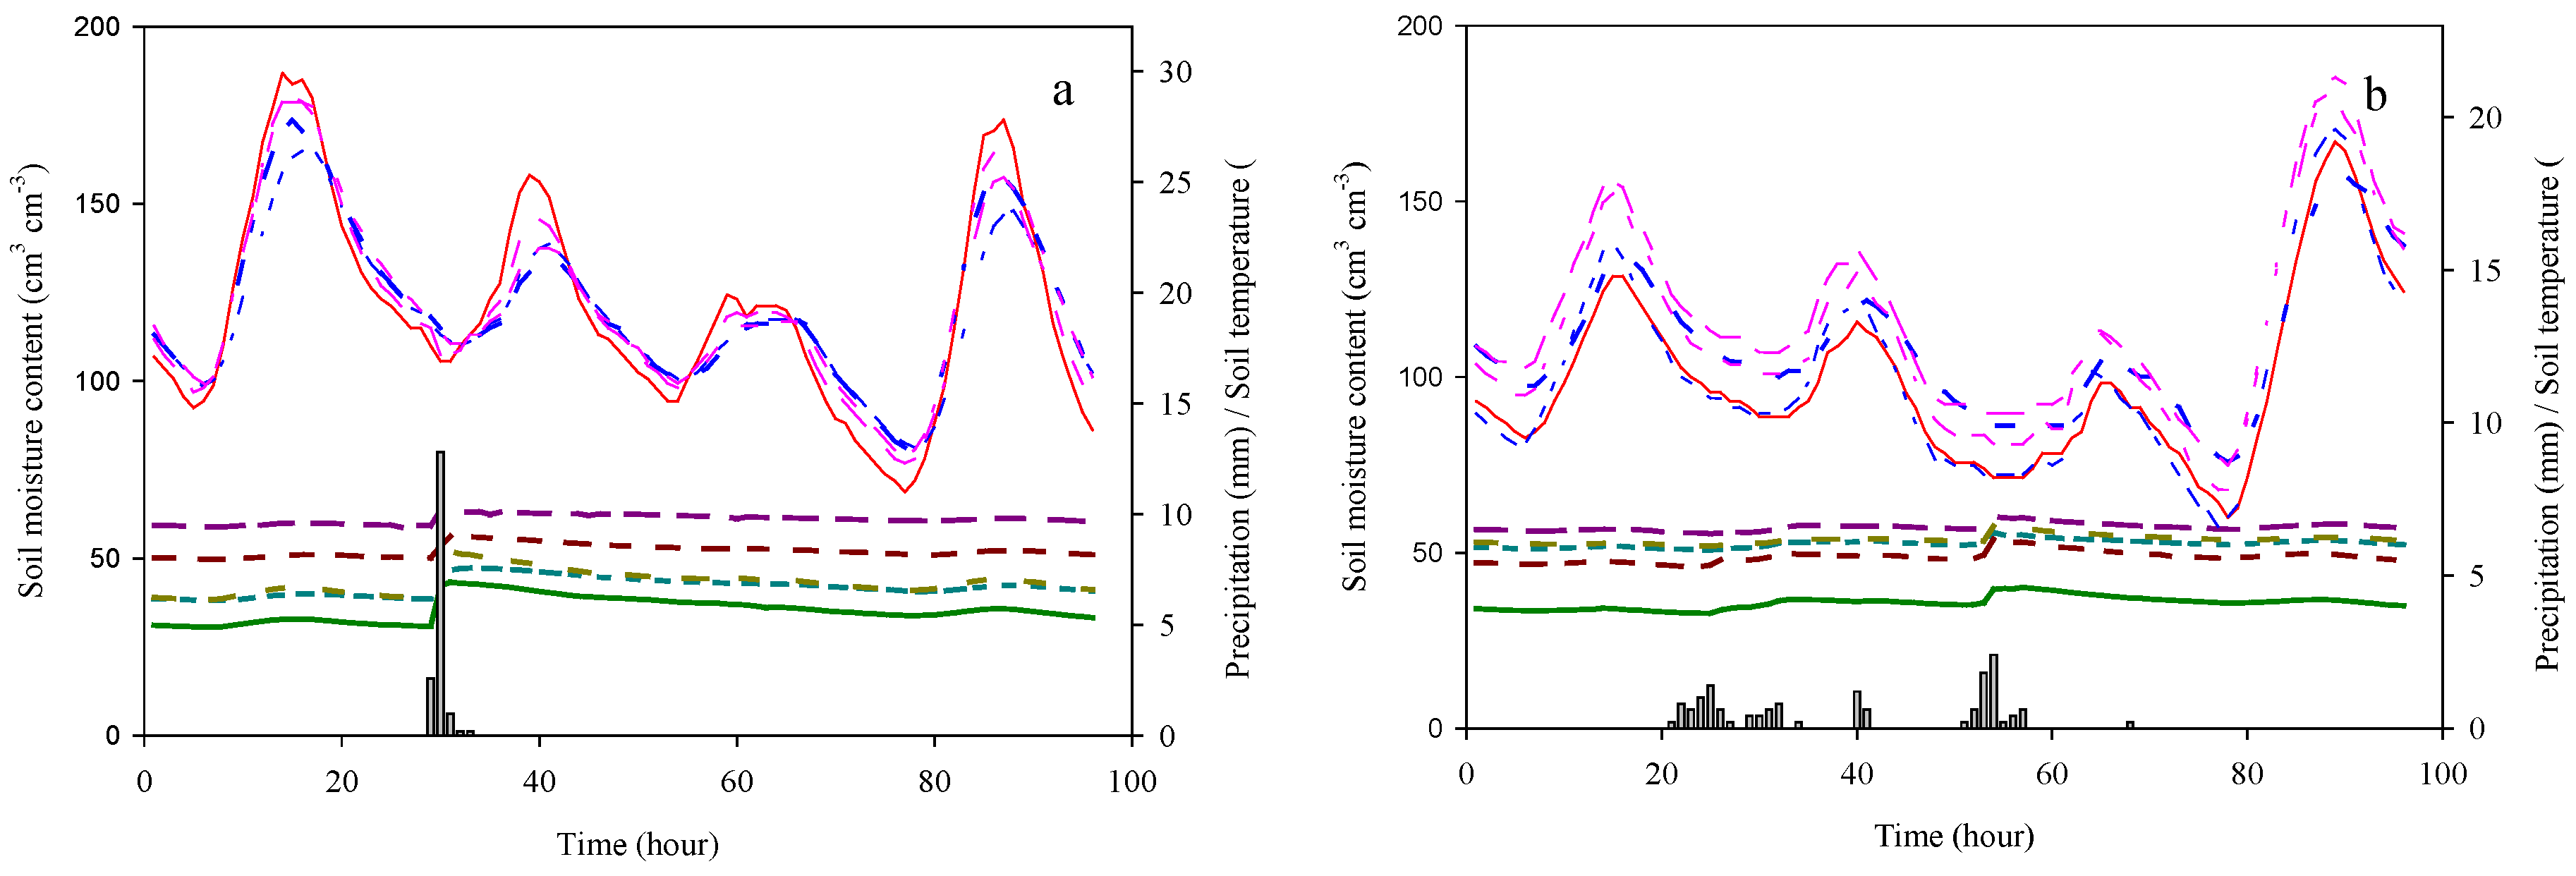
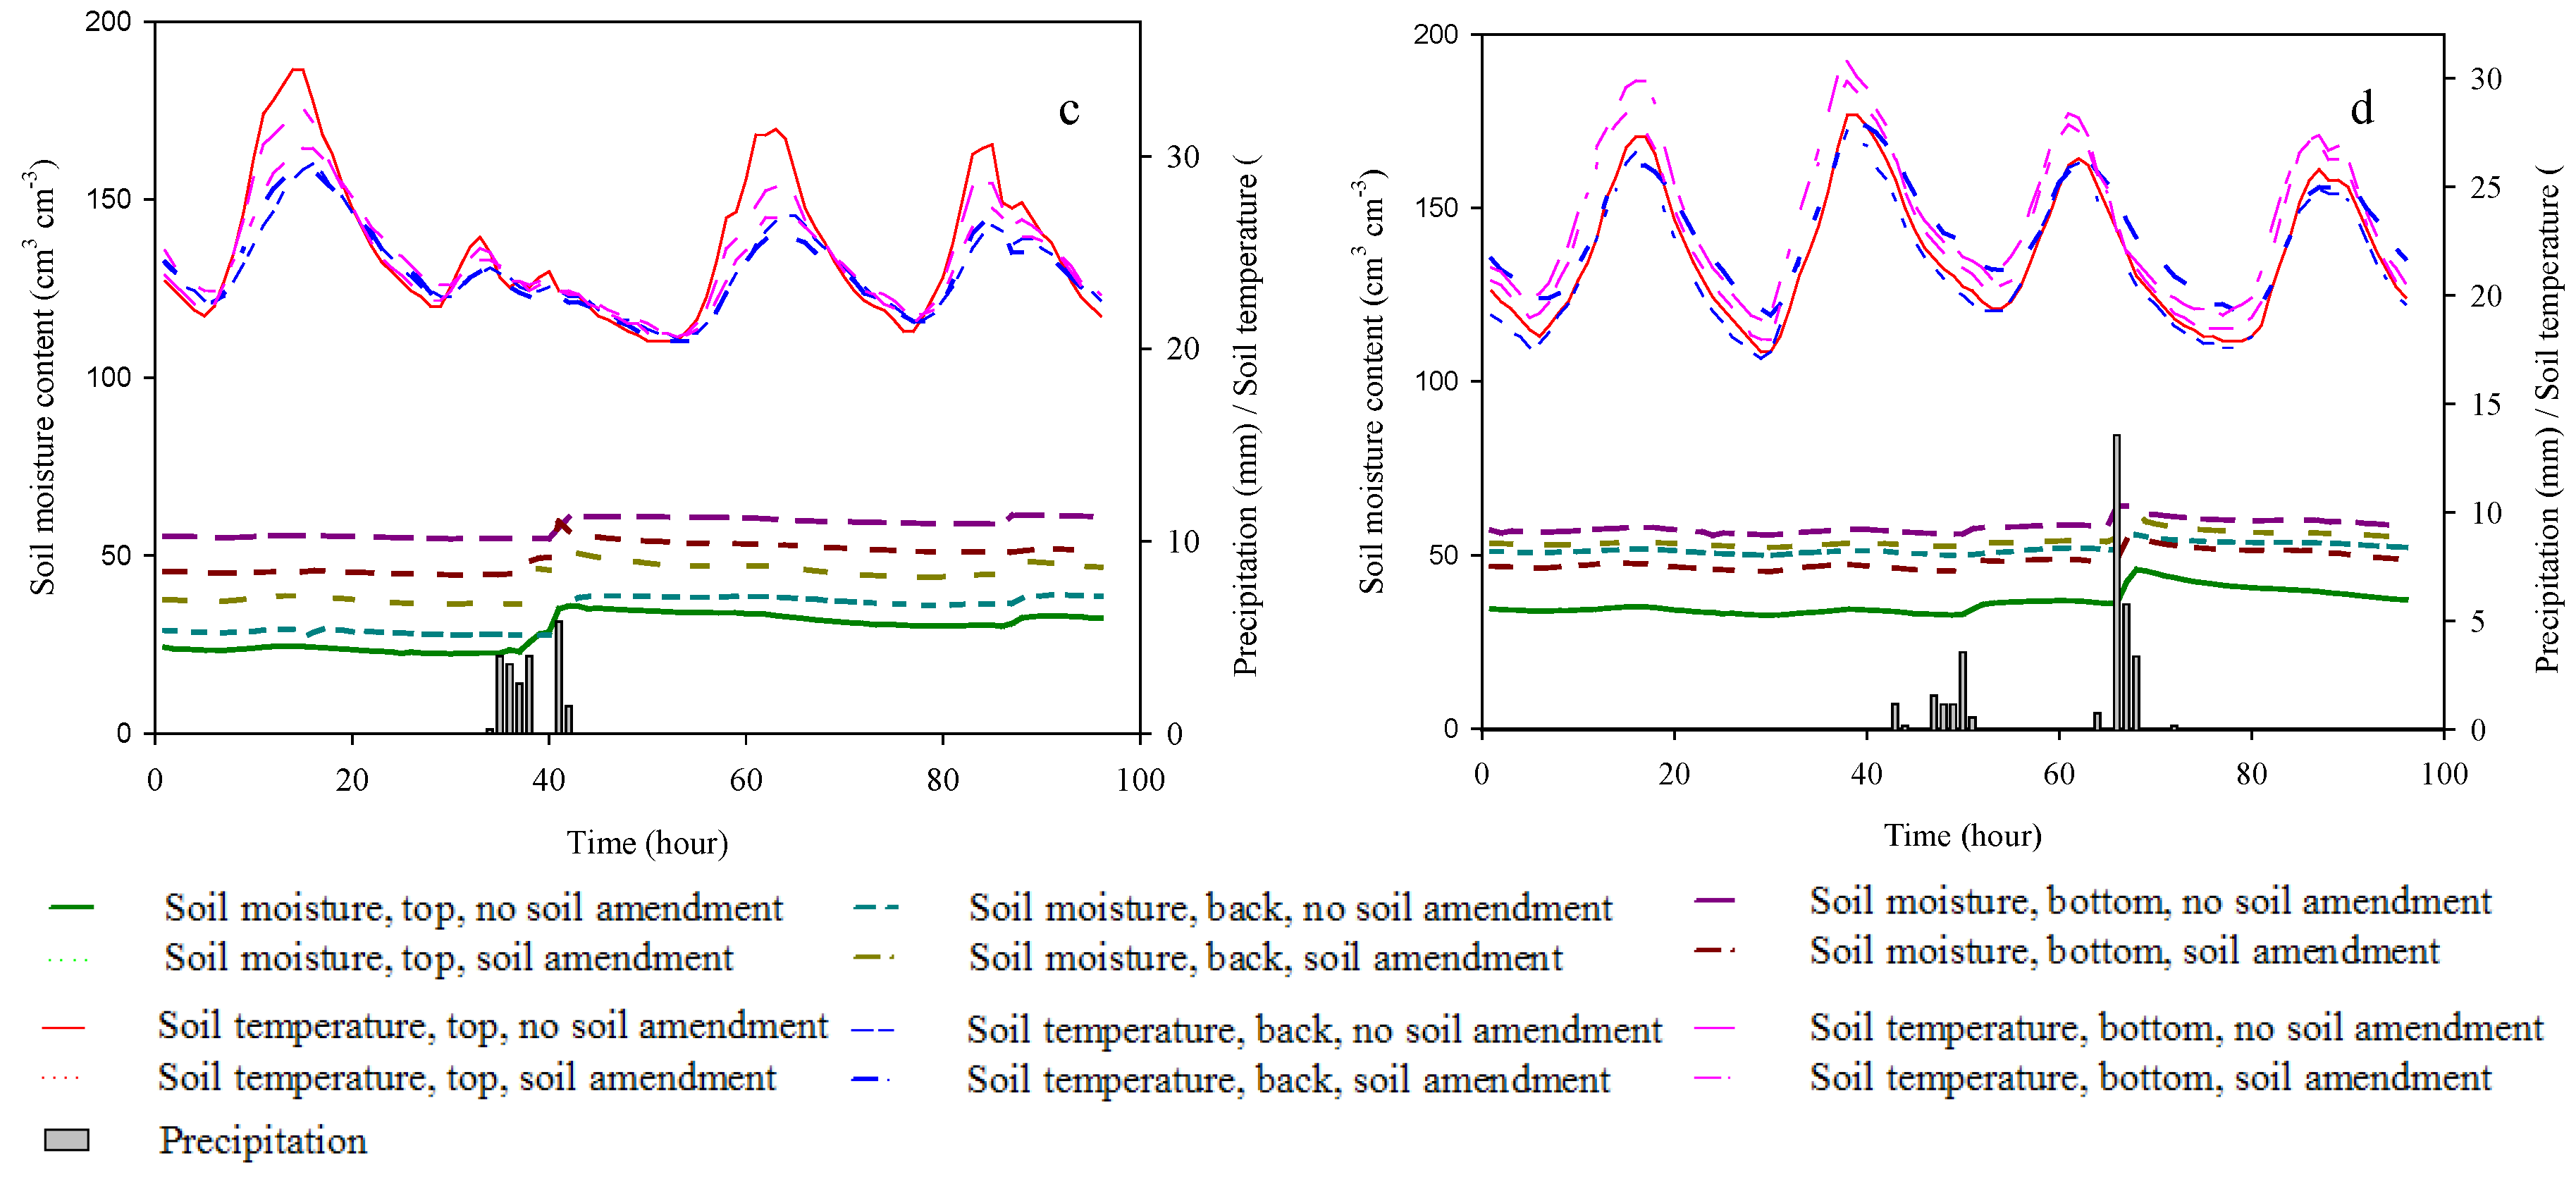
Precipitation, SM and ST were all monitored once per hour by TBR (tipping bucket rain gauge), FDR (Frequency Domain Reflectomestry) and a thermistor probe (Made by Qingshen electronic equipment limitation company of China) from May to October. Only three transects 0–22 m (top slope), 66–88 m (back slope) and 110–132 m (bottom) on the slope field were used for sampling and monitoring (Figure 1). FDR and thermistor probes were buried in the soil at a depth of 10 cm in the center of the ridges, at the top slope, back slope and bottom slope. Consecutive 96-h data (four days) collected before and after precipitation were used to reflect the dynamics of daily ST and SM in May, June, July and August in this study. The mean values of ST and SM per hour for a whole month were used to represent the monthly ST and SM.
Soil samples were collected from the 0–22 m (top), 66–88 m (back slope) and 110–132 m (bottom) slope positions and used for nutrient analysis in July (growing stage) and September (mature stage) in 2015 and 2016. Each soil sample at the 0–20 cm depth was comprised of a mixture of five cores taken randomly from within a 1 m2 plot across slope positions. Soil samples were transported to the laboratory as soon as possible after collection from the field, and then were measured at once. Ammonium nitrogen (NH4+-N) was analyzed using the colorimetric method (625 nm) of indophenol blue-KCl extraction, and nitrate nitrogen (NO3−-N) was detected using the colorimetric method (220 nm minus 275 nm) after 2 mol L−1 KCl extraction [27]. AN (available nitrogen) was calculated as the sum of NO3−-N and NH4+-N. AP was determined using the molybdenum-blue method after extraction with 0.5 mol L−1 NaHCO3 [27]. Soil bulk density was measured on undisturbed soil samples taken from the center of the ridge with 100 cm3 cylinders at 0–5 cm and 10–15 cm depth at slope positions before planting in spring 2016.
The Kolmogorov–Smirnov (K–S) test was used to test the normality of the distribution of various variables across slope position and months. The results showed that site variables (ST and SM) were all normally distributed. One-way analyses of variance (ANOVA) were performed on ST and SM among slope positions and months. Multiple comparisons using the Least Significant Difference (LSD) method were carried out using SPSS 19 statistical software (IBM SPSS Statistics for Windows, Version 19.0. Armonk, NY: IBM Corp.). Variance component estimates and 95% confidence intervals were calculated with restricted maximum likelihood (REML) and unbounded variance components (version 19.0. SPSS lnc.). All figures were drawn by SigmaPlot 10.
3. Results
3.1. Influence of Straw Amendment on Daily Soil Temperature and Soil Moisture in Early Crop Growth Stages
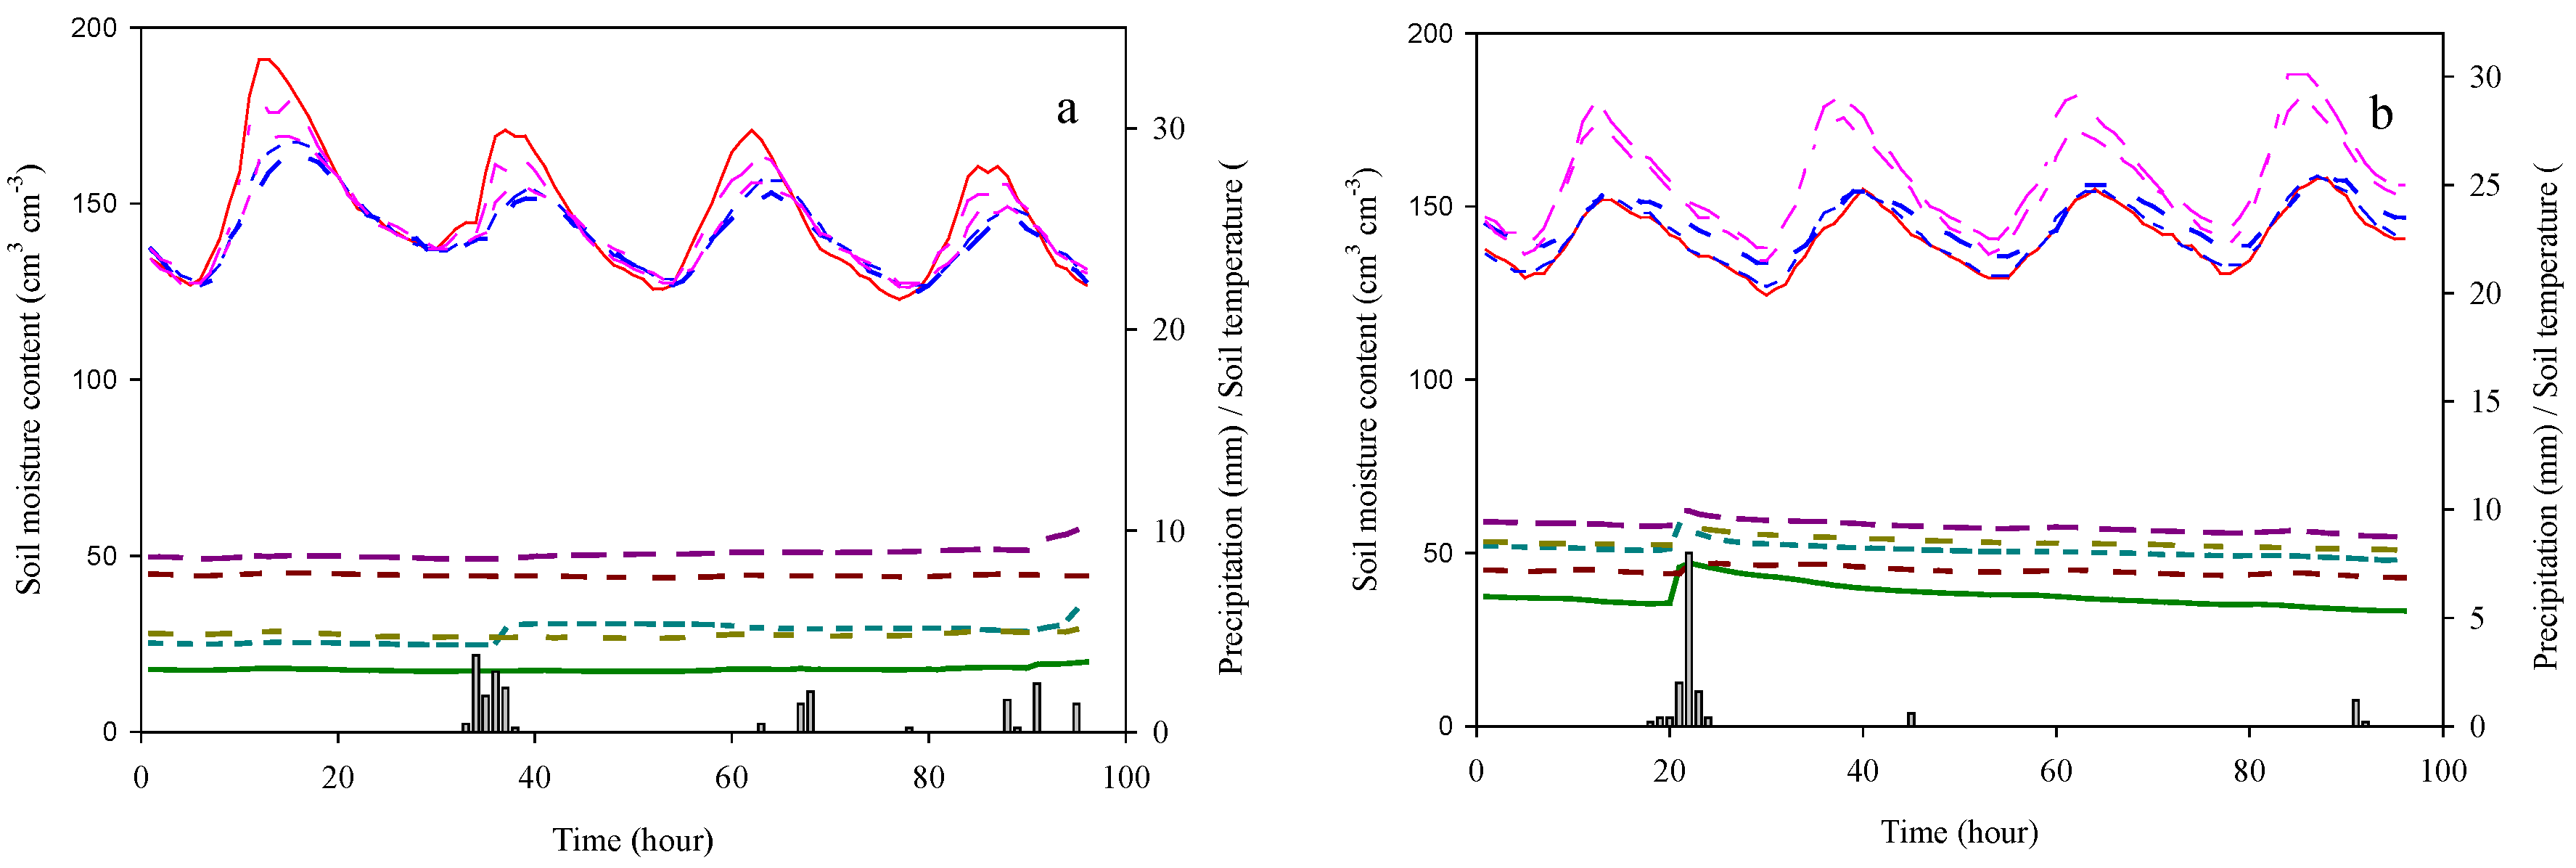
In the early crop growth stages (May and June), precipitation was lower in 2015 than in 2016, while ST was generally higher in 2015. In the early crop growth stages of 2015, ST exceeded values of 10 °C both during the day and at night and before and after precipitation. ST was lower in the SA treatment than in the NSA treatment during the day both before and after precipitation, irrespective of the position (top or bottom of the slope), while it was higher in the SA treatment during the night (Figure 3). In particular, the difference between SA and NSA increased in the middle of the afternoon (12:00–16:00) or after precipitation. On the back slope, ST was higher under SA than under NSA during the day time, while it decreased after precipitation and reached values close to those under NSA in the night.
In May 2016, ST values exceeded 10 °C during the day and at night before precipitation but were lower than 10 °C at night after precipitation across all slope positions. At the top slope, ST differed from that measured in 2015 and was higher in the SA than in the NSA treatment during the daytime and at night, as well as before and after precipitation. On the back slope, ST was lower in the SA than in the NSA treatment for most of the daytime, but was mostly higher in the NSA treatment, especially after precipitation and during the night. The difference in ST between SA and NSA increased during the morning (3:00–5:00) and afternoon (12:00–16:00). In May and June 2016, ST was also lower in the SA than in the NSA treatment during the day and at night both before and after precipitation, while it reached values close to those of SA after precipitation at the bottom of the slope.
In the early crop growth stages of both 2015 and 2016, SM was lower in the SA than in the NSA treatment at the top and bottom of the slope both before and after precipitation, although this difference decreased from May to June. SM under SA was typically slightly higher than under NSA on the back slope in both 2015 and 2016, but lower at the bottom of SA than on the back slope of SA and NSA in 2016.
3.2. Influence of Straw Amendment on Daily Soil Temperature and Soil Moisture in Late Crop Growth Stages
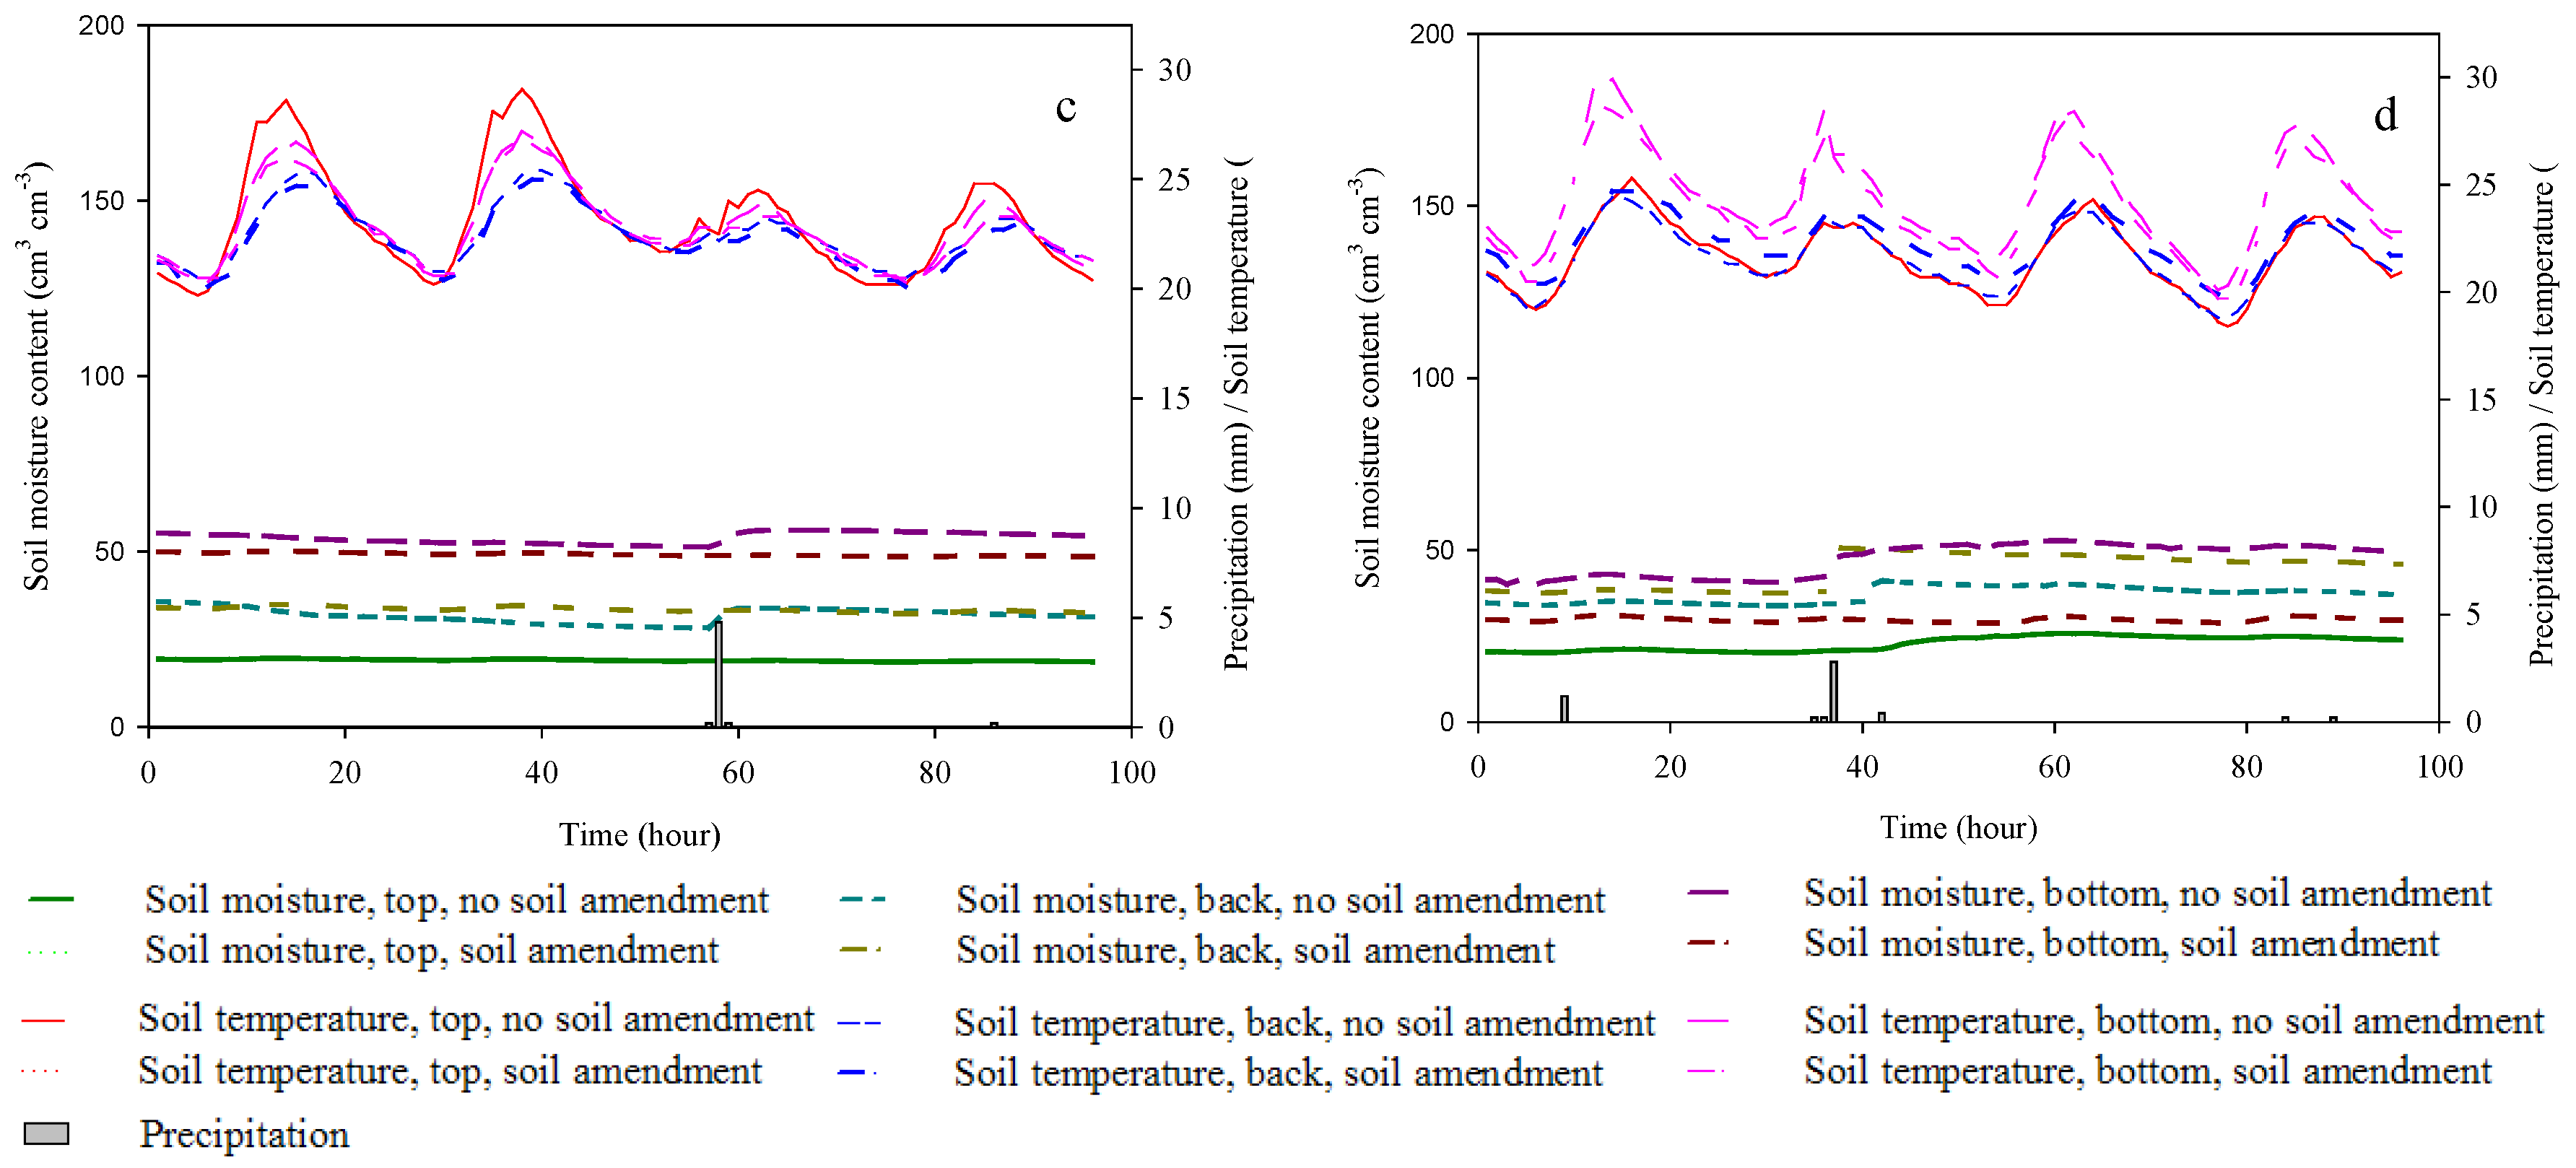
In the late growth stages (July and August), ST exceeded 15 °C in both 2015 and 2016. In 2015, before and after precipitation and at the top and the bottom of the slope, ST was also lower in the SA than in the NSA treatment during the day, but increased during the night (Figure 4). The difference between SA and NSA was only slightly changed by precipitation. On the back slope, ST was generally lower in the SA than in the NSA treatment during the day, but at night, reached values similar to those in the NSA treatment.
In the late growth stages of 2016, at the top slope, ST differed from the values measured in 2015 and was higher in the SA than in the NSA treatment during both the daytime and at night before and after precipitation. On the back slope, ST was higher under SA than under NSA for most of the daytime, and the difference increased at night. ST at the bottom of the slope was also lower under SA compared with NSA during the day and at night both before and after precipitation, while the relationship was hardly changed by precipitation.
ST dynamics in the late growth stages of 2016 were comparable to those in 2015, while the difference between the bottom and the top slope or between the bottom and back slope increased in both July and August 2016. Compared with the early growth stage, the variation of ST on the back slope was lower than that at the top of the slope in 2015 and increased at the bottom in 2016.
In the late growth stages of both 2015 and 2016, SM dynamics were more consistent in SA compared with NSA for most slope positions. At the top of the slope, SM was higher under SA than under NSA in 2015 and lower under SA than under NSA in July 2016; in August 2016, there was no difference prior to precipitation. Generally, SM was slightly higher under SA than under NSA on the back slope in both 2015 and 2016, and this relationship changed slightly after precipitation. SM in the SA treatment at the bottom of the slope was also lower than that in the NSA treatment and even lower than that in both SA and NSA treatments on the back slope in 2016.
3.3. Influence of Straw Amendment on Monthly Soil Temperature across Different Slope Positions
Except in May, monthly ST was highest at the top slope, followed by the back and the bottom of the slope in both SA and NSA treatments in 2015, while it was highest at the bottom in the SA treatment, followed by the back and the top slopes in both SA and NSA treatments in 2016. Compared with NSA, monthly ST at the top slope was generally lower under SA in May, July, and August of 2015, but higher from May to August in 2016 (Table 3). On the back slope, ST under SA was significantly higher, i.e., 7.2%, 7.0%, 4.9%, 3.0%, and 2.4% than that in the NSA treatment in May, June, July, and August 2016, respectively, and similar to the values measured under NSA in 2015 (Table 3). In contrast, ST at the bottom of the slope was significantly lower under SA than under NSA from July to August 2015 and from May to September 2016; in particular, it was 2.2% (0.50 °C), 3.7% (0.98 °C), 2.0% (0.50 °C), and 7.6% (1.48 °C) lower in June, July, August, and September 2016, respectively, than under NSA.
The variance of ST (reflected by the CV) was lower under SA than under NSA at the top of the slope from May to September in both 2015 and 2016 and lower under SA at the bottom of the slope from May to September in 2015, but this trend was not consistent in 2016. On the back slope, the variance of ST was higher under SA than under NSA and similar from June to September in 2015. However, in 2016, the variance was lower under SA than under NSA from May to July on the back slope. Generally, in 2016, ST variance was higher, both at the top and the bottom of the slope, except under NSA in May 2016.
3.4. Influence of Straw Amendments on Monthly Soil Moisture at Different Slope Positions
Monthly SM was highest at the bottom of the slope, followed by the back and the top for SA and NSA in 2015 and NSA in 2016. Monthly mean SM at the top was higher under SA than under NSA from June to September in 2015, but lower under SA than under NSA from May to September 2016 (Table 4). Compared with NSA, SM was significantly higher, i.e., by 1.4%, 32.3%, 37.4%, and 24.5% under SA in June, July, August, and September 2015, respectively, while it was significantly lower by 11.5%, 11.2%, 8.8%, 8.3%, and 10.0% in May, June, July, August, and September in 2016, respectively, at top of the slope. On the back slope, SM was significantly higher under SA than under NSA, i.e., by 2.9%, 10.5%, 8.8%, 8.5%, and 2.0% in May, June, July, August, and September in 2015, respectively, and significantly higher under SA than under NSA, i.e., by 2.1%, 5.7%, 4.2%, 12.5%, and 5.9% in May, June, July, August, and September in 2016, respectively. However, at the bottom of the slope, except in September, SM was significantly lower, i.e., by 14.7%, 12.9%, 6.7%, and 3.5% under SA compared with NSA in May, June, July, and August 2015, respectively, and was significantly higher, i.e., by 15.9%, 15.9%, 22.1%, 29.6%, and 28.3% under SA than under NSA in May, June, July, August, and September 2016, respectively.
The variance of SM (reflected by the CV) was lower under SA at the top of the slope from July to September and lower under SA on the back slope in August and September; it was consistently higher under SA at the bottom of the slope from May to September. The variance decreased from the top to the bottom of the slope for both NSA and SA in 2015 and for NSA in 2016, while it deceased towards the back of the slope and increased towards the bottom under SA in 2016.
3.5. Influence of Straw Amendment on Soil Bulk Density
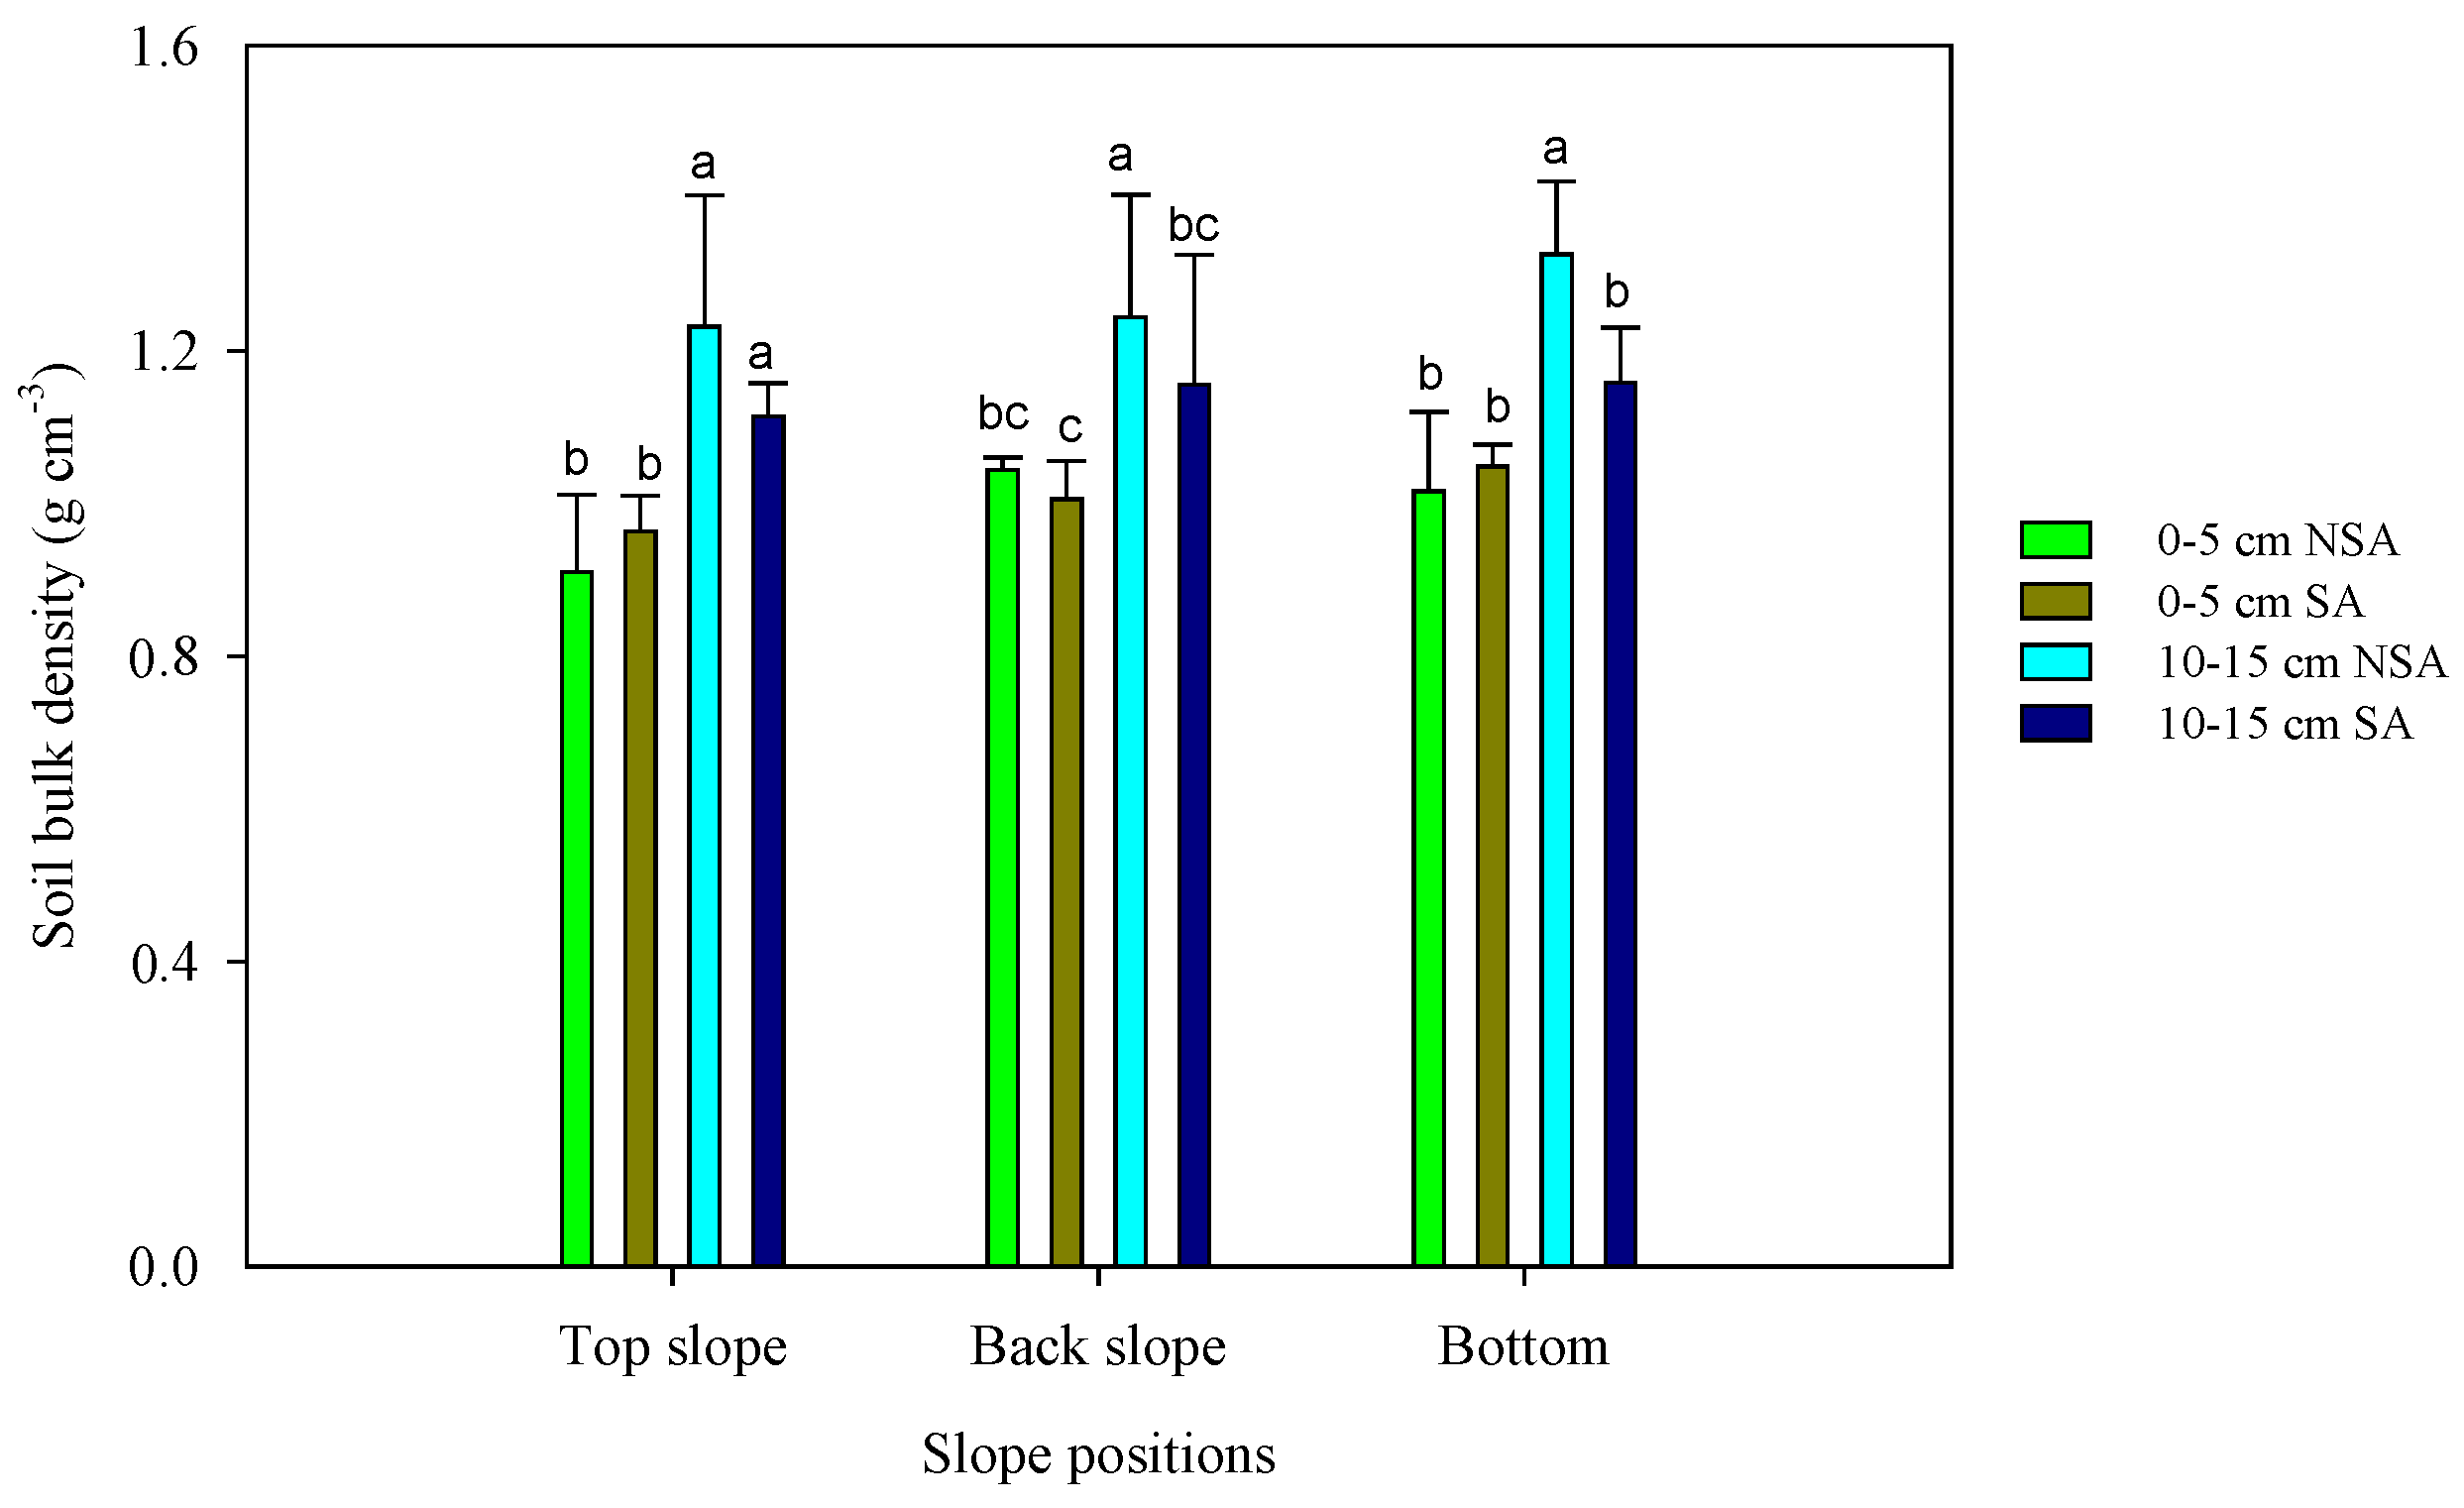
Soil bulk density was measured under SA and NSA before planting in spring 2016 (between 2015 and 2016). Soil bulk density was compared between SA and NSA across soil depths at the same slope position. At the top, soil bulk density was significantly higher (35%) at the depth of 10–15 cm compared with that at the 0–5 cm soil depth under NSA and significantly higher (16%) at 10–15 cm compared with that at 0–5 cm under SA; compared with NSA, SA decreased soil bulk density at the 10–15 cm soil depth, but this was not significant. At both the back of the slope and at the bottom, soil bulk density was significantly higher, i.e., 19% (back of the slope) and 31% (bottom) at the 10–15 cm soil depth compared with the 0–5 cm soil depth under NSA, but no significant differences were observed between the soil depths of 0–5 cm and 10–15 cm under SA; SA significantly decreased soil bulk density by 7% at the back of the slope and by 13% at the bottom at the 10–15 cm soil depth compared with NSA.
3.6. Influence of Straw Amendment on Soil Nutrients
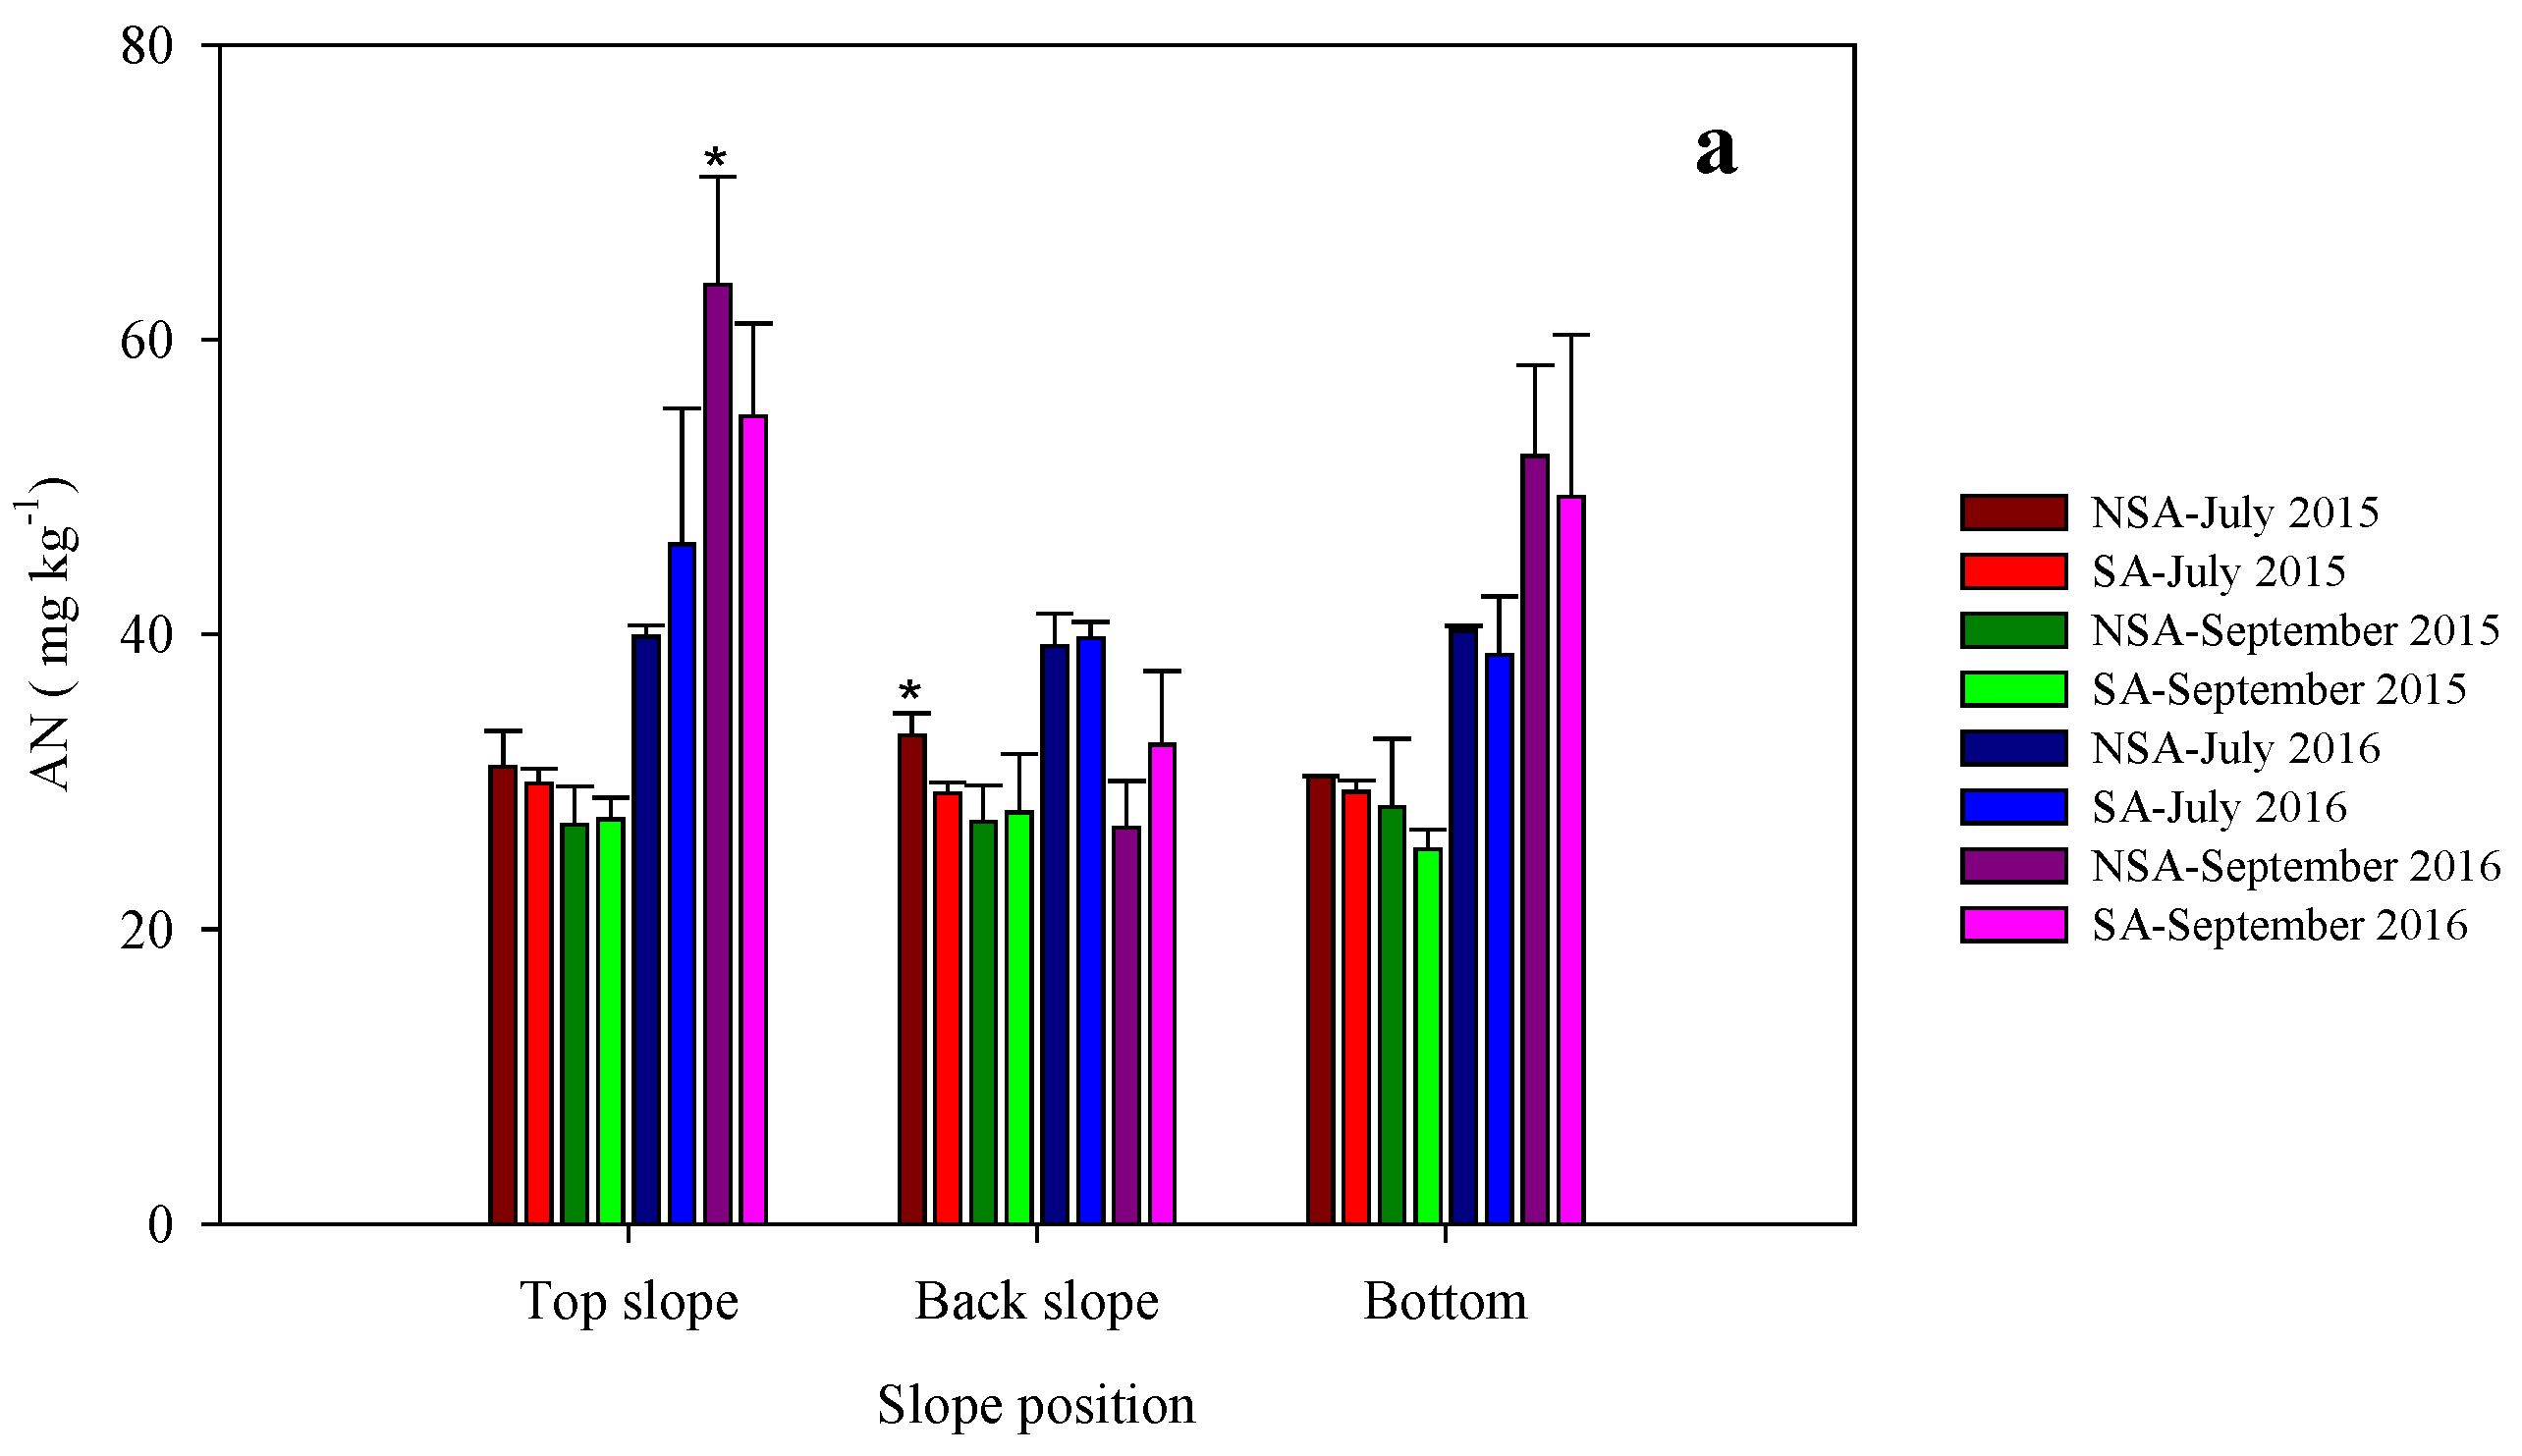
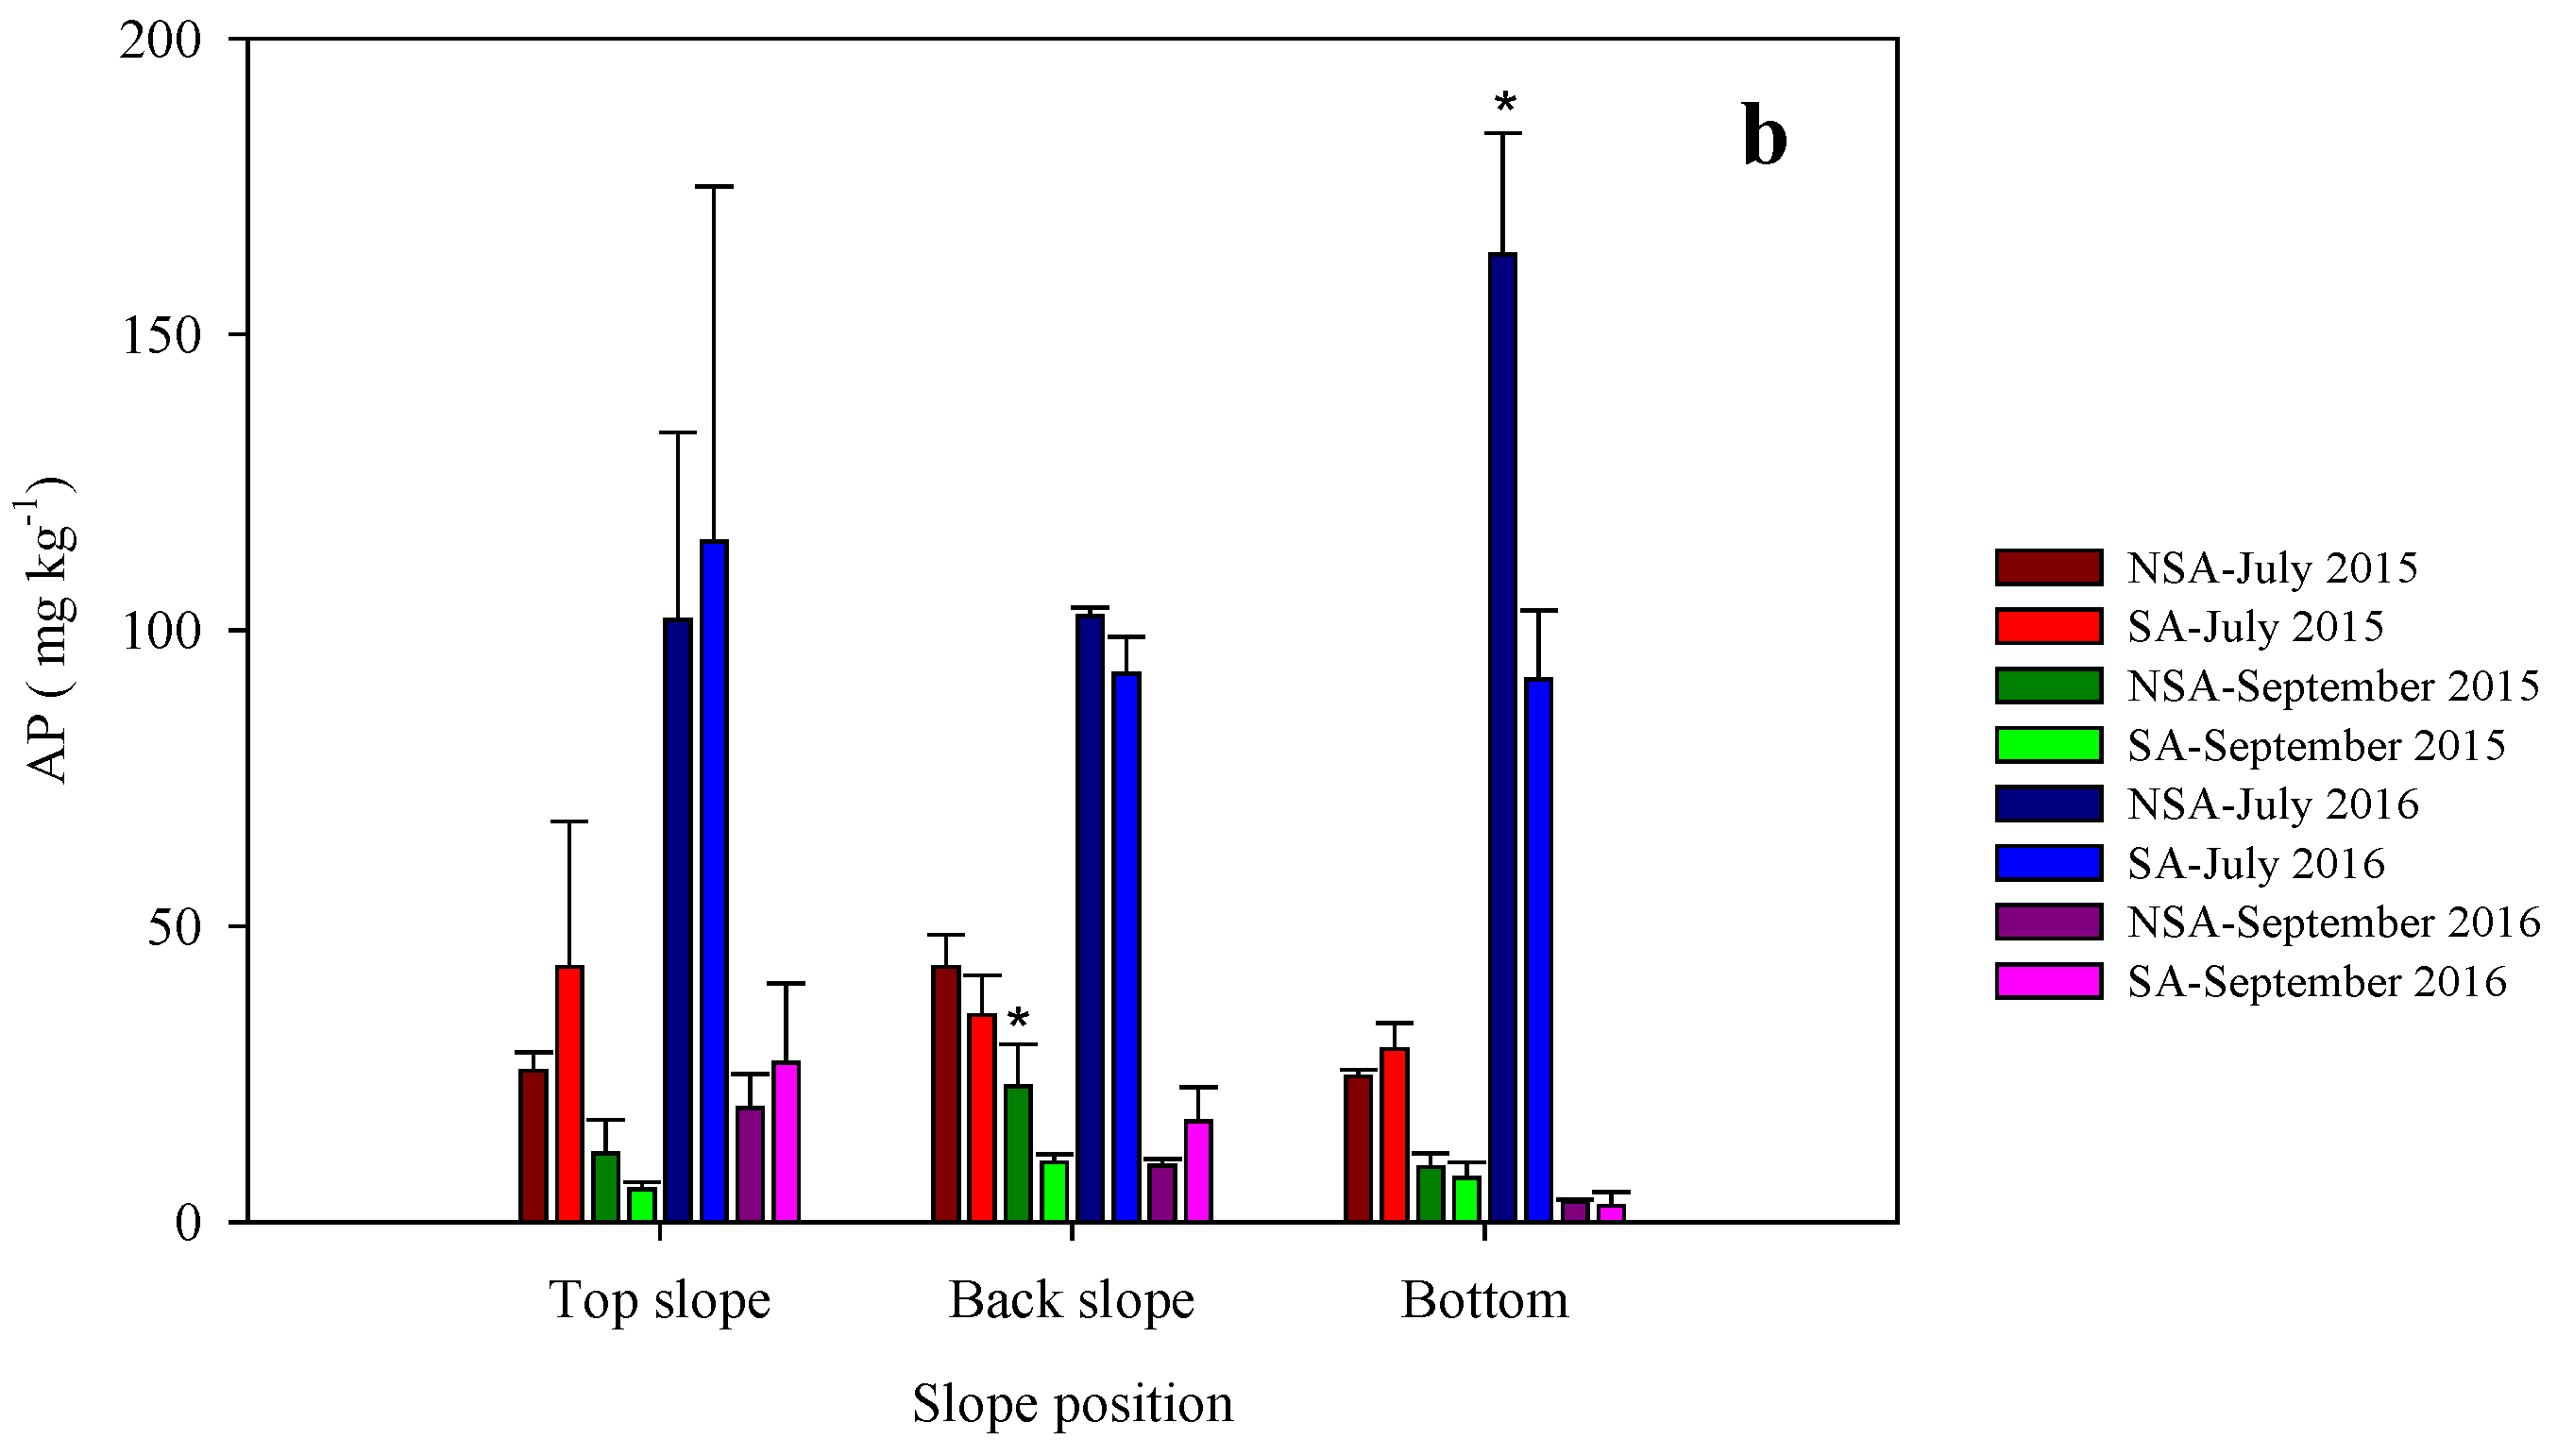
AN and AP were compared between SA and NSA in July (growing stage) and September (mature stage). Except for the back of the slope of 2016, SA typically decreased AN compared with NSA at both the top and bottom of the slope. In 2015, SA decreased AN in all slope positions in July and significantly decreased (13%) AN compared with NSA on the back slope; this effect was not significant in September. In 2016, SA decreased AN at both the top and bottom positions and significantly decreased (16%) AN compared with NSA at the top in September. In 2015, SA only decreased AP on the back slope; the difference was not significant in July. However, SA decreased AP at all slope positions and significantly decreased 56% at the back of the slope in September. In 2016, SA decreased AP at both the back of the slope and at the bottom and significantly decreased (44%) AP at the bottom of the slope in July. However, SA only decreased AP at the bottom; this effect was not significant in September.
3.7. Influence of Straw Amendment on Crop Growth and Yield
At the top of the slope, under SA, crop height and yield were generally higher (1–9.8%) compared to NSA, but this difference was not significant in both 2015 and 2016 (Table 5). At the back of the slope, crop height was lower under SA in July and was higher than or close to the value under NSA in September. Compared with NSA at the back of the slope, crop yield under SA was significantly increased by 55.6% and 105.1% in 2015 and 2016, respectively. At the bottom of the slope, crop height under SA was higher than under NSA from July to September in 2015 and in September 2016, while crop yield under SA was 4.1–30.6% lower than under NSA; this difference was only statistically significant in 2016.
4. Discussion
ST and SM are highly correlated with nutrient cycling processes in soil ecosystems [24,28,29]. The activity of most soil microorganisms increases when ST exceed 10 °C and reaches maximum levels at 25–35 °C. In addition, soil microbial activity increases rapidly at a soil water potential greater than −30 MPa and is highest at −0.01 MPa [30,31,32]. In this study, daily ST was greater than 22 °C, and SM was generally higher than 33% (v/v) from June to August at the bottom of the slope. In early crop growth stages, SM on the top slope and back slope was slightly higher than FC (Field Capacity) due to low temperature, high precipitation, and low transpiration, and increased especially after precipitation in this Mollisol soil with heavy texture. However, SM decreased in late crop growth stages, especially on the top slope and back slope. This was mainly due to both temperature and transpiration being higher during these stages, and most of the water moved from the top to the bottom of the slope. Relatively low levels of SM and ST impacted crop growth and significantly influenced crop growth at the top and the back of the slope.
Yang et al. (2016) reported decreased SM, increased ST, and increased crop yield in an SA treatment, mainly influenced by straw ditches and straw burial depth in a flat area. These results can be compared to the findings of our study, where daily and monthly average ST was effectively increased at the top (relative flat) of the slope under SA, but daily and monthly average SM decreased in 2016. Our findings for 2015 were largely different compared to those for 2016. Therefore, our results suggest that ST and SM are not consistently affected by SA in top slope positions (relative flat). This was mainly due to the fact that the available water capacity and hydraulic conductivity of saturated soil typically increased with straw amendment [33], and straw amendment increased infiltration and the slope facilitated water movement towards the bottom [11,18,19,34]. The different results between 2015 and 2016 may have also been caused by variations in precipitation and the history of residue return (one year vs. two years) between 2015 and 2016, and may also be influenced by straw burial because it was difficult to evenly distribute the straw amendment using a tractor. At the same time, straw amendment changed the soil bulk density and increased the capillary porosity in the deeper soil layers (Figure 5), which could also effectively balance the equilibrium of SM dynamics and influence the dynamics of ST at the top of the slope [12,21]. Thus, in this study, the SA treatment with improved soil structure effectively prevented low SM levels under low precipitation conditions in the early crop growth phase of 2015 and prevented low ST under high precipitation conditions in the early crop growth phase in 2016. Furthermore, SA changed the equilibrium of SM and ST and changed soil nutrient cycling. In the process of SA decomposition, microorganisms compete for soil N. Also, a considerable amount of N can easily be transferred from the top of the slope, while P is strongly adsorbed in soil [35]. Thus, AN was typically decreased, while AP was typically increased in both 2015 and 2016 at the top of the slope (Figure 6a). Therefore, compared with NSA, crop residue return (SA) at the top of the slope can effectively balance the equilibrium of SM dynamics and positively influence ST, thereby promoting crop growth and increasing crop yield.
At the back of the slope, compared with NSA, SA notably increased daily ST. Monthly ST under SA was generally higher than under NSA from May to August 2016 and was similar in May and June 2015. Compared with NSA, higher ST under SA is suitable for crop growth. Daily SM was generally higher under SA than under NSA at the back of the slope, although this trend changed with precipitation, and SM was typically higher under SA than under NSA after precipitation. Our results are similar to the findings of a previous study which found that SA increased the response rate of SM to rainfall in the wet Yangtze River delta agricultural region [21]. Monthly SM was also generally higher under SA than under NSA at the back of the slope, in both 2015 and 2016. This is most likely because SA increases infiltration and reduces evaporation [34], and infiltration and subsurface runoff increase with an increase in straw amendment [18,19]. However, ST usually increases with decreasing SM levels [12,21], which is not in agreement with our results, possibly because straw amendment decreases soil bulk density, increases infiltration and decreases heat capacity [35]. This is mainly because the soil bulk density was higher than 1.2 g cm−3 under NSA, and was higher than the water density (1.0 g cm−3 at 101.325 kPa), while the soil bulk density was close to 1.0 g cm−3 under SA. In our study, monthly SM levels in the SA treatment in 2016 were highest at the back of the slope, followed by the bottom and the top of the slope; this could also be attributed to the effect of long-term crop residue return, especially SA, as soils with relatively low bulk density (Figure 5) and high infiltration capacity can absorb more water from the top of the slope [34]. Thus, crop residue return can also effectively balance the equilibrium of SM dynamics and positively influence ST; in particular, SM is increased. Furthermore, SA changed the equilibrium of SM and ST and changed the soil nutrient cycling. Also, most of the N that moved from the top of the slope was readily deposited at the back of the slope under SA, while P does not move easily in soil [35]. Thus, AP was typically decreased, while AN was typically increased in both 2015 and 2016 on the back of the slope (Figure 6a), thereby increasing crop yield at the back of the slope [9]. However, compared with NSA, crop height under SA was lower in the early crop growth stages. This may be due to the microbial decomposition of crop residues, which exhausted soil nitrogen pools and deprived the crops of nitrogen, although this difference was lower in August.
At the bottom of the slope, SM was generally higher compared to the top due to the “trickling down” effect. Daily ST at the bottom of the slope was lower under SA compared with NSA during the daytime and at night both before and after precipitation. Except in September, monthly ST at the bottom was also generally lower under SA than under NSA from May to August in both 2015 and 2016. However, low ST is not beneficial for soil microbial activities and the release of nutrients for crop growth. Daily SM at the bottom of the slope was lower under SA than under NSA (both before and after precipitation), and monthly SM at the bottom of the slope was generally lower under SA than under NSA, in both 2015 and 2016. This may be due to the fact that over time, soil amendment increases water infiltration and subsurface runoff at the bottom, especially as residue return increases annually [19,34]. Generally, the high SM at the bottom under both SA and NSA was not the factor that limited nutrient cycling and crop growth. However, residue return increases soil organic carbon amounts, decrease C:N ratios, and leads to competition between microbial communities and crops in terms of nitrogen. Furthermore, because SA changed the equilibrium of SM and ST at the bottom of the slope, soil available nutrients were not readily released from soil, which decreased both AP and AN in 2015 and 2016 (Figure 6a). Therefore, straw amendment significantly decreased crop yields at the bottom. Generally, crop residues with lower C:N ratios and relatively high SM levels (95% field capacity) can increase the numbers and the total dry weight of earth worms, thereby improving soil properties and fertility [36]. Furthermore, SA not only increases soil total C and N contents but also increases microbial biomass C and N contents and reduces N fertilizer use, especially when combined with manure [37,38]. However, excessive straw amendment, especially using straw with a high C:N ratio, could exhaust soil nitrogen pools [35]. This was also proved in this present study. Thus, in order to obtain higher crop yields, additional fertilizer, especially nitrogen application at the bottom of the slope is advisable. However, our study was carried out on a northeastern-facing slope, and the results could be different for other slope aspects [12,39], which should be investigated in further studies.
Wang et al. (2014) indicated that straw incorporation increased evapotranspiration from tasseling to the grain-filling stages of maize, while it reduced evapotranspiration from the ten-leaf collar to the tasseling stage and from the grain-filling to the maturity stages of maize. Liu et al. (2017) reported that residue incorporation also increased crop transpiration and increased WUE (crop water use efficiency) due to reduced soil evaporation and surface runoff [11]. However, in our study, SM in the SA treatment was consistently higher at the back of the slope and lower at the bottom of the slope, while not consistently higher at the top. This may also be influenced by crop growth, landscape, and vigorous crop growth, which significantly decreased or increased soil water levels [25]. In this study, straw amendment increased crop yield at the top and the back of the slope with relatively low SM, but decreased crop yield at the bottom. In that regard, our results are similar to the findings of other studies describing the positive effects of residue incorporation on water balance and crop yield, especially in narrow-leaf cropping systems in hot and dry environments [11]. Thus, straw amendment represents an effective method to increase crop yields at the top and the back of slope with relatively low SM, while it slightly negatively affected the yield at the bottom of the slope with higher SM. Previous studies have indicated that straw incorporation into deeper soil layers may improve crop yields, even in the face of global climate change, but potentially slows down cultivation influence, costs more time, labor, and energy [11,40]. In this study, we only investigated the effects of straw incorporation into the 0–30 cm soil layer on a consecutively sloping farmland in the Mollisol region. Further work should therefore focus on the impacts of straw incorporation into the deeper soil layers on SM, ST, crop yields and profit.
5. Conclusions
Soil temperature, soil moisture, soil nutrients and soil bulk density were changed after straw amendment. Straw amendment with the improved soil structure effectively prevented low soil moisture levels under low precipitation conditions and prevented low soil moisture under high precipitation conditions in the early crop growth phase on the top of the slope. Furthermore, SA changed soil nutrient cycling and typically decreased AN but increased AP on the top of the slope. Generally, straw amendment increased both soil temperature and moisture, increased AN, and decreased AP at the back of the slope. However, straw amendment decreased soil temperature and decreased AN and AP at the bottom of the slope.
Straw amendment can effectively change soil structure and balance the equilibrium of soil moisture and temperature in areas with relatively low soil moisture contents on the top and back of the slope in the Mollisol region of Northeast China, thereby not decreasing maize yields at the top of the slope, while increasing maize yields on the back of the slope. However, straw amendment decreased soil moisture and temperature, resulting in reducing soil available nutrients, and typically reduced crop yields at the bottom of the slope. In order to better manage soil temperature, moisture and nutrients, slope positions should be fully considered when straw amendment is adopted in sloped fields.
Author Contributions
The experimental field has been managed by Shaoliang Zhang since 2010, including seeding, ploughing, fertilizing, weeding and harvesting. Shaoliang Zhang, Yao Wang and Qingsong Shen buried FDR and thermistor probes, and collected the data. Shaoliang Zhang analyzed data, and wrote the manuscript. Yao Wang and Qingsong Shen checked the results, facilitated discussions, and reviewed the manuscript.
Acknowledgments
We thank the editors and the two anonymous reviewers for their comments. Part of the paper is sponsored by the project of Science and Technology Research Projects of the Education Department of Heilongjiang Province, China (No. 1254G012).
Conflicts of Interest
The authors declare no conflict of interest.
References
- Recous, S.; Robin, D.; Darwis, D.; Mary, B. Soil inorganic N availability: Effect on maize residue decomposition. Soil Biol. Biochem. 1995, 27, 1529–1538. [Google Scholar] [CrossRef]
- Kim, S.; Dale, B.E. Global potential bioethanol production from wasted crops and crop residues. Biomass Bioenergy 2004, 26, 361–375. [Google Scholar] [CrossRef]
- Blanco-Canqui, H.; Lal, R. Crop Residue Removal Impacts on Soil Productivity and Environmental Quality. Crit. Rev. Plant Sci. 2009, 28, 139–163. [Google Scholar] [CrossRef]
- Ghimire, R.; Machado, S.; Rhinhart, K. Long-Term Crop Residue and Nitrogen Management Effects on Soil Profile Carbon and Nitrogen in Wheat-Fallow Systems. Agron. J. 2015, 107, 2230–2240. [Google Scholar] [CrossRef]
- Kumar, K.; Goh, K.M. Crop residues and management practices: Effects on soil quality, soil nitrogen dynamics, crop yield, and nitrogen recovery. In Advances in Agronomy; Sparks, D.L., Ed.; Elsevier: New York, NY, USA, 2000; Volume 68, pp. 197–319. [Google Scholar]
- Poeplau, C.; Reiter, L.; Berti, A.; Katterer, T. Qualitative and quantitative response of soil organic carbon to 40 years of crop residue incorporation under contrasting nitrogen fertilisation regimes. Soil Res. 2017, 55, 1–9. [Google Scholar] [CrossRef]
- Schmatz, R.; Recous, S.; Aita, C.; Tahir, M.M.; Schu, A.L.; Chaves, B.; Giacomini, S.J. Crop residue quality and soil type influence the priming effect but not the fate of crop residue C. Plant Soil 2017, 414, 229–245. [Google Scholar] [CrossRef]
- Novelli, L.E.; Caviglia, O.P.; Pineiro, G. Increased cropping intensity improves crop residue inputs to the soil and aggregate-associated soil organic carbon stocks. Soil Tillage Res. 2017, 165, 128–136. [Google Scholar] [CrossRef]
- Zhao, Y.G.; Pang, H.C.; Wang, J.; Huo, L.; Li, Y.Y. Effects of straw mulch and buried straw on soil moisture and salinity in relation to sunflower growth and yield. Field Crops Res. 2014, 161, 16–25. [Google Scholar] [CrossRef]
- Saha, R.; Ghosh, P.K. Soil Organic Carbon Stock, Moisture Availability and Crop Yield as Influenced by Residue Management and Tillage Practices in Maize-Mustard Cropping System Under Hill Agro-Ecosystem. Nat. Acad. Sci. Lett. India 2013, 36, 461–468. [Google Scholar] [CrossRef]
- Liu, D.L.; Zeleke, K.T.; Wang, B.; Macadam, I.; Scott, F.; Martin, R.J. Crop residue incorporation can mitigate negative climate change impacts on crop yield and improve water use efficiency in a semiarid environment. Eur. J. Agron. 2017, 85, 51–68. [Google Scholar] [CrossRef]
- Zhang, S.L.; Zhang, X.Y.; Huffman, T.; Liu, X.B.; Yang, J.Y. Soil Loss, Crop Growth, and Economic Margins under Different Management Systems on a Sloping Field in the Black Soil Area of Northeast China. J. Sustain. Agric. 2011, 35, 293–311. [Google Scholar] [CrossRef]
- Chen, S.Y.; Zhang, X.Y.; Pei, D.; Sun, H.Y.; Chen, S.L. Effects of straw mulching on soil temperature, evaporation and yield of winter wheat: Field experiments on the North China Plain. Ann. Appl. Biol. 2007, 150, 261–268. [Google Scholar] [CrossRef]
- Singh, V.; Srivastava, A.; Singh, R.K.; Savita, U.S. Effect of tillage practices and residue management on soil quality and crop yield under maize (Zea mays)-based cropping system in Mollisol. Indian J. Agric. Sci. 2011, 81, 1019–1025. [Google Scholar]
- Azam, F.; Lodhi, A.; Ashraf, M. Availability of soil and fertilizer nitrogen to wetland rice following wheat straw amendment. Biol. Fertil. Soils 1991, 11, 97–100. [Google Scholar] [CrossRef]
- McCalla, T.M.; Duley, F.L. Effect of crop residues on soil temperature. J. Am. Soc. Agron. 1946, 38, 75–89. [Google Scholar] [CrossRef]
- Mooers, C.A.; Washko, J.B.; Young, J.B. Effects of wheat straw, lespedeza sericea hay, and farmyard manure, as soil mulches, on the conservation of moisture and the production of nitrates. Soil Sci. 1948, 66, 307–315. [Google Scholar] [CrossRef]
- Xing, X.G.; Li, Y.B.; Ma, X.Y. Effects on infiltration and evaporation when adding rapeseed-oil residue or wheat straw to a Loam soil. Water 2017, 9, 12. [Google Scholar] [CrossRef]
- Lu, P.R.; Zhang, Z.Y.; Feng, G.X.; Huang, M.Y.; Shi, X.F. Experimental study on the potential use of bundled crop straws as subsurface drainage material in the newly reclaimed coastal land in Eastern China. Water 2018, 10, 15. [Google Scholar] [CrossRef]
- Wang, X.; Jia, Z.; Liang, L. Effect of straw incorporation on soil moisture, evapotranspiration, and rainfall-use efficiency of maize under dryland farming. J. Soil Water Conserv. 2014, 69, 449–455. [Google Scholar] [CrossRef]
- Yang, H.S.; Feng, J.X.; Zhai, S.L.; Dai, Y.J.; Xu, M.M.; Wu, J.S.; Shen, M.X.; Bian, X.M.; Koide, R.T.; Liu, J. Long-term ditch-buried straw return alters soil water potential, temperature, and microbial communities in a rice-wheat rotation system. Soil Tillage Res. 2016, 163, 21–31. [Google Scholar] [CrossRef]
- Smika, D.E.; Ellis, R. Soil temperature and wheat straw mulch effects on wheat plant development and nutrient concentration. Agron. J. 1971, 63, 388–391. [Google Scholar] [CrossRef]
- Abera, G.; Wolde-meskel, E.; Bakken, L.R. Effect of organic residue amendments and soil moisture on N mineralization, maize (Zea mays L.) dry biomass and nutrient concentration. Arch. Agron. Soil Sci. 2013, 59, 1263–1277. [Google Scholar] [CrossRef]
- Andren, O.; Rajkai, K.; Katterer, T. Water and temperature dynamics in a clay soil under winter-wheat—Influence on straw decomposition and n-immobilization. Biol. Fertil. Soils 1993, 15, 1–8. [Google Scholar] [CrossRef]
- Zhang, S.L.; Huang, J.; Wang, Y.; Shen, Q.S.; Mu, L.L.; Liu, Z.H. Spatiotemporal heterogeneity of soil available nitrogen during crop growth stages on mollisol slopes of Northeast China. Land Degrad. Dev. 2017, 28, 856–869. [Google Scholar] [CrossRef]
- Zhang, S.L.; Yan, L.L.; Huang, J.; Mu, L.L.; Huang, Y.Q.; Zhang, X.Y.; Sun, Y.K. Spatial heterogeneity of soil C:N ratio in a mollisol watershed of Northeast China. Land Degrad. Dev. 2016, 27, 295–304. [Google Scholar] [CrossRef]
- Bao, S. Soil Agricultural Chemical Elements Analysis; China Agriculture Press: Beijing, China, 2000; p. 3. [Google Scholar]
- Bussiere, F.; Cellier, P. Modification of the soil-temperature and water-content regimes by a crop residue mulch—Experiment and modeling. Agric. For. Meteorol. 1994, 68, 1–28. [Google Scholar] [CrossRef]
- Tian, Y.Q.; Liu, J.; Zhang, X.Y.; Gao, L.H. Effects of summer catch crop, residue management, soil temperature and water on the succeeding cucumber rhizosphere nitrogen mineralization in intensive production systems. Nutr. Cycl. Agroecosyst. 2010, 88, 429–446. [Google Scholar] [CrossRef]
- Reth, S.; Hentschel, K.; Drosler, M.; Falge, E. DenNit—Experimental analysis and modelling of soil N2O efflux in response on changes of soil water content, soil temperature, soil pH, nutrient availability and the time after rain event. Plant Soil 2005, 272, 349–363. [Google Scholar] [CrossRef]
- Walker, A. Soil Microbiology: A Critical Review; Butterworth & Co.: London, UK, 1975. [Google Scholar]
- Paul, E.A.; Clark, F.E. Soil Microbiology and Biochemistry; Academic Press: San Diego, CA, USA, 1989. [Google Scholar]
- Bhagat, R.M.; Verma, T.S. Impact of rice straw management on soil physical-properties and wheat yield. Soil Sci. 1991, 152, 108–115. [Google Scholar] [CrossRef]
- Qiao, H.L.; Liu, X.J.; Li, W.Q.; Huang, W. Effects of straw deep mulching on soil moisture infiltration and evaporation. Sci. Soil Water Conserv. 2006, 2, 34–39. [Google Scholar]
- Brady, N.C.; Weil, R.R. Nature and Properties of Soils; Macmillan Publishing Company: New York, NY, USA, 2000. [Google Scholar]
- Chen, J.; Gu, W.; Tao, J.; Xu, Y.J.; Wang, Y.; Gu, J.Y.; Du, S.Y. The effects of organic residue quality on growth and reproduction of Aporrectodea trapezoides under different moisture conditions in a salt-affected agricultural soil. Biol. Fertil. Soils 2017, 53, 103–113. [Google Scholar] [CrossRef]
- Zhou, X.Q.; Wu, H.W.; Li, G.D.; Chen, C.R. Short-term contributions of cover crop surface residue return to soil carbon and nitrogen contents in temperate Australia. Environ. Sci. Pollut. Res. 2016, 23, 23175–23183. [Google Scholar] [CrossRef] [PubMed]
- Zhao, B.Z.; Zhang, J.B.; Yu, Y.Y.; Karlen, D.L.; Hao, X.Y. Crop residue management and fertilization effects on soil organic matter and associated biological properties. Environ. Sci. Pollut. Res. 2016, 23, 17581–17591. [Google Scholar] [CrossRef] [PubMed]
- Zhang, S.L.; Zhang, X.Y.; Huffman, T.; Liu, X.B.; Yang, J.Y. Influence of topography and land management on soil nutrients variability in Northeast China. Nutr. Cycl. Agroecosyst. 2011, 89, 427–438. [Google Scholar] [CrossRef]
- Chamen, T. The effect of straw incorporation on diesel fuel use and the emission of pollutants. Agric. Eng. 1994, 49, 89–92. [Google Scholar]
Figure 1.
Location of the research area in China, and experimental plot design. Straw Amendment and No Straw Amendment are represented as SA and NSA, respectively.
Figure 1.
Location of the research area in China, and experimental plot design. Straw Amendment and No Straw Amendment are represented as SA and NSA, respectively.

Figure 2.
Monthly mean precipitation in 2015 and 2016, and monthly mean precipitation and associated variation from January to December in 2003–2013 in Harbin city, Heilongjiang province, China.
Figure 2.
Monthly mean precipitation in 2015 and 2016, and monthly mean precipitation and associated variation from January to December in 2003–2013 in Harbin city, Heilongjiang province, China.

Figure 3.
(a–d) represent the dynamics of soil temperature and soil moisture during the consecutive 96-h period from 27–30 May 2015, 14–17 May 2016, 24–27 June 2015 and 16–19 June 2016, respectively.
Figure 3.
(a–d) represent the dynamics of soil temperature and soil moisture during the consecutive 96-h period from 27–30 May 2015, 14–17 May 2016, 24–27 June 2015 and 16–19 June 2016, respectively.


Figure 4.
(a–d) represent the dynamics of soil temperature and soil moisture during the consecutive 96-h period from 20–23 July 2015, 25–28 July 2016, 13–16 August 2015 and 20–23 August 2016, respectively.
Figure 4.
(a–d) represent the dynamics of soil temperature and soil moisture during the consecutive 96-h period from 20–23 July 2015, 25–28 July 2016, 13–16 August 2015 and 20–23 August 2016, respectively.


Figure 5.
Soil bulk density before planting in spring of 2016. NSA and SA represent no straw amendment and amendment, respectively.
Figure 5.
Soil bulk density before planting in spring of 2016. NSA and SA represent no straw amendment and amendment, respectively.

Figure 6.
Soil available nitrogen (AN) (a) and soil available phosphorus (AP) (b)changed between the treatments in 2015 and 2016. Significantly differences between amendment and no straw amendment was marked with an “*” for the same slope position and year.
Figure 6.
Soil available nitrogen (AN) (a) and soil available phosphorus (AP) (b)changed between the treatments in 2015 and 2016. Significantly differences between amendment and no straw amendment was marked with an “*” for the same slope position and year.


Table 1.
Soil physicochemical properties before planting in the experimental fields.
| Slope Position | Soil Depth (cm) | Organic Matter (g kg−1) | Total Nitrogen (g kg−1) | Total Phosphorus (g kg−1) | Bulk Density (g cm−3) | Total Porosity (%) | Field Capacity (cm3 cm−3) | Wilting Point (cm3 cm−3) | Saturated Water (cm3 cm−3) | pH |
|---|---|---|---|---|---|---|---|---|---|---|
| Top (n = 12) | 0–10 | 36.7 ± 4.2 | 1.6 ± 0.3 | 0.29 ± 0.04 | 0.98 ± 0.11 | 63.02 ± 5.01 | 27.5 ± 0.4 | 8.2 ± 0.9 | 54.2 ± 0.5 | 6.15 ± 0.04 |
| 10–20 | 36.7 ± 4.2 | 1.6 ± 0.3 | 0.29 ± 0.04 | 0.99 ± 0.10 | 62.64 ± 4.90 | 28.5 ± 0.4 | 10.0 ± 1.0 | 50.3 ± 0.4 | 6.38 ± 0.03 | |
| Back slope (n = 12) | 0–10 | 32.3 ± 3.1 | 1.2 ± 0.2 | 0.11 ± 0.03 | 1.21 ± 0.14 | 54.34 ± 6.1 | 30.6 ± 0.3 | 10.8 ± 1.5 | 61.0 ± 0.6 | 6.51 ± 0.03 |
| 10–20 | 32.3 ± 3.1 | 1.2 ± 0.2 | 0.11 ± 0.03 | 1.26 ± 0.11 | 52.45 ± 5.1 | 32.8 ± 0.3 | 13.4 ± 1.5 | 56.8 ± 0.5 | 6.62 ± 0.05 | |
| Bottom (n = 12) | 0–10 | 34.2 ± 3.9 | 1.4 ± 0.3 | 0.32 ± 0.02 | 1.02 ± 0.09 | 61.51 ± 6.1 | 27.5 ± 0.5 | 9.0 ± 0.8 | 52.2 ± 0.6 | 6.06 ± 0.02 |
| 10–20 | 34.2 ± 3.9 | 1.4 ± 0.3 | 0.32 ± 0.02 | 1.05 ± 0.07 | 60.38 ± 4.6 | 27.8 ± 0.4 | 9.5 ± 0.7 | 53.7 ± 0.6 | 6.17 ± 0.04 |
Note: Data represent the mean of all soil samples.
Table 2.
Crop management in 2015 and 2016.
| Locations | Crop | Crop Variety | Seeding Date | Plant Density (Plant ha−1) | Fertilizer (kg ha−1) | Weed Control (L ha−1) |
|---|---|---|---|---|---|---|
| 2016 | Corn | Pengcheng 216 | 8 May | 60,000 | 8 May N:58.5; P2O5:54.0 28 Jule N:150.0 | 4 May Xiongdilian (2,4-D butylate 15%, Metribuzin 5%, Acetochlor 40%) 2 28 July Nicosulfuron 1 |
| 2015 | Corn | Xianyu 335 | 4 May | 60,000 | 4 May N:117.8 P2O5:121.1 | 4 May Acetochlor 2 29 July Atrazine 1.2 |
Table 3.
Monthly soil temperature in the treatments with straw amendments (SA) and without straw amendments (NSA) in 2015 and 2016 (n = 1448).
Table 3.
Monthly soil temperature in the treatments with straw amendments (SA) and without straw amendments (NSA) in 2015 and 2016 (n = 1448).
| Straw Amendments (SA) (°C) | No Straw Amendments (NSA) (°C) | |||||||||||
|---|---|---|---|---|---|---|---|---|---|---|---|---|
| Top | Back Slope | Bottom | Top | Back Slope | Bottom | |||||||
| Mean | CV | Mean | CV | Mean | CV | Mean | CV | Mean | CV | Mean | CV | |
| 2015 | ||||||||||||
| May | 16.64 a 1 | 0.31 | 16.56 ab | 0.30 | 16.56 ab | 0.31 | 16.06 b | 0.37 | 16.51 ab | 0.27 | 16.45 ab | 0.31 |
| Jun. | 22.62 ab | 0.24 | 22.20 cd | 0.22 | 22.58 bc | 0.24 | 23.01 a | 0.29 | 22.02 d | 0.22 | 22.49 dc | 0.25 |
| Jul. | 23.23 a | 0.12 | 22.54 b | 0.10 | 22.84 c | 0.11 | 23.53 d | 0.15 | 22.78 e | 0.10 | 23.24 f | 0.12 |
| Aug. | 22.78 bc | 0.07 | 22.29 e | 0.06 | 22.70 c | 0.07 | 23.09 a | 0.10 | 22.50 d | 0.06 | 22.93 ab | 0.08 |
| 2016 | ||||||||||||
| May | 17.28 b | 0.25 | 17.02 c | 0.23 | 17.67 a | 0.27 | 16.03 d | 0.27 | 15.87 d | 0.28 | 17.74 a | 0.24 |
| Jun. | 21.64 d | 0.15 | 21.92 c | 0.12 | 22.11 b | 0.16 | 20.87 e | 0.15 | 20.49 f | 0.15 | 22.61 a | 0.16 |
| Jul. | 23.74 d | 0.09 | 24.43 c | 0.08 | 25.68 b | 0.12 | 23.14 f | 0.10 | 23.29 e | 0.10 | 26.66 a | 0.13 |
| Aug. | 22.43 d | 0.11 | 22.64 c | 0.11 | 24.36 b | 0.13 | 22.13 e | 0.12 | 21.98 f | 0.11 | 24.86 a | 0.13 |
| Sept. | 17.30 e | 0.12 | 18.00 bc | 0.11 | 18.06 b | 0.16 | 17.91 c | 0.13 | 17.57 d | 0.12 | 19.54 a | 0.14 |
Note: 1 Values followed by the same letter within the same rows (lowercase letter) are not significantly different based on the LSD multiple range test (p ≤ 0.05).
Table 4.
Monthly soil moisture in the SA and NSA treatments in 2015 and 2016 (n = 1448).
| Straw Amendments (SA) (cm3 cm−3) | No Straw Amendments (NSA) (cm3 cm−3) | |||||||||||
|---|---|---|---|---|---|---|---|---|---|---|---|---|
| Top | Back slope | Bottom | Top | Back slope | Bottom | |||||||
| Mean | CV | Mean | CV | Mean | CV | Mean | CV | Mean | CV | Mean | CV | |
| 2015 | ||||||||||||
| May | 30.16 f 1 | 0.10 | 42.02 c | 0.08 | 51.52 b | 0.04 | 34.05 e | 0.09 | 40.85 d | 0.06 | 60.37 a | 0.02 |
| Jun. | 33.23 e | 0.14 | 44.55 c | 0.08 | 52.44 b | 0.07 | 32.77 f | 0.14 | 40.32 d | 0.16 | 60.22 a | 0.04 |
| Jul. | 32.20 e | 0.22 | 35.73 c | 0.16 | 50.87 b | 0.11 | 24.34 f | 0.23 | 32.84 d | 0.21 | 54.53 a | 0.08 |
| Aug. | 34.21 e | 0.20 | 39.83 c | 0.15 | 54.39 b | 0.10 | 24.90 f | 0.25 | 36.72 d | 0.20 | 56.34 a | 0.08 |
| Sept. | 24.76 e | 0.20 | 29.84 c | 0.17 | 43.79 a | 0.15 | 19.88 f | 0.26 | 29.26 d | 0.21 | 40.51 b | 0.12 |
| 2016 | ||||||||||||
| May | 30.69 f | 0.07 | 52.89 b | 0.04 | 47.55 d | 0.05 | 34.66 e | 0.09 | 51.79 c | 0.03 | 56.57 a | 0.03 |
| Jun. | 33.43 f | 0.10 | 55.46 b | 0.05 | 49.49 d | 0.06 | 37.64 e | 0.10 | 52.47 c | 0.03 | 58.85 a | 0.03 |
| Jul. | 25.75 f | 0.19 | 47.31 b | 0.11 | 40.64 d | 0.14 | 28.25 e | 0.22 | 45.42 c | 0.10 | 52.14 a | 0.10 |
| Aug. | 21.77 f | 0.07 | 43.12 b | 0.07 | 33.06 d | 0.10 | 23.75 e | 0.12 | 38.34 c | 0.09 | 46.95 a | 0.06 |
| Sept. | 26.56 f | 0.13 | 45.04 b | 0.07 | 37.24 d | 0.14 | 29.51 e | 0.16 | 42.52 c | 0.08 | 51.96 a | 0.05 |
Note: 1 Values followed by the same letter within the same rows (lowercase letters) are not significantly different based on the LSD multiple range test (p ≤ 0.05).
Table 5.
Mean crop height and yield in the SA and NSA treatments in 2015 and 2016 (n = 3).
| Straw Amendments (SA) | No straw Amendments (NSA, Control) | ||||||
|---|---|---|---|---|---|---|---|
| Height/Yield | Top | Back Slope | Bottom | Top | Back Slope | Bottom | |
| 2015 | Jul. (cm) | 197.8 ± 3.0 a 1 | 157.2 ± 6.2 c | 177.7 ± 0.6 b | 197.7 ± 5.3 a | 166.2 ± 10.6 bc | 170 ± 0.9 b |
| Sept. (cm) | 318.8 ± 3.2 ab | 311.5 ± 6.6 ab | 321.2 ± 3.7 a | 311.2 ± 4.9 ab | 302 ± 4.9 b | 315.8 ± 7.0 ab | |
| Yield (t) | 10.1 ± 1.4 a | 8.4 ± 0.8 a | 9.3 ± 0.7 a | 9.2 ± 0.4 a | 5.4 ± 0.1b | 9.7 ± 1.3 a | |
| 2016 | Jul. (cm) | 125.9 ± 9.0 a | 119.2 ± 1.5 a | 120.1 ± 3.3 a | 130.9 ± 4.0 a | 133.6 ± 10.8 a | 127.1 ± 7.2 a |
| Sept. (cm) | 300.8 ± 5.1 a | 267.2 ± 4.1 b | 280.3 ± 5.6 ab | 286.8 ± 15.3 ab | 269.3 ± 8.0 b | 270.8 ± 1.3 b | |
| Yield (t) | 13.4 ± 1.6 a | 12.1 ± 1.6 ab | 10.0 ± 1.4 b | 13.3 ± 1.3 ab | 5.9 ± 1.0 c | 14.4 ± 0.1 a | |
Note: 1 Values followed by the same letter within the same rows (lowercase letters) are not significantly different based on the LSD multiple range test (p ≤ 0.05).
© 2018 by the authors. Licensee MDPI, Basel, Switzerland. This article is an open access article distributed under the terms and conditions of the Creative Commons Attribution (CC BY) license (http://creativecommons.org/licenses/by/4.0/).
Share and Cite
MDPI and ACS Style
Zhang, S.; Wang, Y.; Shen, Q. Influence of Straw Amendment on Soil Physicochemical Properties and Crop Yield on a Consecutive Mollisol Slope in Northeastern China. Water 2018, 10, 559. https://doi.org/10.3390/w10050559
AMA Style
Zhang S, Wang Y, Shen Q. Influence of Straw Amendment on Soil Physicochemical Properties and Crop Yield on a Consecutive Mollisol Slope in Northeastern China. Water. 2018; 10(5):559. https://doi.org/10.3390/w10050559
Chicago/Turabian StyleZhang, Shaoliang, Yao Wang, and Qingsong Shen. 2018. "Influence of Straw Amendment on Soil Physicochemical Properties and Crop Yield on a Consecutive Mollisol Slope in Northeastern China" Water 10, no. 5: 559. https://doi.org/10.3390/w10050559
Note that from the first issue of 2016, this journal uses article numbers instead of page numbers. See further details here.