Influence of Gravel-Bed Porosity and Grain Orientation on Bulk Flow Resistance


1
Department of Civil and Environmental Engineering, Norwegian University of Science and Technology (NTNU), S.P.Andersens veg 5, 7491 Trondheim, Norway
2
Leichtweiß-Institut für Wasserbau, Technische Universität Braunschweig, 38106 Braunschweig, Germany
3
College of Harbour, Coastal and Offshore Engineering, Hohai University, Xikang road #1, Nanjing 210098, China
*
Author to whom correspondence should be addressed.
Water 2018, 10(5), 561; https://doi.org/10.3390/w10050561
Submission received: 19 March 2018
/
Revised: 12 April 2018
/
Accepted: 20 April 2018
/
Published: 26 April 2018
(This article belongs to the Special Issue Turbulence in River and Maritime Hydraulics)
Abstract
:This paper presents results from experiments that were carried out to study the effect of porosity and grain orientation on flow resistance. Experiments were performed over three rough surfaces; a water-worked gravel-bed, its non-porous facsimile (cast-bed) and the rotated cast-bed (cast tiles rotated through 180°). The first two beds were used to isolate the influence of gravel-bed porosity on the bulk flow resistance and the rotated cast was used to study effect of the grain orientation on the flow resistance. The results showed that the rotated cast-bed exerted the highest flow resistance whereas the porous water-worked gravel-bed was, for comparable hydraulic boundary conditions, characterized by slightly higher flow resistance than its non-porous counterpart. The results from the bulk flow analysis were substantiated by a preliminary analysis of flow velocity data.
1. Introduction
Gravel bed rivers represent an important stream-type in the fluvial environment. Gravel beds are, in general, characterized by a large roughness influencing hydraulic and fluvial processes, which in turn govern the turbulent flow structure, flow resistance, sediment transport, and morphological development. Although these processes have been in the focus of research for a long time, there is still a lack of knowledge with regard to near bed flow structure, flow resistance (e.g., [1,2,3]) and exchange processes between the main stream and groundwater flow (e.g., [4,5]). This is partly associated with the fact that many studies have focused mainly on the determination of roughness coefficients as a function of characteristic grain-sizes thereby neglecting the structure of gravel beds.
Traditional methods quantify flow resistance through Manning’s roughness coefficient n, Chézy’s flow resistance factor C or Darcy-Weisbach’s friction factor f [6]. These are interrelated and can be written as a function of the bulk velocity U, water depth h and energy slope Sf. As an example, the Darcy-Weisbach friction factor f is defined as
where denotes the shear velocity which, for uniform flow conditions, can be determined according to = (ghSf)0.5 with g = gravitational acceleration. Gravel-bed roughness is often described by a characteristic grain size of the bed material (e.g., d50, d84 or d90) and is linked to the friction factor via empirical or semi-empirical relationships (e.g., [6,7,8,9,10]). However, gravel-beds are characterized by a high degree of irregularities (grain shape, orientation, packing pattern, etc.), multiple roughness scales (e.g., small and meso-scale bedforms such as pebble clusters, steps, pools, etc. [11]) and therefore roughness properties may vary independently of grain size [12]. Some studies suggested that the standard deviation of bed-elevations may be used as characteristic vertical roughness scale (e.g., [3,13,14,15]) and further studies focused on the determination of characteristic horizontal roughness scales through the analysis of longitudinal profiles or digital elevation models, respectively, using spectral analysis, correlation functions and structure functions (e.g., [12,13,16,17]). Despite the application of surface structure analyses, there is still no consensus regarding the interpretation of the results or the most appropriate measure of bed roughness [18,19].
Moreover, it has often been tacitly assumed in flow resistance studies that fluvial beds may be considered as non-porous structures despite the fact that natural gravel-beds are typically composed of a coarse surface layer and a porous subsurface layer. This assumption implies that a porous and non-porous bed with an identical surface structure would be characterized by exactly the same flow resistance. However, the flow over porous beds is characterized by mass and momentum exchange across the sediment water interface due to the pressure gradients driving the flow in and out of the bed [20,21,22]. The exchange processes, also known as hyporheic exchange, are assumed to have a distinct effect on the near bed flow field and hence flow resistance. In fact, compared to flow resistance studies, only few studies have focused on the influence of bed porosity on flow resistance (e.g., [23,24,25,26]). These studies have shown that porous beds impose higher flow resistance than similar non-porous beds.
The present paper investigates this topic further by analyzing experimental data which was acquired over a porous gravel-bed armor layer and its impermeable facsimile. In an additional experimental series, the facsimile was rotated through 180° so that the bulk flow analysis could be extended towards the investigation of the effect of grain-orientation on flow resistance. Within this paper, we focus on the effect of bed porosity on bulk flow characteristics such as the friction factor f, while more detailed considerations regarding the near bed turbulent flow pattern will be presented in a follow up study. The manuscript is organized as follows: the next Section presents a brief review on the significance of bed porosity for flow resistance; Section 3 describes the experimental setup and methodology, and the results are presented and discussed in Section 4. Conclusions are drawn in Section 5.
2. Background
The effect of bed porosity on flow patterns has been investigated in several studies based on data acquired in laboratory and numerical experiments over beds composed of different artificial roughness elements. Most of these studies have revealed that the flow resistance over permeable beds is larger than the flow resistance exerted by their impermeable counterparts (e.g., [23,24,25,26,27,28]). Moreover, various studies have indicated a dependency of the friction factor with the relative thickness of the permeable layer and the Reynolds-number Re = Uh/, where is the kinematic viscosity of the fluid (e.g., [24,26,29]). The increase of flow resistance with Re has been associated with shear penetration into the porous bed [26,27,28] and the associated exchange of momentum between the surface flow and the flow in the porous medium which increases the Reynolds shear-stress in the near bed region and hence the flow resistance [25,27,29]. In this context, Breugem et al. [25] found that flow resistance increases with bed permeability or , where K is the permeability, and Manes et al. [27] showed that the characteristic length scale of the turbulent flow over a permeable wall can be defined by the depth of shear penetration. This penetration depth is related to the zero-plane position which may be determined from the velocity profiles above the bed [27].
Comparing flow patterns over a single layer of gravel grains and multiple grain layers, Manes et al. [28] highlighted the dependency flow resistance considerations from the definition of bulk parameters. Assuming that the effective hydrodynamic roughness is related to the thickness of the interface, i.e., the region where the surface and sub-surface flow interacts, and not to the size of the grains composing the bed, the friction factors of the non-porous bed were determined using the fixed channel bottom as datum for bulk flow parameters such as flow depth and velocity. On the other hand, for the quantification of the friction factors over the porous beds, Manes et al. [28] used the roughness crest as datum to account for the unknown spatial extent of the interface which depends on flow characteristics. This means that the flow in the interfacial sublayer (the region between the roughness crests and troughs) was intentionally neglected in the bulk analysis presented in the study of Manes et al. [28]. Defining the roughness crest as datum for the determination of water depth will result in larger values for the bulk velocities and smaller water depths compared to the case where the roughness trough is defined as datum. Thus, the use of different datums will be associated with different estimates of the friction factor. Moreover, the subsurface flow-rate is typically difficult to measure in experimental studies and is often not considered separately, i.e., it is often assumed that the discharge used in the experiments represents the surface flow rate, although a small portion of the flow is conveyed through the subsurface layer. For lower discharges, this may hamper the analysis of flow resistance data from bulk analyses.
Most of the aforementioned studies have focused on the analysis of data obtained over beds composed of rather regular roughness elements of similar size, and studies with real gravel-beds remain rare. However, such investigations are needed to account for the non-uniform porosity variation from the crest of the gravel-bed layer to the undisturbed subsurface layer (see [30,31]). The recent study of Cooper et al. [32] used a casting technique to reproduce a non-porous section of 0.4 m length and width of a water-worked gravel surface that was created in a 8.2 m long and 0.6 m wide flume. The flow patterns over the permeable and non-permeable test section were compared based on velocity measurements obtained with Particle Image Velocimetry (PIV). Focusing on the near-bed region, Cooper et al. [32] concluded that the flow resistance imposed by the non-porous surface was higher than that by the porous water-worked gravel-bed, which is contrary to the previous findings. Cooper et al. [32] explained their findings from the analysis of the flow velocity data acquired at the roughness crest. They observed higher double-averaged velocities (velocities averaged in the time and space domain) over the gravel-bed than over the reproduced section and hypothesized that the higher efficiency in the momentum transfer and lower kinetic energy over the porous gravel-bed is a strong indicator that less energy was extracted from the mean flow.
To summarize, all studies related to the effect of bed-porosity revealed that flow resistance is altered by the porosity. More specifically, most studies found that a porous bed offers higher flow resistance than a comparable impermeable bed. This has been associated with the shear penetration and momentum exchange over the porous medium caused by large-scale vortical structures. On the other hand, the study carried out by Cooper et al. [32] over a gravel-bed concluded that flow resistance over a non-porous water-worked gravel-bed is larger than over its permeable counterpart. Some possible explanations for these contradicting results are discussed in Section 4 of this paper, as the experimental methodology of our study is similar to the one used by Cooper et al. [32]. It is worth mentioning that experiments presented in the following section were already ongoing when the study of Cooper et al. [32] was published. Thus, the results of the experiments can be used to shed more light on the influence of bed gravel-bed porosity on flow resistance.
3. Experimental Setup and Procedure
3.1. Experimental Facility
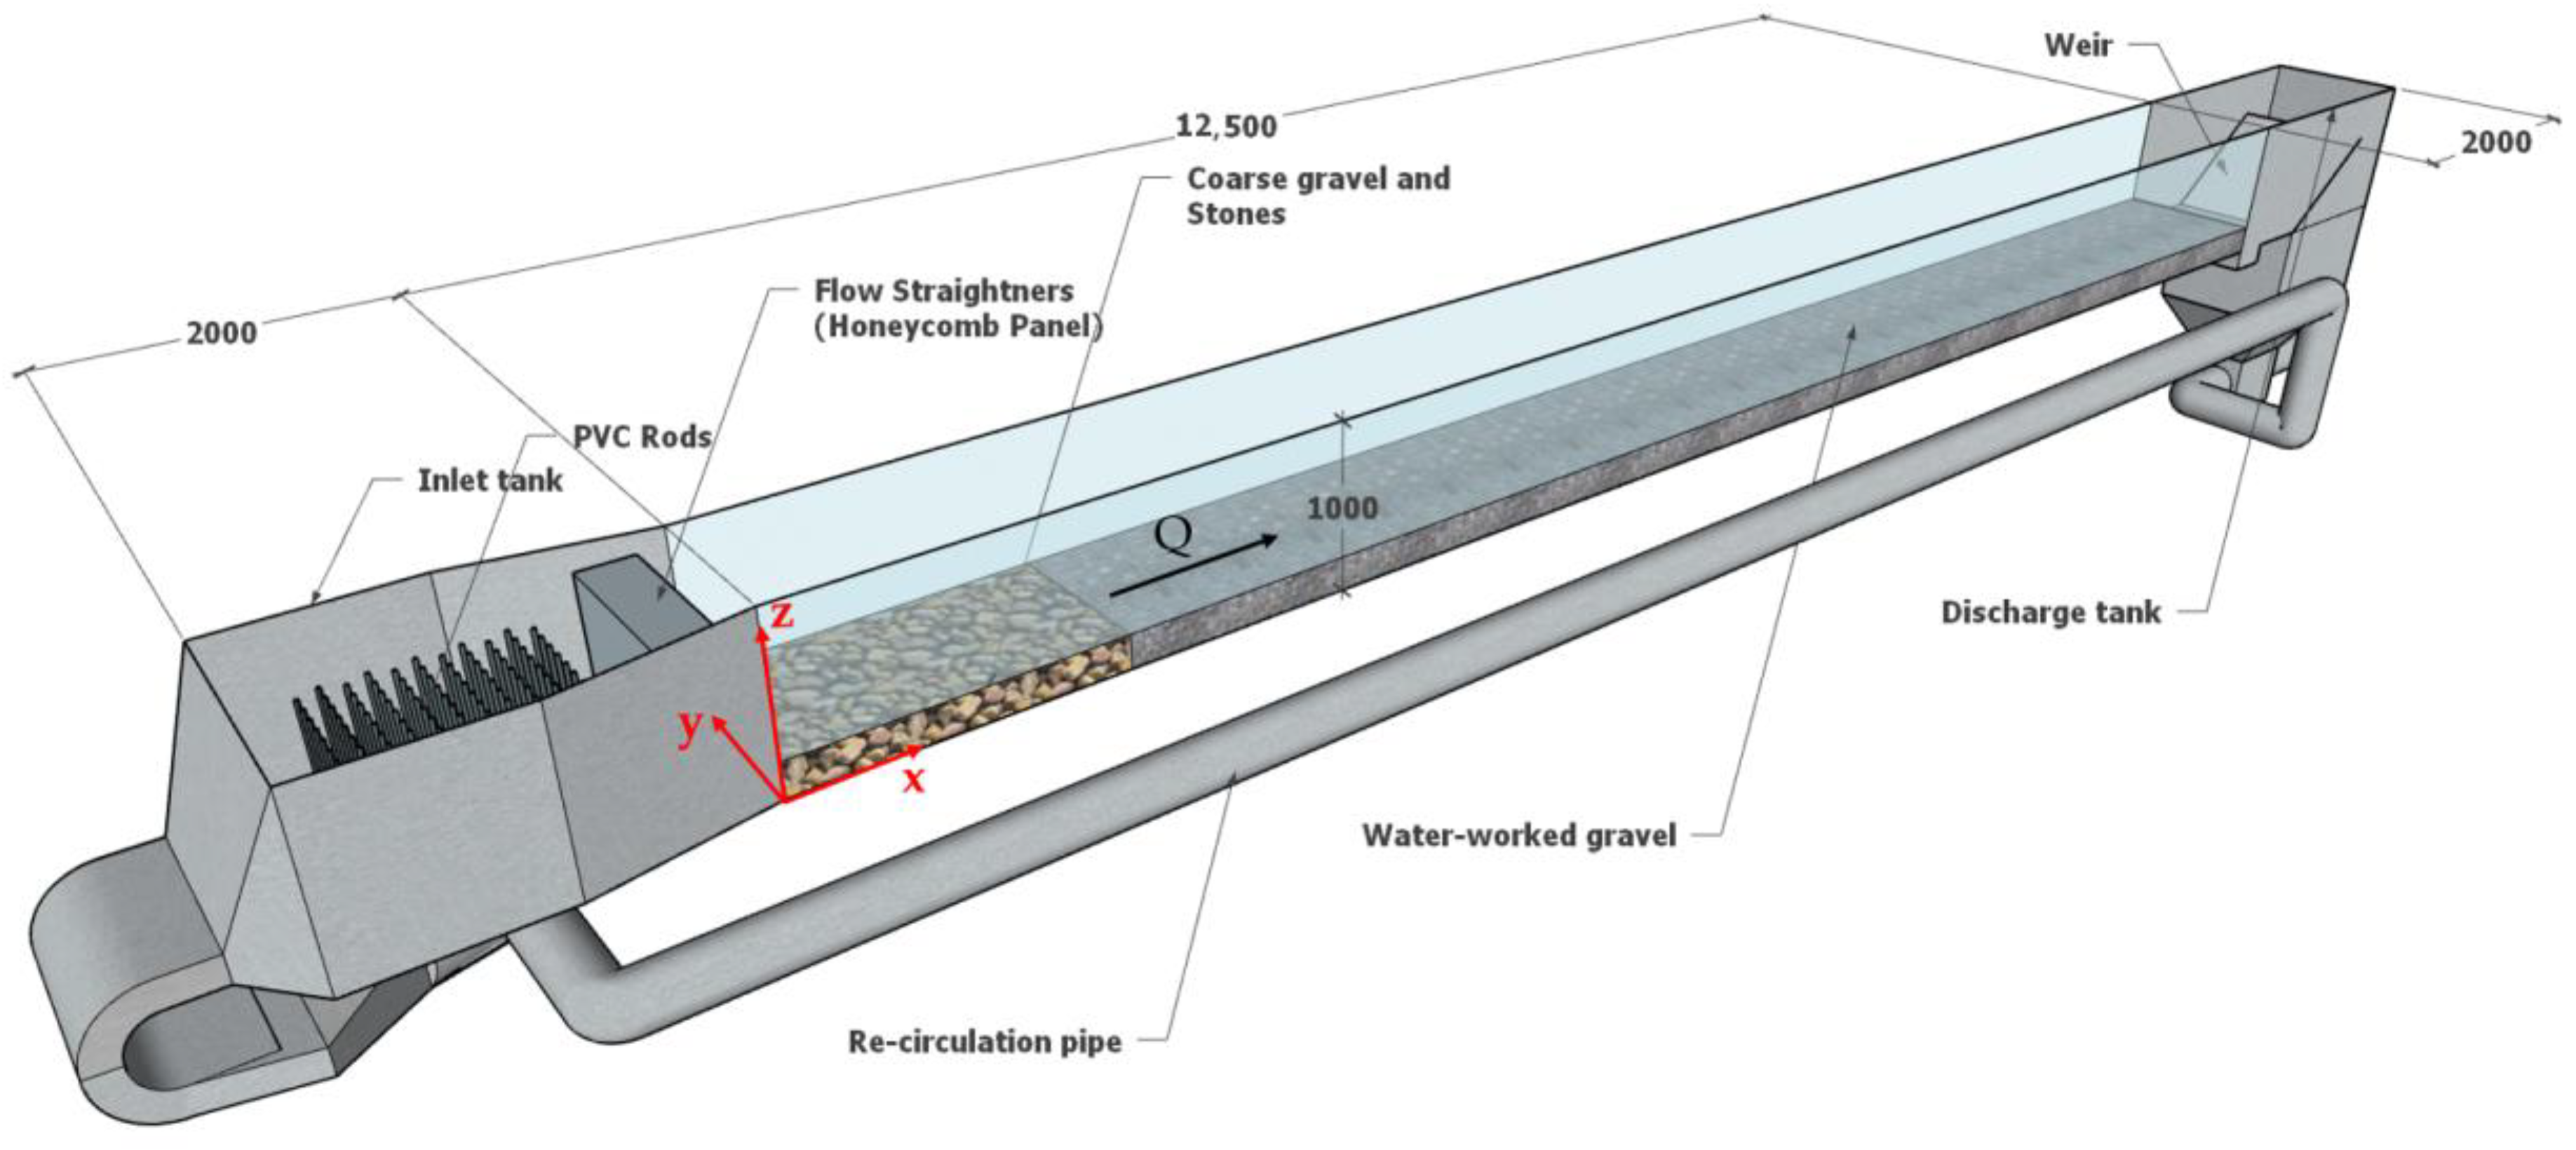
Experiments were conducted in a 12.5 m long 1 m wide and 1 m deep closed-circuit tilting flume in the hydraulics laboratory at the Norwegian University of Science and Technology (NTNU), Trondheim, Norway. The flume, schematically shown in Figure 1, has a 12.5 m long glass-sided working section and a 2 m long inlet section consisting of a head tank and flow-conditioning section. In the experiments, the flow was recirculated by two centrifugal pumps and the flow rate was regulated by electronic motor speed controllers and the valves at each pump. The flow rate was measured by Euromag MUT1000 EL inductive discharge meters (IDM) with an accuracy of 0.1%, installed at the pipes leading from the pumps to the inlet tank. The maximum flow rate of each pump was 0.225 m3/s resulting in a maximum discharge capacity of 0.45 m3/s. Polyvinyl chloride (PVC) rods with a diameter of 20 mm were installed in the inlet tank to condition the flow, and the inlet tank was separated from the flume channel by a honeycomb panel which served as flow straightener. The water depth could be adjusted by both a weir installed at the downstream end of the flume and by adding or draining water from the flume using drain valves. Dependent on the experiment, water levels in the flume were determined from pressure measurements using 4 pressure taps located at the flume bottom or from water surface elevation measurements using 8 Microsonic ultrasonic sensors (accuracy of 1%). The distance between the static pressure taps was 1.25 m with the first tap being located 6.875 m from the beginning of the working section. The ultrasonic sensors were installed in the same flume reach where the static pressure tubes were located. The spacing between the acoustic sensors varied from 0.4 m to 0.7 m to avoid acoustic interferences of the signals emitted from adjacent sensors.
3.2. Bed Types
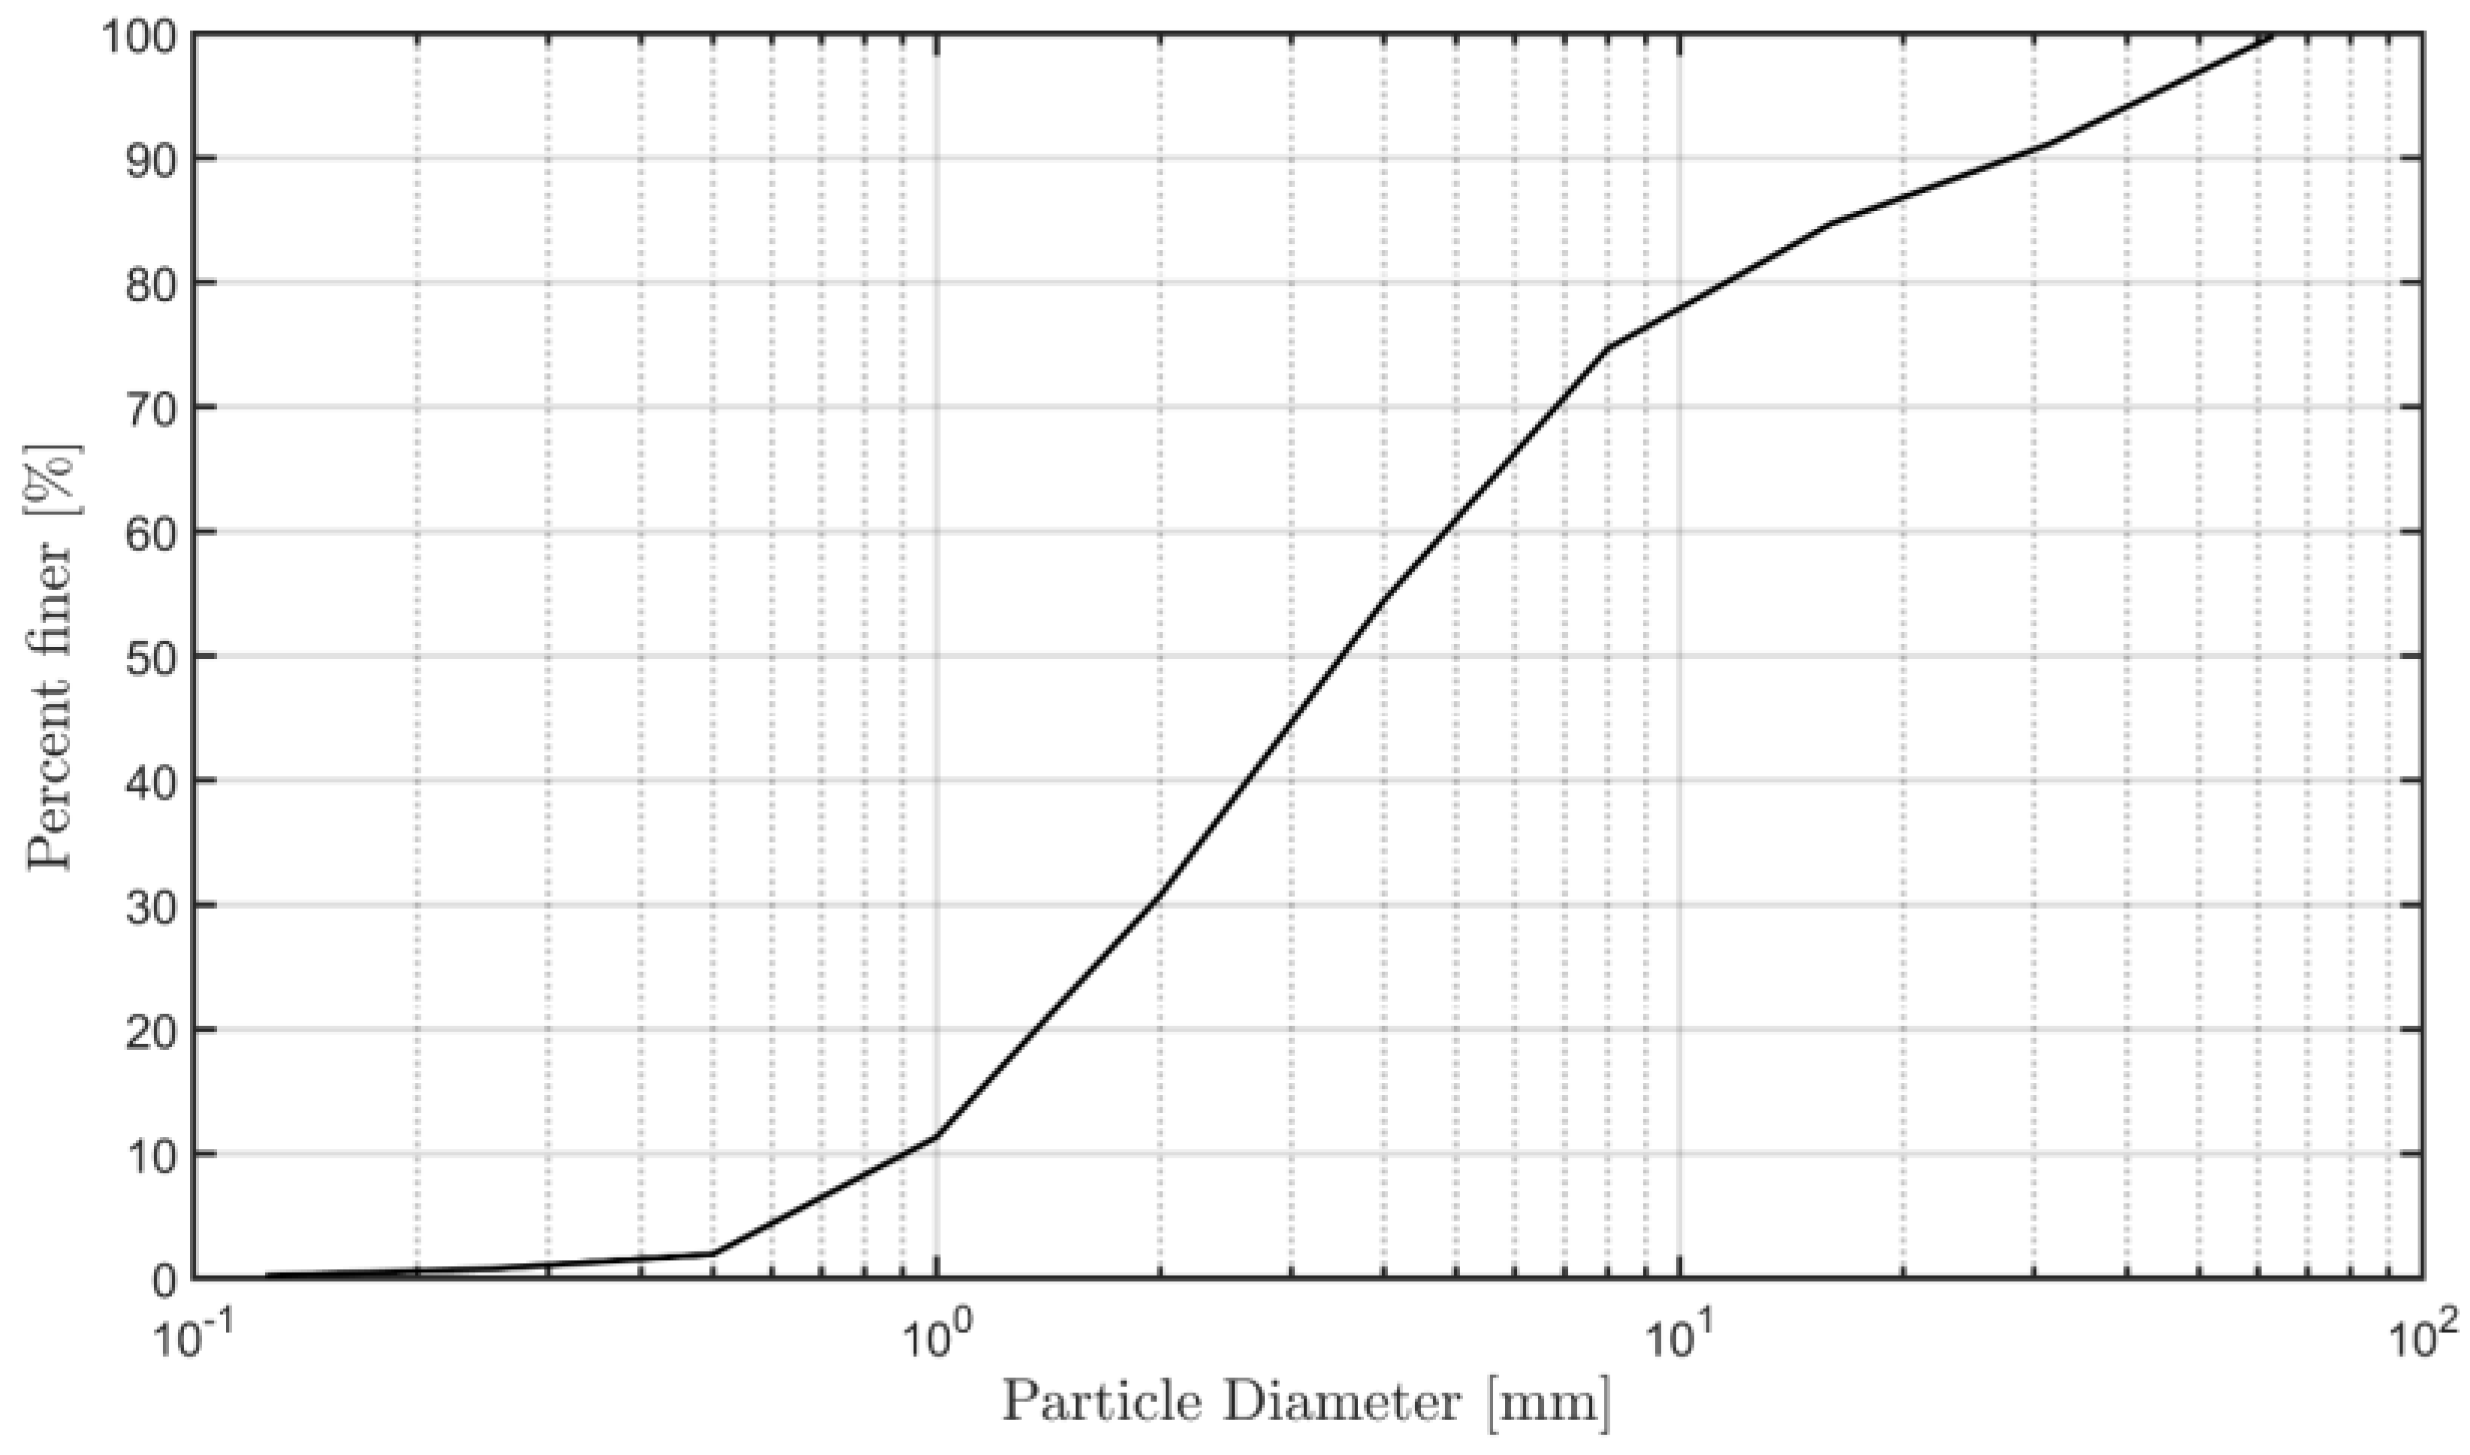
The first series of measurements was carried out over a water worked gravel-bed armor layer with a porous subsurface. For the generation of the armor layer, a 0.20 m high and 10.31 m long gravel layer consisting of a well-mixed sediment mixture (0.64 mm < d < 64 mm; see Figure 2 for the grain-size distribution) was placed in the flume. The sediment mixture was similar to the one used in the study by Aberle and Nikora [16]. The bed was screeded flat and surface compacted to ensure that the bed slope was parallel to the flume slope. The gravel layer was retained by a L-shape perforated sill at its upstream and downstream end to allow for subsurface flow during the experiments. The 2.19 m long flume section between the gravel-bed and the upstream flow straightener was formed by coarse gravel to prevent scouring (Figure 1).
The gravel layer was water-worked with quasi-uniform flow conditions for a discharge of Q = 0.2 m3/s, a bed and water surface slope of Sb = Sw = 0.0027, respectively, and a water depth of h = 0.24 m. The eroded sediment was collected in a basket placed downstream of the gravel layer and the surface was considered to be armored when the sediment transport rate became less than 2.0 kg/h/m, i.e., the same criterion was used as in Aberle et al. [33]. After the armoring, the bed topography was scanned over a total length of 7 m using an Acuity AR200-100 laser displacement meter attached to a traversing system spanning the flume length. The diameter of the footprint of the laser beam ranged between 55 and 250 µm dependent on the distance of the laser to the bed surface, and the accuracy of the bed elevation measurements was 30.5 µm. The coordinate system had its origin x, y, z = (0, 0, 0) at the beginning of working section, the span wise direction y = 0 was at the right glass wall of the flume and the vertical coordinate z = 0 at the plastic channel bottom (see Figure 1). In total, 660 longitudinal profiles were recorded at a span wise step distance of ∆y = 1 mm. The scanned section did not include the topography near the glass walls (approx. 170 mm on either side) due to the setup of the traversing system. Each longitudinal profile was recorded with a sampling frequency of 100 Hz and a traverse speed of 2000 mm/min resulting in a longitudinal resolution of ∆x = 0.33 mm. Spikes in the scanned data were removed manually during the post processing and the final data were used to produce digital elevation models (DEM) of the gravel and the cast surfaces, respectively. The scans will be analyzed in Section 4.1.
Porosity measurements were carried out before and after armoring using the water displacement method (WDM) to obtain the vertical distribution of the porosity of both the initial and water-worked gravel-bed (see [31] for details). In addition to the WDM, the porosity distributions were also derived from the laser scans. The corresponding results will be presented in Section 4.1.
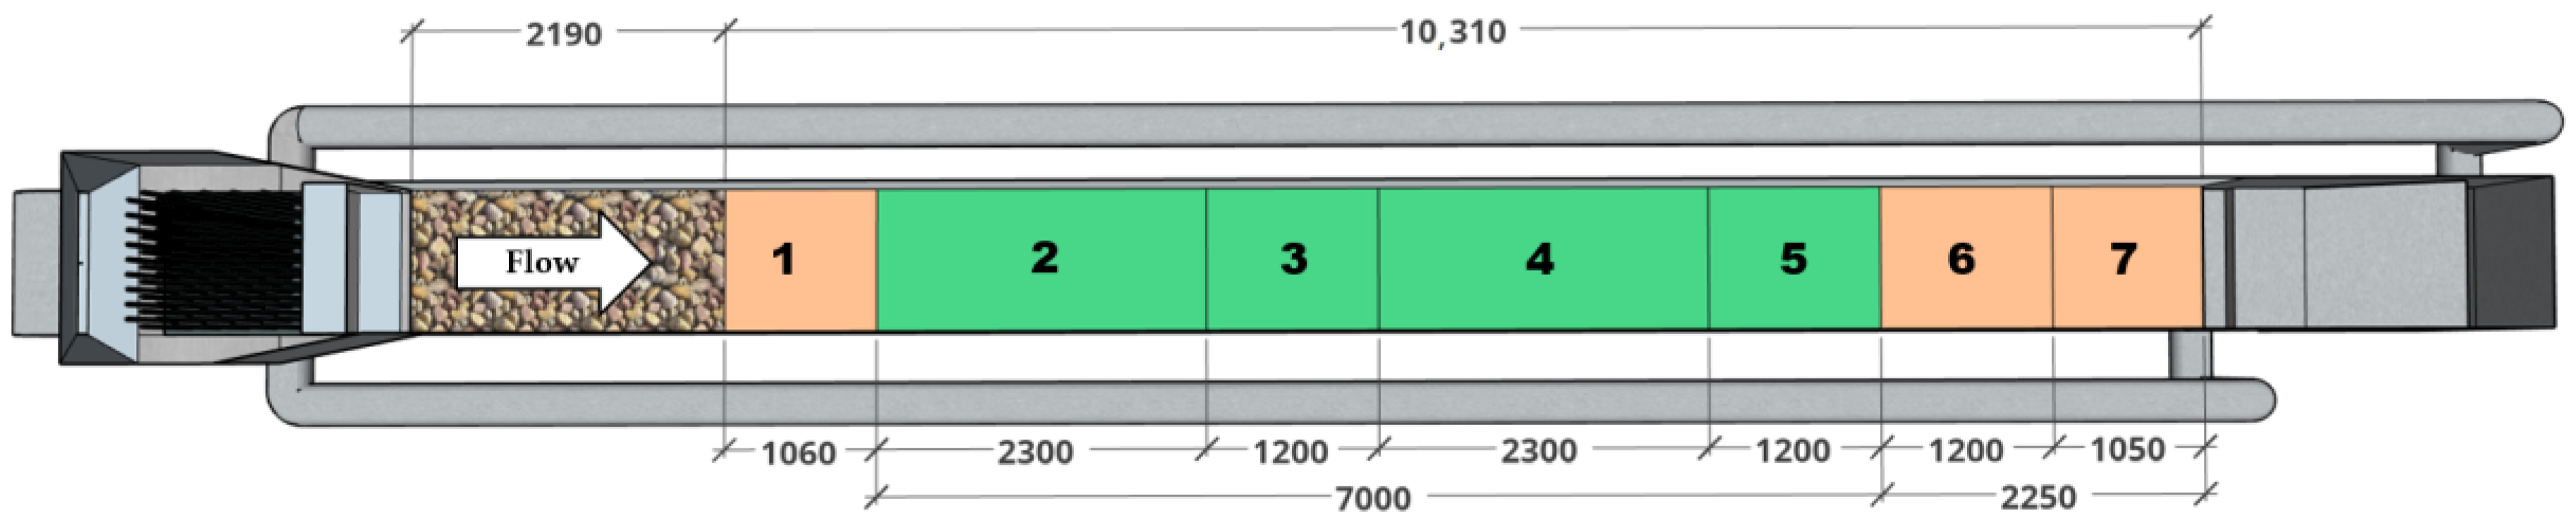
In order to study the effect of the bed subsurface porosity on the flow, a 7 m long section of the armored gravel-bed was reproduced using the casting technique reported in Spiller and Rüther [34], Navaratnam et al. [35] after completion of the hydraulic measurements over the gravel-bed (the latter are described below in Section 3.3). For the preparation of the molds, a thin steel plate was vertically inserted 1 cm into the gravel layer at both ends of the 7 m long section (at x = 3250 mm and 10,250 mm, respectively; see Figure 3) and a bi-component silicon mixture was poured layer-by-layer onto the section. The initial layer was very thin so that the silicon did not alter the grain orientation and did not penetrate the sub-surface. This facilitated the removal of gravel grains from the silicon-mold. It was also ensured that the silicon seeped enough into the interstices in the roughness layer, i.e., into the pore space between the roughness crest and trough. All silicon layers were poured before the initial layer solidified completely to guarantee bonding between the layers. The last silicon layer submerged the highest grain elevation by 2 cm enabling the proper handling of the mold. The final silicon-body was screeded horizontally and allowed to cure for one day. After solidification of the silicon, the two steel plates were removed, and the silicon mat was cut in half and removed from the flume with the help of a crane. The two resulting silicon mats were manually cleaned from sediment particles.
For the preparation of the cast surface, the two silicon mats were further subdivided into two mats of 2.3 m and 1.2 m length, respectively, resulting in a total of 4 molds which originated from Sections 2–5 in Figure 3. Each mold was placed inside a wooden frame and levelled horizontally to avoid the introduction of artificial slopes in the cast. The cast consisted of polyurethane resin mixed with a filling powder (ATH-Aluminum trihydrate) in a volume ratio of 1:2.5 (resin:filler). The filler powder reduced the heat emission from the exothermal reaction during curing so that the shrinkage of the cast was limited to 1%. The edges of the cast pieces were polished to remove irregularities due to leakage and small irregularities in the wooden frame.
The final cast pieces were placed in the flume so that tiles 2–5 were accurately reproducing the original gravel surface. Copies of the 1.2 m long tiles (tiles 1, 6 and 7 in Figure 3; marked in orange) were cut to the required length and placed at the upstream and downstream end of the bed so that all parts of the bed were completely immobile. Small gaps between the tiles and between the tiles and the glass wall, respectively, were filled with silicon and clay to make it water tight. Both, the upstream and downstream end were sealed to avoid flow development under the cast. After its installation, the cast-bed was scanned using the laser displacement meter.
The third bed configuration was installed following the completion of the hydraulic measurements over the cast-bed to investigate the effect of grain orientation on hydraulic roughness. For this purpose, the cast pieces (except pieces 1, 6 and 7) were rotated through 180 degrees and, after sealing the gaps, the bed was scanned again.
3.3. Hydraulic Measurements
Hydraulic measurements were carried out over each of the three surfaces for a total of seven different hydraulic boundary conditions. Three different shear velocities were achieved and the range of relative submergence h/k in the gravel-bed tests varied between 3.6 and 9.3 (see Table 1). The roughness height k was derived from the laser scan data and corresponded to the difference Z99–Z01, where, Z99 and Z01 denote the 99th and 1st percentile of the distribution of bed elevations, respectively; the datum for the water depth h was at the mean bed elevation.
For the gravel-bed tests, the water surface slope was determined using the data from the four pressure taps at the flume bottom. For the cast-bed, the solid bottom prevented the measurements from pressure taps and the water surface slopes were determined using the data from the 8 ultrasonic sensors. Additional tests in which multiple measurements were taken for a particular water surface slope indicated that the results from both measurement systems gave the same mean slope with the same order of magnitude of the deviation from the mean. Although uniform flow conditions were targeted, it was difficult to match the water surface slope exactly with the bed slope due to the mild slopes and the discrete nature of the water surface slope measurements. Both slopes were similar, but still showed some differences so that the St. Venant equation was used to determine the friction velocity [36]:
where h denotes the water depth and Fr the Froude number which is defined as Fr = U/(gh)0.5. Equation (2) represents a simplified version of the St. Venant equation which is obtained by assuming that the slopes are very small. In the tests over the impermeable facsimiles (cast), the discharge was adjusted to ensure the same water surface slope and water depth as in the testes over the permeable bed.
Velocity measurements were taken using the TSI stereoscopic particle image velocity system (SPIV; 2-dimensional 3-component velocimetry). The PIV measurements were carried out at x ≈ 8000 mm and y ≈ 500 mm, i.e., in the centerline of tile number 4 (see Figure 3). The laser sheet was formed by a Nd:YAG (neodymium-doped yttrium aluminum garnet) double-pulsed laser and was aligned normal to the bed surfaces and parallel to the flume walls. The flow was seeded with polyamide particles of 55 µm diameter. Two high speed 4 Mega Pixel CCD (Charge-coupled device) cameras captured the particle images at a frequency of 20 Hz for a period of 150 s, producing 3000 image pairs per camera i.e., 12,000 images in total. The images were post-processed and analyzed using the TSI Insight 4G software. An interrogation area of 32 × 32 pixels with 50% overlapping was set to increase the probability that the seeding particles close to the edges of the interrogation area correlated well. The resulting grid size of the vector field was 16 × 16 pixels which corresponded to a spatial resolution of 1.56 mm × 1.56 mm in streamwise and vertical direction respectively.
4. Results and Discussions
4.1. Comparability of the Surfaces
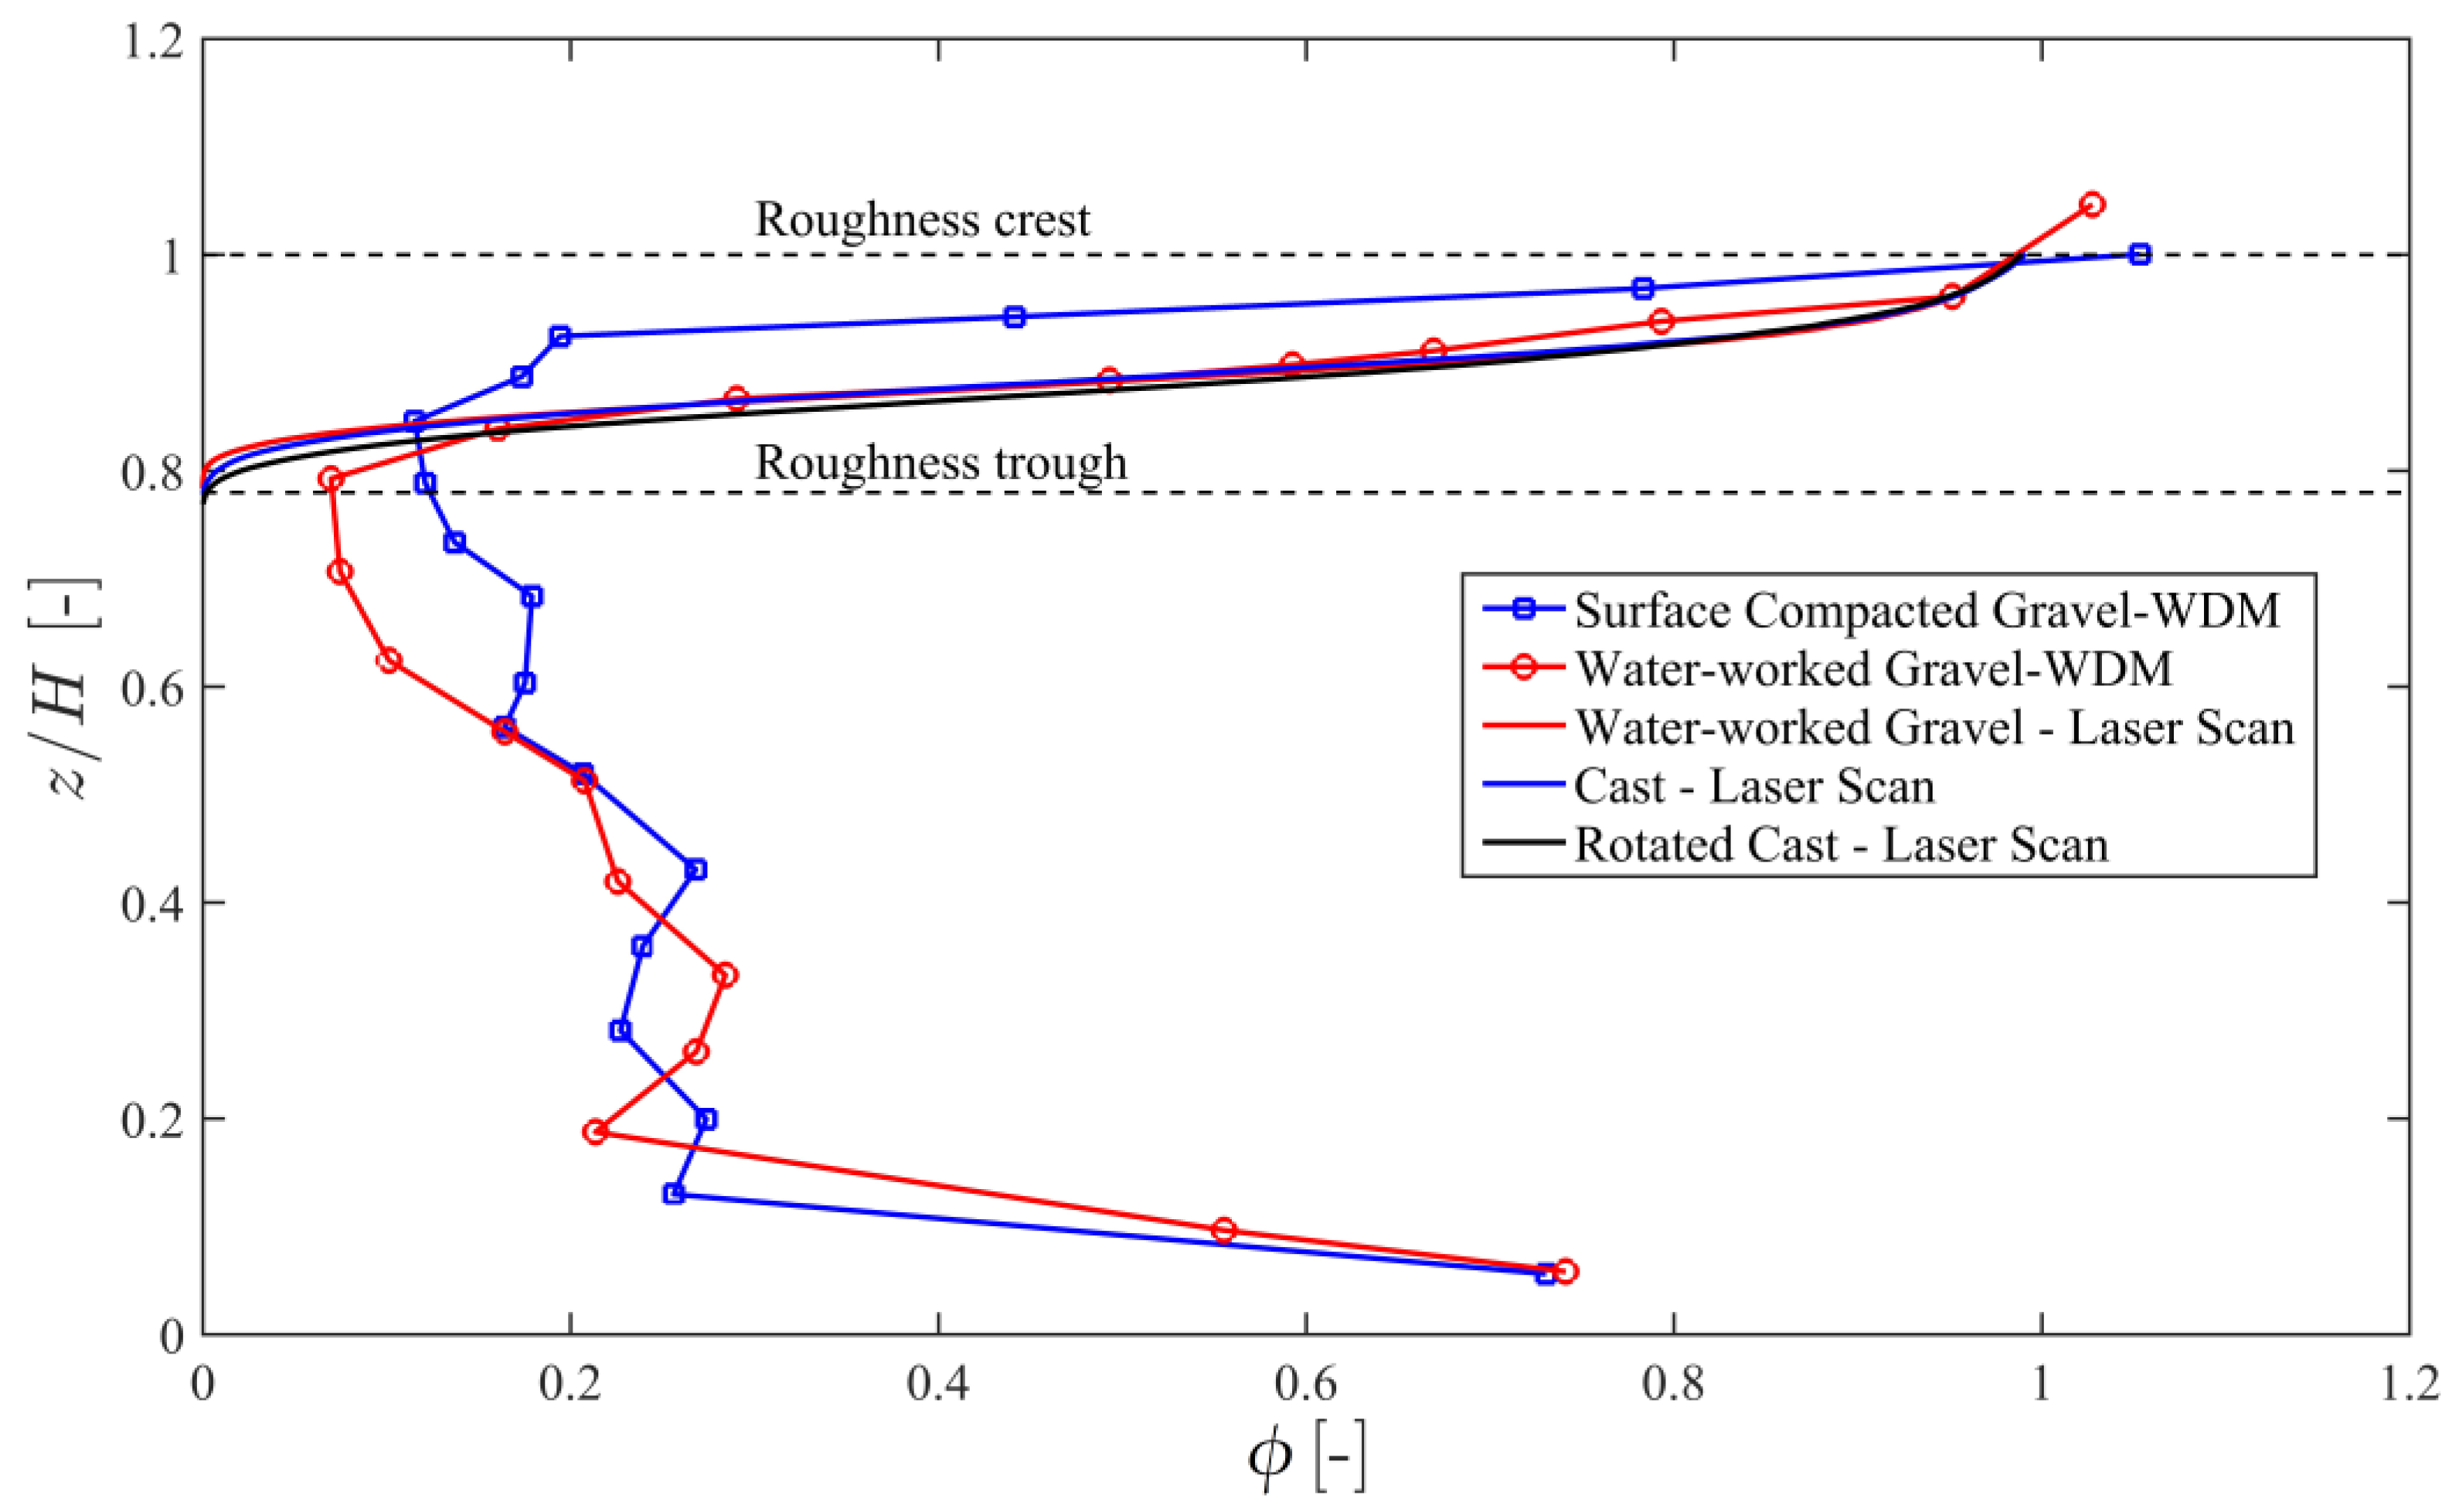
The vertical distributions of the porosity for initial gravel (surface-compacted), water-worked gravel, cast and the rotated cast are presented in Figure 4. For the water-worked gravel-bed, the porosity obtained from the WDM measurements decreased from φ = 1 at the roughness top to an absolute minimum just above the roughness trough before reaching an approximately constant value in the sub-surface. The increase in porosity close to the plastic bottom of the flume was associated with the combined effect of capillary action and poor sorting of gravel at the bottom [31]. The bulk porosity of the water-worked gravel-bed was φ = 0.31 whereas the bulk porosity of the surface compacted gravel was φ = 0.26; this difference was due to the larger height of the interfacial sublayer of the water-worked bed compared to the surface compacted bed. Note that the porosity values φ > 1 for the WDM measurements in Figure 4 are associated with the large spatial scale of the measurements (spanning the whole gravel-bed) and the accuracy of the measurements (see also [30]). The porosity distribution of the water-worked gravel-bed obtained by the WDM measurement matched the porosity distribution derived from the laser scans gravel-bed from the roughness crest (z/H = 1) to z/H ≈ 0.85, where H denotes the height of the bed measured from the flume bottom. Below z/H ≈ 0.85, the results from the two methods deviate since the laser scan could not capture the pore space in the subsurface layer, i.e., the measurement range of the laser scan was restricted to the distance from the roughness crest to the roughness trough so that φ = 0 at the roughness trough for these measurements.
For the cast-beds, the porosity varied from φ = 1 at the roughness top to φ = 0 at the roughness trough. These distributions were solely obtained from the analysis of the laser scan data as the non-porous structure of the bed prevented the use of the WDM. The comparison of the porosity distributions derived from the laser scan measurements nearly collapse on a single line which is a first indicator of the accurate reproduction of the bed surface. However, a difference can be observed for the rotated cast just above the roughness trough and φ < 0.2. This is associated with the placement of the tile and is described below in some more detail.
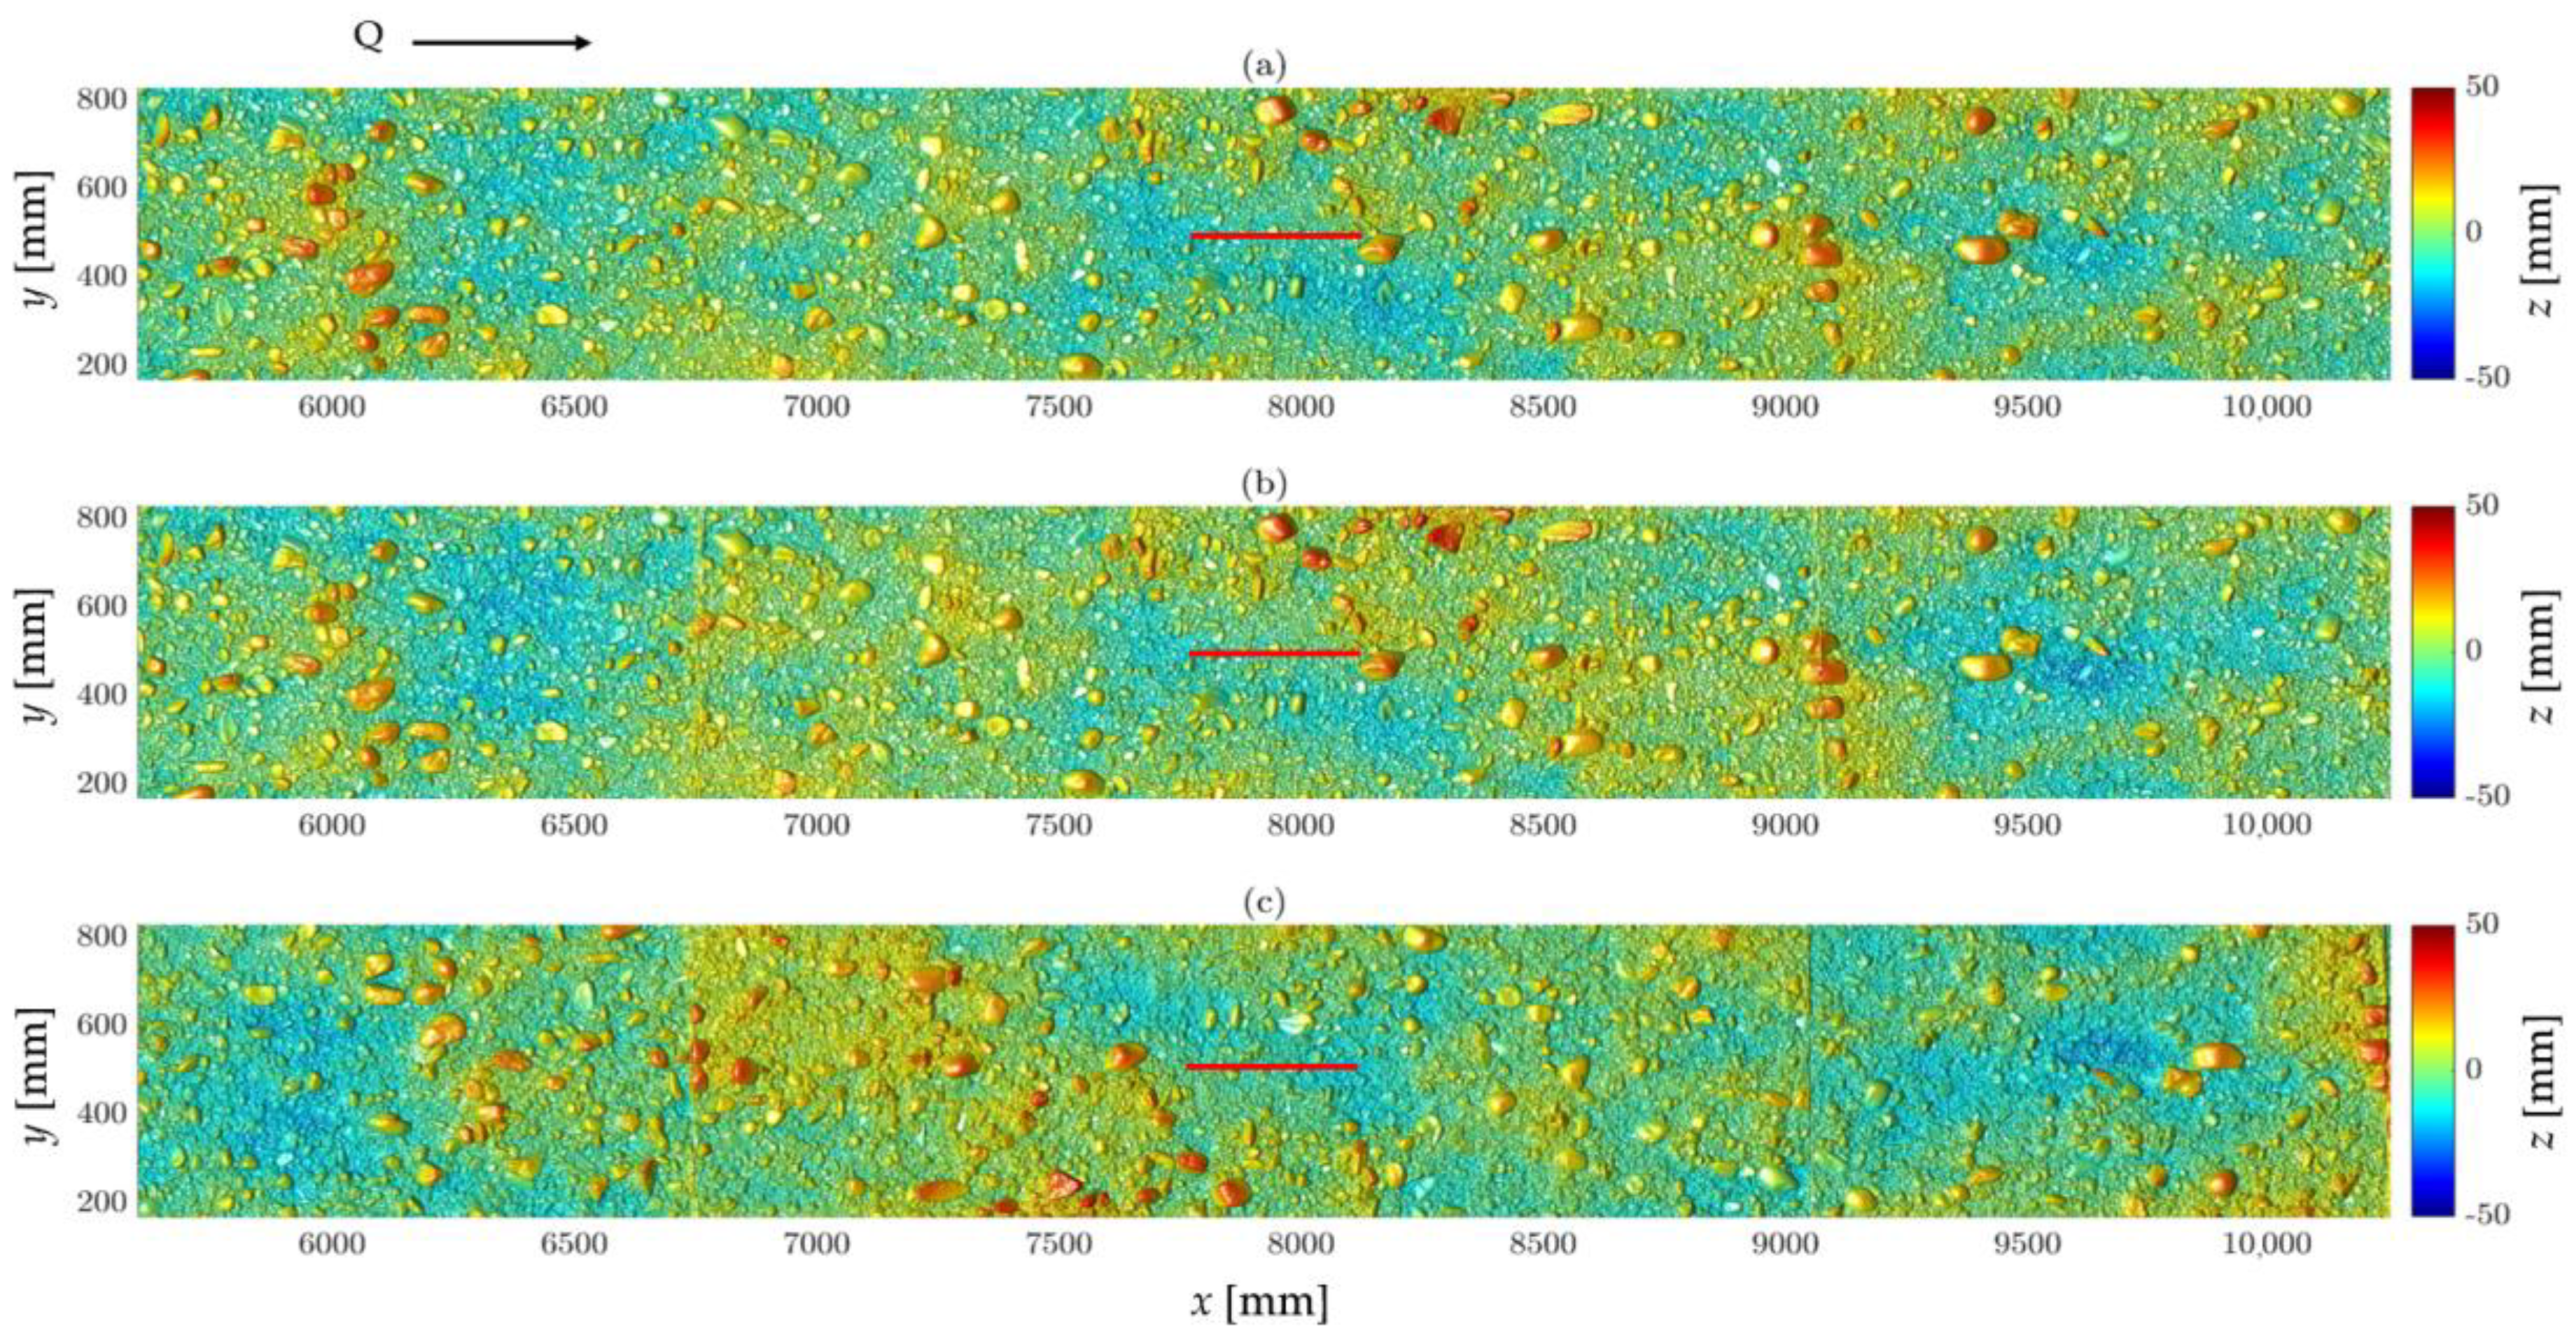
The digital elevation models of the surfaces obtained from the laser scan, shown in Figure 5, were used to compare the geometrical properties of the three bed configurations and to ensure accurate placement of the cast pieces. The following analysis focuses on the 4.65 m long section over which the water surface slope was measured (tiles 3 to 5 in Figure 3) and which contained the PIV-measurement area. For the analysis, the DEMs were detrended and the origin of the vertical coordinate corresponds to the mean bed level.
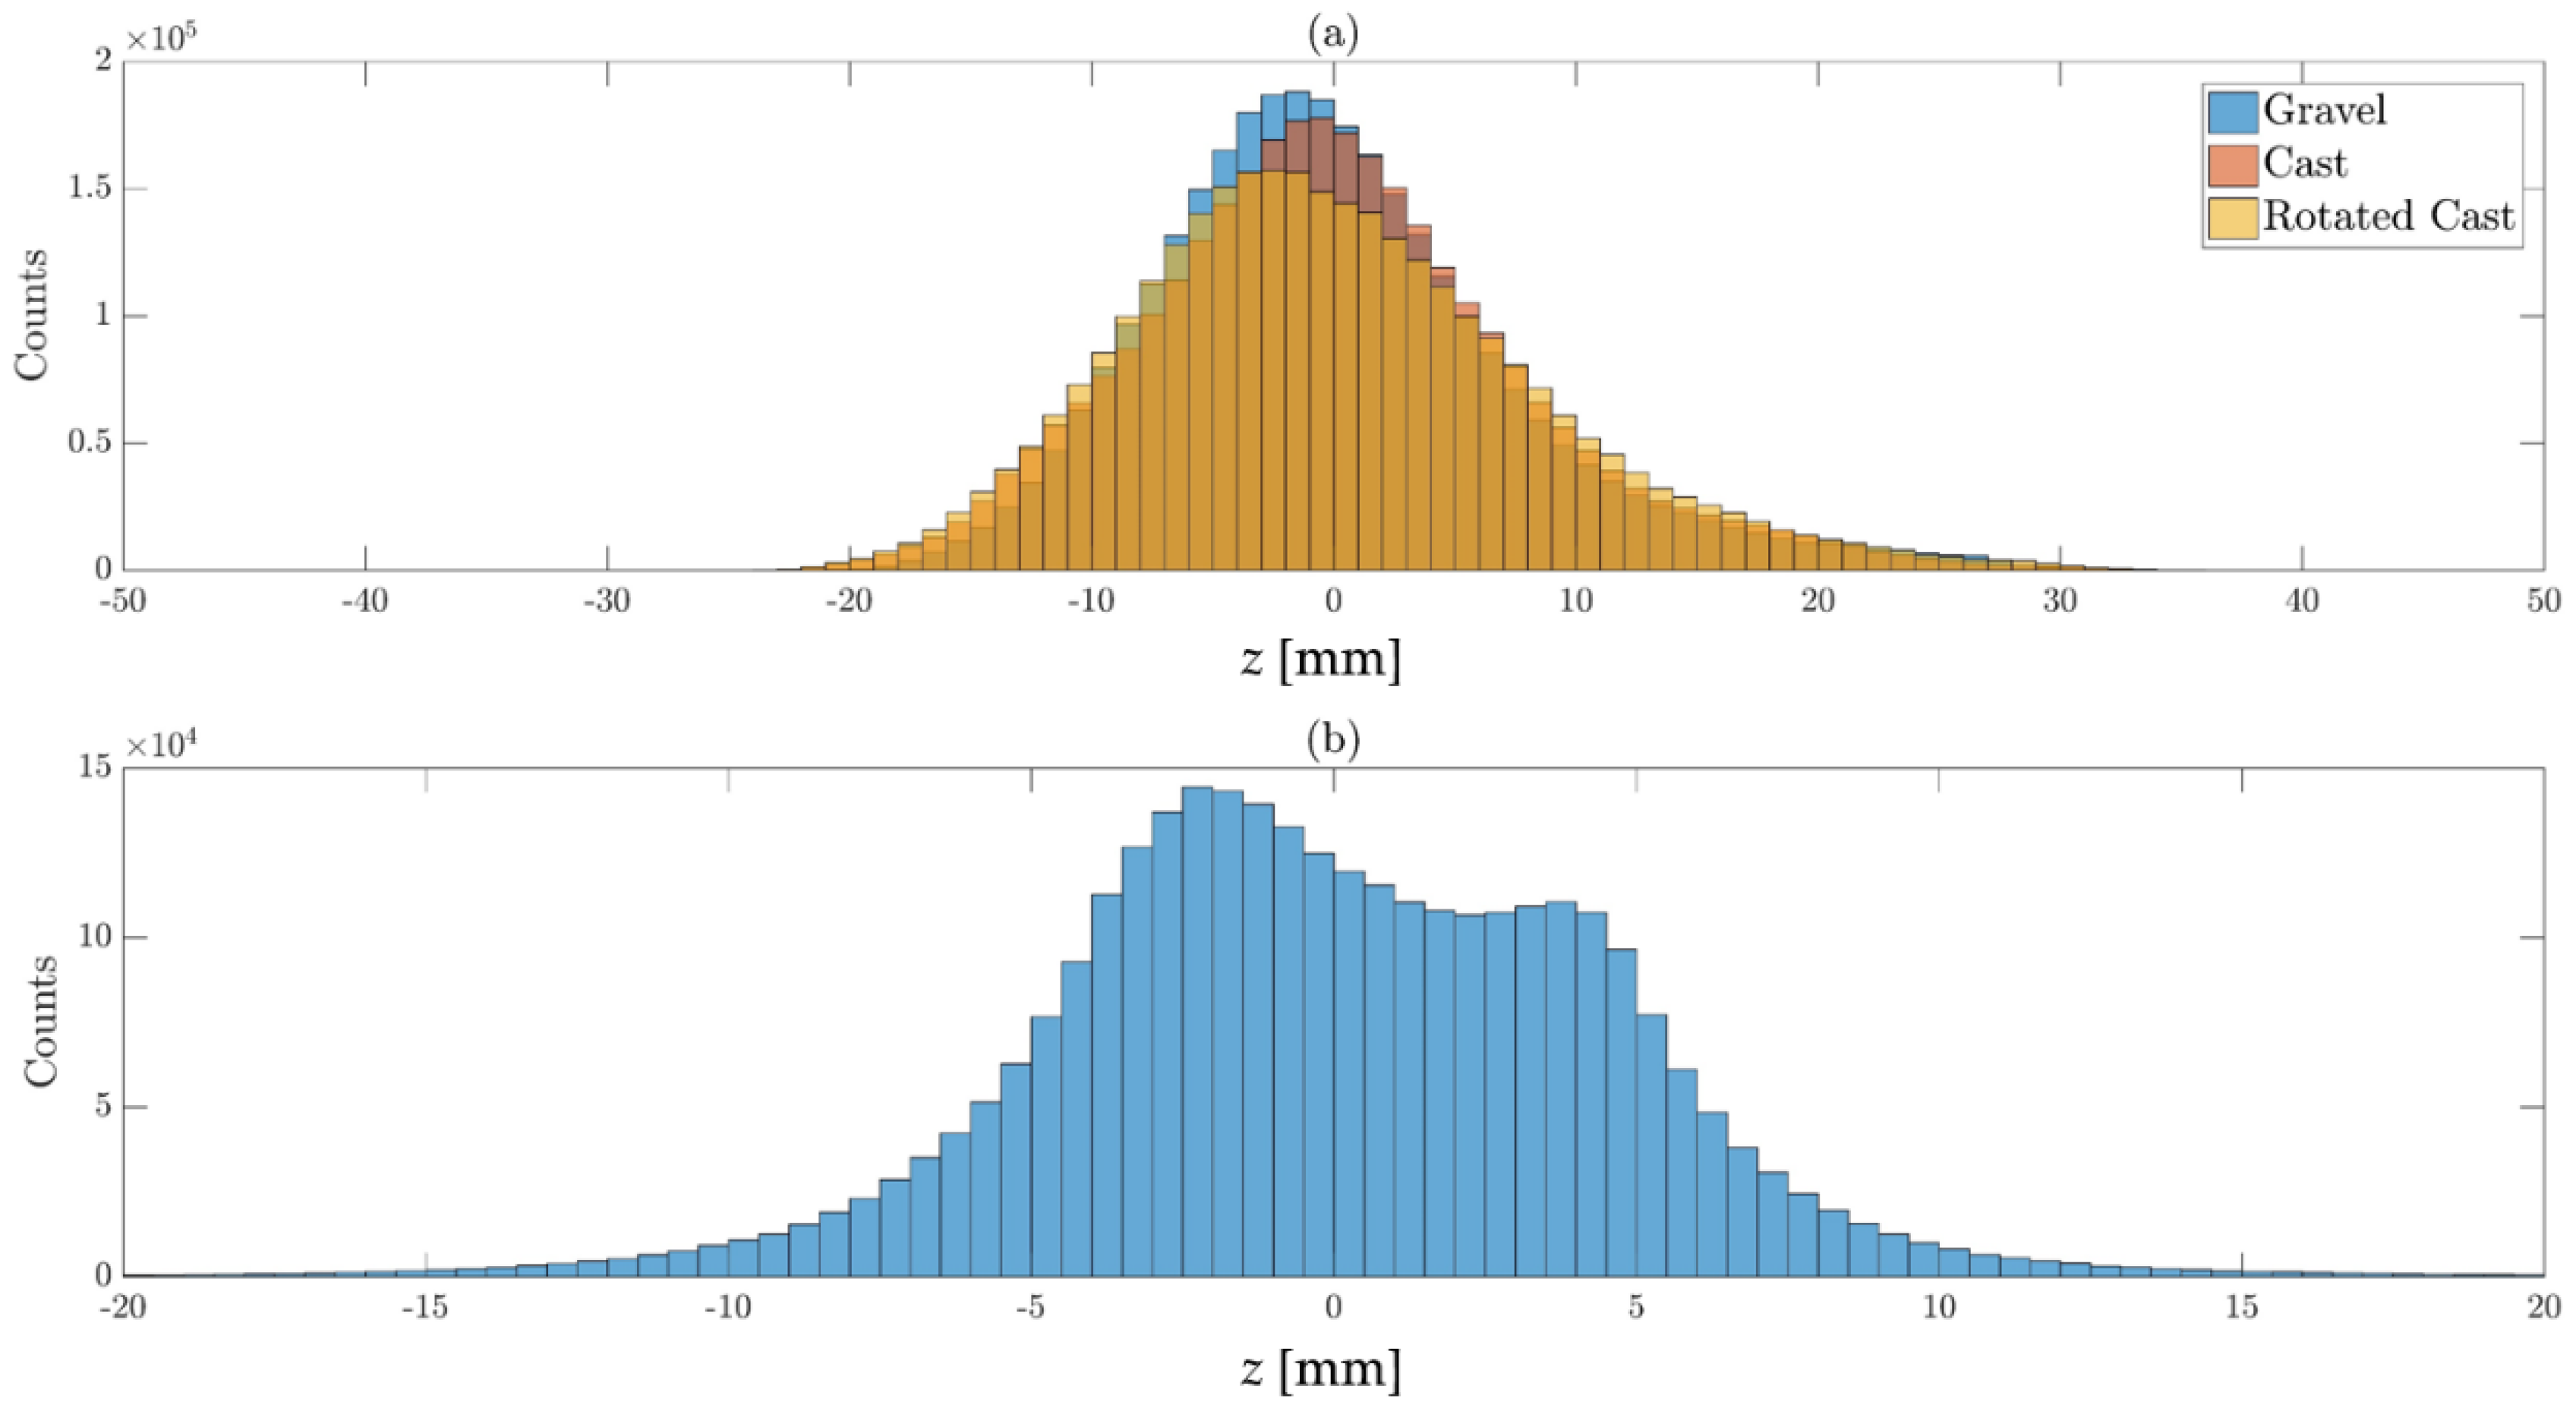
The visual comparison of the permeable gravel-bed (Figure 5a) with its impermeable counterpart (cast; Figure 5b) indicates a good agreement between the two surfaces. The only visible difference is at the transitions between the tiles in Figure 5b at x = 6750 mm and 9050 mm. The match of the cast-bed with the water worked gravel-bed can be analyzed by comparing the distributions of the bed elevations (Figure 6a) as well as the histogram of the observed differences in vertical elevations at each DEM grid point between the gravel and cast-bed (Figure 6b). The histograms shown in Figure 6a reveal a good agreement between the gravel and cast-bed, and the histogram of bed elevation differences (Figure 6b) indicates that most of the values characterizing the deviation of the two surfaces are within the range of ±5 mm. It is worth noting that the histogram in Figure 6b includes, besides the effects of shrinkage and the joints between the tiles, the tile-alignment as it was based on the subtraction of the two DEMs. The good match of the gravel-bed with the cast-bed can further be substantiated by the statistical moments of the surfaces which are presented in Table 2. The standard deviation of bed elevations σ, skewness and kurtosis are directly comparable and fall into the typical range for armored gravel-bed surfaces as defined by Coleman et al. [3].
The distribution of bed elevations for the rotated cast differs slightly from the distribution of the cast. Strictly speaking, both surfaces should be characterized by identical histograms, however, the observed differences in Figure 6a can be associated with very small transverse slopes induced when replacing the cast sections and due to discontinuities between the tiles. The latter were more pronounced for the rotated cast than for the cast and led to an increased number of measurement errors with the laser displacement meter due to its measurement principle. Despite these differences, Table 2 indicates still a good agreement of the statistical moments of the rotated bed with the ones for the original and cast-bed.
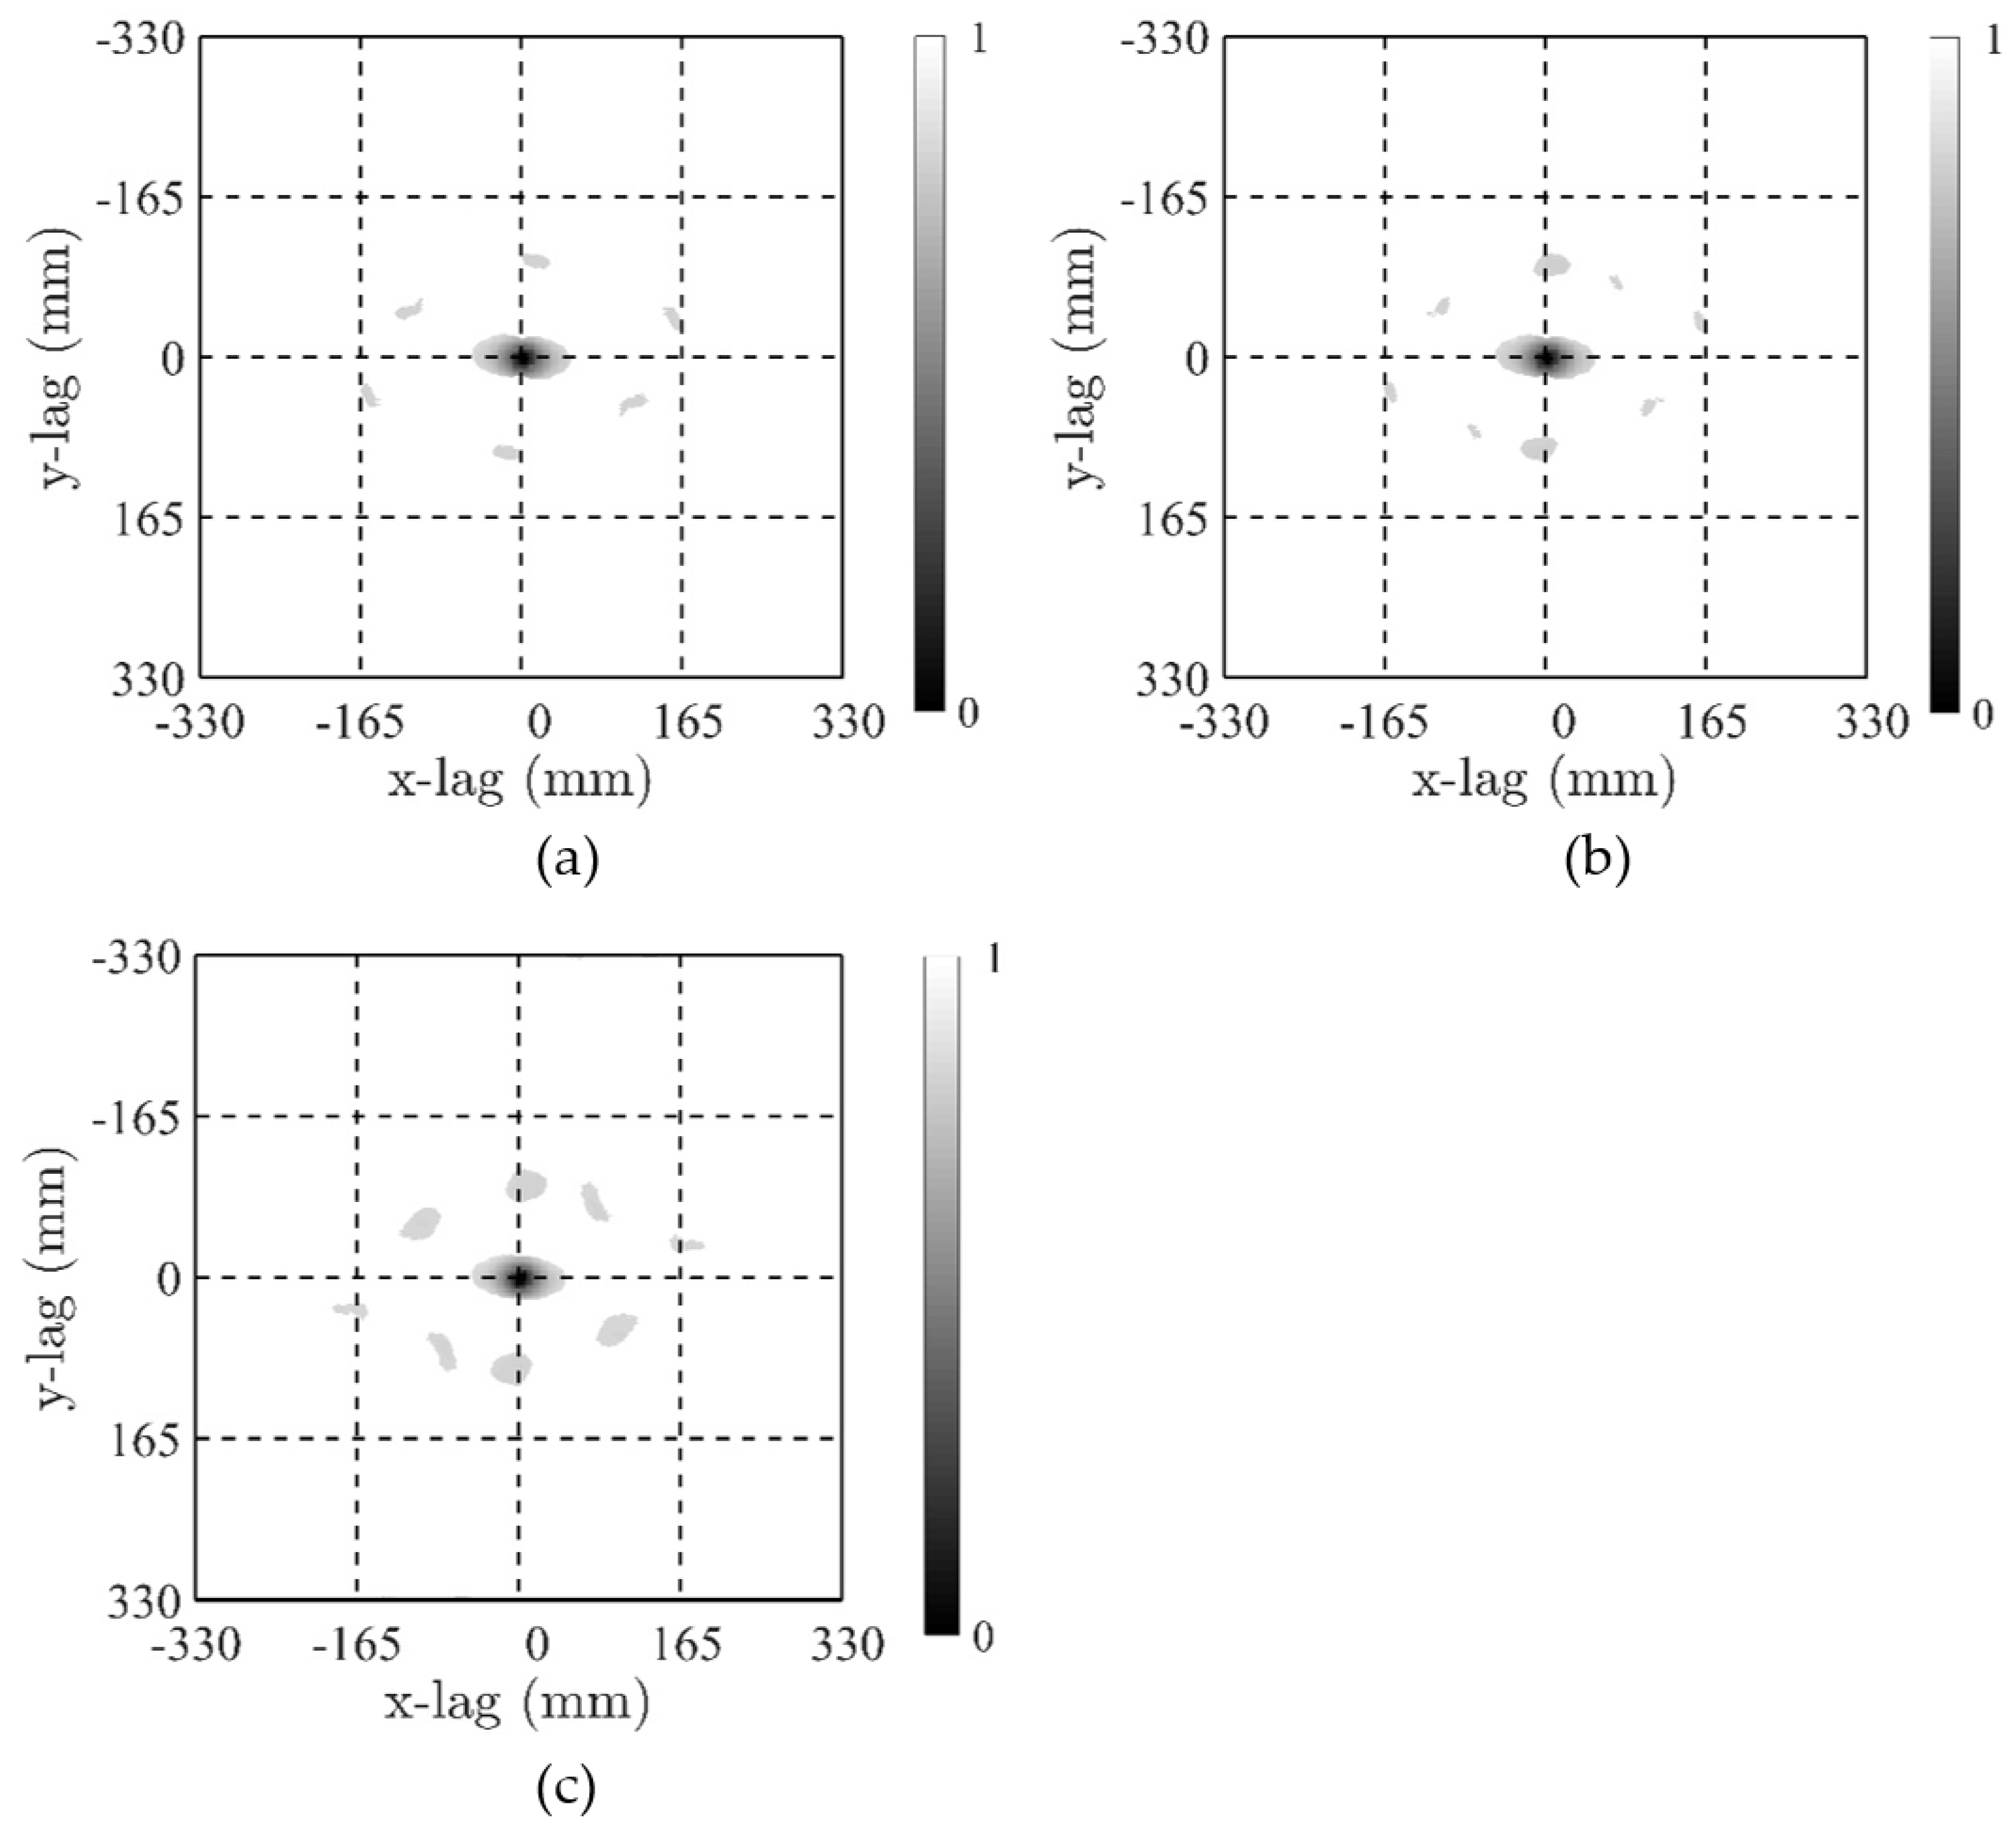
The beds were also compared on the basis of normalized 2D-second order structure functions (2DSSF). For this purpose, the filtered normalized 2DSSF were determined according to the method described in detail in Qin et al. [17]. In brief, filtered 2DSSFs show only values in areas which are characterized by statistical significant correlations. The latter are determined by subdividing the surface in small tiles of a certain length scale and reshuffling them to create new surfaces. For these new surfaces, 2DSSF are calculated and used for statistical significance testing. The method is based on Monte Carlo simulations (see [17] for details) and for the present analysis, the reshuffled quadratic sub-areas were characterized by a side length of d84 of the original gravel-bed. The statistical significance testing carried out here was based on a significance level 5% and 100 Monte-Carlo simulations.
Figure 7 shows the filtered 2DSSFs for the three surfaces and the sub-plots reveal areas of high spatial correlation at small spatial lags (the minimum value of 0 indicates perfect spatial correlation and a value of 1 a lack of spatial correlation). The area of high correlation for small spatial lags are characterized by a central ellipse, and the spatial extent of the main axes of the central ellipses can be interpreted as characteristic length scales in the horizontal plane [19]. The benefit of the filtered 2DSSF is that these length scales can be clearly defined and the resulting values of 100 mm (96 mm for the rotated bed) for the long and 40 mm for the short axis (for all three beds) substantiates the high accuracy that was achieved when reproducing the bed.
The 2DSSFs can also be used to investigate the mean alignment of larger particles on the bed. For the present case, the orientation of the long axis of the ellipses deviates 5 degrees from the flow direction indicating that most of the larger particles are nearly aligned with their long axis in flow direction. This is in agreement with previous studies investigating the surface structure of stable armour layers [16]. Note that the patterns at larger spatial lags in Figure 7 reflect grain structures larger than individual grains. However, despite the fact that they are statistically significant, their value indicates only a low spatial correlation so that these patterns should not be interpreted [17].
4.2. Flow Resistance
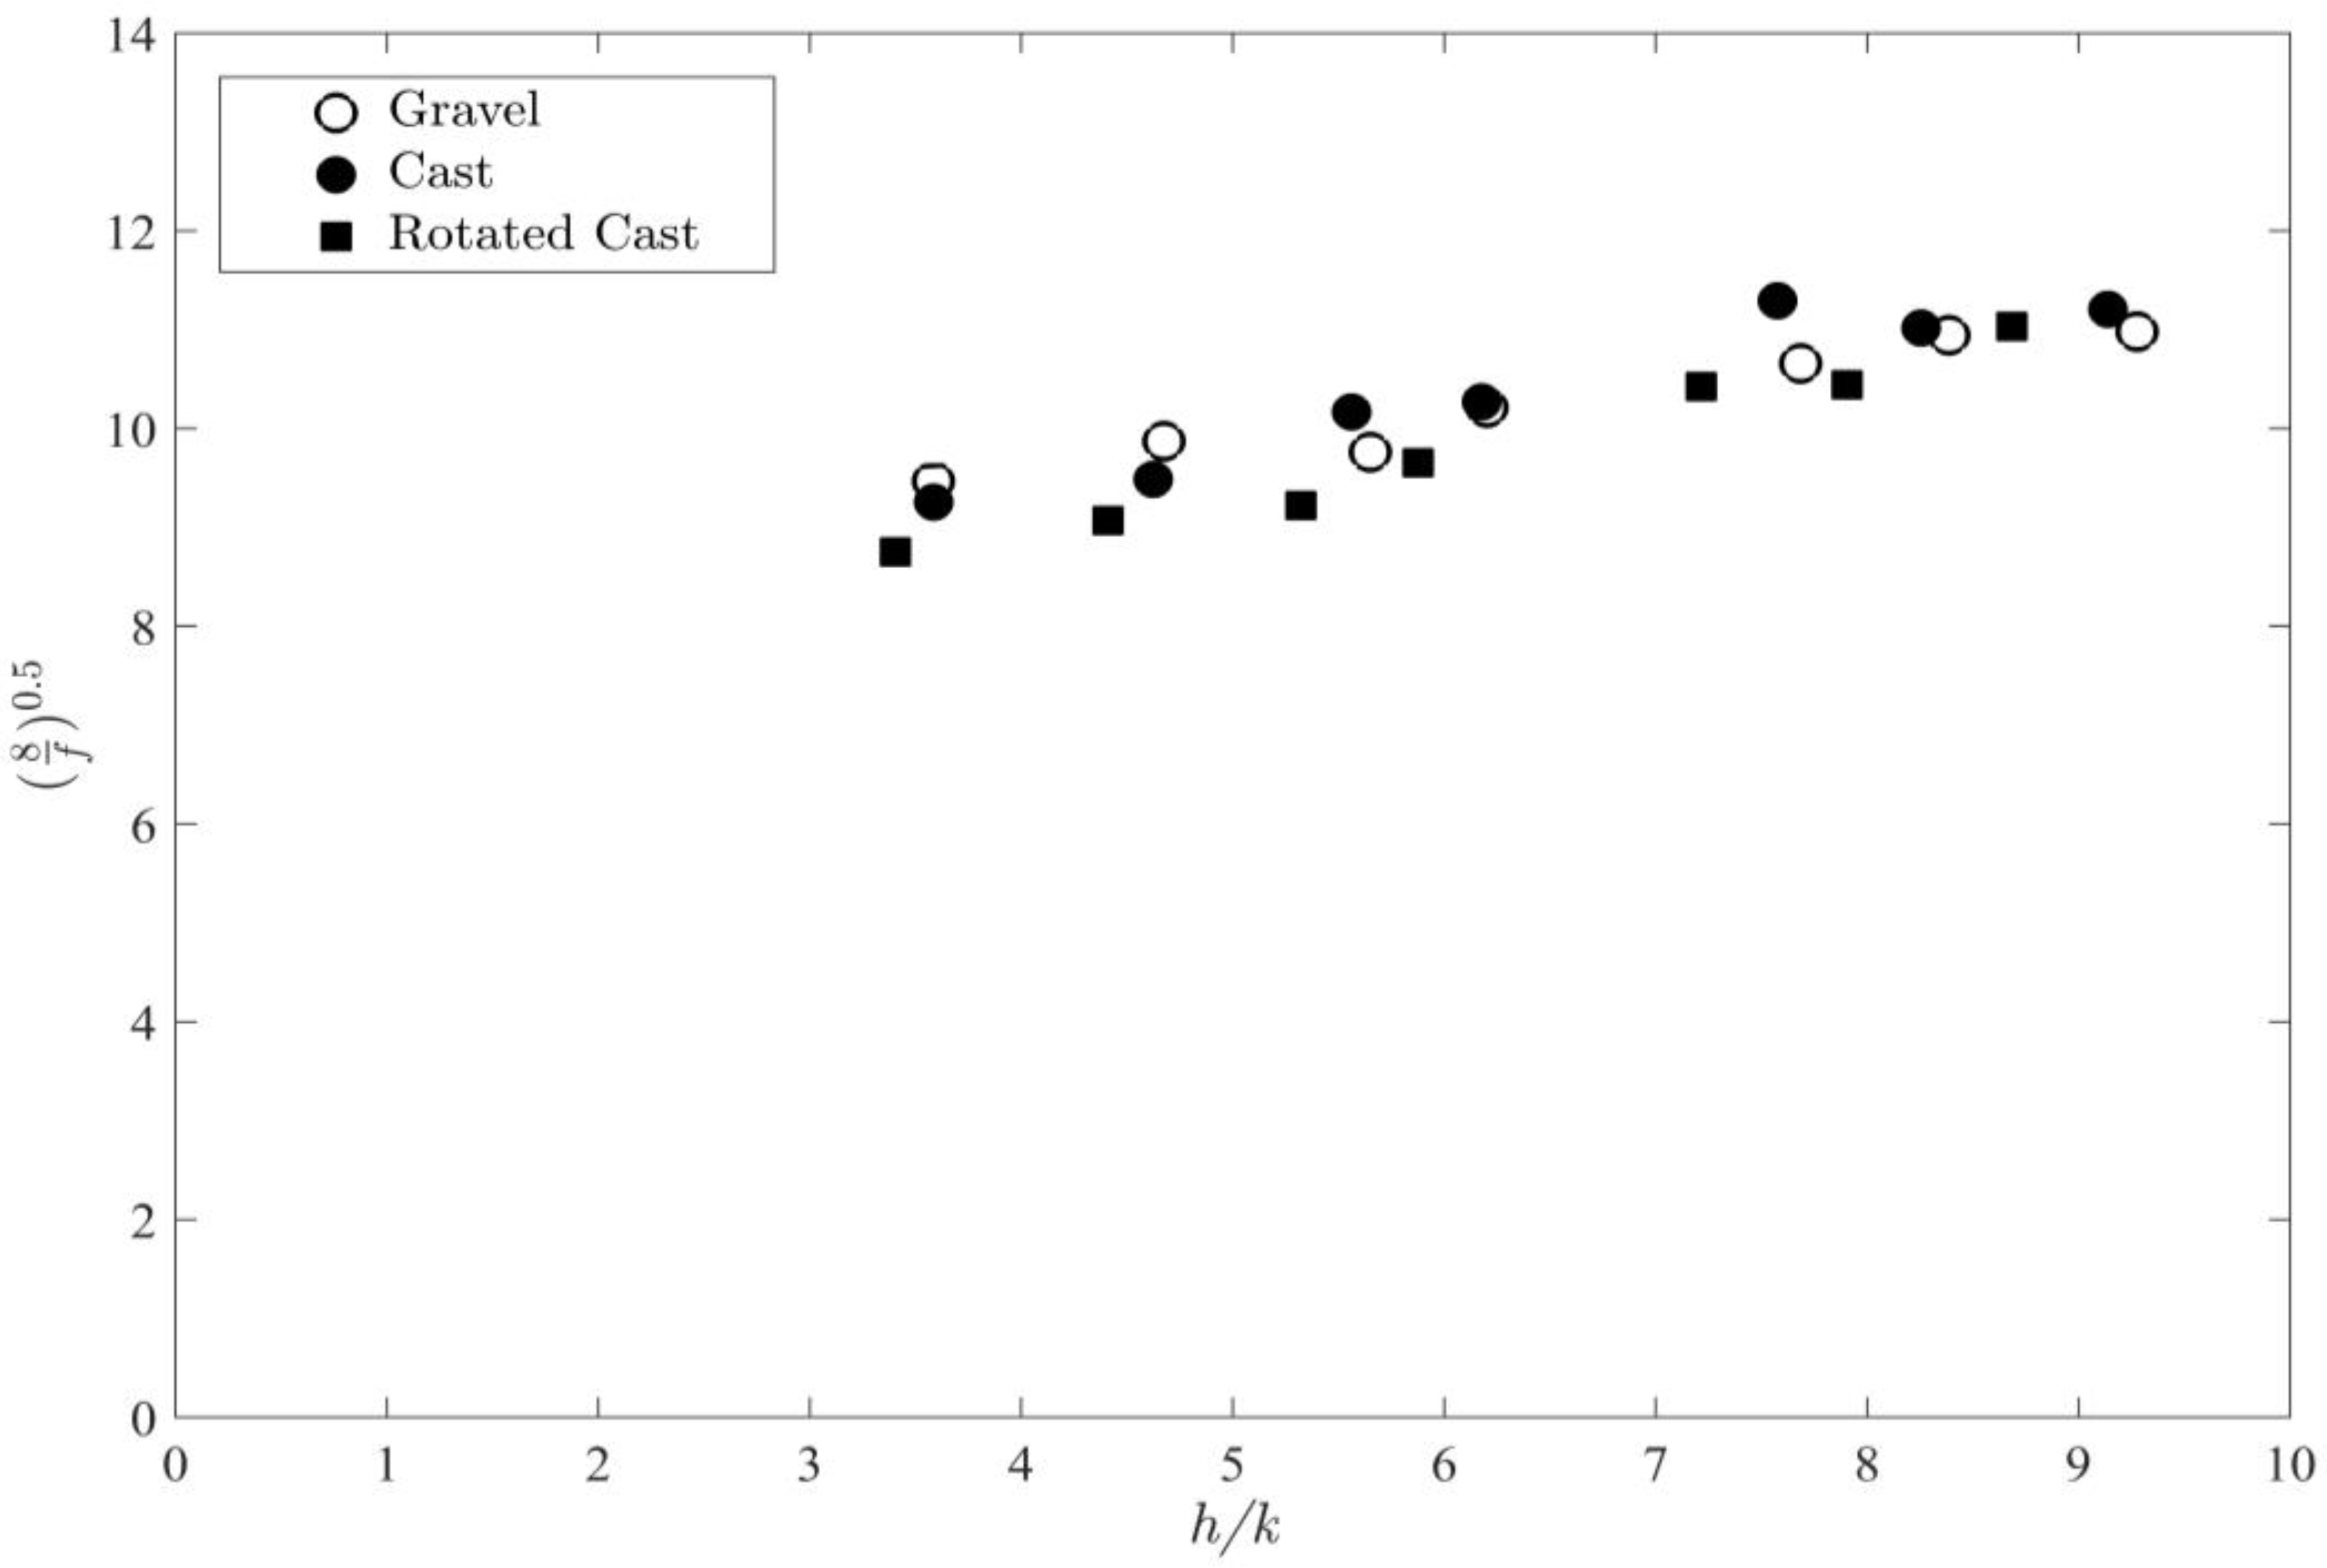
The good agreement between the geometry of the original bed with its counterparts is a prerequisite for the detailed analysis of differences in hydraulic resistance. Figure 8 shows (8/f)0.5 as a function of relative submergence (h/k) for the three surfaces. The lowest values of (8/f)0.5, i.e., a higher Darcy-Weisbach friction factor f, was observed for the tests over the rotated bed for relative submergences h/k < 6. For relative submergences h/k > 6, the difference in (8/f)0.5 between the rotated bed and the cast became smaller which may be due to the increasing submergence. Moreover, the uncertainty associated with the water surface slope measurements increased for the highest submergence for which Sw was rather small (~0.05%). On the other hand, in all tests with the rotated cast-bed it was necessary to decrease the discharge to obtain the same water levels as in the tests with the cast-bed (discharge reductions of up to 6% were required; the average was 4%). The higher flow resistance exerted by the rotated cast-bed shows that the orientation of the grains on the surface has a significant influence on flow resistance, i.e., the water working results in a more hydraulically efficient bed configuration (e.g., [37]). For example, rotating the fixed cast-bed means that the lee-areas of grains, where small grains typically settle during armoring, become exposed to the flow. Rotating the cast-bed, these particles are directly exposed to the flow but cannot be eroded as they are part of the cast. As a consequence these areas are characterized by a less hydrodynamic shape than comparable frontal areas of real water-worked beds as the associated drag coefficient changes with the shape and orientation [38]. Consequently, the rotated cast-bed imposes a higher resistance on the flow than the cast-bed. This result thus implies that bed roughness cannot solely be described by a characteristic grain size and that both surface structure and grain orientation play a vital role for the determination of flow resistance [14,18,19].
Figure 8 further reveals small differences in flow resistance between the porous gravel-bed and its impermeable counterpart. For the two lowest submergences (h/k = 3.6 and 4.7), (8/f)0.5 is larger for the porous gravel-bed than for the impermeable cast-bed while for the larger relative submergences this trend is reversed. This means that, for the two lowest submergences, larger friction factors were obtained for the cast-bed than for the porous gravel-bed. These two experiments were carried out with discharges of Q = 0.056 m3/s and 0.076 m3/s, respectively, for the gravel-bed and Q = 0.056 m3/s and 0.074 m3/s respectively, for the cast-bed to obtain identical water depths h. Noting that a certain amount of the flow is conveyed through the subsurface in the porous-bed tests, the discharge used for the calculations of the bulk values in Table 1 should, strictly speaking, be reduced to account for subsurface flow. The experimental setup did not allow for the measurement of the subsurface flow rate but assuming a flow rate of approx. 0.001–0.002 m3/s, computations indicated that for these two cases the flow resistance of the porous gravel-bed would be slightly larger than for the cast-bed (h/k = 3.7) or approximately equal (h/k = 4.7). The significance of subsurface flow rate gradually decreases with increasing discharge (and hence increasing relative submergence) so that the results for the experiments carried out with h/k ≥ 5.7 (discharges Q ≥ 0.121 m3/s; Table 1) are less affected, i.e., in these tests the flow resistance of the porous bed was larger than for the cast-bed.
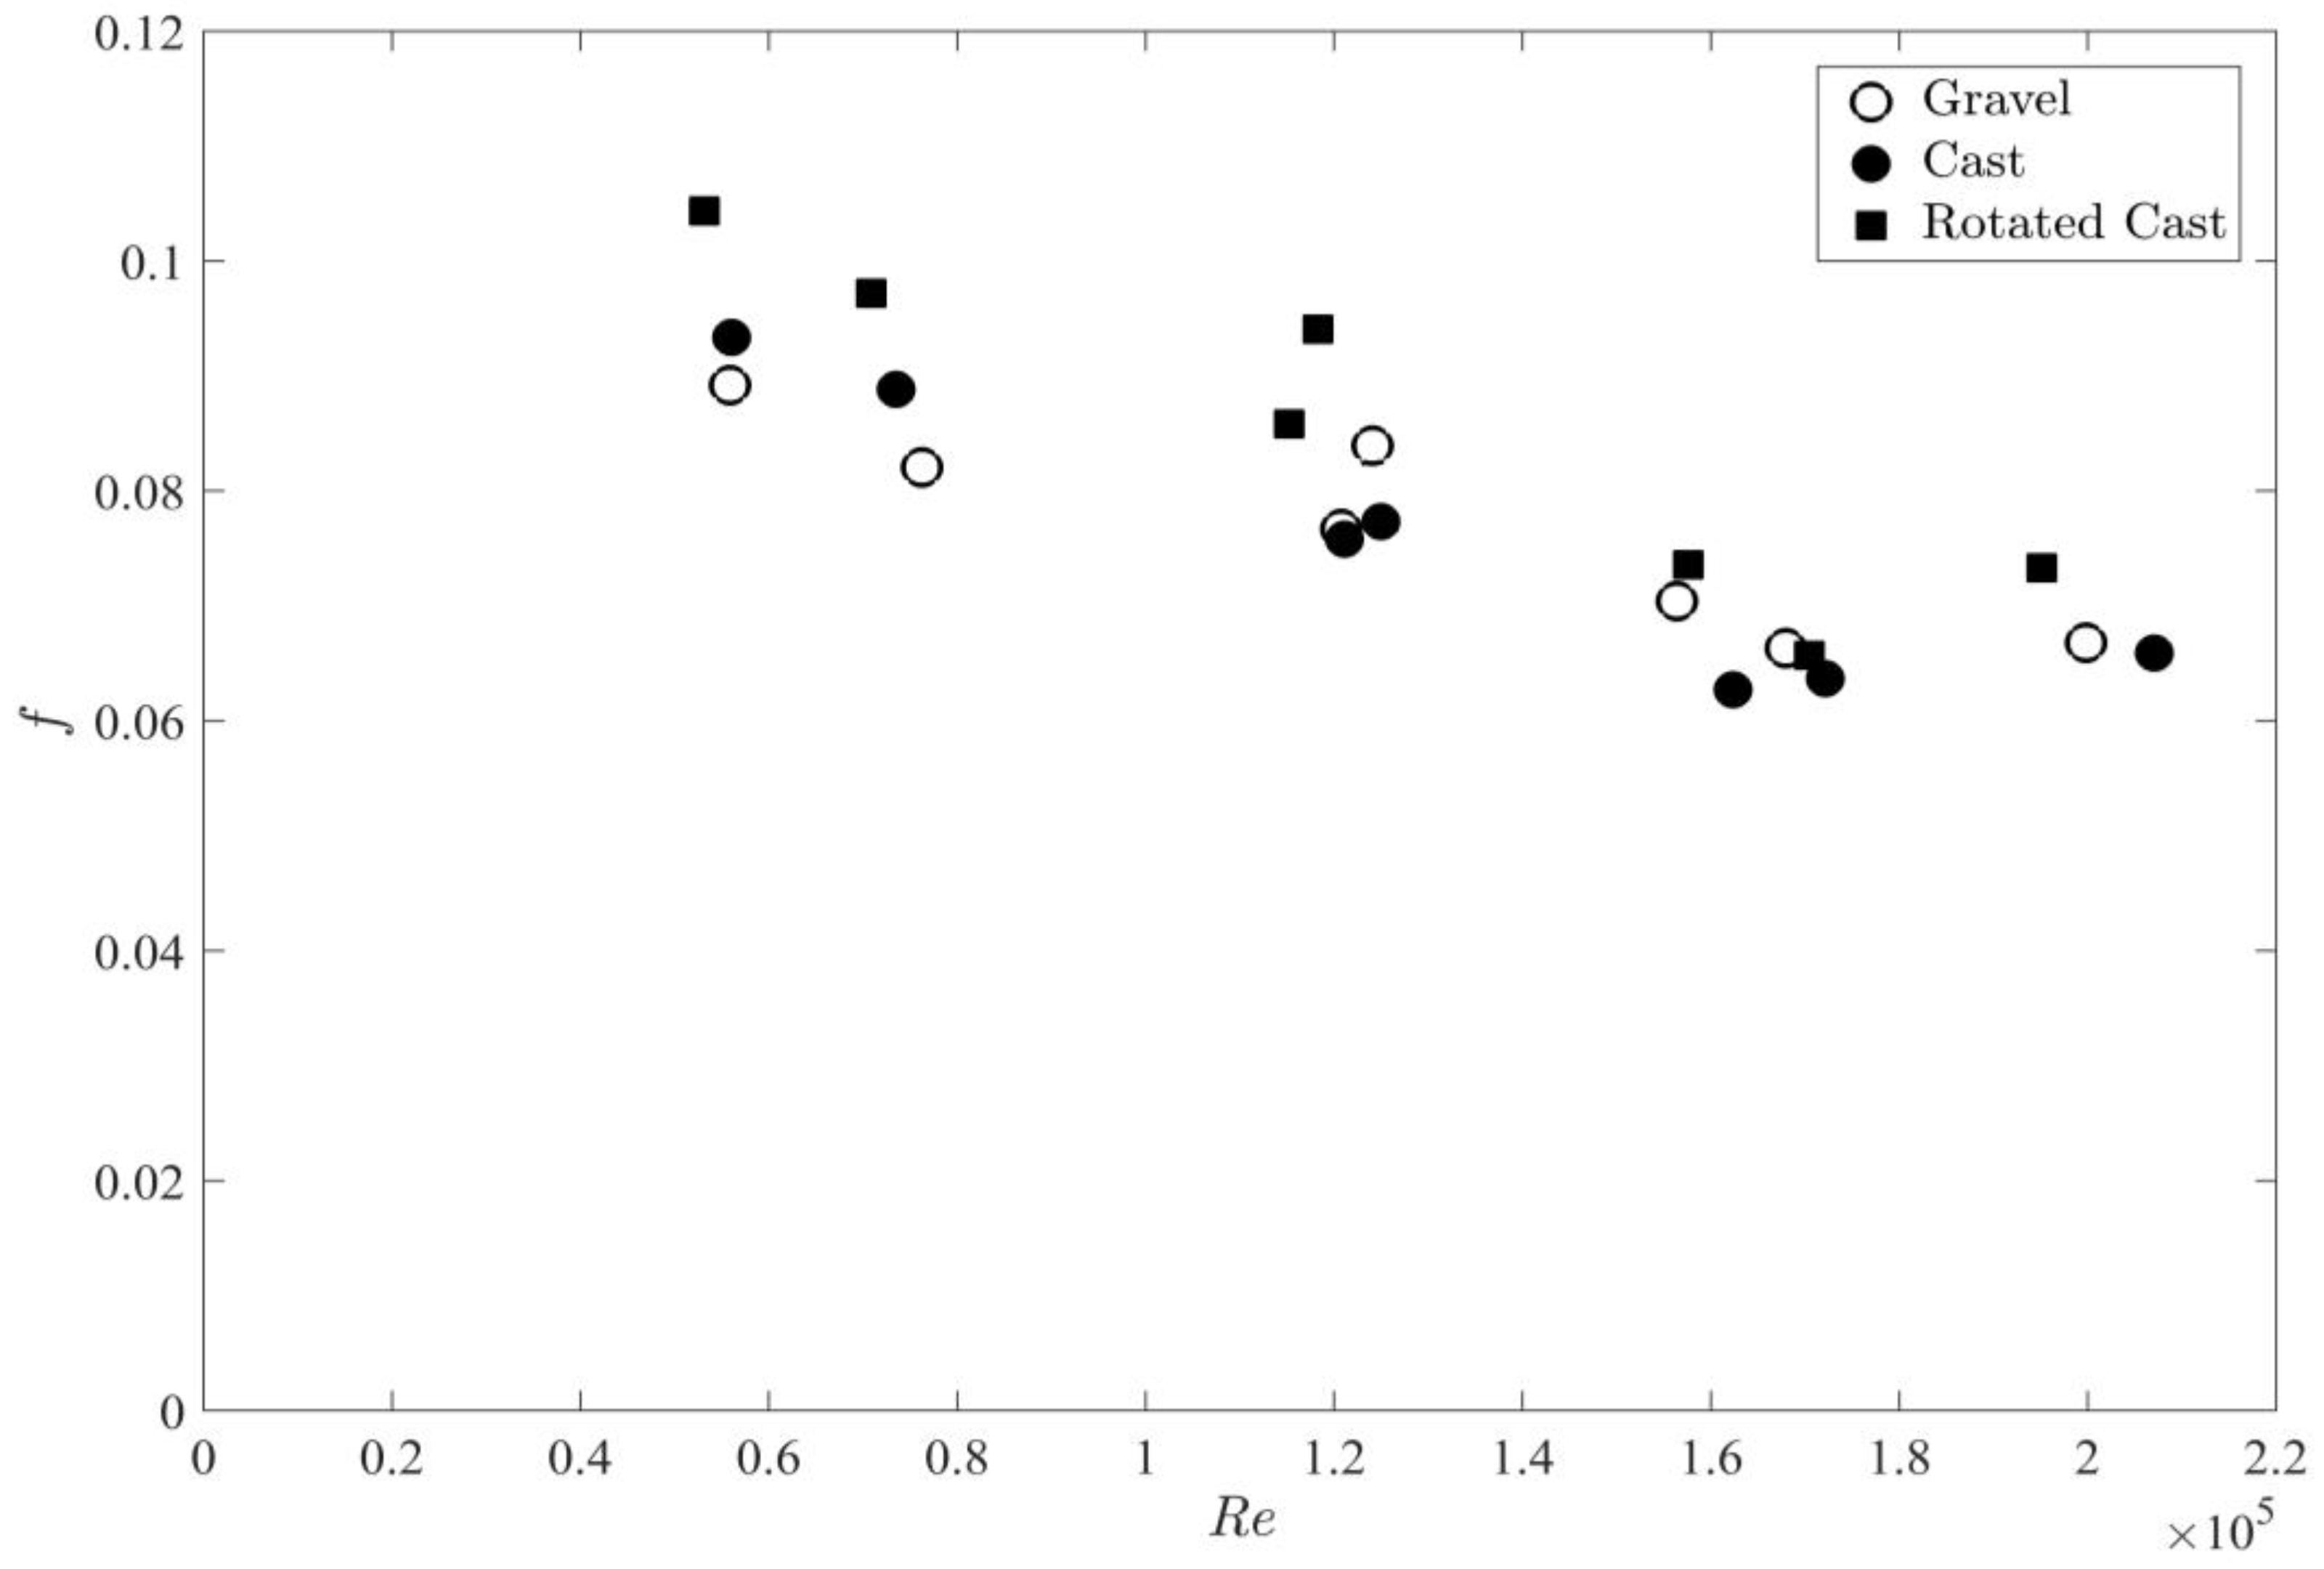
The literature review revealed that flow resistance over porous beds depends on Re (e.g., [24]), and therefore f is plotted as a function of Re in Figure 9. Regarding the comparison of f obtained for the experiments over the cast-bed and the rotated cast-bed, Figure 9 yields the same conclusions as before; the rotated bed is characterized by higher flow resistance for all boundary conditions except for Re ≈ 170,000 corresponding to the test which was carried out with the lowest water surface slope (~0.05%). For Re > 100,000 (h/k ≥ 5.7), Figure 9 reveals again that the porous gravel bed showed a higher resistance to the flow than its non-porous counterpart. In fact, for the experiments over the cast-bed the discharge had to be increased for h/k ≥ 5.7 to obtain the same water depth and shear velocity as in the porous-bed experiments, which confirms the observed trend. The deviation of the friction factors for the tests carried out for the lowest Re values would be mitigated if subsurface flow would be accounted for (see above).
The above discussion regarding the differences in friction factors needs to be extended regarding the surface properties. For example, the cast-bed was characterized by slightly larger k-values and standard deviations σ than the porous bed (Table 2). These values indicate that the cast-bed may be slightly ‘rougher’ in geometrical terms than the gravel-bed, and this may contribute to the observed trend at lower submergences (and hence low Re). Similarly, the rotated cast-bed was characterized by larger k- and σ-values than the cast-bed, which in turn means that the rotated cast-bed was already rougher due to its placement. However, the differences in k and σ are rather small (less than 2 mm for k and 0.56 mm for σ) so that it can be hypothesized that this effect is negligible.
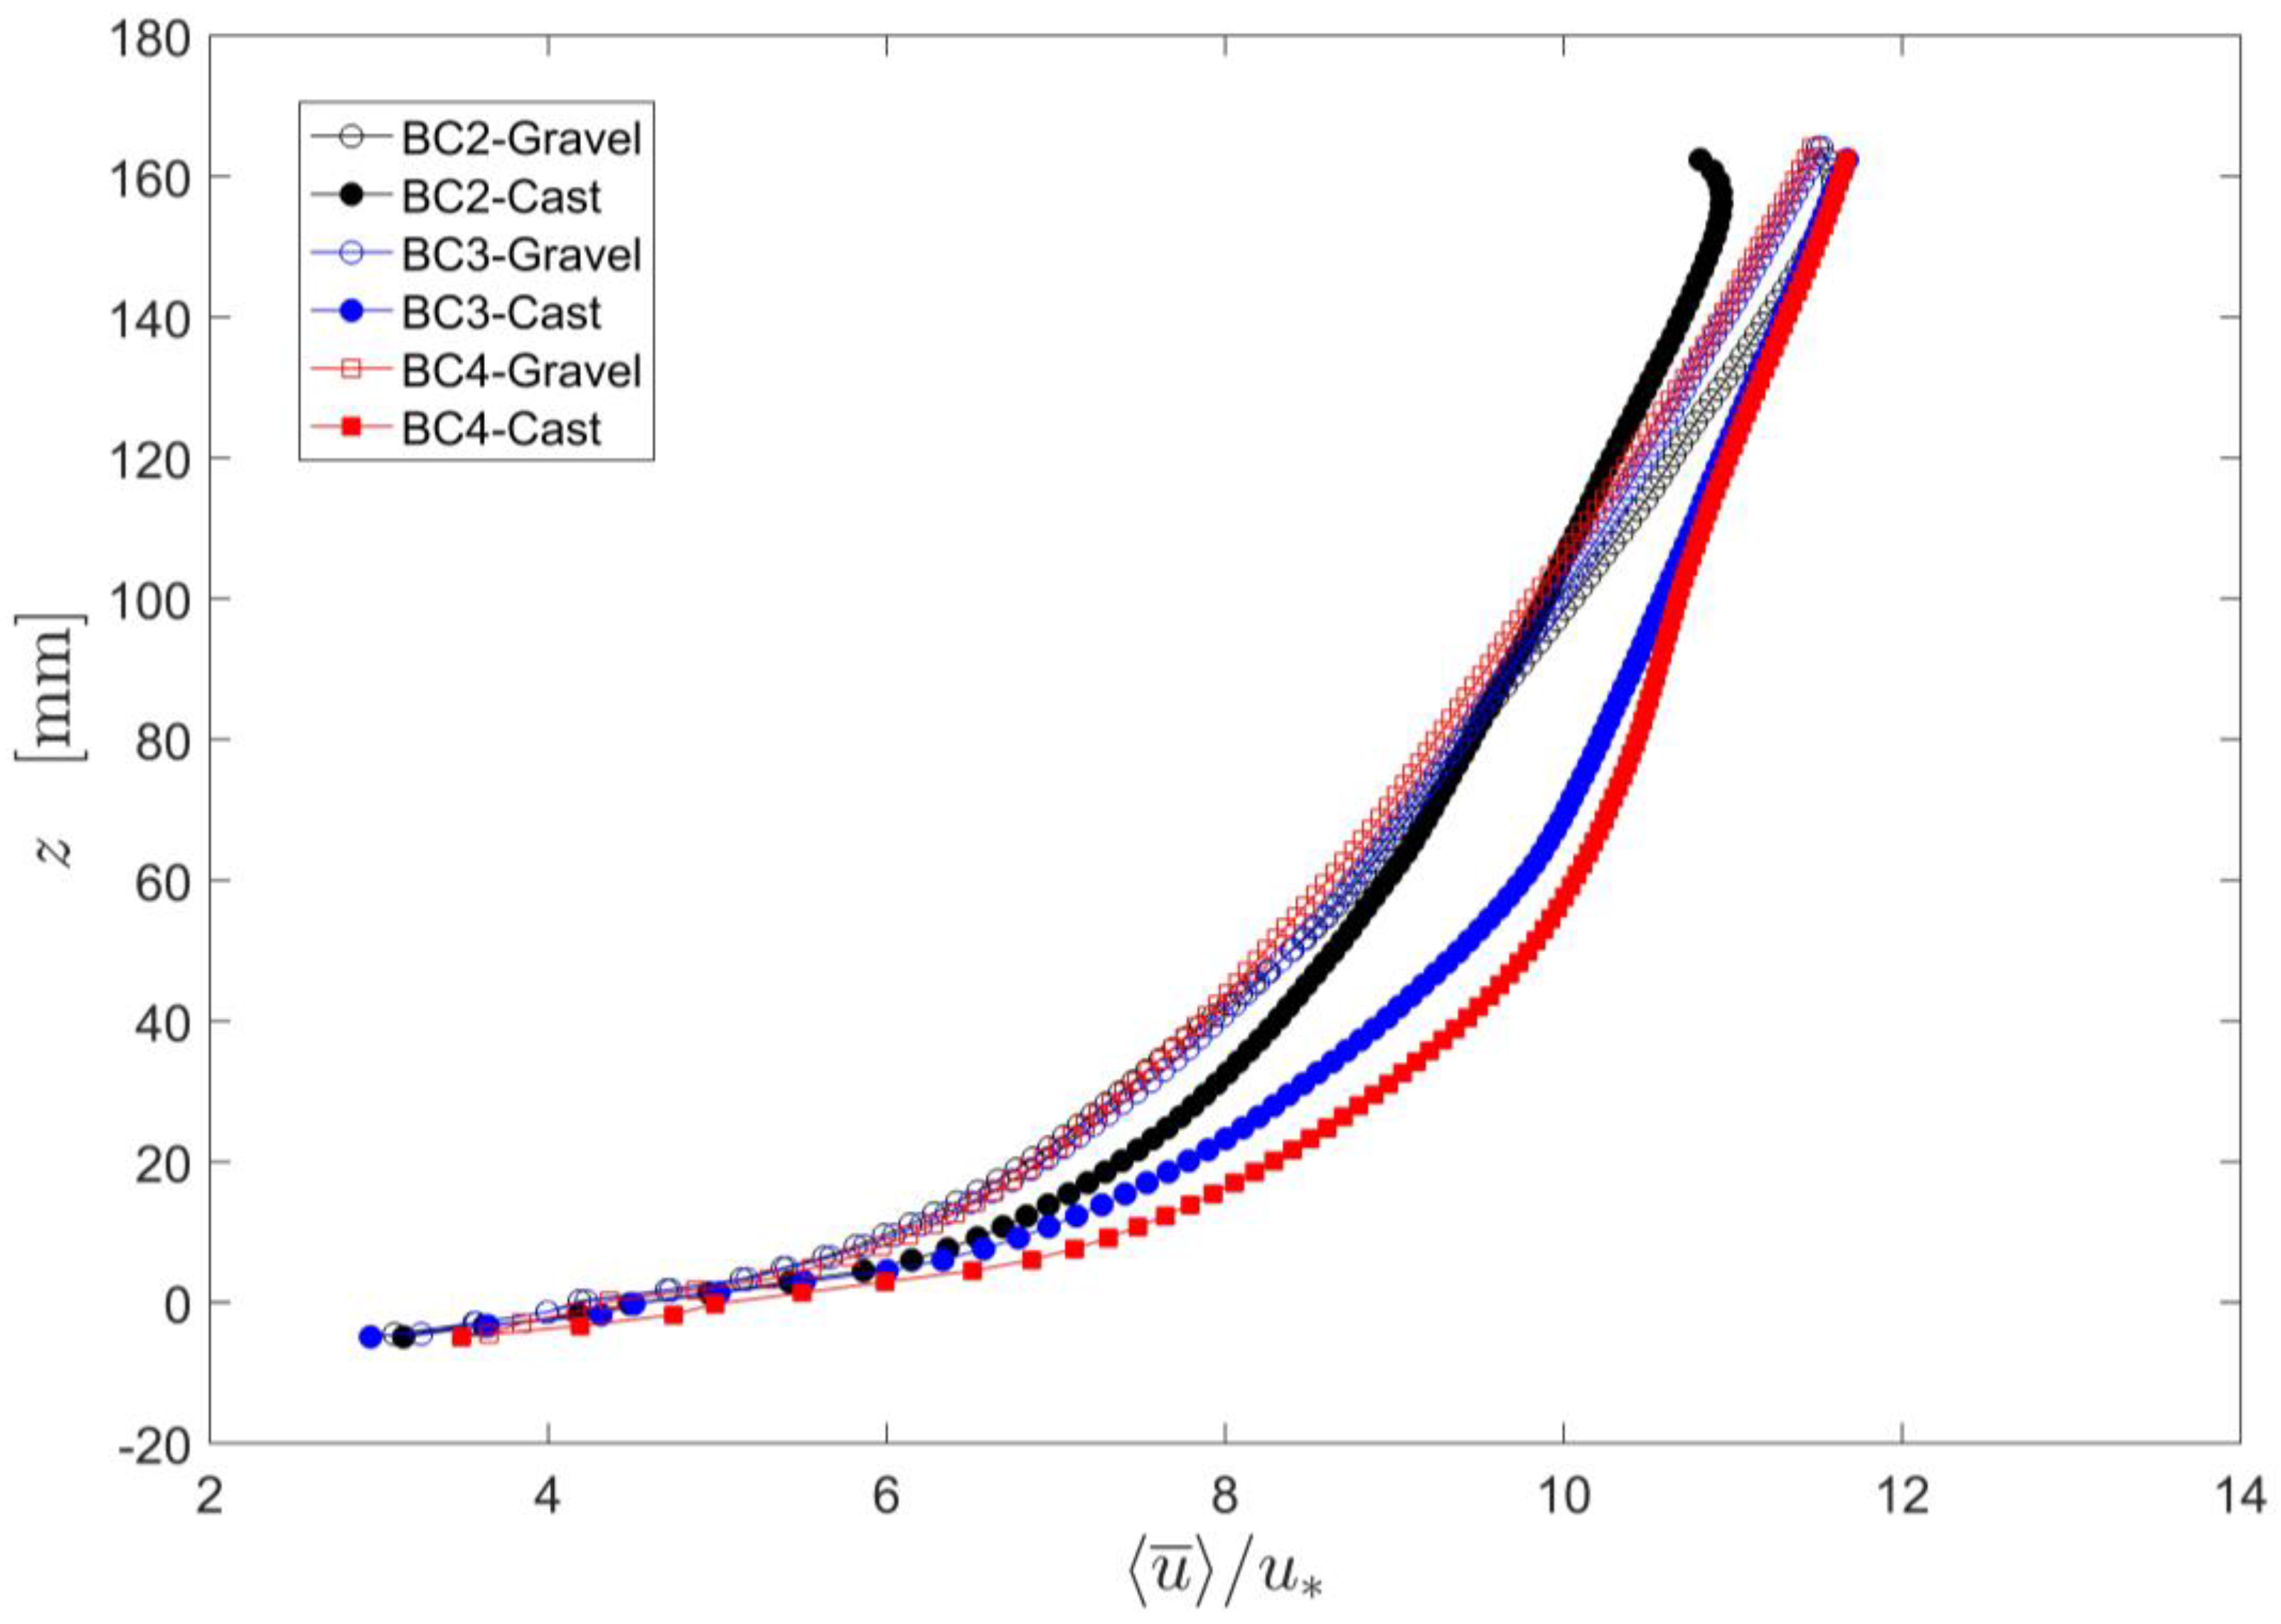
The comparison of the porous and non-porous bed can be further investigated by a preliminary and qualitative analysis of the double averaged longitudinal velocity distributions (i.e., time-averaged PIV-velocities, which were then spatially averaged in planes parallel to the mean bed elevation). Figure 10 shows exemplarily the velocity distributions, normalized with the shear velocities obtained by Equation (2), for three different boundary conditions (BC2, BC3 and BC4) corresponding to the three different shear velocities (Table 1). The origin of the vertical axis (z = 0) in Figure 10 corresponds to the mean bed elevation. The global roughness crest (i.e., the roughness crest of the scanned section) was 23 mm above the mean bed elevation whereas the local roughness crest (i.e., the roughness crest of the shorter PIV section) was only 8 mm above the mean bed level.
The three normalized velocity profiles over the gravel-bed tests (open symbols in Figure 10) nearly collapse on a single line and show the expected logarithmic shape above the roughness crest. The three profiles over the cast-beds (solid symbols) deviate slightly, especially the profile for BC2. Note that the dip in the velocity profile for BC2 at z ≈ 160 mm is due to a plastic glass which was placed at the water surface to avoid the refraction of laser sheet caused by surface waves. In order to cross-check the data, the velocity profiles were integrated to estimate the discharge and for all presented profiles, the calculated discharge was similar to the discharge used in the experiments.
The comparison of the profiles over the gravel-bed with the ones over the cast-bed shows that, for the same boundary condition, the velocities above the crest in the near-bed region (8 mm < z < 80 mm) are larger over the cast-bed than over the porous bed. While the aforementioned cast-bed profile for BC2 shows larger velocities than the gravel-bed profile up to z ≈ 80 mm, the velocity profiles for BC3 and BC4 show higher values for the cast-bed up to z ≈ 140 mm before nearly matching the velocities over the gravel-bed.
The smaller velocities over the crest of the water-worked gravel-bed in the near-bed region are additional evidence that a porous water-worked gravel-bed imposes higher flow resistance. It is interesting to note that in the interfacial sublayer (i.e., z < 8 mm), the flow velocities are partly larger over the water-worked gravel-bed than over the cast, especially below the mean bed elevation (z < 0). This can be explained by the ‘no slip’ condition for the non-porous cast-bed while, due to the porosity of the subsurface layer, such a condition does only exist at the gravel-particle surfaces over the gravel-bed. Note that due to the limitations of the PIV-setup, the velocity profiles could not be measured to the roughness trough. Nonetheless, these preliminary results of the PIV data further confirm the results from the bulk-flow analysis that the flow resistance over the porous gravel-bed is larger than over the cast-bed.
The presented results together with the results of the qualitative analysis of the double-averaged velocity profiles can be used to discuss the different results regarding the influence of porosity reported by Cooper et al. [32]. The present study is based on experiments carried out over a casted surface which covered nearly the entire flume area. On the other hand, the length and width of the cast-bed in [32] was limited, corresponding roughly to about 5% of the total water-worked area, and the control of the sub-surface flow was not clearly stated by Cooper et al. [32]. Moreover, the cast tile was placed in the middle of the water-worked gravel and hence the transition from the gravel-bed to the cast-bed could affect the flow patterns; however, here we can only speculate about this effect. On the other hand, it is interesting to note that the range of relative submergence (h/k) in Cooper et al. [32] varied between 3.1 and 4.6 with Re ranging between 64,000 and 84,000. The results presented in Figure 8 and Figure 9 indicate that for comparable relative submergences and Re-values the cast-bed is ‘rougher’ which coincides with the findings of Manes et al. [28], Cooper et al. [32] although the behavior of the velocity profiles deviates from the one reported by Cooper et al. [32].
5. Summary and Conclusions
The present study presents results from an experimental program aiming at the investigation of the effect of gravel-bed porosity and grain orientation on bulk flow resistance. Experiments were carried out over three different surfaces; a water-worked gravel-bed, its non-porous counterpart (cast-bed), and the rotated cast-bed. The quality of the reproduced beds was shown and discussed based on laser-scan data and statistical parameters. Focusing on the analysis of bulk-flow parameters, the results showed that the rotated cast exerted the highest flow resistance which yielded to the conclusion that not only the surface structure but also its alignment regarding the flow direction (i.e., grain orientation) has a major influence on flow resistance. The results also confirmed the findings from studies carried out over artificial beds that a porous gravel-bed imposes higher flow resistance than its non-porous counterpart for comparable relative submergences. In the analysis of the data, the importance of subsurface flow-rates was briefly highlighted, especially for low relative submergences and hence slightly reduced surface flow rates. The subsurface flow rate has often been neglected in flume studies dealing with the determination of flow resistance, and this can hamper the comparability of results from experiments which were carried out over impermeable beds. The results of the present study have practical implications. For example, colmation processes, i.e., the settling of fine particles in the hyporheic zone, can change the porosity of the sub-surface, and hence the flow resistance (or vice versa). Having analyzed bulk flow characteristics in this paper, we will use the PIV-data for the detailed analysis of flow patterns over the three beds to investigate the effect of porosity on the near bed turbulent flow field and turbulence characteristics in our upcoming analyses.
Author Contributions
Christy Ushanth Navaratnam and Jochen Aberle conceived and designed the experiments. Christy Ushanth Navaratnam performed the experiments and analyzed the data with support from Jie Qin, Pierre-Yves Henry and Jochen Aberle. All authors contributed to write the manuscript.
Funding
This research received no external funding.
Acknowledgments
Authors are thankful to C. Manes for providing the data from his study which helped to compare results between these studies.
Conflicts of Interest
The authors declare no conflict of interest.
References
- Nikora, V.; Koll, K.; McEwan, I.; McLean, S.; Dittrich, A. Velocity Distribution in the Roughness Layer of Rough-Bed Flows. J. Hydraul. Eng. 2004, 130, 1036–1042. [Google Scholar] [CrossRef]
- Aberle, J.; Koll, K.; Dittrich, A. Form induced stresses over rough gravel-beds. Acta Geophys. 2008, 56, 584–600. [Google Scholar] [CrossRef]
- Coleman, S.E.; Nikora, V.I.; Aberle, J. Interpretation of alluvial beds through bed-elevation distribution moments. Water Resour. Res. 2011, 47, W11505. [Google Scholar] [CrossRef]
- Vollmer, S. Einfluß der Oberflächenströmung auf die Permeable Gewässersohle; Universität Karlsruhe (TH): Karlsruhe, Germany, 2005. [Google Scholar]
- Detert, M. Hydrodynamic Processes at the Water-Sediment Interface of Sreambeds. Doctoral Thesis, Universität Karlsruhe (TH), Karlsruhe, Germany, 2008. [Google Scholar]
- Chow, V.T. Open-Channel Hydraulics; McGraw-Hill, Inc.: Singapore, 1959. [Google Scholar]
- Keulegan, G.H. Laws of Turbulent Flow in Open Channels. J. Res. Natl. Bureau Standards 1938, 21, 707–741. [Google Scholar] [CrossRef]
- Hey, R.D. Flow Resistance in Gravel-Bed Rivers. J. Hydraul. Div. 1979, 105, 365–379. [Google Scholar]
- Bathurst, J.C. Flow Resistance Estimation in Mountain Rivers. J. Hydraul. Eng. 1985, 111, 625–643. [Google Scholar] [CrossRef]
- Ferguson, R. Flow resistance equations for gravel- and boulder-bed streams. Water Resour. Res. 2007, 43, W05427. [Google Scholar] [CrossRef]
- Hendrick, R.R.; Ely, L.L.; Papanicolaou, A.N. The role of hydrologic processes and geomorphology on the morphology and evolution of sediment clusters in gravel-bed rivers. Geomorphology 2010, 114, 483–496. [Google Scholar] [CrossRef]
- Nikora, V.I.; Goring, D.G.; Biggs, B.J.F. On gravel-bed roughness characterization. Water Resour. Res. 1998, 34, 517–527. [Google Scholar] [CrossRef]
- Smart, G.M.; Duncan, M.J.; Walsh, J.M. Relatively Rough Flow Resistance Equations. J. Hydraul. Eng. 2002, 128, 568–578. [Google Scholar] [CrossRef]
- Aberle, J.; Smart, G.M. The influence of roughness structure on flow resistance on steep slopes. J. Hydraul. Res. 2003, 41, 259–269. [Google Scholar] [CrossRef]
- Yochum, S.E.; Bledsoe, B.P.; David, G.C.L.; Wohl, E. Velocity prediction in high-gradient channels. J. Hydrol. 2012, 424–425, 84–98. [Google Scholar] [CrossRef]
- Aberle, J.; Nikora, V. Statistical properties of armored gravel bed surfaces. Water Resour. Res. 2006, 42, W11414. [Google Scholar] [CrossRef]
- Qin, J.; Aberle, J.; Henry, P.-Y.; Wu, T.; Zhong, D. Statistical significance of spatial correlation patterns in armoured gravel beds. J. Hyraul. Res. 2018, in press. [Google Scholar]
- Powell, D.M. Flow resistance in gravel-bed rivers: Progress in research. Earth-Sci. Rev. 2014, 136, 301–338. [Google Scholar] [CrossRef]
- Flack, K.A.; Schultz, M.P. Review of Hydraulic Roughness Scales in the Fully Rough Regime. J. Fluids Eng. 2010, 132, 041203. [Google Scholar] [CrossRef]
- Tonina, D.; Buffington, J.M. Hyporheic exchange in gravel bed rivers with pool-riffle morphology: Laboratory experiments and three-dimensional modeling. Water Resour. Res. 2007, 43, W01421. [Google Scholar] [CrossRef]
- Boano, F.; Harvey, J.W.; Marion, A.; Packman, A.I.; Revelli, R.; Ridolfi, L.; Wörman, A. Hyporheic flow and transport processes: Mechanisms, models, and biogeochemical implications. Rev. Geophys. 2014, 52, 603–679. [Google Scholar] [CrossRef]
- Marion, A.; Nikora, V.; Puijalon, S.; Bouma, T.; Koll, K.; Ballio, F.; Tait, S.; Zaramella, M.; Sukhodolov, A.; O’Hare, M.; et al. Aquatic interfaces: A hydrodynamic and ecological perspective. J. Hydraul. Res. 2014, 52, 744–758. [Google Scholar] [CrossRef]
- Zagni, A.F.E.; Smith, K.V.H. Channel flow over permeable beds of graded spheres. J. Hydraul. Div. 1979, 102, 207. [Google Scholar]
- Zippe, H.J.; Graf, W.H. Turbulent boundary layer flow over permeable and non-permeable rough surfaces. J. Hydraul. Res. 1983, 21, 51–65. [Google Scholar] [CrossRef]
- Breugem, W.P.; Boersma, B.J.; Uittenbogaard, R.E. The influence of wall permeability on turbulent channel flow. J. Fluid Mech. 2006, 562, 35–72. [Google Scholar] [CrossRef]
- Manes, C.; Pokrajac, D.; McEwan, I.; Nikora, V. Turbulence structure of open channel flows over permeable and impermeable beds: A comparative study. Phys. Fluids 2009, 21, 125109. [Google Scholar] [CrossRef] [Green Version]
- Manes, C.; Poggi, D.; Ridolfi, L. Turbulent boundary layers over permeable walls: Scaling and near-wall structure. J. Fluid Mech. 2011, 687, 141–170. [Google Scholar] [CrossRef]
- Manes, C.; Pokrajac, D.; Nikora, V.I.; Ridolfi, L.; Poggi, D. Turbulent friction in flows over permeable walls. Geophys. Res. Lett. 2011, 38, L03402. [Google Scholar] [CrossRef]
- Kuwata, Y.; Suga, K. Direct numerical simulation of turbulence over anisotropic porous media. J. Fluid Mech. 2017, 831, 41–71. [Google Scholar] [CrossRef]
- Aberle, J. Measurements of armour layer roughness geometry function and porosity. Acta Geophys. 2007, 55, 23–32. [Google Scholar] [CrossRef]
- Navaratnam, C.U.; Aberle, J.; Daxnerová, J. An Experimental Investigation on Porosity in Gravel Beds. In Free Surface Flows and Transport Processes; Springer International Publishing: Cham, Germany, 2018; pp. 323–334. [Google Scholar]
- Cooper, J.R.; Ockleford, A.; Rice, S.P.; Powell, D.M. Does the permeability of gravel river beds affect near-bed hydrodynamics? Earth Surf. Process. Landf. 2018, 43, 943–955. [Google Scholar] [CrossRef]
- Aberle, J.; Dittrich, A.; Koll, K.; Schoneboom, T. Sohlnahes turbulentes Strömungsfeld. In BAW-Workshop: Boden- und Sohl-Stabilität—Betrachtungen an der Schnittstelle zwischen Geotechnik und Wasserbau; Bundesanstalt für Wasserbau: Karlsruhe, Germany, 2004. [Google Scholar]
- Spiller, S.; Rüther, N. Artificial reproduction of the surface structure in a gravel bed. In 2nd IAHR Europe Conference; TU Munich: Munich, Germany, 2012. [Google Scholar]
- Navaratnam, C.U.; Aberle, J.; Spiller, S.M. Evaluation of the accuracy of a bed casting technique. In River Flow 2016; CRC Press: St. Louis, MO, USA, 2016; pp. 398–403. [Google Scholar]
- Graf, W.H.; Song, T. Bed-shear stress in non-uniform and unsteady open-channel flows. J. Hydraul. Res. 1995, 33, 699–704. [Google Scholar] [CrossRef]
- Leopold, L.B.; Langbein, W.B. The Concept of Entropy in Landscape Evolution. In Theoretical Papers in the Hydrologic and Geomorphic Sciences; United States Government Printing Office: Washington, DC, USA, 1962; pp. A1–A20. [Google Scholar]
- Cassan, L.; Roux, H.; Garambois, P.-A. A Semi-Analytical Model for the Hydraulic Resistance Due to Macro-Roughnesses of Varying Shapes and Densities. Water 2017, 9, 637. [Google Scholar] [CrossRef]
Figure 1.
Isometric view of the 3D drawing of the recirculating flume (the pumps, which are located below the inlet tank, are not shown). All units are in [mm].
Figure 1.
Isometric view of the 3D drawing of the recirculating flume (the pumps, which are located below the inlet tank, are not shown). All units are in [mm].

Figure 2.
Grain size distribution curve of the gravel mixture.

Figure 3.
Plan view of the flume consisting the working section; colored section and numbers denote the position of the cast tiles placement. All units are in [mm].
Figure 3.
Plan view of the flume consisting the working section; colored section and numbers denote the position of the cast tiles placement. All units are in [mm].

Figure 4.
The vertical distribution of the porosity for all surfaces, z is the distance from the flume bottom and H, the total height of the bed.
Figure 4.
The vertical distribution of the porosity for all surfaces, z is the distance from the flume bottom and H, the total height of the bed.

Figure 5.
Digital elevation models (DEMs) of (a) gravel, (b) cast and (c) rotated cast surface respectively, thick horizontal red line indicates the position of the laser sheet (flow direction is from left to right).
Figure 5.
Digital elevation models (DEMs) of (a) gravel, (b) cast and (c) rotated cast surface respectively, thick horizontal red line indicates the position of the laser sheet (flow direction is from left to right).

Figure 6.
(a) Histograms of the vertical elevation of all three surfaces; (b) histograms of the difference in the vertical elevations between gravel and cast surface.
Figure 6.
(a) Histograms of the vertical elevation of all three surfaces; (b) histograms of the difference in the vertical elevations between gravel and cast surface.

Figure 7.
The 2D second-order structure function of the surfaces filtered by the upper 5% confidence limit, values lower than the upper 5% confidence limit are preserved. The greyscale corresponds to the values of the normalized structure function which ranges from 0 to 1, where the value of 0 defines perfect spatial correlation. Sub-figures (a–c) correspond to gravel, cast and rotated cast surfaces respectively.

Figure 8.
(8/f)0.5 as function of relative submergence (h/k).

Figure 9.
The variation of bulk friction factors with Re for the tested bed surfaces.

Figure 10.
The double-averaged longitudinal velocities normalized with the shear velocities. Open and filled symbols denote water worked gravel-bed and cast-bed respectively while the colors represent different boundary conditions.
Figure 10.
The double-averaged longitudinal velocities normalized with the shear velocities. Open and filled symbols denote water worked gravel-bed and cast-bed respectively while the colors represent different boundary conditions.


Table 1.
Hydraulic boundary conditions applied for the measurements over the water-worked gravel-bed. The bulk flow velocity was determined from the equation of continuity U = Q/A where A = hb denotes the cross-sectional area with b = flume width (1 m).
Table 1.
Hydraulic boundary conditions applied for the measurements over the water-worked gravel-bed. The bulk flow velocity was determined from the equation of continuity U = Q/A where A = hb denotes the cross-sectional area with b = flume width (1 m).
| Test | Sb | Sw | h [m] | h/k [-] | Q [m3/s] | U [m/s] | Fr | Re | u* [m/s] |
|---|---|---|---|---|---|---|---|---|---|
| BC1 | 0.0018 | 0.00134 | 0.137 | 3.6 | 0.056 | 0.41 | 0.35 | 55 890 | 0.043 |
| BC2 | 0.0015 | 0.00103 | 0.178 | 4.7 | 0.076 | 0.43 | 0.32 | 76 270 | 0.043 |
| BC3 | 0.0015 | 0.00103 | 0.236 | 6.2 | 0.121 | 0.51 | 0.34 | 120 787 | 0.050 |
| BC4 | 0.0020 | 0.00159 | 0.215 | 5.7 | 0.124 | 0.58 | 0.40 | 124 107 | 0.059 |
| BC5 | 0.0013 | 0.00083 | 0.293 | 7.7 | 0.156 | 0.53 | 0.31 | 156 412 | 0.050 |
| BC6 | 0.0010 | 0.00051 | 0.353 | 9.3 | 0.168 | 0.48 | 0.25 | 167 987 | 0.043 |
| BC7 | 0.0015 | 0.00098 | 0.319 | 8.4 | 0.200 | 0.63 | 0.35 | 199 883 | 0.057 |
Table 2.
Statistical moments for the three surfaces.
| Bed Surface | Roughness Height, k [mm] | Standard Deviation σ [mm] | Skewness [-] | Kurtosis [-] |
|---|---|---|---|---|
| Gravel | 38.1 | 7.57 | 0.76 | 1.03 |
| Cast | 38.6 | 7.96 | 0.50 | 0.66 |
| Rotated Cast | 40.6 | 8.52 | 0.56 | 0.49 |
© 2018 by the authors. Licensee MDPI, Basel, Switzerland. This article is an open access article distributed under the terms and conditions of the Creative Commons Attribution (CC BY) license (http://creativecommons.org/licenses/by/4.0/).
Share and Cite
MDPI and ACS Style
Navaratnam, C.U.; Aberle, J.; Qin, J.; Henry, P.-Y. Influence of Gravel-Bed Porosity and Grain Orientation on Bulk Flow Resistance. Water 2018, 10, 561. https://doi.org/10.3390/w10050561
AMA Style
Navaratnam CU, Aberle J, Qin J, Henry P-Y. Influence of Gravel-Bed Porosity and Grain Orientation on Bulk Flow Resistance. Water. 2018; 10(5):561. https://doi.org/10.3390/w10050561
Chicago/Turabian StyleNavaratnam, Christy Ushanth, Jochen Aberle, Jie Qin, and Pierre-Yves Henry. 2018. "Influence of Gravel-Bed Porosity and Grain Orientation on Bulk Flow Resistance" Water 10, no. 5: 561. https://doi.org/10.3390/w10050561
Note that from the first issue of 2016, this journal uses article numbers instead of page numbers. See further details here.