Analysis of the Precipitation Regime over the Ligurian Sea
by
 , and
, and
Sara Pensieri
1,* ,
,
Maria Elisabetta Schiano
1,
Paola Picco
2,
Marco Tizzi
3 and
Roberto Bozzano
1 1
National Research Council of Italy, via De Marini 6, 16149 Genoa, Italy
2
Istituto Idrografico della Marina, Passo dell’Osservatorio 4, 16134 Genoa, Italy
3
Regional Environmental Protection Agency of Liguria, viale Brigate Partigiane 2, 16129 Genoa, Italy
*
Author to whom correspondence should be addressed.
Water 2018, 10(5), 566; https://doi.org/10.3390/w10050566
Submission received: 30 March 2018
/
Revised: 23 April 2018
/
Accepted: 25 April 2018
/
Published: 27 April 2018
(This article belongs to the Special Issue Impact of Climate on Hydrological Extremes)
Abstract
:The regions surrounding the North West Mediterranean Sea are often sites of intense precipitation events, particularly during the autumn months. The many casualties and the high economic costs due to these events demand a continuous improvement in forecasting models in support of early warning systems. The main weather conditions that determine episodes of heavy rain over these regions are known, but the high number of processes and interactions taking place at different time and space scales makes it extremely difficult to increase the skill pertaining to their predictability. To deepen the knowledge of the phenomena, both numerical simulations and analysis of historical data sets are required. This paper presents the analysis of a five-year-long time series of rain data collected in the open Ligurian Sea from the fixed platform W1M3A and coastal stations. The analysis aims to characterize the main features of the precipitation over this area and its seasonal and annual variability. Furthermore, the work includes a description of the main atmospheric and oceanic surface parameters measured from the platform during some intense events that occurred in the period 2009–2013 and suggests to what extent offshore observations may contribute to improve the forecast of rainfall events.
1. Introduction
The Liguria region delimits the North West Mediterranean Sea and it is characterized by the presence of mountains over 2000 m high at only few kilometres away from the coastline that give rise to several catchments with steep slopes and limited extension.
Owing to its geographic position and complex orography, the Liguria region is recurrently affected by intense precipitation. Since this area is densely populated, the consequences of these types of events are very dramatic with loss of lives and huge economic damage. Reliable forecasts can mitigate these catastrophic effects, and therefore, there is a constant effort for a continuous improvement in forecasting models in support of the development of early warning systems.
The main meteorological causes supporting high precipitations events (HPEs, hereafter) are quite well known: a frontal system or a mesoscale convective system (MCS, hereafter), sometimes combined each other [1,2]. Convective systems are often self-regenerating and persist over the same area for several hours. Some of them show a typical V-shape [3]. The large-scale synoptic patterns determining these situations are equally well known: a deep trough crossing the Mediterranean Sea producing a warm and wet northward flow at low level [2,4]. Orographic forcing, due to the presence of the Alps and Appennines close to the coast is a further important element among mechanisms that generate intense precipitation over this region. A key role in the development of persistent convective systems is also played by the stationary convergence over the Ligurian Sea between the colder north-westerly (i.e., tramontane) winds flowing from the Po Valley through the lowest mountain passes and the warmer and wetter south-easterly (i.e., sirocco) winds which blow from the Tyrrhenian Sea. Nevertheless, the complexity of the processes involved at different spatial and temporal scales is not yet fully resolved and many uncertainties remain in some parameterizations used in models.
In order to advance the understanding of the mechanisms determining precipitation phenomena over the Ligurian basin, several comparisons and sensitivity studies have recently been performed on some of the most significant HPEs in the area [5,6,7,8,9,10,11]. These investigations make use of the dense network of rain gauges and meteorological stations operating over the land and of satellite data and radar observations. Over the Mediterranean Sea, an operational network of offshore fixed observational stations is lacking, and remote sensing is the principal source of data, especially for measuring the sea surface temperature and the near-surface wind. Khodayar et al. [12] tested the adequacy of the existing Western Mediterranean observing system for improving knowledge of the processes causing high convective precipitation. They concluded that the lack of data at sea introduces relevant uncertainties so that remote sensing data are necessary.
However, many satellite products are not always available near the coast and under an overcast sky, a typical condition when extreme precipitation occurs [13]. In addition, remote sensing data are limited to the marine surface whereas it is necessary to extend the investigation into the deep layers since the heat content of the upper ocean strongly contributes to the intensification and translation speed of cyclones, at least in tropical latitudes [14]. The upper ocean heat content can be estimated through in-situ observations provided with mobile or fixed platforms (e.g., drifters, buoys, gliders, moorings). Among them, only eulerian observatories can collect data from the lower atmosphere down to the upper layers of the ocean despite their spatial coverage that, in some cases, could lead to results that cannot be generalized, especially in the studies of local phenomenon such as rainfall.
This paper provides an analysis of a five-year-long time series (between 2009 and 2013) of in-situ precipitation and near surface atmospheric and marine data collected on board the W1M3A platform moored in the middle of the Ligurian Sea [15]. The completeness and continuity of the data set give the opportunity to analyse the rain regime of the Ligurian basin and to highlight some interesting aspects. The paper is organized as follows: Section 2 describes the dataset and provides an overview of the main weather conditions during the period 2009–2013, Section 3 presents the analysis of the time series and a focus on some selected intense events. Discussion and conclusions are given in Section 4.
2. Materials and Methods
2.1. Dataset
The time series analysed in this study includes hourly meteorological and oceanographic offshore observations acquired in the Ligurian Sea over the period 19 March 2009–31 December 2013 for a total of 1749 days.
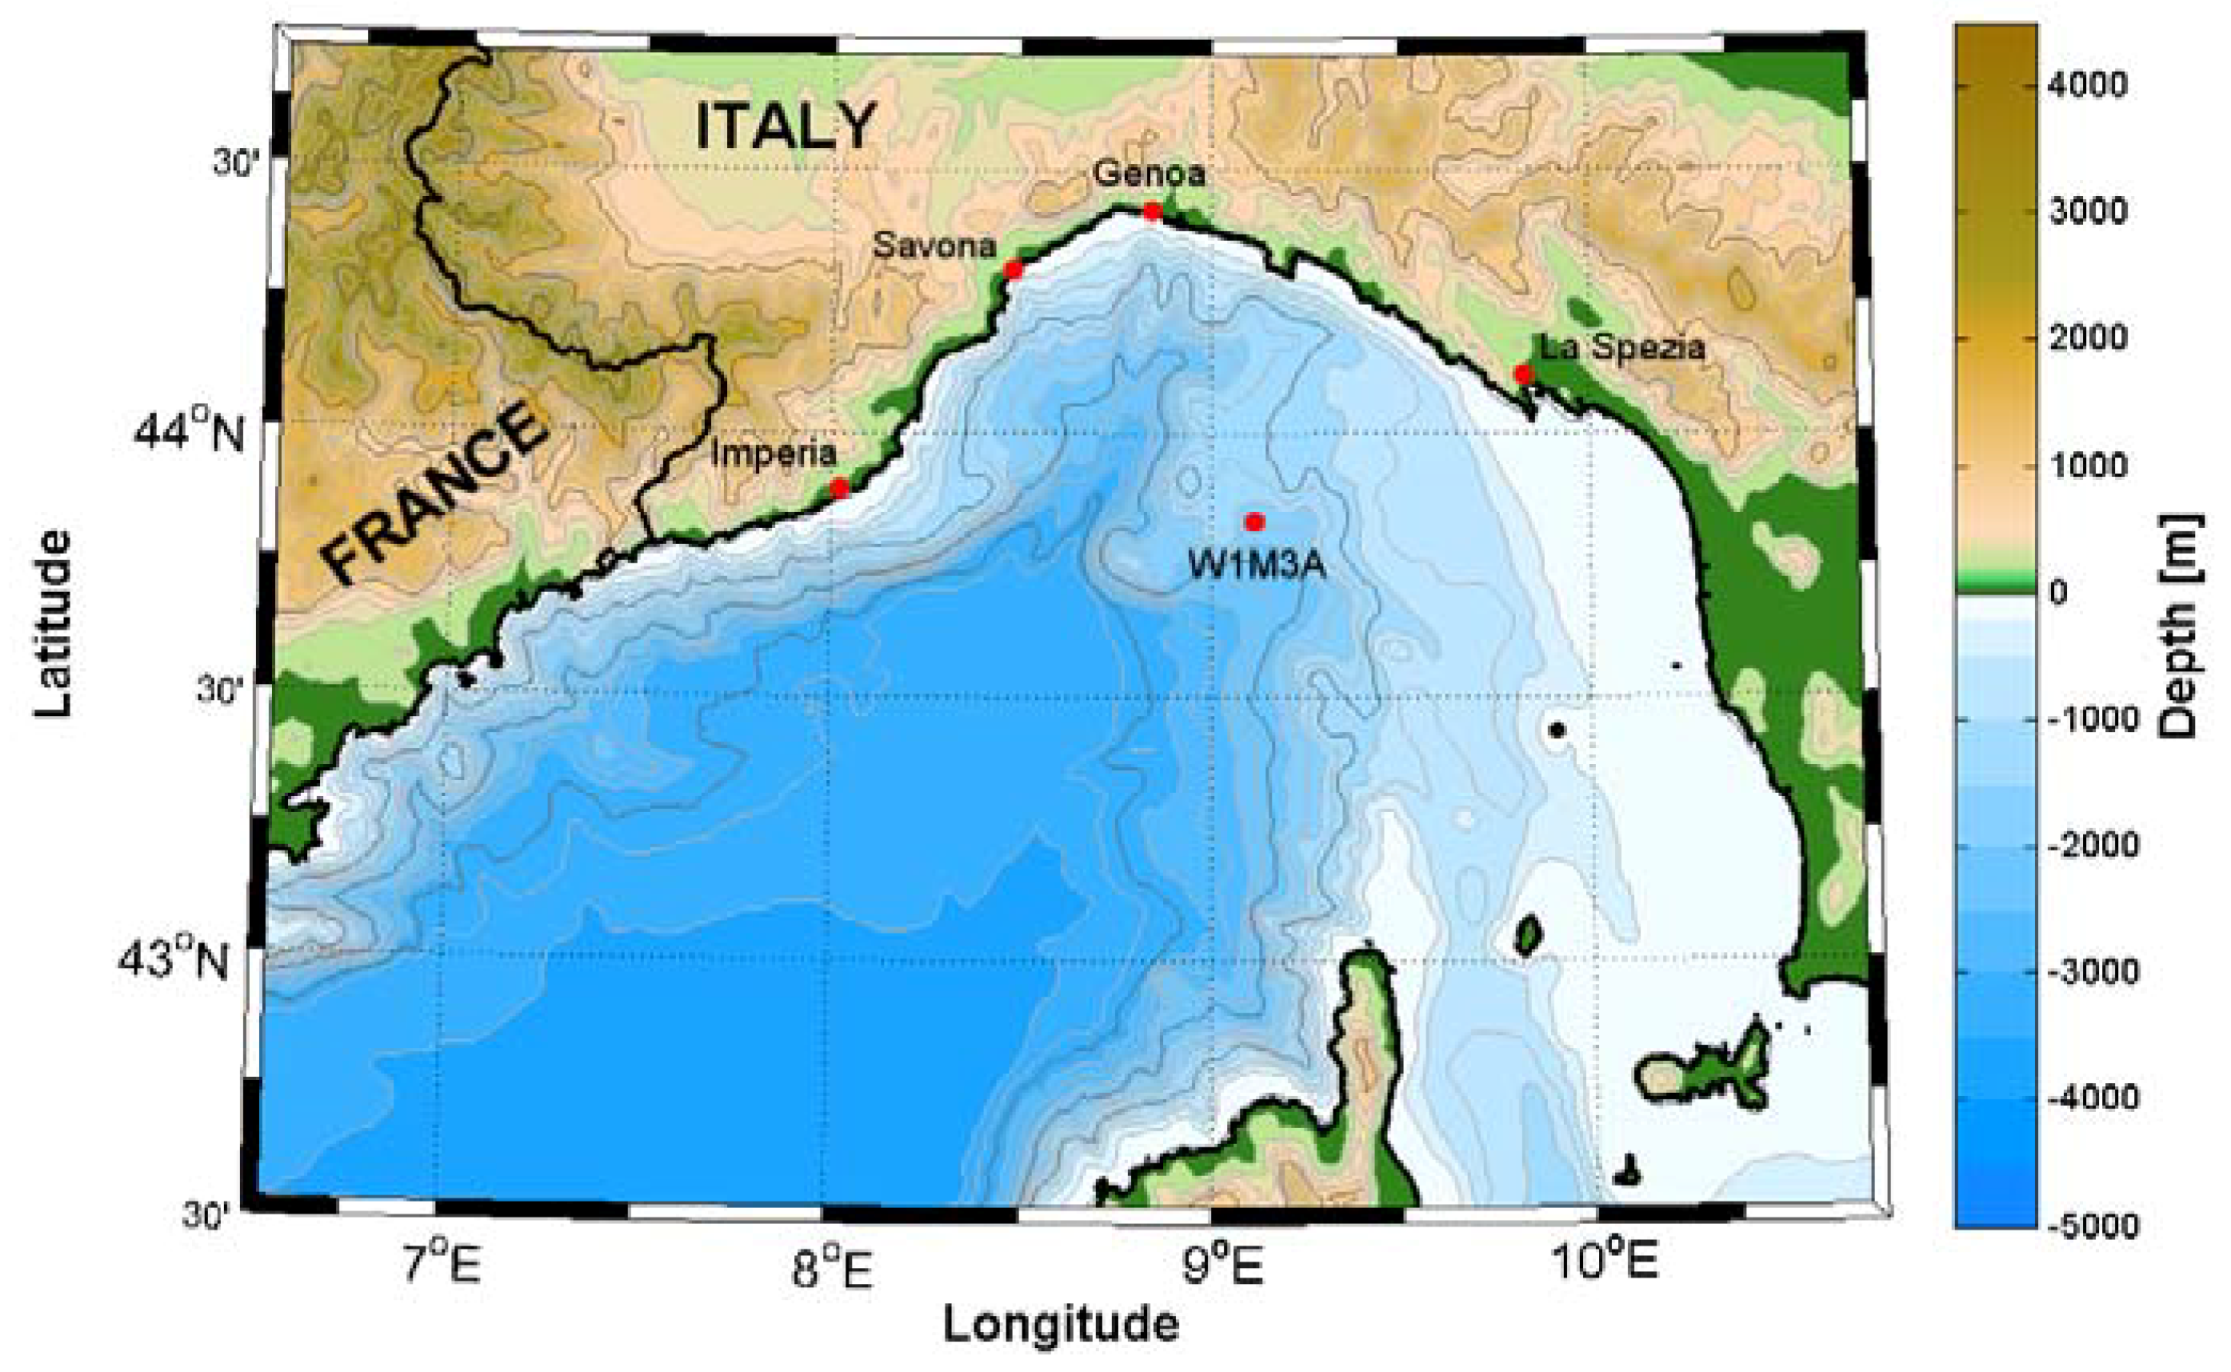
The measurements were carried out onboard the W1M3A observatory, moored at the centre of the Ligurian basin (Figure 1), on a deep sea bed of 1200 m and 80 km far from the coast. It is comprised of a spar buoy specifically developed for air-sea interaction studies and a close-by subsurface mooring [16]. The position of the observatory, without any shield for winds and waves, is very suitable for detecting early signs of incoming low-pressure systems over the region.
The W1M3A platform is part of the Italian [17] and European [18] networks of fixed open ocean observatories. It is also one of the three monitoring systems of the Mediterranean Sea forming the Mediterranean Moored Multi-sensor Array network [19] devoted to fulfill the requirements of operational oceanography in terms of acquisition and distribution of essential ocean climate variables [20] in near real-time.
The observatory is equipped with meteorological instruments compliant with the World Meteorological Organisation standards and provides measurements of the main surface parameters: atmospheric pressure, wind speed and direction, air temperature, relative humidity, total shortwave and infrared radiation and precipitation. In order to monitor the physical properties of the water column, oceanographic probes are fixed along the buoy body and on the subsurface mooring. Heat flux at the air-sea interface is computed using the in-situ observations from the WM13A and bulk formulae [21,22,23].
The weather transmitter VAISALA WXT520 equipped with RAINCAP sensor technology acquires the precipitation measurements used in this study. The instrument is an acoustic sensor and measures the impact of individual raindrops to determine the cumulative amount with an accuracy of about 5% and a resolution of 0.01 mmh−1 [24]. The sensor is also capable of distinguishing hailstones from raindrops and it was designed to be immune to flooding clogging, wetting and evaporation losses during rain measurements. This type of instrument was successfully employed to obtain reliable rainfall observations on both land and at sea [25,26,27,28]. The instrument is mounted on the central mast of the buoy about 12 m above the mean sea level. The hourly cumulative here used was obtained by integrating the measurements acquired every 5 s, after consistency control was performed. In the analysed time series, only a few very short gaps for some hours occurred, concomitant with periodical routine maintenance activities onboard the observatory. However, since good weather conditions are necessary to carry out these operations, no rain data were lost from the time series.
Standardized quality control and quality assurance procedures were applied to near-real-time and delayed mode data following the directive established by the worldwide system of long-term and deep water reference stations OceanSITES as described in Coppola et al. [29].
Hourly precipitation data on land, available through the archive of the Regional Environmental Protection Agency of Liguria (https://www.arpal.gov.it), were used: four stations were selected for the completeness of the time series, their location on the coast and their height above sea level. These stations are: Imperia-Osservatorio Meteosismico, Savona-Istituto Nautico, Genova-Centro Funzionale and La Spezia-SPEZIA (Figure 1). They are located at a height above sea level of 74 m, 24 m, 30 m and 35 m and their distance from the W1M3A observatory is 71 km, 79 km, 92 km and 64 km, respectively. In all these stations, the precipitation measurements are carried out by using an electronic tipping rain gauge with an accuracy of about 2% and a resolution of 0.2 mmh−1. Climate normal (CLINO 1961–1990) data on the Liguria region are considered in order to analyze the variability of the precipitation on land.
2.2. Precipitation over the Liguria Region during the Period 2009–2013
The Liguria region, with its characteristic arched shape open to the south and the mountain ridge behind it, presents a rather complex rain regime. It is in the transitional zone between the typical Mediterranean pluviometric regime, with an accentuated winter peak, characteristic of the peninsular and insular regions of Italy, and the sub-continental and continental one, with the maximum in summer, characteristic of the Prealps and the Alpine arc. The amount of precipitation increases proceeding from the coast towards the inland of the region and from west to east. In fact, along the Western part (from Imperia to Genoa), the annual cumulative amount may be less than 800 mm, whereas in the Eastern part (from Genoa to La Spezia), the annual cumulative amount can exceed 1000 mm. Events of exceptional intensity are frequent from the inland of Genoa to the extreme Levante [30]. These are mainly due to convective systems that develop over the sea and affect the coastal areas, especially in autumn.
The selected period shows a high annual and seasonal variability, with long periods of drought and frequent intense events and thus offers a wide and varied case series.
The beginning of 2009 is characterized by an intense low pressure activity with diffuse precipitations and sometimes snowfalls even on the coast. Starting from May, there are no significant rain events in the region over a long period. From mid-September the weather worsens, causing strong instability with some episodes of intense rain and thunderstorms. Two HPEs take place in October, from 9 to 10 and from 20 to 21, affecting the central and eastern Liguria with acumulation greater than 60 mm and peaks over 120 mmh−1, recorded on 9 in Fiorino, in the inland of Genoa at 290 above sea level (asl).
The very perturbed weather conditions protract until mid-March 2010 with frequent continental cold air intrusions often causing snowfall at low altitudes. After a relatively wet spring, typically summer conditions are established. However, from mid-August, several Atlantic low-pressure systems enter the Mediterranean basin causing a long period of precipitation, snowfalls and thunderstorms. A first short yet very intense event occurs on 13 August when the development of MCS affects Genoa and the Eastern Liguria with rain peaks greater than 70 mmh−1 in Portovenere, near La Spezia (40 asl).
A further V-shape MCS occurs on 7 and 8 September in the same areas with hourly accumulation greater than 200 mm. The most dramatic event happens on 4 October, when an MCS hits the coast between Genoa and Savona with more than 400 mm of rain in less than 6 h.
The rain is very frequent until the first half of January 2011, when a milder period begins and lasts until mid spring. Summer starts under very perturbed conditions, characterized by frequent thunderstorms, sometimes very intense, between June and July. Particularly, from 8 to 9 June, intense rain affects Eastern Liguria with hourly accumulation of about 100 mm. From the end of July, typical summer conditions occur, with temperatures above average and a rain deficit. High temperatures continue until the early winter months, whereas intense and very localized rainy events already occur by the end of October. In less than ten days, on 25 October and on 5 November, two flash floods hit close to La Spezia and Genoa, due to a V-shape MCS developed over the sea near the coast with accumulation of more than 400 mm.
With the exception of February, when polar air strongly lowers the temperature and causes snow, the winter and the summer of 2012 are characterized by mild weather. Some thunderstorms occur only in June. The autumn is exceptionally rainy, particularly in November. The most important event takes place on 10 and 11 November with more than 200 mm of rain in Eastern Liguria and a flood in Tuscany.
During 2013, wintry phenomena, such as snow and frost, last until mid-spring, whereas summer is hot and stable. Spring and autumn are characterized by an exceptional sequence of very heavy rainfall episodes and strong and localized thunderstorms. A dramatic flood hits eastern Sardinia on 18 November due to the development of a Mediterranean cyclone. During 2013, the occurrence of southern gales increases and becomes comparable with the northern ones, which, on the contrary, are usually prevailing.
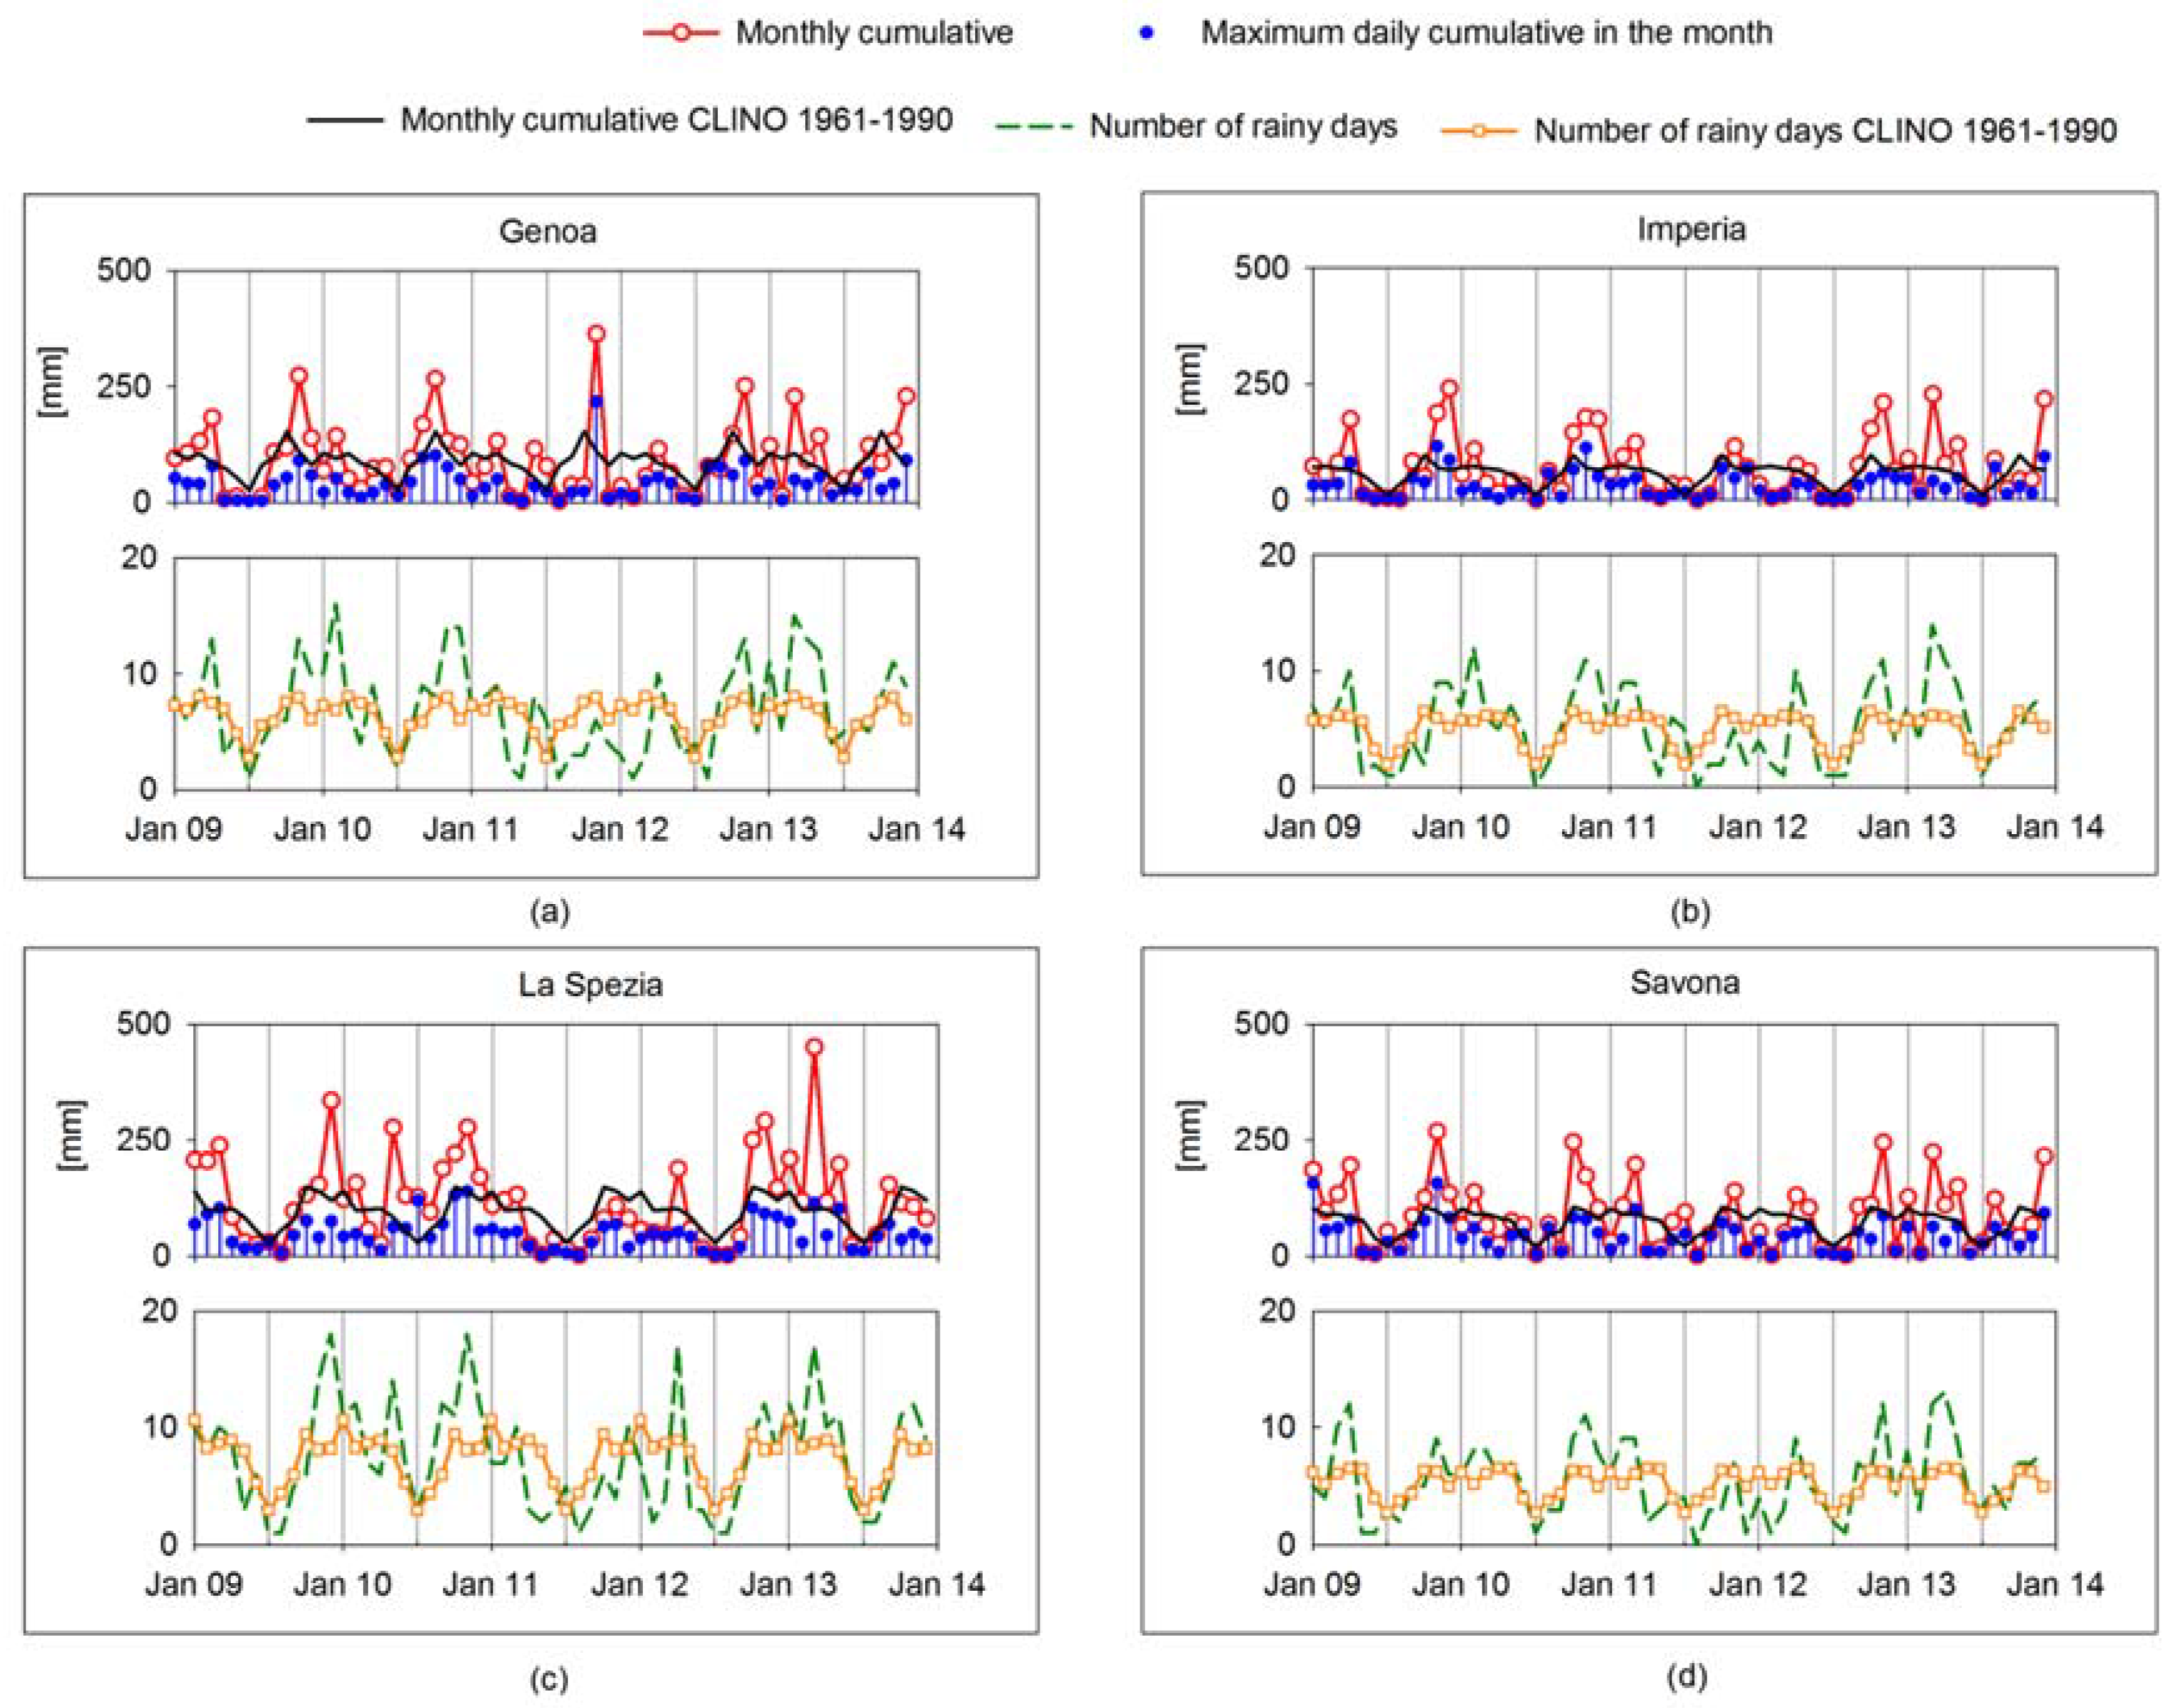
The data of the four selected coastal stations well indicate the precipitation variability of the examined period (Figure 2). Compared to the climatologic values of the CLINO 1961–1990 archive, the accumulation in the summer months is generally lower, whereas that in the winter months is often significantly greater. In some cases, this is due to a single episode of high intensity, as happens in November 2011 in Genoa, whereas in others, to an increase in the number of rainy days.
3. Results
3.1. Precipitation Variability
The data of the observatory for the first three months of 2009 is missing; over the years 2009–2013, precipitation events at sea occur for 686 days, representing 39% of the total number of analyzed days. The values of the annual cumulative measured at sea are in agreement with the measurements obtained in the four selected coastal sites, particularly with those observed in Genoa. The year with the greatest amount of precipitation is 2013 with a cumulative amount of 1386.2 mm, whereas the lowest values are recorded in 2011 and 2012, i.e., 886.9 mm and 857.1 mm, respectively.
The analysis of the monthly distributions shows that 2010 is the year with the greatest number of rainy days, with a total of 166, whereas the month with the most rain is March 2013, with 21 days. Only in August 2011 no rain occurs. Daily accumulation less than 1 mm is observed for 331 days (48% of total rainy days) whereas only for 19 days it is greater than 50 mm. Among these days, seven events exceed the threshold of 100 mmday−1 and for two of them, the cumulative is greater than 200 mmday−1, both in November. The hourly distribution of rainy data shows that the precipitation mainly occurs in the central hours, 11–12 UTC, whereas the average hourly cumulative has a maximum in the early morning and the greatest intensity is recorded before sunrise and after sunset.
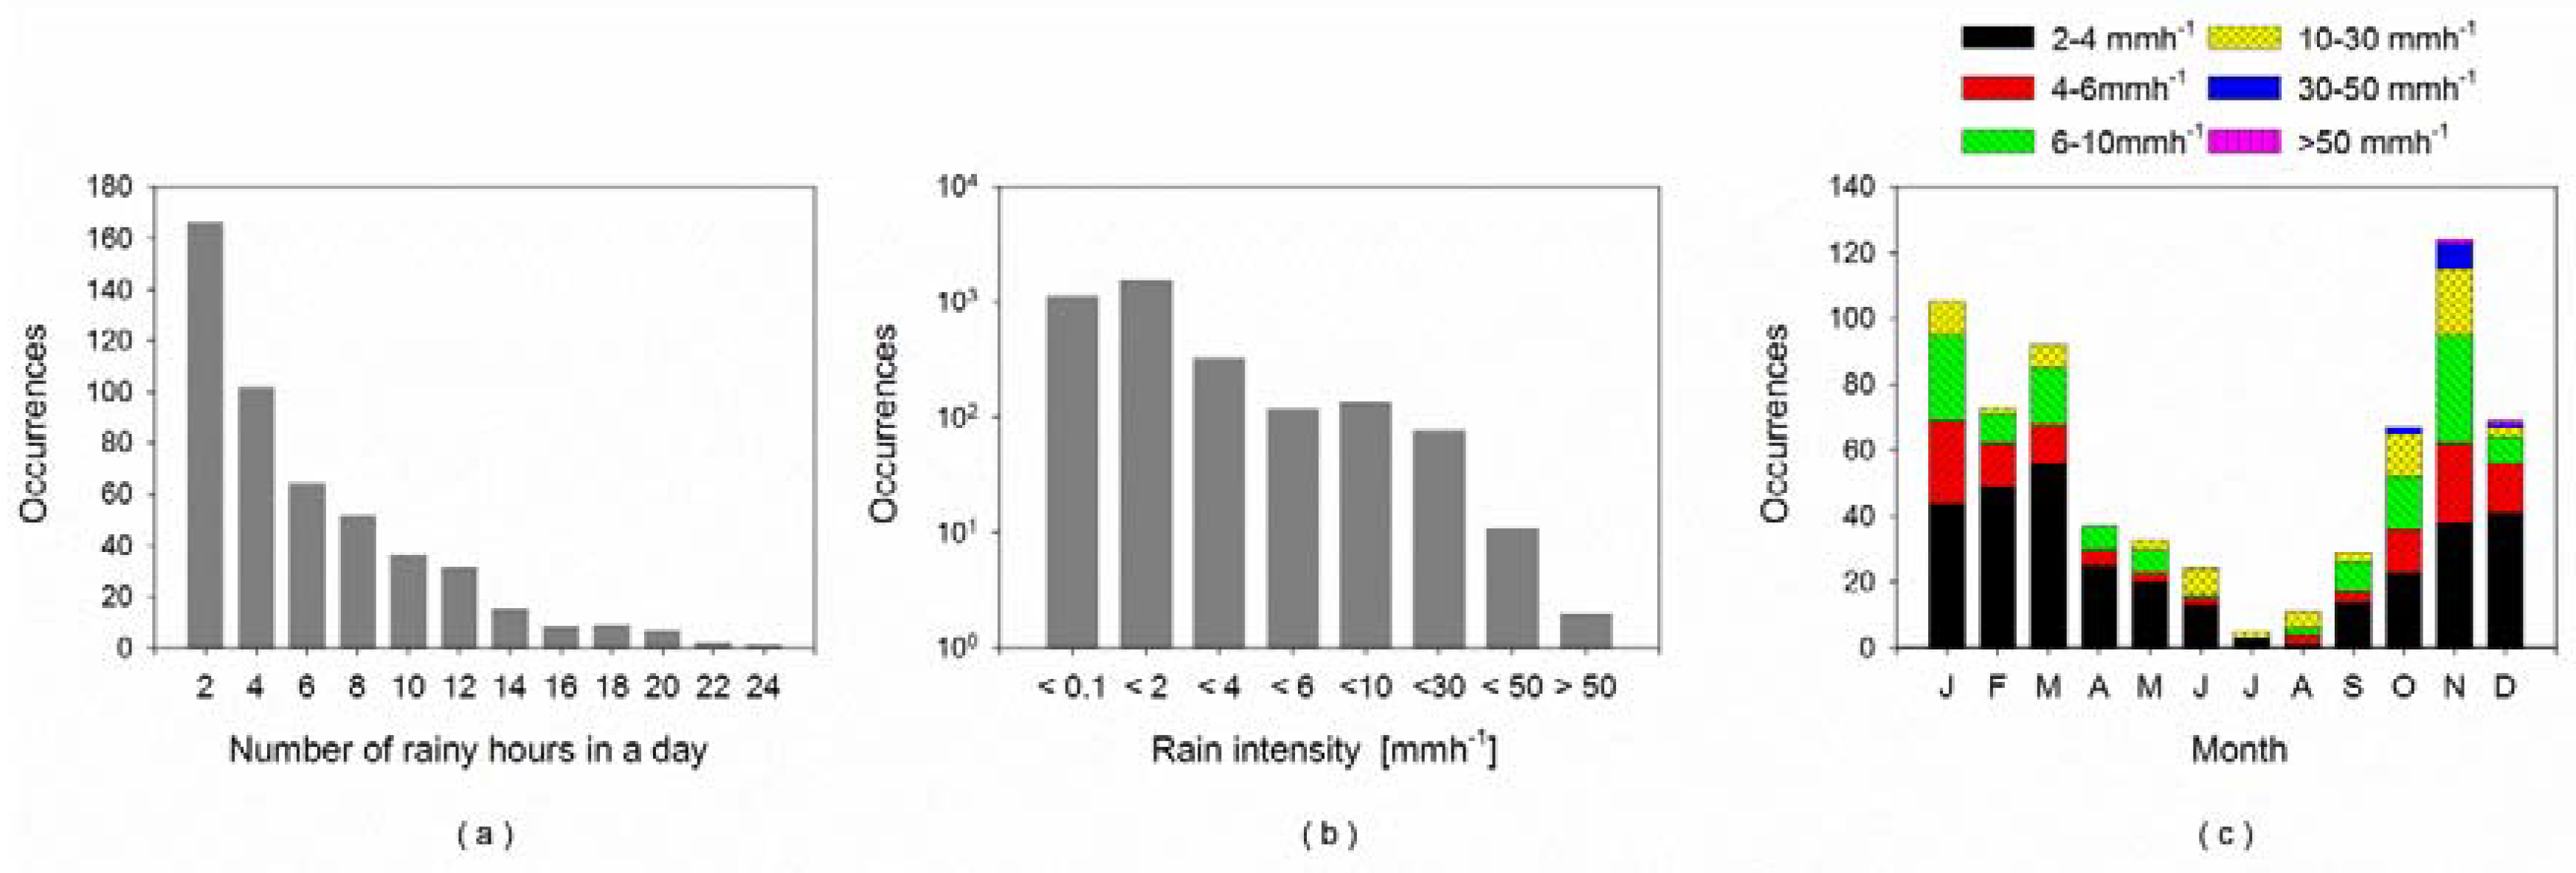
Precipitation can take place for several consecutive days, even if not in a continuous manner. In most cases (48%), the consecutive days are two and the rainy period extends beyond the week only twice, from 24 September to 4 October 2012 and from 4 to 13 March 2013. On the contrary, the maximum number of consecutive days without rain is 46, from 16 July to 29 August 2009. Another long dry period is from 29 July to 2 September 2011 (38 days). In almost half of the cases (43%), the rainy hours in a single day are less than 3 and do not exceed 5 h for 67% of the time, whereas the days with more than 12 h of rain are 56 (8% of total rainy days) (Figure 3a). Only on 24 April 2010 does the precipitation phenomenon last throughout the course of the 24 h. However, the number of rainy hours per day does not affect the daily cumulative since the total precipitation is less than 16.5 mmday−1. Almost half of the 3371 hourly rain data (equal to 44.5% of total rainy days) concern events with an intensity lower than 2 mmh−1 (Figure 3b). Rain intensity greater than 10 mmh−1 occurs in 224 cases: among these, in 13 cases it exceeds 30 mmh−1 and in only two events rainfall is greater than 50 mmh−1 (on 18 November 2013 at 04 UTC and on 23 December 2010 at 02 UTC). Taking into account only precipitation at sea greater than 2 mmh−1, the monthly distribution of the hourly rain intensity data shows that phenomena of extreme and convective rain are more frequent between October and December (Figure 3c).
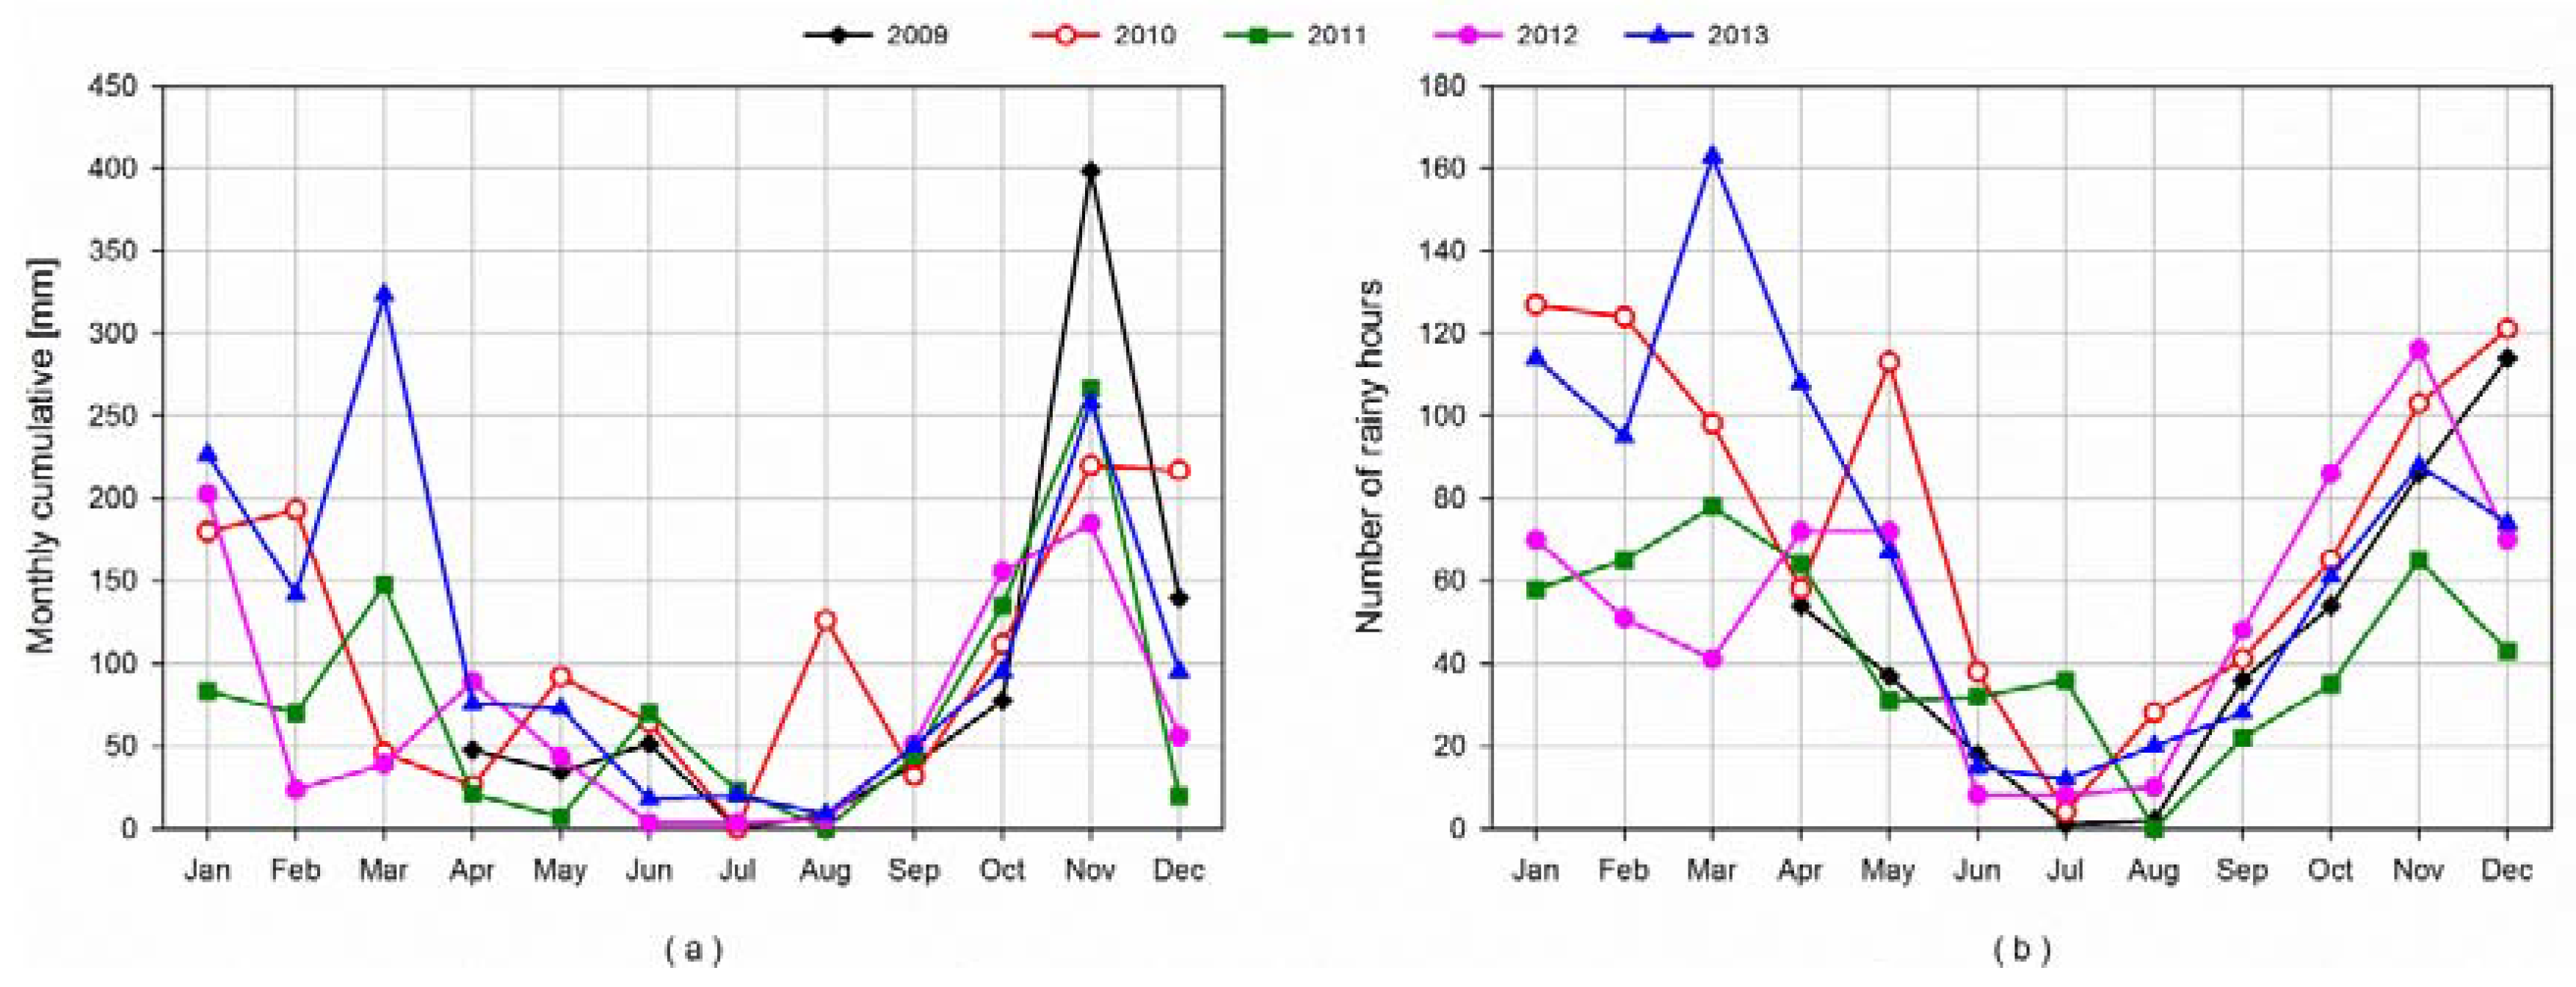
Among these high precipitation events, the phenomena occurring in the month of November strongly contribute to the large cumulative measured in autumn. Indeed, 267 mm out of the 398 mm in November 2009 are measured in less than 24 h, as well as the cumulative amount of 258 mm in November 2013, which is mainly due to the 214 mm of precipitation that occurs on 18, and 5 November 2011, with 162 mmday−1 contributing to the 267 mm monthly cumulative. Intense precipitation is less frequent in the other months of the year when the cumulative amount is the result of less intense but more frequent and persistent episodes (Figure 4).
3.2. High Precipitation Events
In the analyzed period, all thirteen episodes with hourly precipitation exceeding 30 mmh−1 occur in autumn, mainly during the night (Table 1). Some of them are short-lived phenomena whereas others are more persistent but all are due to mesoscale convective systems.
Although these events show the greatest precipitation data recorded onboard the W1M3A platform, their cumulative is lower than that measured on land, where it is quite common to find hourly values above 50 mmh−1 and daily cumulative over 400 mm.
Some of the events listed in Table 1 are concomitant with important flooding on land, even if not all hit the Ligurian region. Particularly, on 8 November 2009 and 5 October 2013, intense precipitation occurs in the northwestern coast of Tuscany whereas on 18 November 2013, a dramatic flood hits Sardinia. However, there is not always a correlation between intense episodes at sea and on land. For instance, during the flood in western Liguria on October 2010 that caused considerable damage, no significant evidence from the in-situ data is observed: the rain starts in the late afternoon and lasts only few hours with a peak of about 20 mmh−1 at 18 UTC and a cumulative less than 27 mm in 5 h.
In the following, four events concomitant with floods on land are analyzed: they have been widely investigated in several papers [7,10,31,32,33,34], but none of these works include direct rainfall observations at sea. For each selected high precipitation event, a short description of the main meteorological patterns causing the phenomenon and the main marine and atmospheric parameters measured by the W1M3A observatory are given.
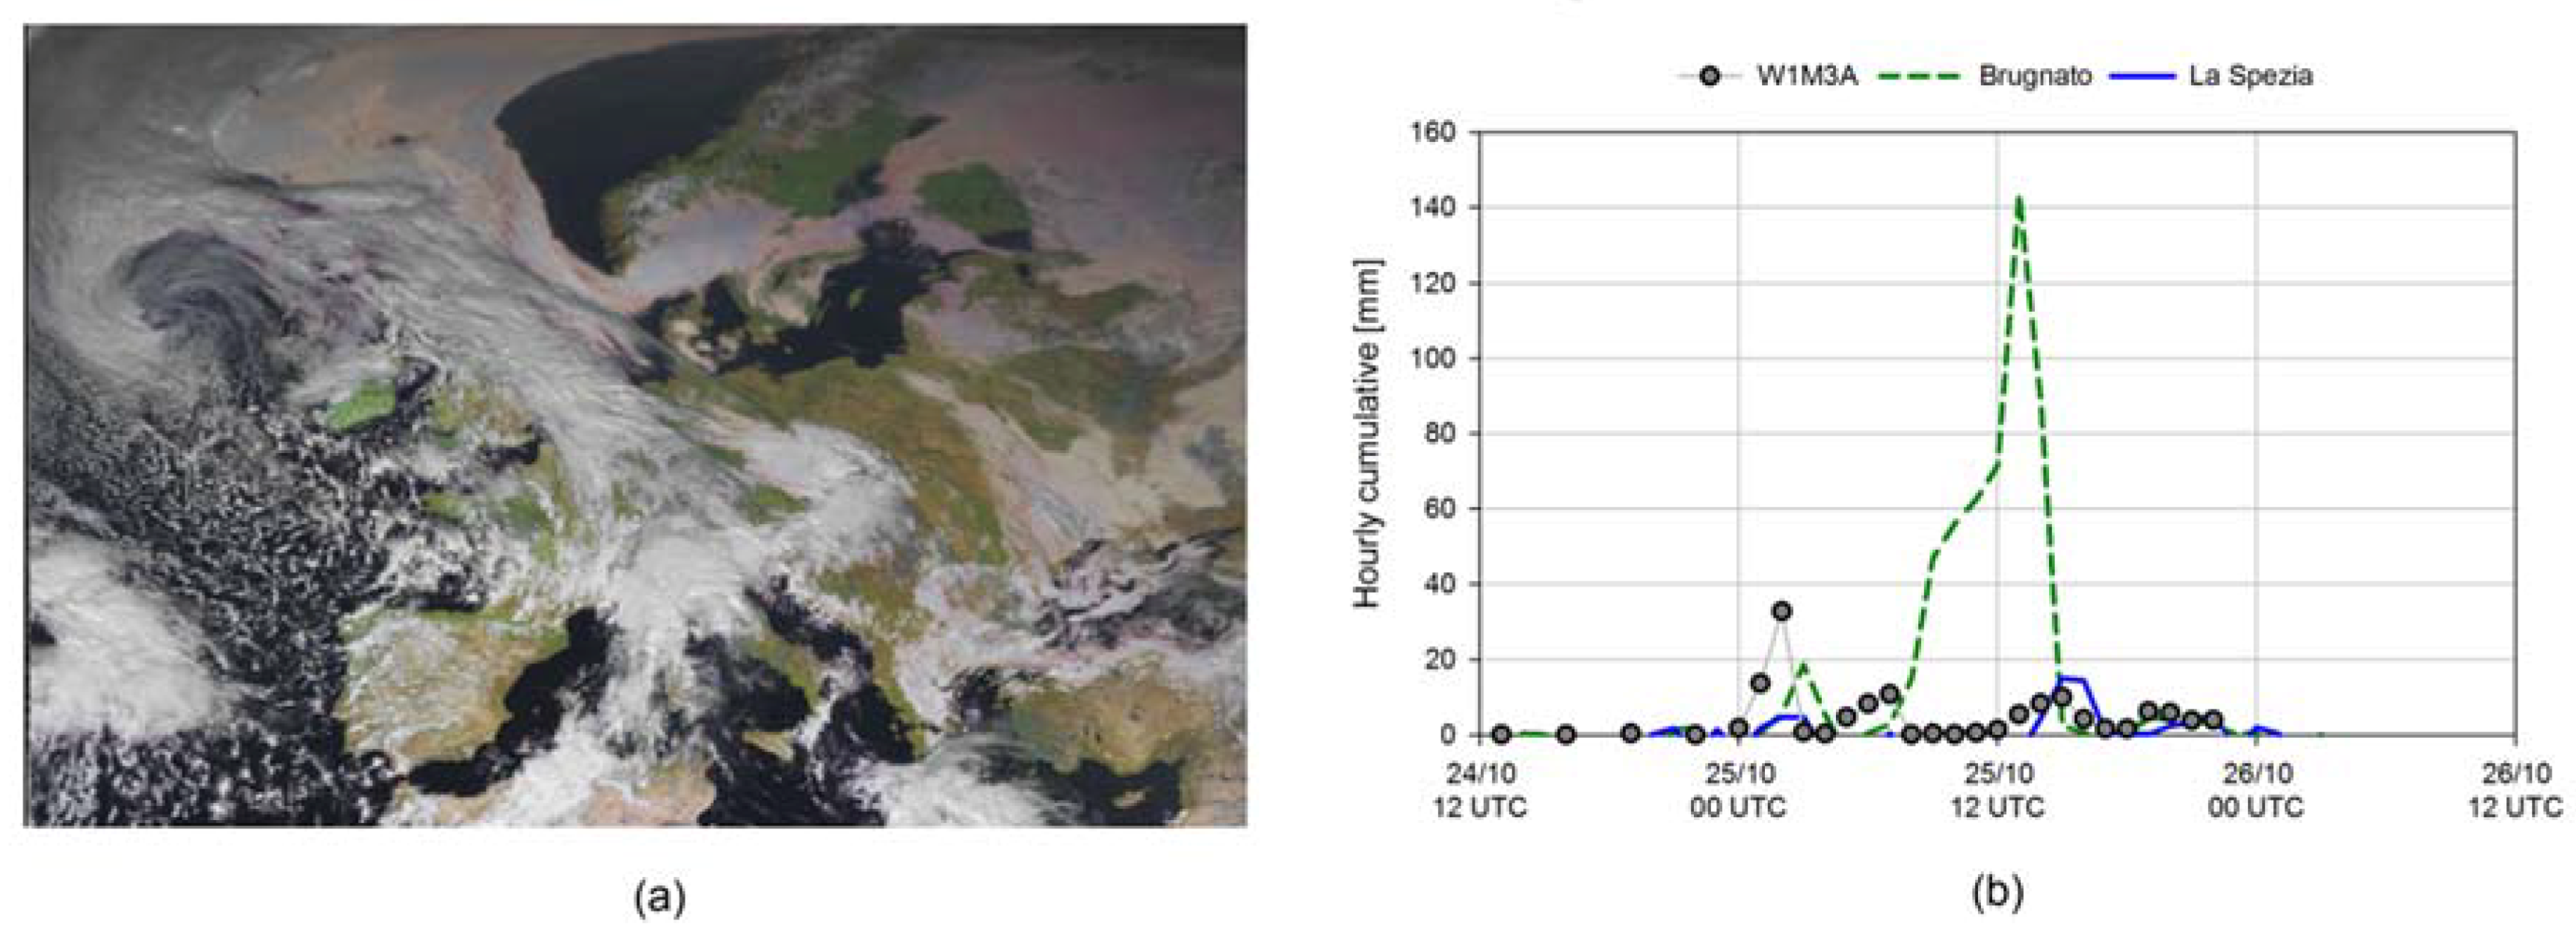
3.2.1. Event on 25 October 2011
A low-pressure system is present over the European Atlantic coasts while a deep trough is over the Mediterranean area and moves East, greatly slowed by the presence of the high pressure on the Balkans. A secondary minimum develops over the Gulf of Lion. The Liguria region is affected by the warm sector of this perturbation where a frontal convergence line, almost stationary, favours the development of an intense and small-sized quasi-stationary V-shaped mesoscale convective system [7,8,9,10] (Figure 5a). The persistence of the precipitation is the crucial factor leading to the daily elevated cumulative experienced both at sea and on land. The quasi-stationary V-shaped convective system hits the small areas of Cinque Terre and Vara Valley near La Spezia causing 13 deaths and extensive damage. On 25 October, in Brugnato, the rain reaches a peak of 143.4 mmh−1 with a daily cumulative of 539 mm, whereas in the nearby La Spezia, the precipitation amount is lower than 40 mmh−1 (Figure 5b).
The system originates over the eastern Ligurian Sea, north-east of the W1M3A observatory, because of the stationary convergence of warmer and wetter south-easterly winds over the Tyrrhenian Sea (i.e., sirocco winds) and colder northerly winds flowing from Po valley (i.e., tramontane winds). Rain starts on 25 October at 00 UTC and reaches a peak of 35 mmh−1 at 02 UTC, persisting throughout the day with lower intensity. The difference between the sea temperature and the air temperature is positive, presumably because of the persistence of northerly flow blowing from northern sectors for three days before the event. The intrusion of warmer water from the Tyrrhenian Sea strongly affects the surface marine stratification. The heat flux towards the atmosphere increases at the passage of the baric minimum, accompanied by strong northwesterly wind, rain and a consequent drop of the air temperature, and then begins to decrease reaching much lower values.
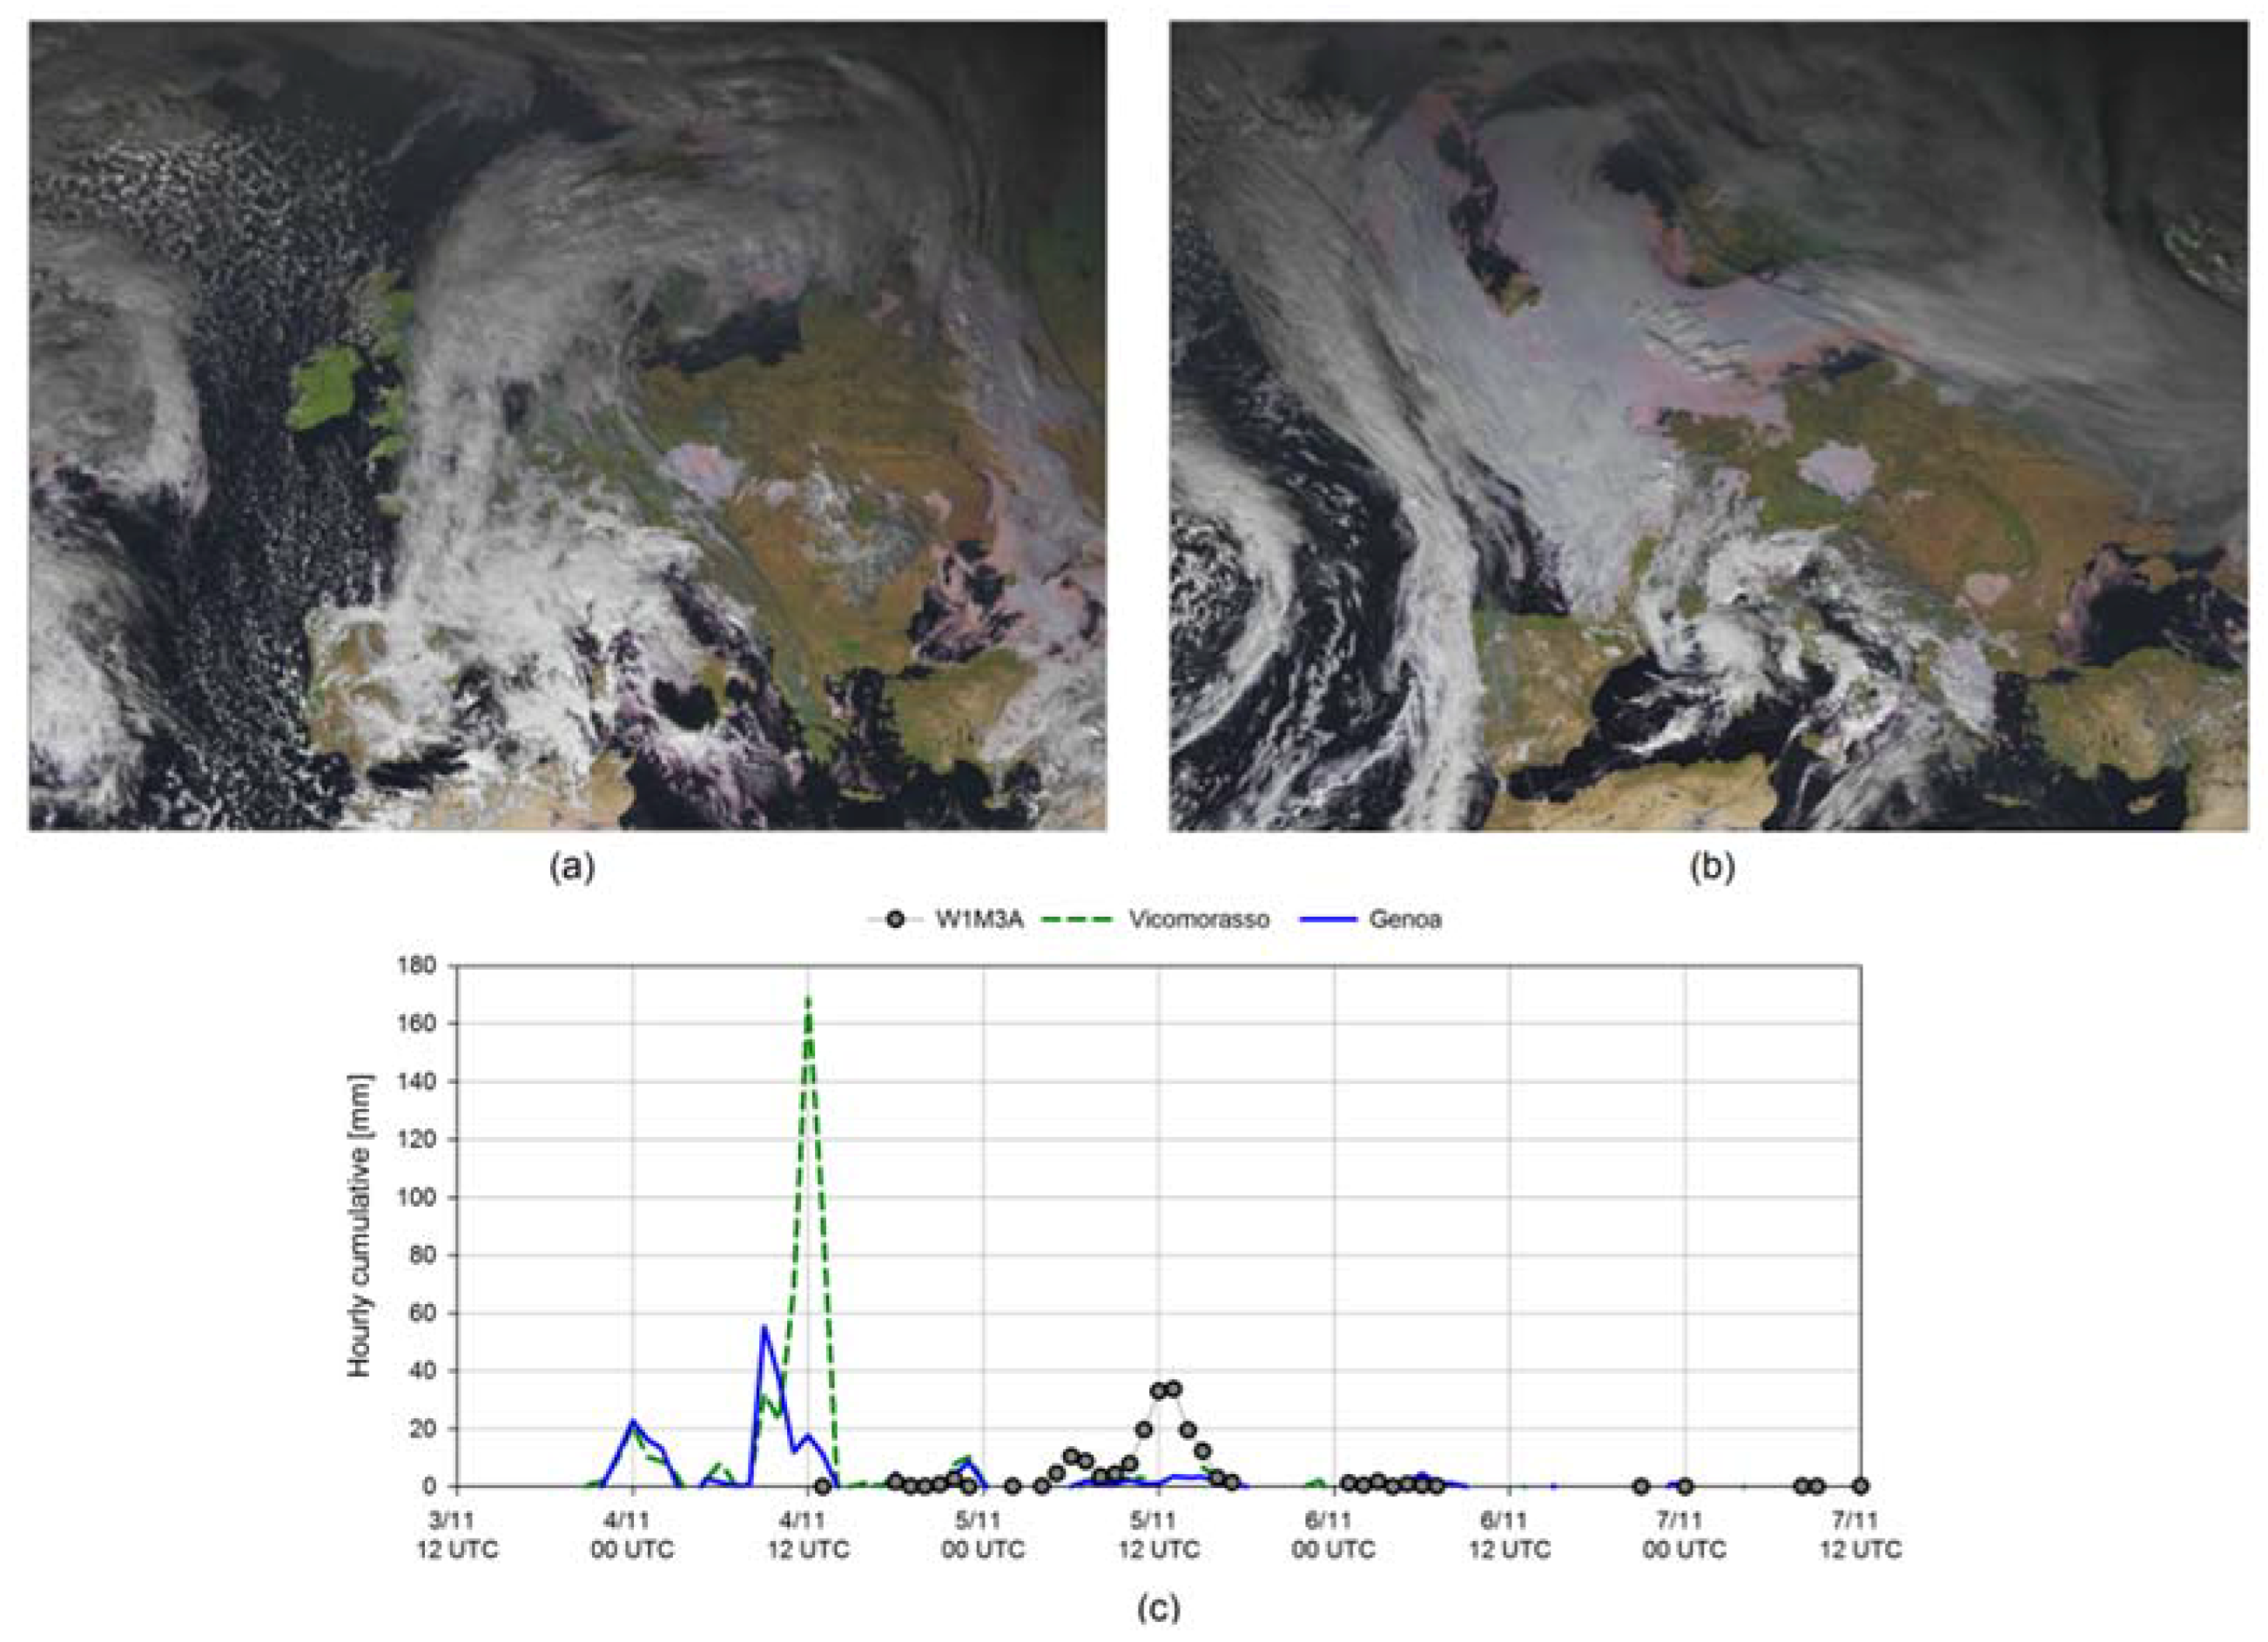
3.2.2. Events on 5 and 8 November 2011
Few days after the dramatic high precipitation event occurred in Cinque Terre, a flash flood hits Genoa causing 6 casualties. The synoptic situations of the two events are very similar: a deep low over Western Europe blocked by a strong high-pressure field over Eastern Europe. This is due to a southern intense flow of wet and warm air over the Tyrrhenian Sea, induced by this cyclonic circulation and a northern low-level flow, induced by baric and thermal gradients between Po Valley and Ligurian Sea, leading to the consequent formation of a prefrontal convergence line over the Ligurian Sea (Figure 6a,b). These conditions, also owing to the particular orography of Liguria, determine the development of quasi-stationary, self-regenerating V-shaped convective systems and intense precipitation on 4 November with a peak of 180 mmh−1 at Vicomorasso, an inland village close to Genoa. The event lasts from 3 to 9 November with very intense rainfall, often associated with storms at sea (Figure 7c).
At the W1M3A site, the rain starts very weakly in the late afternoon of 4 November. The precipitation is more intense on 5 November, with a daily cumulative amount of 162 mm, but without hourly significant peaks, and it mainly originated from a thunderstorm stationary system centred on the Ligurian Sea to the north of Corsica. Apart from weak episodes, the peak rainfall is measured during the night of 8 November, i.e., more than 47 mmh−1. It is worth noting that in this event the V-shape convective system originates over the northern Ligurian Sea, north-west of the observatory, which therefore lies in the sirocco sector.
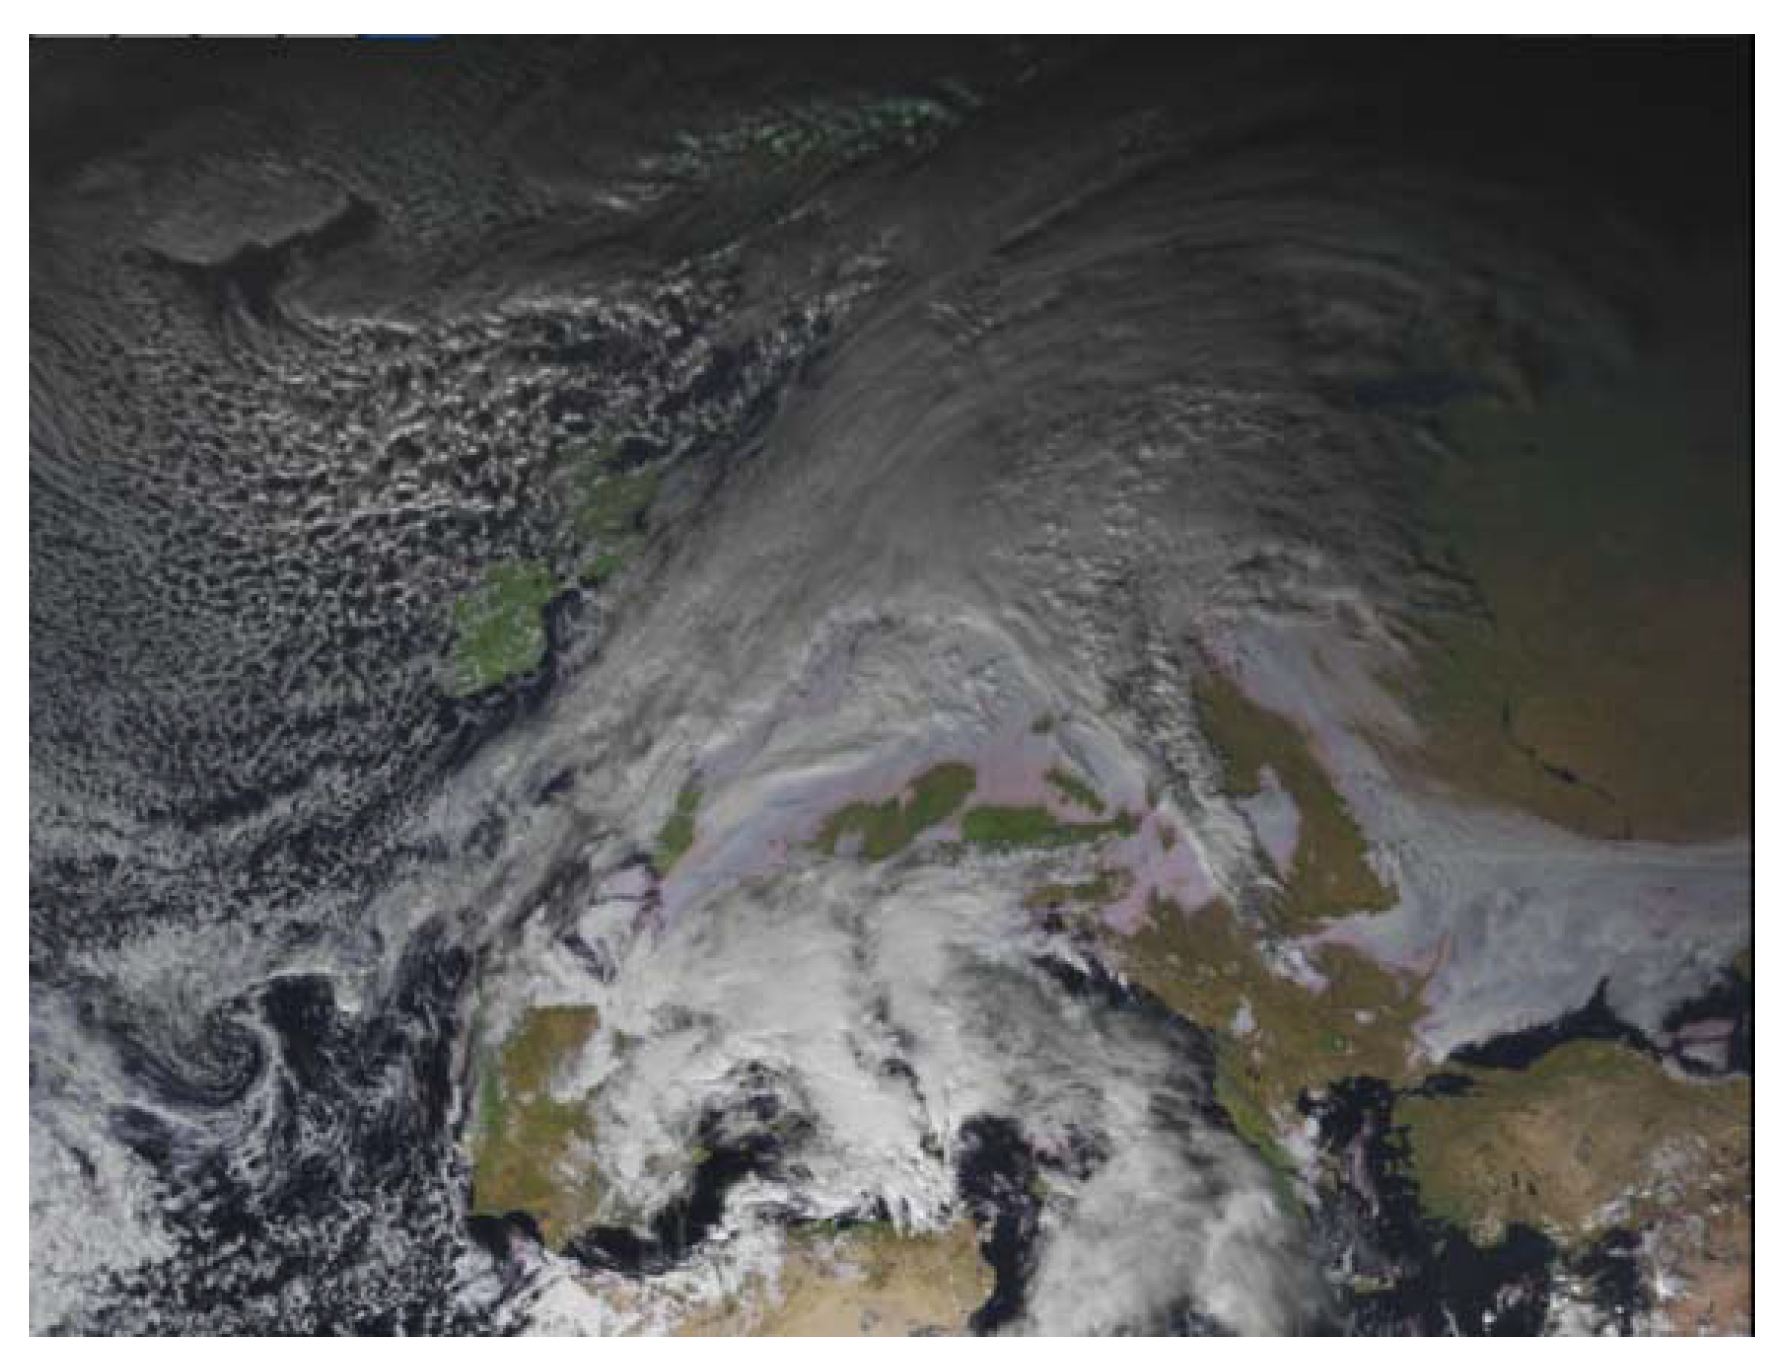
3.2.3. Event on 18 November 2013
This event is concomitant with an extratropical cyclone in the Western Mediterranean Sea. Cold area from North Europe flows over the Mediterranean basin and interacts with the warm moist air. The cyclone moves slowly towards southeast, developing violent storm systems (Figure 7). Particularly, it hits north-eastern Sardinia where several floods occur causing 18 causalities and serious damage and it only marginally affects the coast of Liguria
The rain records of the Ligurian land stations show weak diffuse precipitation over the whole region slowly moving westward with a maximum cumulative of 40 mm in twelve hours at Portofino, between Genoa and La Spezia.
On the contrary, in the early hours of 18 November, the sensors onboard the W1M3A observatory record intense rain for a few hours simultaneous with the increase and turning to the north-west of the wind, which remains under the threshold of 15 ms−1. This turning could be the signal of the passage of a possible tramontane-sirocco convergence line, triggering strong convection in the area surrounding the observatory. The air temperature fluctuates around the values of the sea surface, with a remarkable drop during rainfall and concurrent tramontane conditions. The heat flow, even if always directed to the atmosphere, is weak due to the reduced thermal gradient between air and sea, the low wind and the increase in water vapour in the atmosphere.
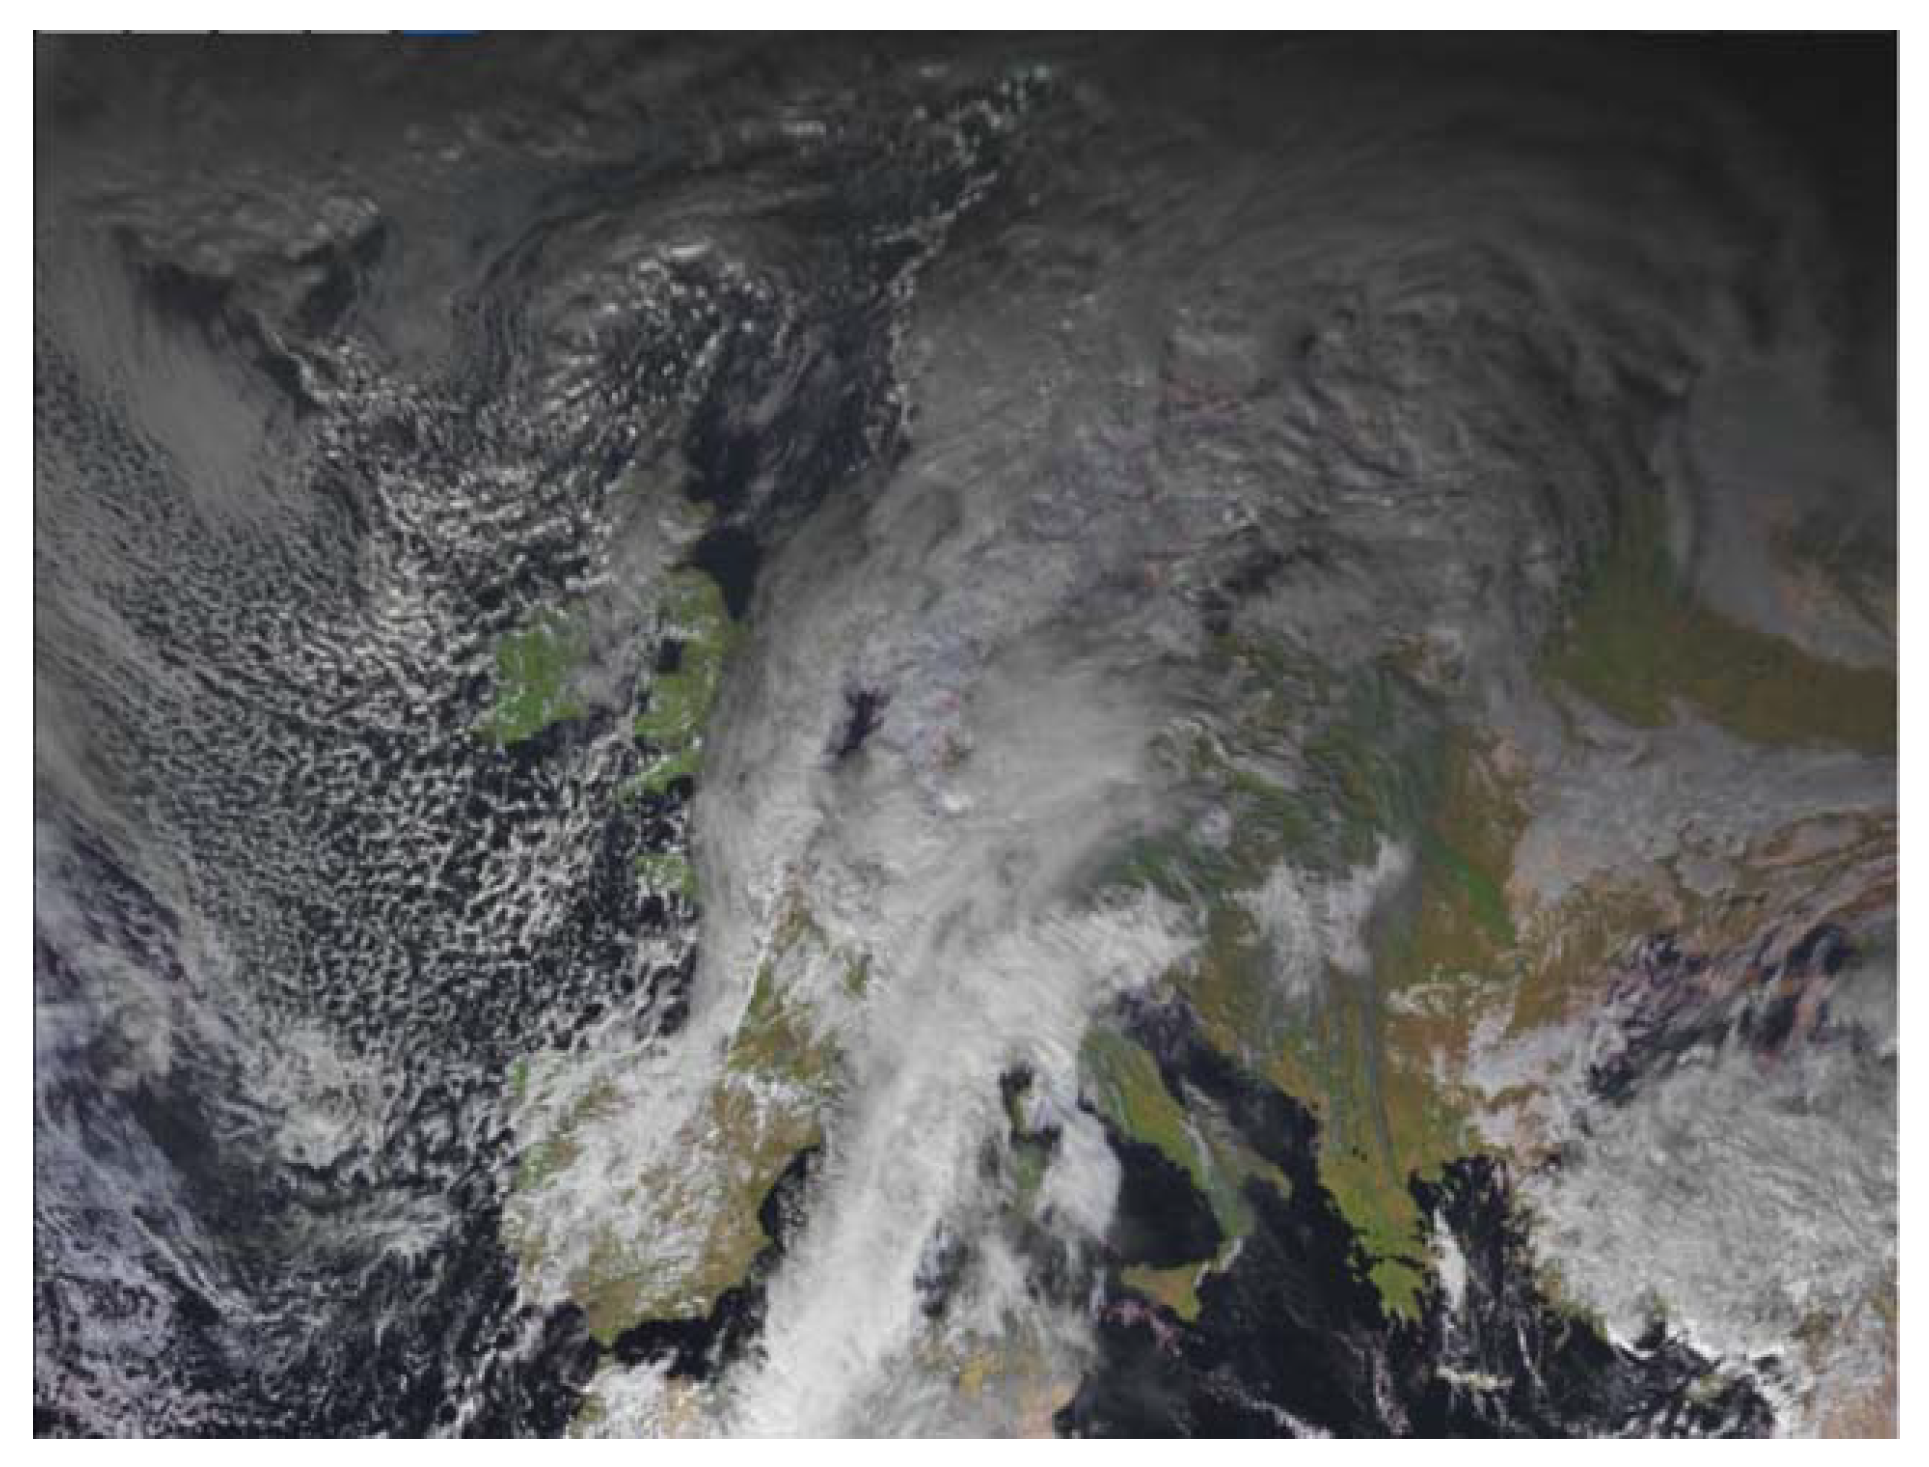
3.2.4. Event on 10 November 2012
In contrast to the other analysed cases, on 10 November 2012, the precipitation at sea is absent while floods occur on land. A wide trough over the Iberian Peninsula gives rise to a secondary minimum in the Gulf of Lion, leading to a strong flow of warm and wet air along the Tyrrhenian coasts. During the night of 10 November, a clear line of convergence between the sirocco winds close to the coast and those from the northwest blowing on the Ligurian Sea activate intense self-regenerating thunderstorm systems that hit Magra valley, particularly on the Tuscan side (Figure 8).
While on land the event is of exceptional intensity and causes considerable damage, nothing of significance appears at sea: the rain starts in the late afternoon and lasts a few hours with a peak less than 20 mmh−1 at 17 UTC and a cumulative less than 53 mm. The wind and pressure data clearly show the propagation of the low-pressure system that moves eastwards and the development of the convergence line, with the observatory lying in the sector under northwesterly winds. The incoming northwesterly wind produces a sharp drop in temperature and a consequent increase in the heat fluxes towards the atmosphere.
4. Discussion and Conclusions
In-situ measurements of rainfall at open sea are really scarce, thus the multiannual measurements collected by the W1M3A observatory provide valuable information to characterize the precipitation regime over the Ligurian Sea.
Results show that the number of rainy days at sea is greater and the rainfall intensity is lower than on land, although the average annual precipitation at sea is quantitatively similar to that recorded in the coastal stations of Genoa, La Spezia, Savona and Imperia, particularly to the one in Genoa.
Despite the high inter-annual variability, the analysed data confirm that precipitation occurs mainly in the period from October to March and is absent during summer. The wet period may be roughly divided in two parts: precipitation from January to March is usually more persistent but often very weak, whereas the heaviest occurs more frequently in autumn.
Extreme events mainly happen between October and November, and a single event, though short lived, can be enough to drastically increase both monthly and annual cumulative amounts. This distribution is in agreement with the seasonal behaviour of the air-sea heat fluxes at the mid latitudes—and in particular in the Mediterranean Sea—where in autumn the air temperature rapidly drops, favoured by North-Atlantic low systems, and the heat release from the sea surface to the atmosphere increases [4,35]. The time series of heat fluxes and ocean heat content confirm this trend with the maximum flux toward the atmosphere in winter months and the maximum heat content of the sea at the end of summer.
Notwithstanding the similar annual trends of precipitation, heat fluxes and ocean heat content, a clear correlation at any temporal scale is not particularly evident. This is not surprising, since the source of moisture that triggers the convective processes may be also remote [3]. Both variables are key ingredients in the development of heavy precipitation that should be triggered by upper levels and larger scale features (e.g., an incoming tropopause dynamic anomaly, the presence of a jet-streak left exit), and/or by local effects (e.g., the formation of a convergence line at lower levels) [11,14]. Great local values of heat fluxes and water content play a crucial role over land, where orography can represent a trigger, such as during summer heat storms.
The intensity of precipitation is also poorly linked to the lowest baric values recorded at sea. As an example, the lowest pressure value (980.8 hPa) of the entire data set occurs on 9 November 2010 with a daily cumulative less than 10.5 mm. Analogously, on 2 February 2013, the pressure drops to 986.5 hPa but the cumulative is only 3.5 mm (with snow occurring over land). On the other hand, on 23 December 2010 with a pressure minimum of 987 hPa, the rain exceeds 156 mmday−1 with a peak of 50.35 mmh−1. Rainfall peaks may also occur, with mean daily pressure over 1010 hPa. In any case, all extreme events from 2009–2013 occur simultaneously due to a remarkable drop in pressure values in the preceding 24/12 h.
The analysis of the average of hourly rainy data shows that, at sea, the maxima of the cumulative occur in the early morning of the diurnal minimum of pressure, whereas on land they are found in the late afternoon. Yang and Slingo [36] found signals of propagation of the phase of the diurnal cycle of convection, suggesting that this could be due to land-sea breeze circulation. The diurnal cycles alter the flow of energy, momentum and water and are therefore fundamental in climate models [37].
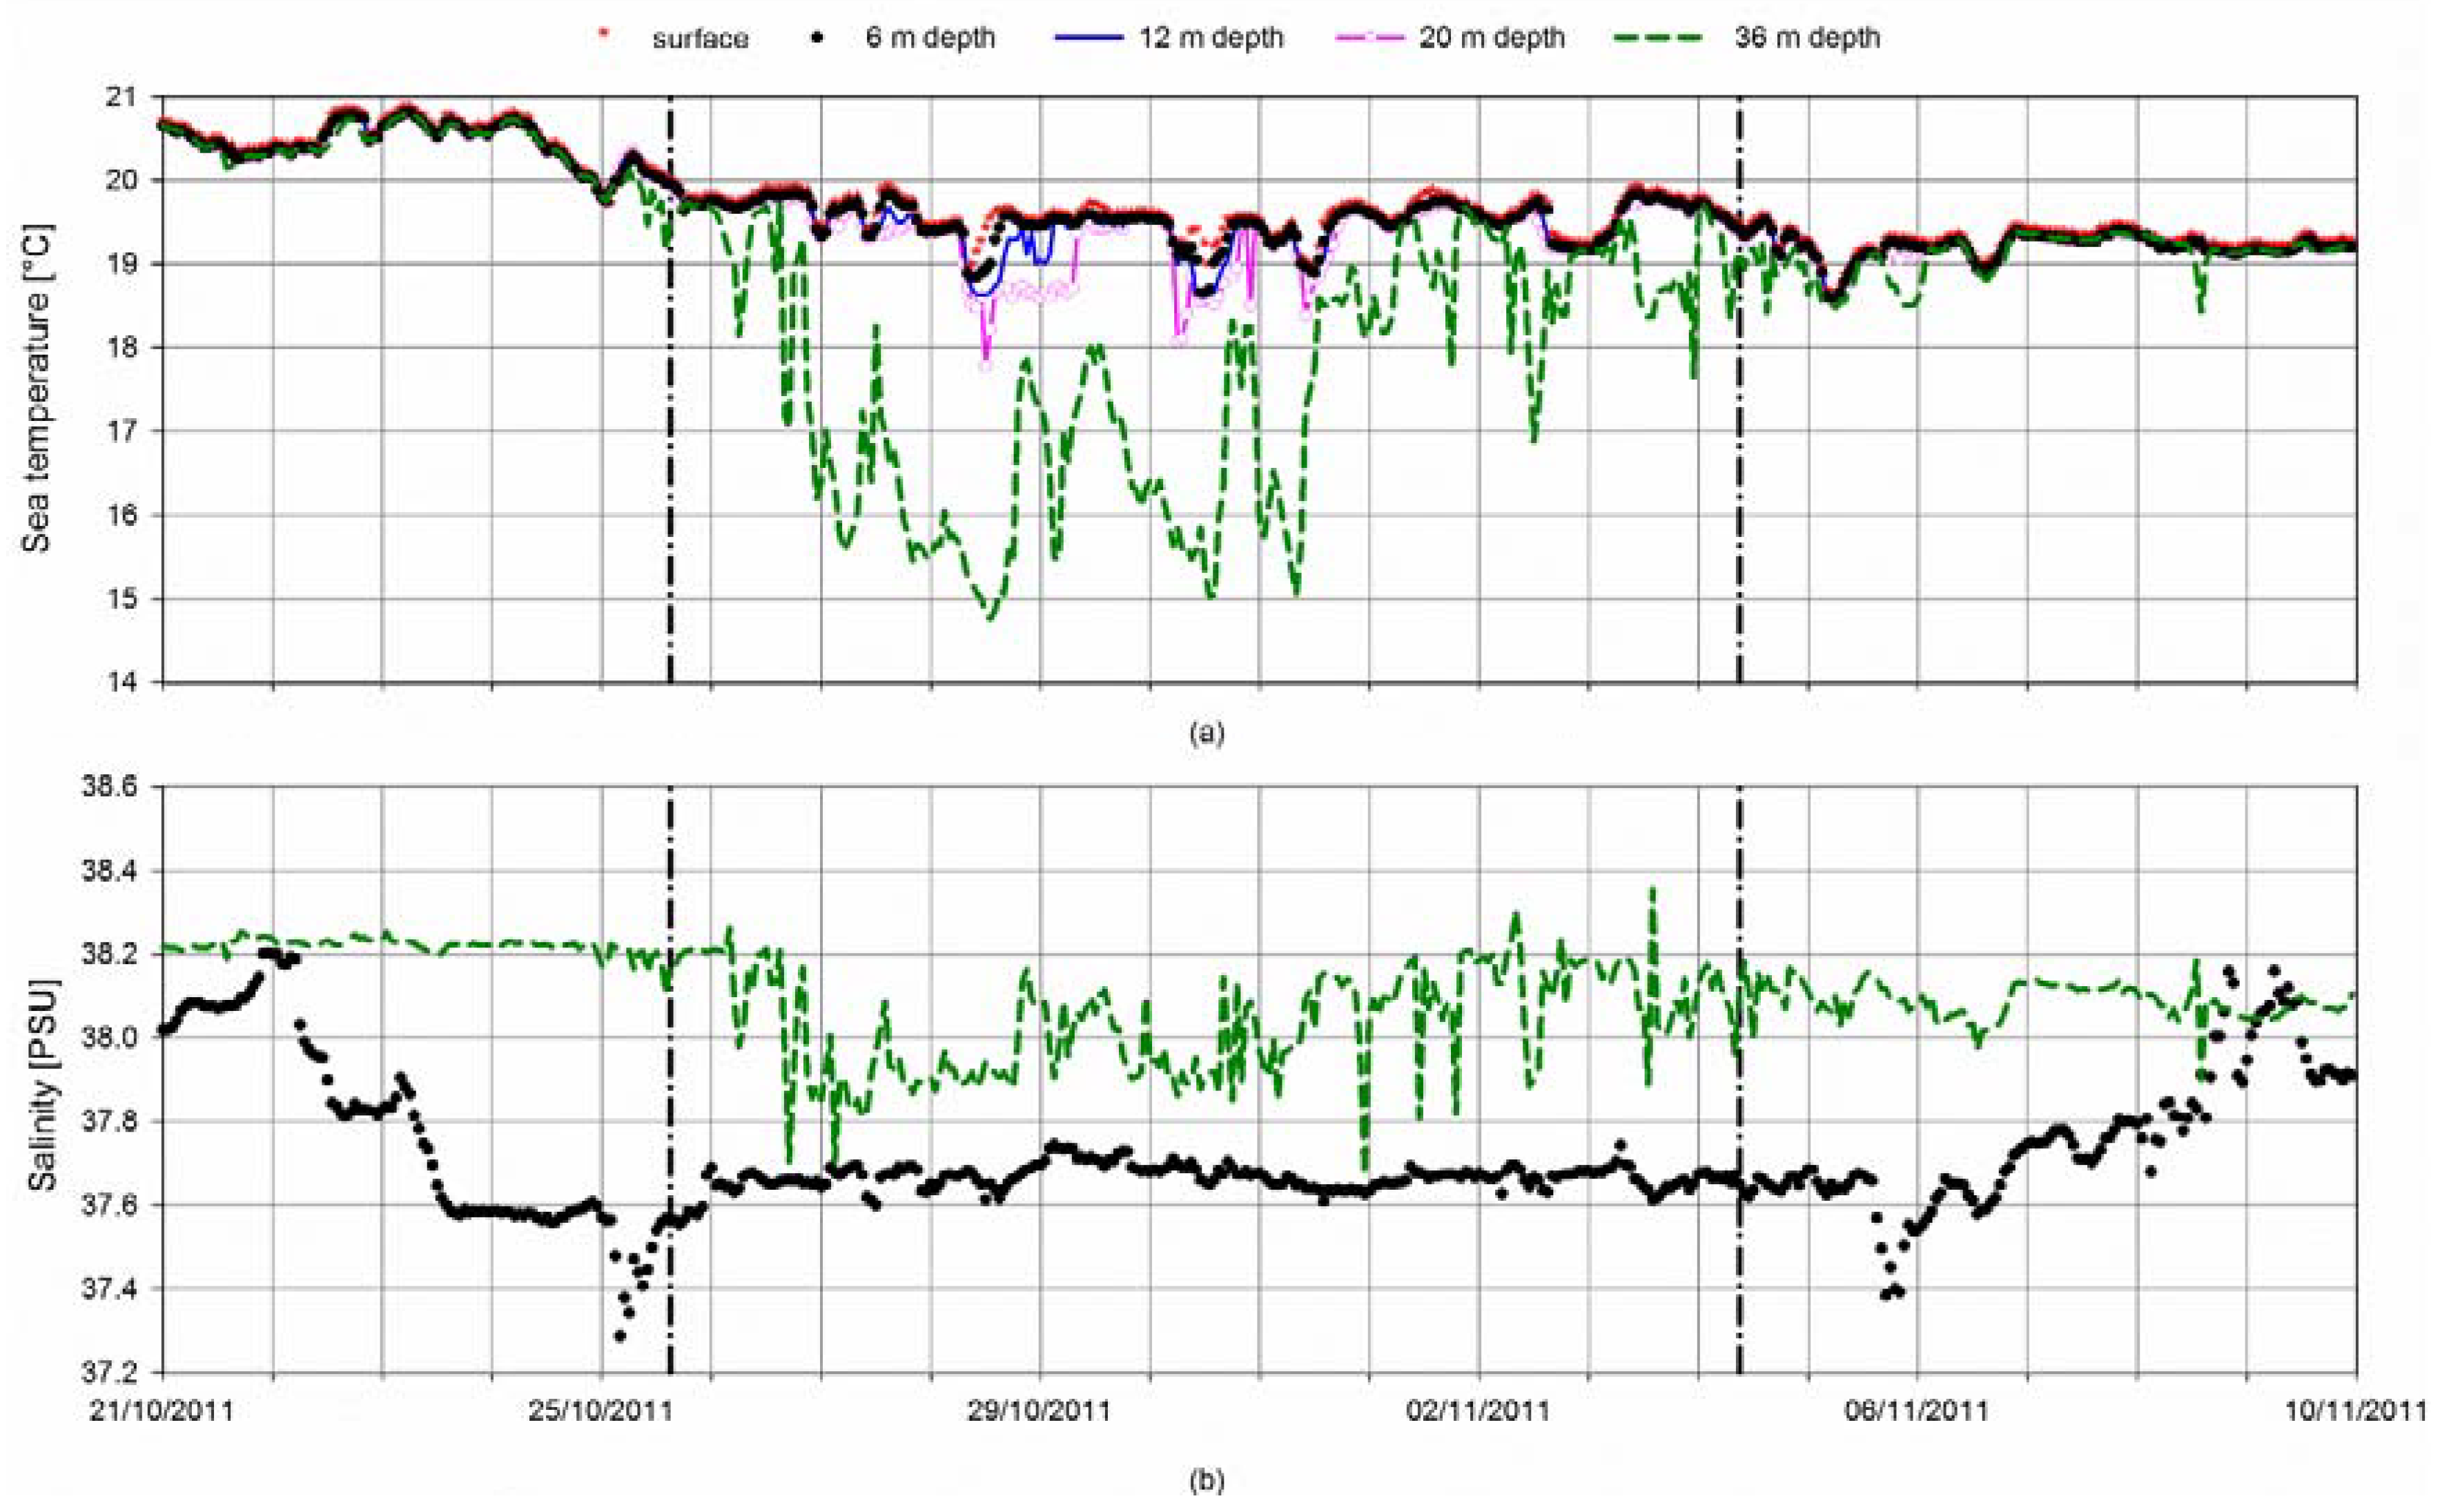
Local sea surface temperature and rain intensity do not indicate a clear relationship at any temporal scale. On the contrary, Rebora et al. [7], by overlaying radar-derived accumulation rain maps to images of sea surface temperature anomalies for the two events that occurred in autumn 2011, suggest that both storms may have originated and developed in an area of positive sea surface temperature anomaly close to the position of the W1M3A observatory. In fact, during October and November 2011, the vertical profile of the sea temperature and salinity recorded at the W1M3A observatory (Figure 9) provide evidence of a strong mesoscale dynamic linked to the Ligurian front displacement [38,39], confirming the presence of mesoscale structures. These can last for several days and can be detected by means of satellite sea surface temperature and altimetry [40,41].
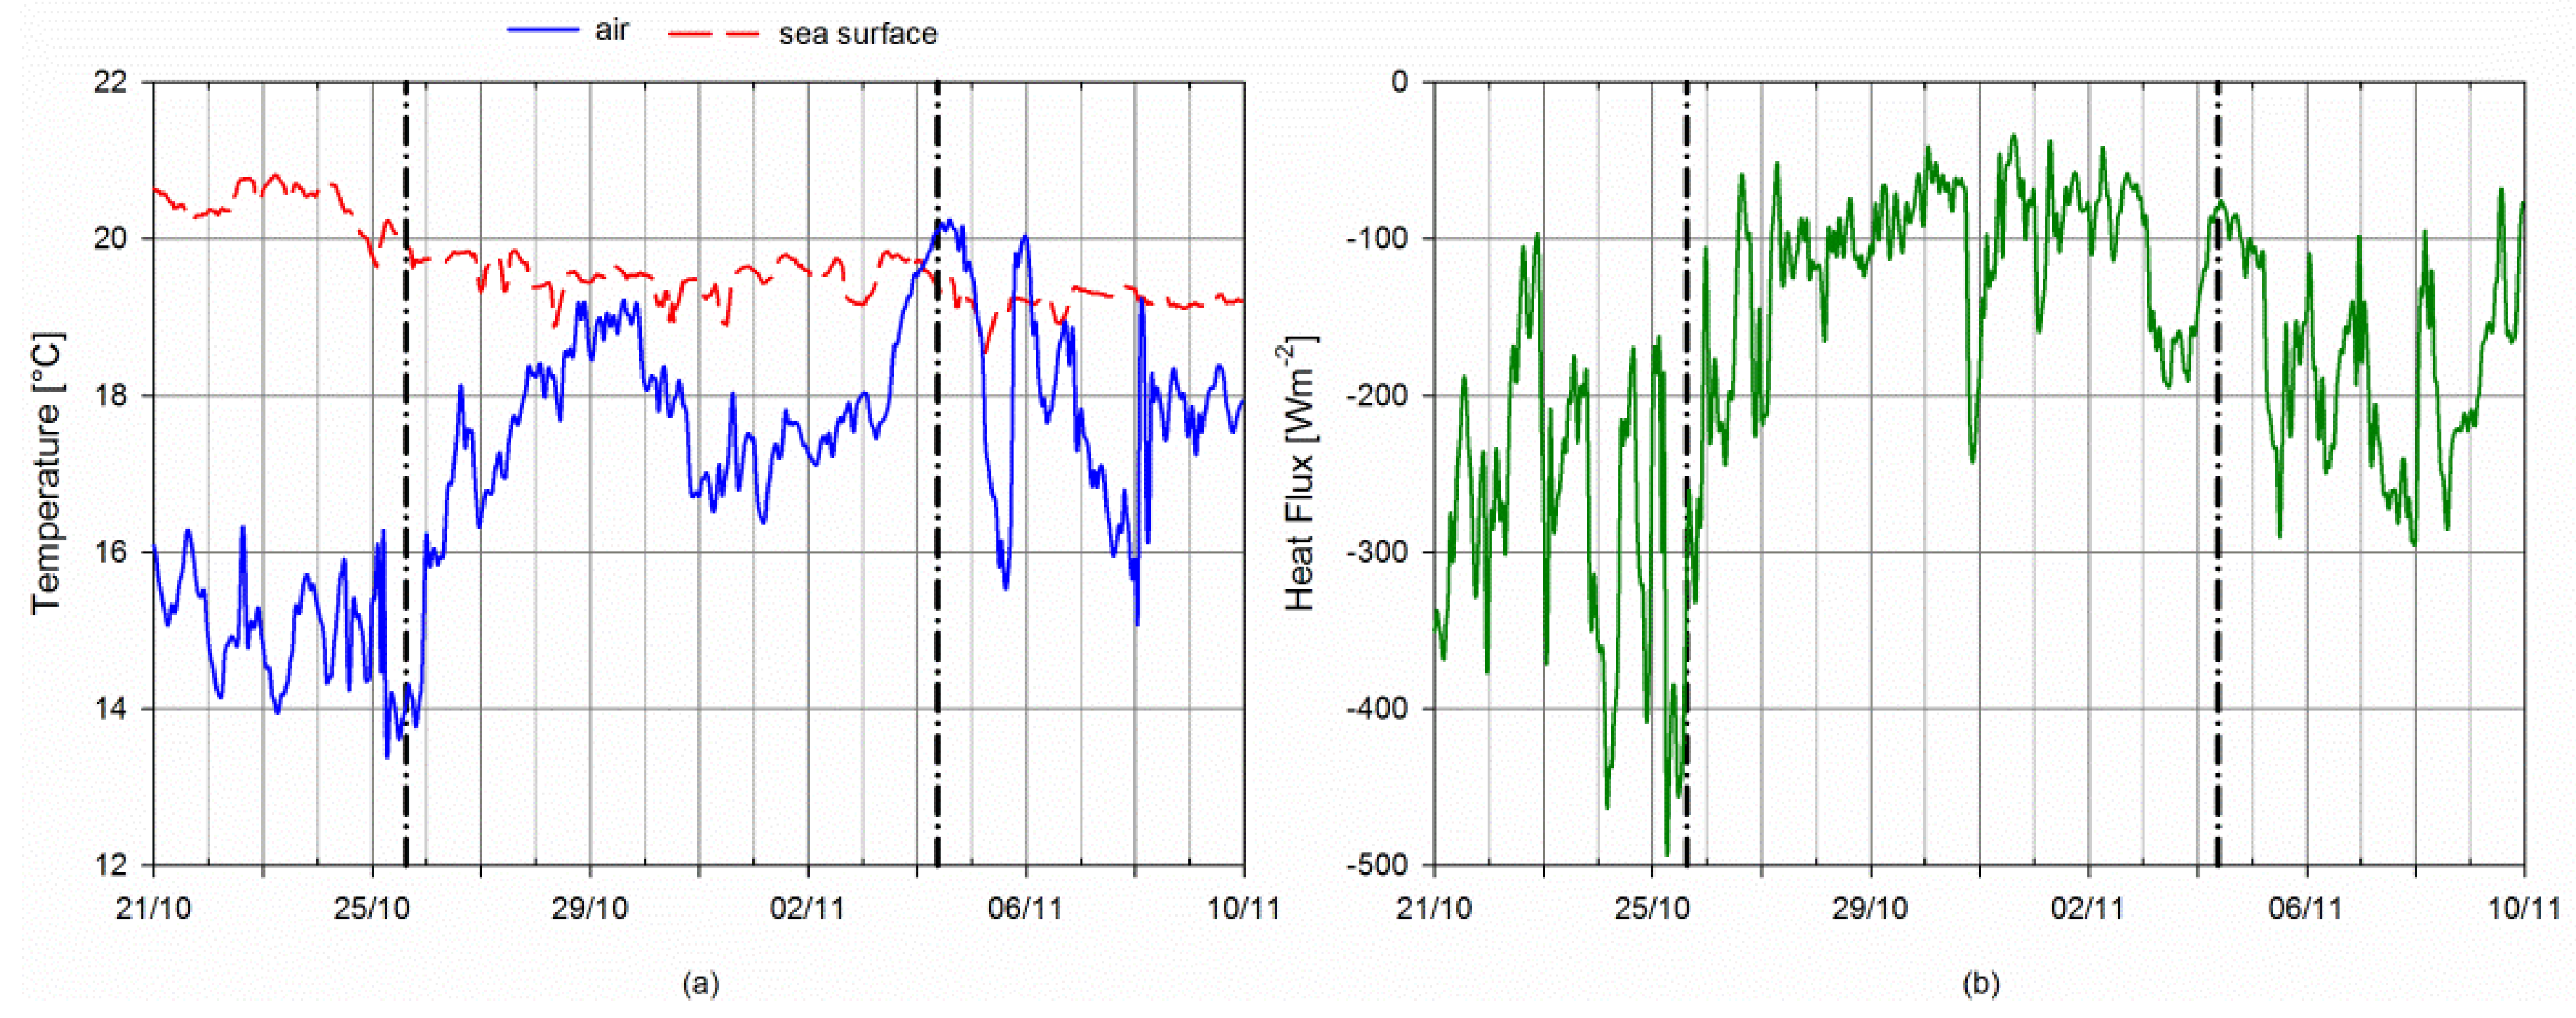
It should be also noted that the air temperature during the event on 4 November is greater than during the event on 25 October, probably because of the south-easterly wind, as recorded at the W1M3A observatory. Consequently, although the temperature of the sea is still elevated, the thermal gradient between the sea and atmosphere is lower (Figure 10a) and the heat flow toward the atmosphere is smaller (Figure 10b). This suggests that the lower correlation evidenced by Rebora et al. [7] between the radar-derived accumulation rain map and the image of the sea surface temperature anomaly for the second event could be also due to the minor heat release from the sea to the atmosphere.
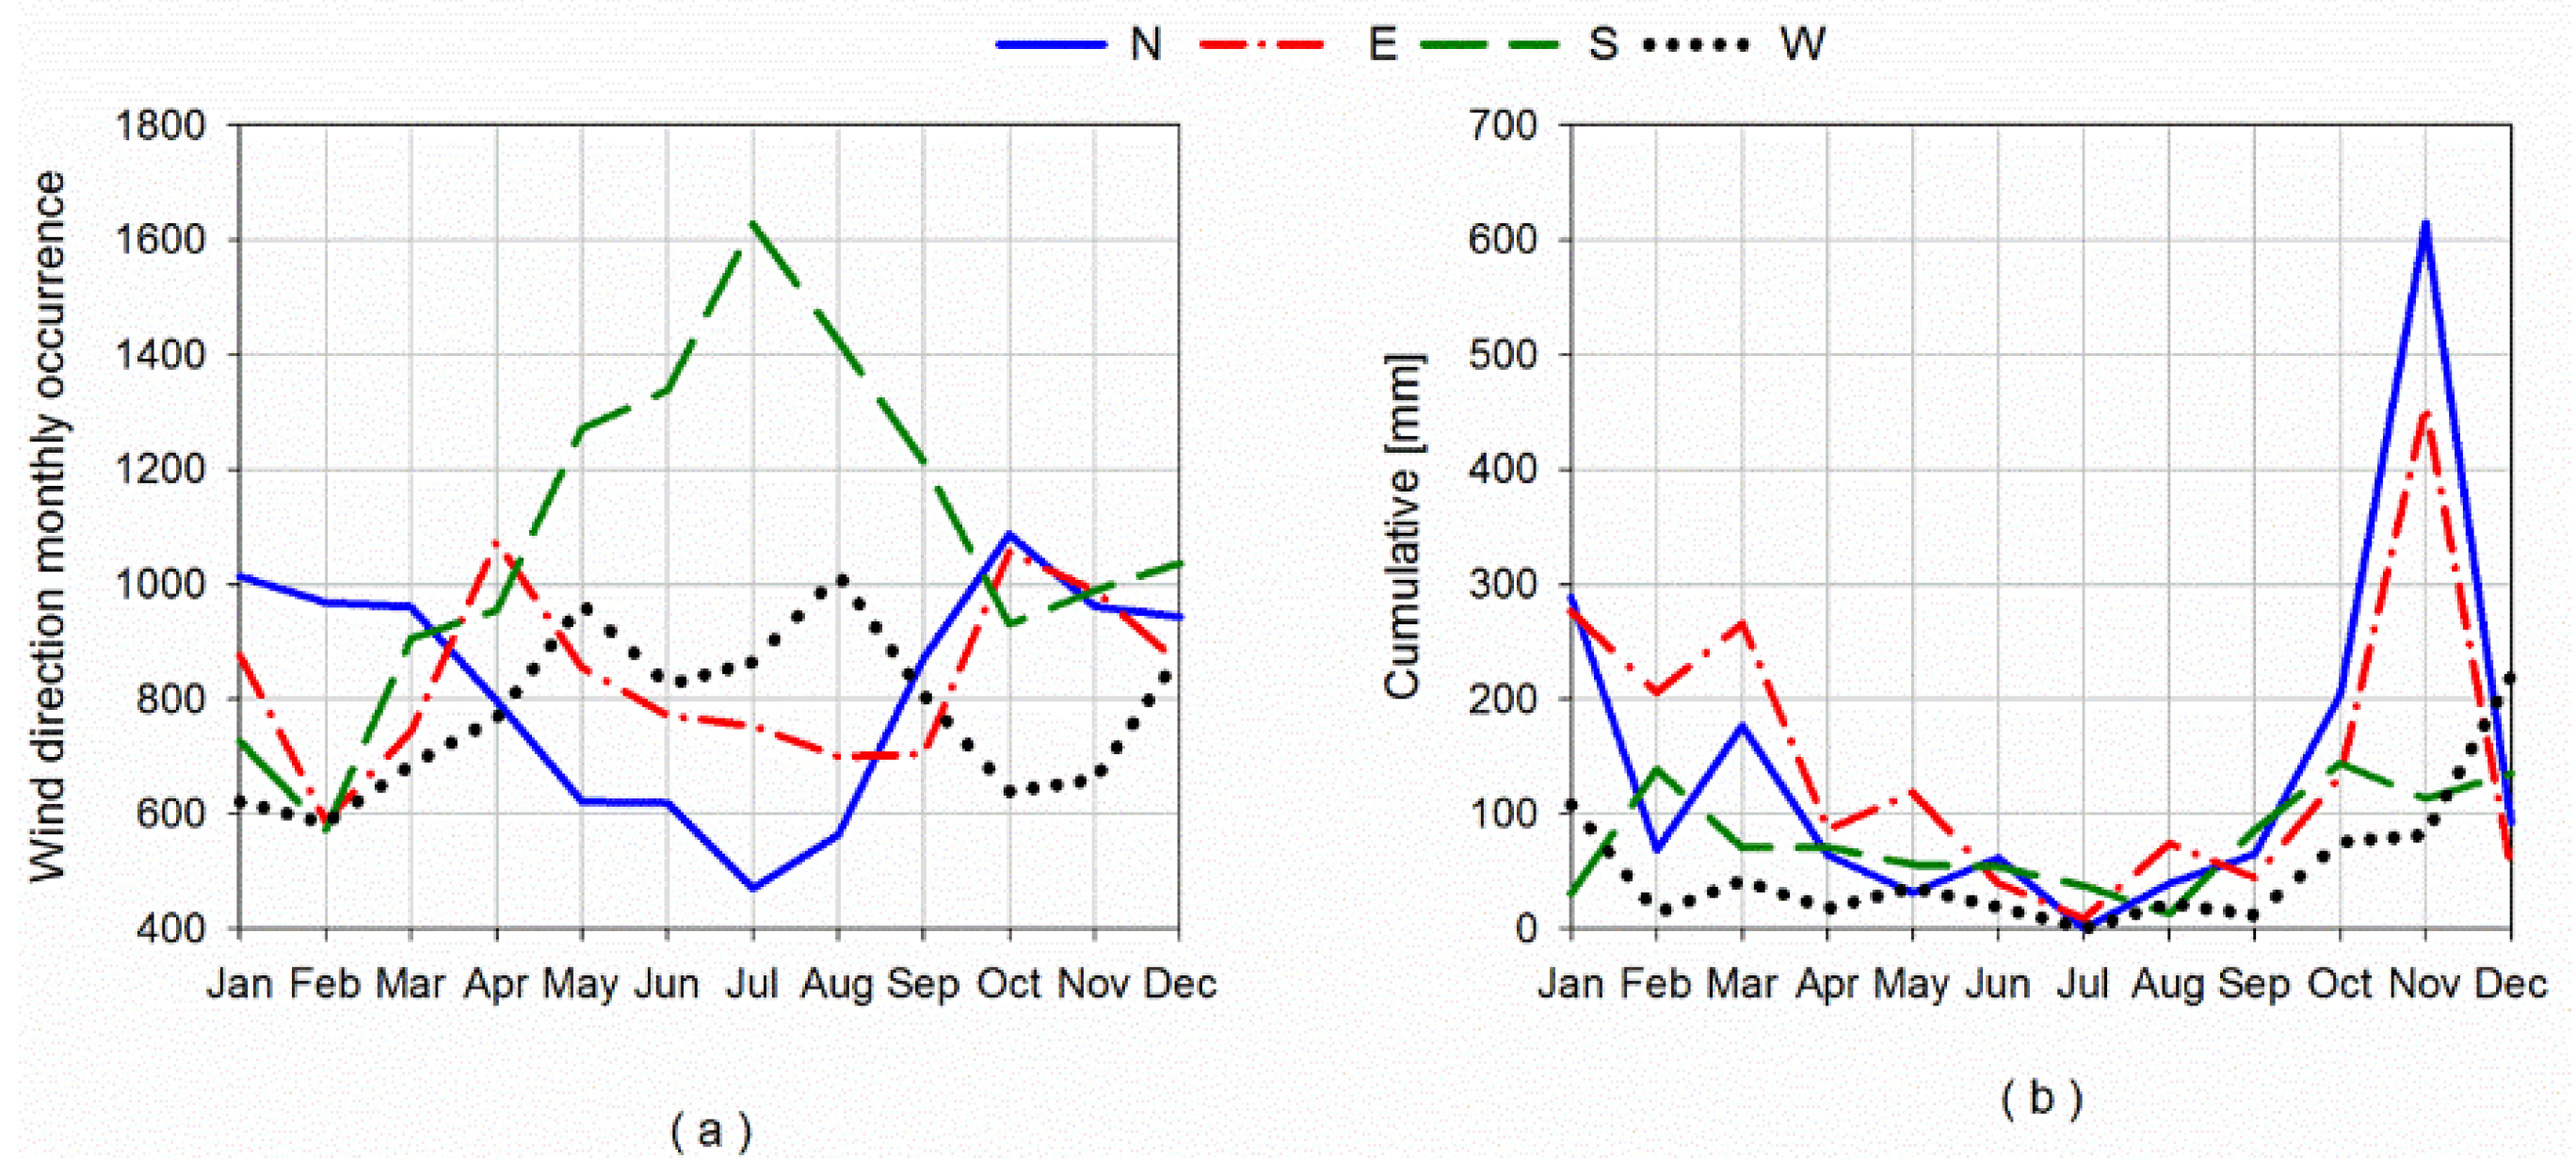
The greatest amount of precipitation is recorded when the wind turns to north-north-east at sea: taking into account the position of the W1M3A observatory, these are winds blowing from the land and are more prevalent from October to April (Figure 11).
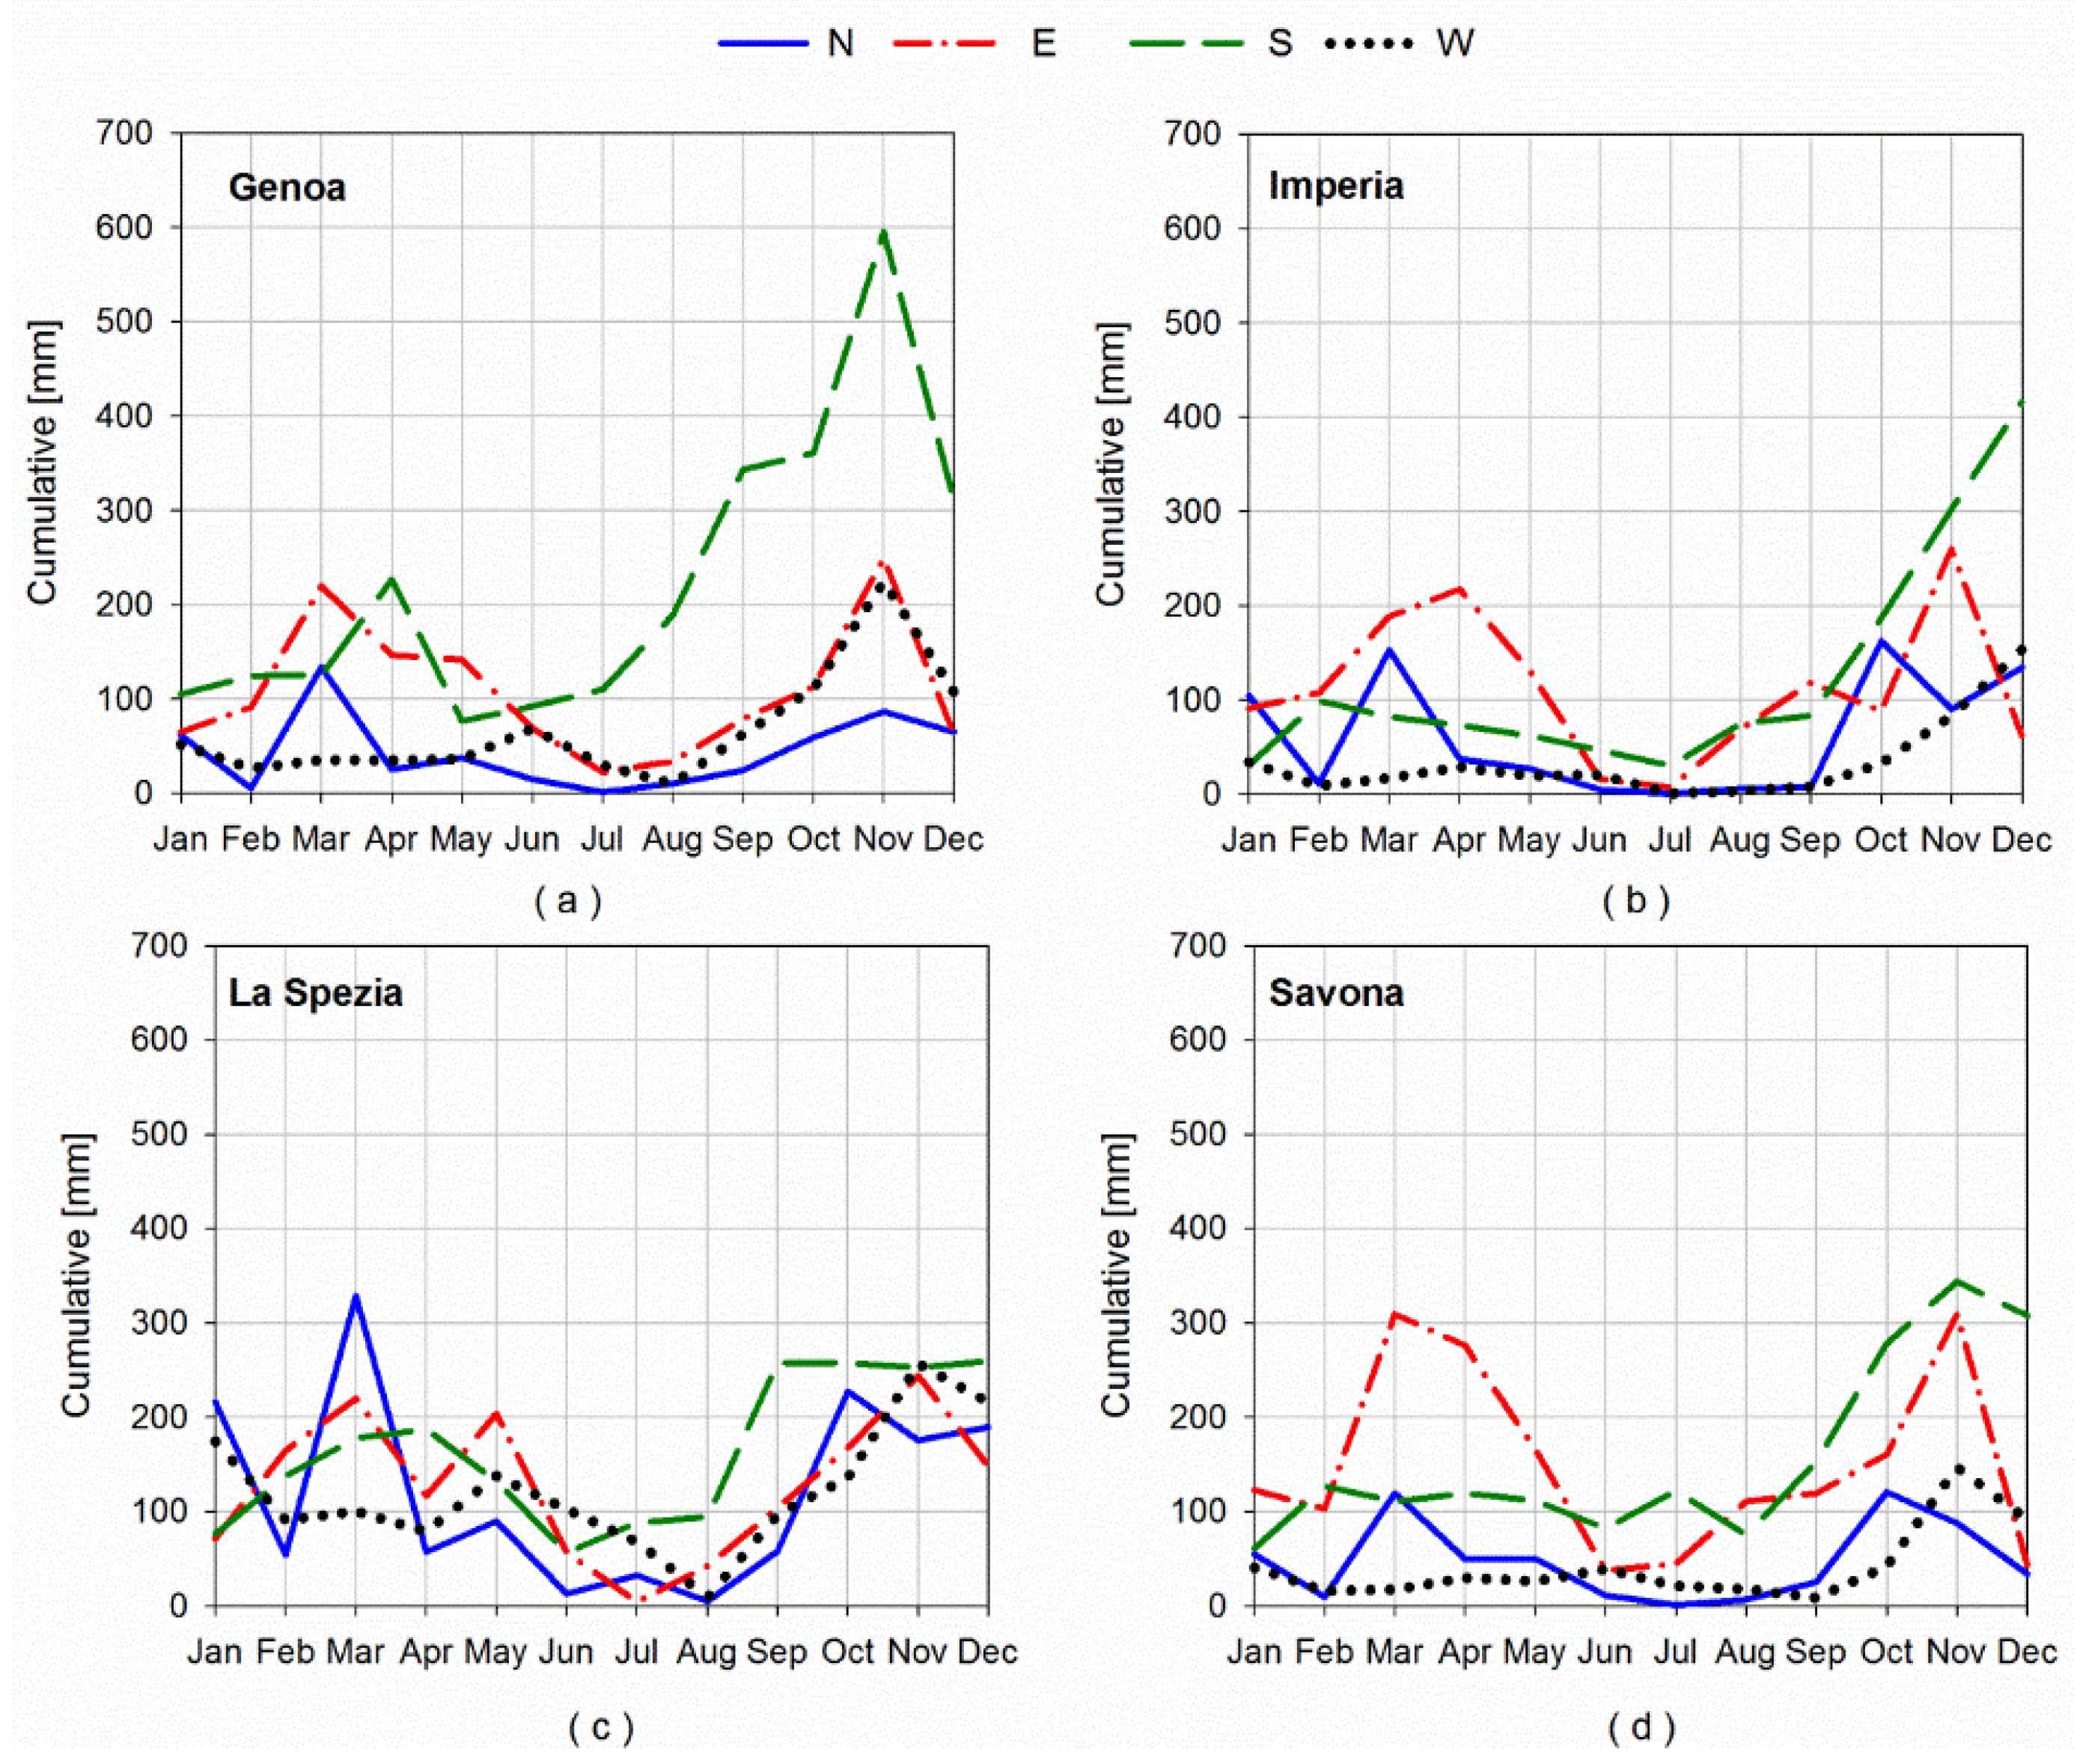
These winds carry cold air masses that reach the warm sea surface and increase the instability of the marine atmospheric boundary layer. Over the land, the greatest cumulative amounts are measured when the wind at the observatory is blowing from south-south-west (Figure 12a,b,d). This well indicates the role of the surrounding orography: the Alps and the Apennines close to the coast on the one hand protect the coastline from the perturbations coming from North-Western Europe, on the other, support the lifting of the unstable wet and warm low level air masses coming from the sea and leading to convective precipitations. In La Spezia, the distribution is less clear, and intense episodes can take place also when a north-westerly wind is blowing at the observatory location due to the channelling effect of the valley of Magra river (Figure 12c). This characterization is also found when analysing the most intense hourly rainfall data and can be partly explained by the convergence between north-westerly and south-easterly flows, which is the crucial factor in many intense events: when the convergence line is to the east of the observatory, north-westerly winds are likely there and precipitation is more probable in eastern Liguria, as shown for the event on 11 November 2012.
Wind speed and direction and heat fluxes in the open sea provided by the W1M3A observing system demonstrate that in-situ measurements are useful to better understand the evolution of convective systems with particular attention to convergence lines whose position could virtually trigger violent storms on land. In fact, although precipitation is one of the best-known terms of the Mediterranean water budget, there are still large uncertainties owing to the lack of offshore observational data [42]. This limitation forces us to use models or satellite-derived products to obtain estimates of precipitation and its variability over sea [43], the validations of which are mainly performed using measurements on land. Hence, any multiannual continuous data-set of in-situ rainfall measurements at sea can improve model forecasting of precipitation and reduce the uncertainties of the water cycle over the oceans. This is particularly true for the Ligurian basin, which is characterized by a particular orography and is often the site of HPEs producing floods on the coast.
Author Contributions
S.P. and R.B. were the responsible of the data collection at sea. S.P., R.B. and M.E.S. performed the analysis. M.T. and P.P. contributed to the analysis of the meteorological and oceanographic conditions during the selected high precipitation events. All authors contributed equally to writing the paper.
Funding
This research was partially funded by the European Union Seventh Framework Programme FP7/2013-2017 grant number 312463 and by the Italian Ministry of Education, University and Research through the Flagship Project RITMARE.
Conflicts of Interest
The authors declare no conflict of interest.
Appendix A
The data used for the analysis are freely available from the portal of the Copernicus Marine Environment Monitoring Service (http://marine.copernicus.eu) and from the web site of the Regional Environmental Protection Agency of Liguria (https://www.arpal.gov.it). The CLINO 1961–1990 dataset is available from the Italian Air Force Meteorological Service (https://www.meteoam.it). Satellite images are available from the European Organisation for the Exploitation of Meteorological Satellites (https://www. www.eumetsat.int).
References
- Nuissier, O.; Ducrocq, V.; Ricard, D.; Lebeaupin, C.; Anquetin, S. A numerical study of three catastrophic precipitating events over southern France. I: Numerical framework and synoptic ingredients. Q. J. R. Meteorol. Soc. 2008, 134, 111–130. [Google Scholar] [CrossRef]
- Ducrocq, V.; Braud, I.; Davolio, S.; Ferretti, R.; Flamant, C.; Jansa, A.; Kalthoff, N.; Richard, E.; Taupier-Letage, I.; Ayral, P.A.; et al. The field campaign dedicated to heavy precipitation and flash flooding in the Northwestern Mediterranean. Bull. Am. Meteorol. Soc. 2014, 95, 1083–1100. [Google Scholar] [CrossRef]
- Duffourg, F.; Ducrocq, V. Origin of the moisture feeding the Heavy Precipitating Systems over Southeastern France. Nat. Hazards Earth Syst. Sci. 2011, 11, 1163–1178. [Google Scholar] [CrossRef]
- Drobinski, P.; Ducrocq, V.; Alpert, P.; Anagnostou, E.; Beranger, K.; Borga, M.; Braud, I.; Chanzy, A.; Davolio, S.; Delrieu, G.; et al. HYMEX, a 10-year multidisciplinary program on the Mediterranean water cycle. Bull. Am. Meteorol. Soc. 2014, 95, 1063–1082. [Google Scholar] [CrossRef]
- Fiori, E.; Comellas, A.; Molini, L.; Rebora, N.; Siccardi, F.; Gochis, D.J.; Tanelli, S.; Parodi, A. Analysis and hindcast simulation of an extreme rainfall event in the Mediterranean area: The Genoa 2011 case. Atmos. Res. 2014, 138, 13–29. [Google Scholar] [CrossRef]
- Silvestro, F.; Gabellani, S.; Giannoni, F.; Parodi, A.; Rebora, N.; Rudari, R.; Siccardi, F. A hydrological analysis of the 4 November 2011 event in Genoa. Nat. Hazards Earth Syst. Sci. 2012, 12, 2743–2752. [Google Scholar] [CrossRef] [Green Version]
- Rebora, N.; Molini, L.; Casella, E.; Comellas, A.; Fiori, E.; Pignone, F.; Siccardi, F.; Silvestro, F.; Tanelli, S.; Parodi, A. Extreme Rainfall in the Mediterranean: What Can We Learn from Observations? J. Hydrometeorol. 2013, 14, 906–922. [Google Scholar] [CrossRef]
- Buzzi, A.; Davolio, S.; Malguzzi, P.; Drofa, O.; Mastrangelo, D. Heavy rainfall episodes over Liguria of autumn 2011: Numerical forecasting experiments. Nat. Hazards Earth Syst. Sci. 2014, 14, 1325–1340. [Google Scholar] [CrossRef] [Green Version]
- Davolio, S.; Silvestro, F.; Malguzzi, P. Effects of Increasing Horizontal Resolution in a Convection Permitting Model on Flood Forecasting: The 2011 Dramatic Events in Liguria (Italy). J. Hydrometeorol. 2015, 16, 1843–1856. [Google Scholar] [CrossRef]
- Cassola, F.; Ferrari, F.; Mazzino, A.; Miglietta, M.M. Numerical simulations of Mediterranean heavy precipitation events with the WRF model: A verification exercise using different approaches. Atmos. Res. 2015, 164–165, 210–225. [Google Scholar] [CrossRef]
- Cassola, F.; Ferrari, F.; Mazzino, A.; Miglietta, M.M. The role of the sea on the flash floods events over Liguria (northwetsern Italy). Geophys. Res. Lett. 2016, 43. [Google Scholar] [CrossRef]
- Khodayar, S.; Raff, F.; Kalthoff, N.; Bock, O. Diagnostic study of a high-precipitation event in the Western Mediterranean: Adequacy of current operational networks. Q. J. R. Meteorol. Soc. 2016, 142, 72–85. [Google Scholar] [CrossRef]
- Lebeaupin Brossier, C.; Bastin, S.; Béranger, K.; Drobinski, P. Regional mesoscale air–sea coupling impacts and extreme meteorological events role on the Mediterranean Sea water budget. Clim. Dyn. 2015, 44, 1029–1051. [Google Scholar] [CrossRef]
- Emanuel, K.A. An Air-Sea Interaction Theory for Tropical Cyclones. Part I: Steady-State Maintenance. J. Atmos. Sci. 1986, 43, 585–605. [Google Scholar] [CrossRef]
- Picco, P.; Bozzano, R.; Schiano, M.E.; Bordone, A.; Borghini, M.; Di Nallo, G.; Pensieri, S.; Schirone, A.; Sparnocchia, S. Marine observing systems from fixed platform in the Ligurian Sea. Bollettino di Geofisica Teorica ed Applicata 2007, 48, 227–239. [Google Scholar]
- Canepa, E.; Pensieri, S.; Bozzano, R.; Faimali, M.; Traverso, P.; Cavaleri, L. The ODAS Italia 1 buoy: More than forty years of activity in the Ligurian Sea. Progress Oceanogr. 2015, 135, 48–63. [Google Scholar] [CrossRef]
- Ravaioli, M.; Bergami, C.; Riminucci, F.; Langone, L.; Cardin, V.; Di Sarra, A.; Aracri, S.; Bastianini, M.; Bensi, M.; Bergamasco, A.; et al. The RITMARE Italian Fixed-Point Observatory Network (IFON) for marine environmental monitoring: A case study. J. Oper. Oceanogr. 2016, 9, s202–s214. [Google Scholar] [CrossRef]
- Lampitt, R.; Cristini, L. FixO3 Network Project: Integration, Harmonization and Innovation. In Proceedings of the European Geosciences Union General Assembly, Vienna Austria, 17–22 April 2016. [Google Scholar]
- Bozzano, R.; Pensieri, S.; Pensieri, L.; Cardin, V.; Brunetti, F.; Bensi, M.; Petihakis, G.; Tsagaraki, T.M.; Ntoumas, M.; Podaras, D.; et al. The M3A Network of Open Ocean Observatories in the Mediterranean Sea. In Proceedings of the 2013 MTS/IEEE OCEANS—Bergen, Bergen, Norway, 10–14 June 2013. [Google Scholar]
- Bojinski, S.; Verstraete, M.; Peterson, T.C.; Richter, C.; Simmons, A.; Zemp, M. The concept of essential climate variables in support of climate research, applications. Bull. Am. Meteorol. Soc. 2014, 95, 1431–1443. [Google Scholar] [CrossRef]
- Dickey, T.D.; Manov, D.V.; Weller, R.A.; Siegel, D.A. Determination of longwave heat flux at the air-sea interface using measurements from buoy platforms. J. Atmos. Ocean. Technol. 1994, 11, 1057–1078. [Google Scholar] [CrossRef]
- Payne, R.E. Albedo of the Sea Surface. J. Atmos. Sci. 1972, 29, 959–970. [Google Scholar] [CrossRef]
- Fairall, C.W.; Bradley, E.F.; Rogers, D.P.; Edson, J.B.; Young, G.S. Bulk parameterization of air-sea fluxes for tropical ocean-global atmosphere couple- ocean atmosphere response experiment. J. Geophys. Res. 1996, 101, 3747–3764. [Google Scholar] [CrossRef]
- Salmi, A.; Ikonen, J. Piezoelectric Precipitation sensors from Vaisala. In Proceedings of the WMO Technical Conference on Meteorological and Environmental Instruments and Methods of Observation (TECO-2005), Bucharest, Romania, 4–7 May 2005. [Google Scholar]
- Basara, J.B.; Illston, B.G.; Winning, T.E., Jr.; Friebrich, A. Evaluation of Rainfall Measurements from WXT510 Sensor for Use in the Oklahoma City Micronet. Open Atmos. Sci. J. 2009, 3, 39–47. [Google Scholar] [CrossRef]
- Lynch, T.P.; Morello, E.B.; Evans, K.; Richardson, A.J.; Rochester, W.; Steinberg, C.R.; Roughan, M.; Thompson, P.; Middleton, J.F.; Feng, M.; et al. IMOS National Reference Stations: A Continental-Wide Physical, Chemical and Biological Coastal Observing System. PLoS ONE 2014, 9, e113652. [Google Scholar] [CrossRef] [PubMed]
- Decesari, S.; Allen, J.; Plass-Duelmer, C.; Williams, B.J.; Paglione, M.; Facchini, M.C.; O’Dowd, C.; Harrison, R.M.; Gietl, J.K.; Coe, H.; et al. Measurements of the aerosol chemical composition and mixing state in the Po Valley using multiple spectroscopic techniques. Atmos. Chem. Phys. 2014, 14, 12109–12132. [Google Scholar] [CrossRef]
- Pensieri, S.; Bozzano, R.; Nystuen, J.A.; Anagnostou, E.N.; Anagnostou, M.N.; Bechini, R. Underwater Acoustic Measurements to Estimate Wind and Rainfall in the Mediterranean Sea. Adv. Meteorol. 2015, 2015, 1–18. [Google Scholar] [CrossRef]
- Coppola, L.; Ntoumas, M.; Bozzano, R.; Bensi, M.; Hartman, S.E.; Charcos, L.M.; Craig, J.; Rolin, J.F.; Giovanetti, G.; Cano, D.; et al. Handbook of Best Practices for Open Ocean Fixed Observatories; Fix03 Project; JCOMM Community Practices Collection, European Commission: Geneva, Switzerland, 2016. [Google Scholar]
- Rapetti, F.; Vittorini, S. Note Illustrative Della Carta Climatica Della Liguria (scala 1:250,000). Atti della Società Toscana di Scienze Naturali Residente in Pisa Memorie Serie A 2013, 75–99. [Google Scholar] [CrossRef]
- Faccini, F.; Luino, F.; Sacchini, A.; Turconi, L. Flash Flood Events and Urban Development in Genoa (Italy): Lost in translation. Eng. Geol. Soc. Territ. 2014, 5, 797–801. [Google Scholar] [CrossRef]
- Hally, A.; Caumont, O.; Garrote, L.; Richard, E.; Weerts, A.; Delogu, F.; Fiori, E.; Rebora, N.; Parodi, A.; Mihalović, A.; et al. Hydrometeorological multi-model ensemble simulations of the 4 November 2011 flash flood event in Genoa, Italy, in the framework of the DRIHM project. Nat. Hazards Earth Syst. Sci. 2015, 15, 537–555. [Google Scholar] [CrossRef]
- Libertino, A.; Sharma, A.; Lakshmi, V.; Claps, P. A global assessment of the timing of extreme rainfall from TRMM and GPM for improving hydrologic design. Environ. Res. Lett. 2016, 11, 054003. [Google Scholar] [CrossRef]
- Borga, M.; Marchi, L.; Nikolopoulos, E.I.; Marra, F.; Crema, S.; Niedda, M.; Pirastru, M.; Amponsah, M. The flash-flood of November 2013 in NE Sardinia (Italy): Post-event documentation and hydrological modelling. In Proceedings of the 8th HyMeX Workshop, Valletta, Malta, 15–18 September 2014. [Google Scholar]
- Ricard, D.; Ducrocq, V.; Auger, L. A Climatology of the Mesoscale Environment Associated with Heavily Precipitating Events over a Northwestern Mediterranean Area. J. Appl. Meteorol. Climatol. 2012, 51, 468–488. [Google Scholar] [CrossRef]
- Yang, G.-Y.; Slingo, J. The Diurnal Cycle in the Tropics. Mon. Weather Rev. 2001, 129, 784–801. [Google Scholar] [CrossRef]
- Dai, A. Global Precipitation and Thunderstorm Frequencies. Part II: Diurnal Variations. J. Clim. 2001, 14, 1112–1128. [Google Scholar] [CrossRef]
- Sournia, A. Hydrological fronts off the coasts of France: Working sites of the Frontal programme. Oceanol. Acta 1990, 13, 413–438. [Google Scholar]
- Astraldi, M.; Gasparini, G.P.; Sparnocchia, S. The seasonal and interannual variability in the Ligurian-Provençal Basin. In Coastal and Estuarine Studies; La Viollette, P.E., Ed.; American Geophysical Union: Washington, DC, USA, 1994; Volume 46, pp. 93–113. ISBN 978-0-87590-260-9. [Google Scholar]
- Picco, P.; Cappelletti, A.; Sparnocchia, S.; Schiano, M.E.; Pensieri, S.; Bozzano, R. Upper layer current variability in the Central Ligurian Sea. Ocean Sci. 2010, 6, 825–836. [Google Scholar] [CrossRef]
- Birol, F.; Cancet, M.; Estournel, C. Aspects of the seasonal variability of the Northern Current (NW Mediterranean Sea) observed by altimetry. J. Mar. Syst. 2010, 81, 297–311. [Google Scholar] [CrossRef]
- Alhammoud, B.; Claud, C.; Funatsu, B.; Béranger, K.; Chaboureau, J.-P. Patterns of Precipitation and Convection Occurrence over the Mediterranean Basin Derived from a Decade of Microwave Satellite Observations. Atmosphere 2014, 5, 370–398. [Google Scholar] [CrossRef]
- Aznar, R.; Sotillo, M.G.; Martín, M.L.; Somot, S.; Valero, F. Comparison of model and satellite-derived long-term precipitation databases over the Mediterranean basin: A general overview. Atmos. Res. 2010, 97, 170–184. [Google Scholar] [CrossRef]
Figure 1.
Map of the study area showing the position of the W1M3A observatory and the four main coastal cities of the Liguria region.
Figure 1.
Map of the study area showing the position of the W1M3A observatory and the four main coastal cities of the Liguria region.

Figure 2.
(a) Time series of cumulative and rainy days in the coastal station of Genoa over the period January 2009–January 2014; (b) Time series of cumulative and rainy days in the coastal station of Imperia over the period January 2009–January 2014; (c) Time series of cumulative and rainy days in the coastal station of La Spezia over the period January 2009–January 2014; (d) Time series of cumulative and rainy days in the coastal station of Savona over the period January 2009–January 2014.

Figure 3.
(a) Histogram of rainy hours per day at sea; (b) Histogram of hourly rain intensity at sea; (c) Histogram of monthly rain intensity at sea.
Figure 3.
(a) Histogram of rainy hours per day at sea; (b) Histogram of hourly rain intensity at sea; (c) Histogram of monthly rain intensity at sea.

Figure 4.
(a) Monthly cumulative for the years 2009–2013 at sea; (b) Number of rainy hours for each month for the years 2009–2013 at sea.
Figure 4.
(a) Monthly cumulative for the years 2009–2013 at sea; (b) Number of rainy hours for each month for the years 2009–2013 at sea.

Figure 5.
(a) Visible RGB combination from Meteosat Second Generation satellite on 25 October 2011 at 12 UTC; (b) Time series of precipitation collected by the W1M3A observatory, the coastal station of La Spezia and an inland station (Brugnato, 112 asl) between 24 and 26 October 2010.
Figure 5.
(a) Visible RGB combination from Meteosat Second Generation satellite on 25 October 2011 at 12 UTC; (b) Time series of precipitation collected by the W1M3A observatory, the coastal station of La Spezia and an inland station (Brugnato, 112 asl) between 24 and 26 October 2010.

Figure 6.
(a) Visible RGB combination from Meteosat Second Generation satellite on 5 November 2011 at 12 UTC; (b) Visible RGB combination from Meteosat Second Generation satellite on 8 November 2011 at 12 UTC; (c) Time series of precipitation collected by the W1M3A observatory, the coastal station of Genoa and an inland station (Vicomorasso, 310 asl) between 3 and 7 November 2011.

Figure 7.
Visible RGB combination from Meteosat Second Generation satellite image on 18 November 2013 at 12 UTC.
Figure 7.
Visible RGB combination from Meteosat Second Generation satellite image on 18 November 2013 at 12 UTC.

Figure 8.
Visible RGB combination from Meteosat Second Generation satellite image on 10 November 2012 at 12 UTC.
Figure 8.
Visible RGB combination from Meteosat Second Generation satellite image on 10 November 2012 at 12 UTC.

Figure 9.
(a) Time series of sea temperature between 21 October and 10 November 2011 acquired by the W1M3A observatory; (b) Time series of salinity between 21 October and 10 November 2011 acquired by the W1M3A observatory. Dash-dotted lines mark the time of the maximum precipitation on land.
Figure 9.
(a) Time series of sea temperature between 21 October and 10 November 2011 acquired by the W1M3A observatory; (b) Time series of salinity between 21 October and 10 November 2011 acquired by the W1M3A observatory. Dash-dotted lines mark the time of the maximum precipitation on land.

Figure 10.
(a) Time series of sea temperature and air temperature between 21 October and 10 November 2011 acquired by the W1M3A observatory; (b) Time series of heat fluxes between 21 October and 10 November 2011 computed using the in-situ data of the W1M3A observatory. Dash-dotted lines mark the time of the maximum precipitation on land.

Figure 11.
(a) Monthly occurrences of hourly wind direction; (b) Monthly cumulative at sea according to wind direction.
Figure 11.
(a) Monthly occurrences of hourly wind direction; (b) Monthly cumulative at sea according to wind direction.

Figure 12.
(a) Cumulative amounts at Genoa according to wind direction at sea; (b) Cumulative amounts at Imperia according to wind direction at sea; (c) Cumulative amounts at La Spezia according to wind direction at sea; (d) Cumulative amounts at Savona according to wind direction at sea.
Figure 12.
(a) Cumulative amounts at Genoa according to wind direction at sea; (b) Cumulative amounts at Imperia according to wind direction at sea; (c) Cumulative amounts at La Spezia according to wind direction at sea; (d) Cumulative amounts at Savona according to wind direction at sea.


Table 1.
High precipitation events with hourly precipitation at sea exceeding 30 mmh−1.
| Date | Time (UTC) | Hourly Precipitation (mmh−1) | Daily Cumulative (mm) | Notes |
|---|---|---|---|---|
| 8 November 2009 | 03; 04; 05 | 33.48; 44.38; 44.39 | 267.1 | |
| 23 December 2010 | 19; 20 | 41.91; 50.35 | 155.6 | |
| 25 October 2011 | 02 | 32.74 | 126.6 | Floods in Liguria |
| 5 November 2011 | 12; 13 | 32.99; 33.72 | 162.9 | Floods in Liguria |
| 8 November 2011 | 01 | 47.49 | 71.8 | Floods in Liguria |
| 5 October 2013 | 01 | 33.39 | 34.5 | |
| 18 November 2013 | 03; 04; 05 | 45.97; 59.75; 42.29 | 214.7 | Floods in Sardinia |
© 2018 by the authors. Licensee MDPI, Basel, Switzerland. This article is an open access article distributed under the terms and conditions of the Creative Commons Attribution (CC BY) license (http://creativecommons.org/licenses/by/4.0/).
Share and Cite
MDPI and ACS Style
Pensieri, S.; Schiano, M.E.; Picco, P.; Tizzi, M.; Bozzano, R. Analysis of the Precipitation Regime over the Ligurian Sea. Water 2018, 10, 566. https://doi.org/10.3390/w10050566
AMA Style
Pensieri S, Schiano ME, Picco P, Tizzi M, Bozzano R. Analysis of the Precipitation Regime over the Ligurian Sea. Water. 2018; 10(5):566. https://doi.org/10.3390/w10050566
Chicago/Turabian StylePensieri, Sara, Maria Elisabetta Schiano, Paola Picco, Marco Tizzi, and Roberto Bozzano. 2018. "Analysis of the Precipitation Regime over the Ligurian Sea" Water 10, no. 5: 566. https://doi.org/10.3390/w10050566
Note that from the first issue of 2016, this journal uses article numbers instead of page numbers. See further details here.