Assessment of Historical Flood Risk to the Groundwater Regime: Case Study of the Kolubara Coal Basin, Serbia


Faculty of Mining and Geology, University of Belgrade, Dušina 7, 11000 Belgrade, Serbia
*
Author to whom correspondence should be addressed.
Water 2018, 10(5), 588; https://doi.org/10.3390/w10050588
Submission received: 28 March 2018
/
Revised: 23 April 2018
/
Accepted: 24 April 2018
/
Published: 2 May 2018
(This article belongs to the Section Hydrology)
Abstract
:Heavy rainfall and slow movement of the cyclone Tamara caused record floods in May 2014 across Serbia. As a result, levees were breached, a large portion of the open-pit lignite mine Tamnava–West Field was flooded and a flood lake was created. Due to an active hydraulic link with aquifers, the water table rose and the amount of stored groundwater increased dramatically. Based on in situ surveys and hydrodynamic modeling, three distinct periods of the groundwater regime are identified and the flood impact on the groundwater regime in the study area quantified. The paper describes correlations between flood lake water levels and the water table, and shows calculated groundwater volumes as a result of flooding and those of residual groundwater after dewatering of the open-pit mine. This extreme historical flood in Serbia had disastrous economic and social consequences, given that the studied open-pit mine supports more than 25% of Serbia’s electric power output. The assessment of the flood wave and its impact on the groundwater regime is an important example of the groundwater system response to an extreme rainfall and flood event. The paper presents the operating algorithm which leads to the approach of assessing the impact of floods on increasing the volume of accumulated groundwater. The paper presents a developed methodology for groundwater level status exploration in the wider area of open-pit mine Tamnava-West Field during the flooding that occurred in this mine. The developed method encompasses the creation and calibration of a groundwater model and fate and transport model for groundwater state prior to the flooding, a verification model for groundwater level during the extreme floods and a control verification model which corresponds to the period after the passing of the flood wave. The applied operational algorithm offers reliable bases for adopting a strategy for groundwater management during floods.
1. Introduction
Heavy rainfall in May 2014 caused extreme flooding and considerable damage in large parts of Serbia, Bosnia and Herzegovina, and eastern Croatia. On 13 May 2014, there was a cold front coming from the Alps in Western Europe and the cyclone Tamara began to form over the Adriatic Sea. On 14 May, cold air advection continued over the Alps to the central Mediterranean, intercepting the cyclone and causing it to center above Serbia (Pannonian Plain) and northeastern Bosnia and Herzegovina. The geographic relief south of the Sava River (Figure 1) favored the development of the resulting low-pressure system. The main cause of the disastrous rainfall in Serbia, which in places exceeded one-third of annual totals, was very slow movement of cyclone Tamara.
Serbia had previously been hit by an extremely wet period, with abundant precipitation. Between 14 April and 5 May 2014, most of Serbia reported 120–170 mm of rainfall, or nearly four times the average totals during the same period. Average annual precipitation in Serbia increases with altitude: in the lowlands the annual total is in the interval from 540 and 820 mm, elevations above 1000 m receive 700–1000 mm on average, and the mountainous regions of southwestern Serbia as much as 1500 mm [1]. As such, the soil was already saturated when the disastrous rainfall hit Serbia from 13 to 15 May, causing river stages and water tables to rise. There was extensive soil erosion and more than 1000 major landslides were recorded [2]. Many cities reported record daily precipitation levels. Over 30 h, the amount of rainfall equaled three-month averages: Loznica (175 mm), Valjevo (146 mm) and Belgrade (144 mm).
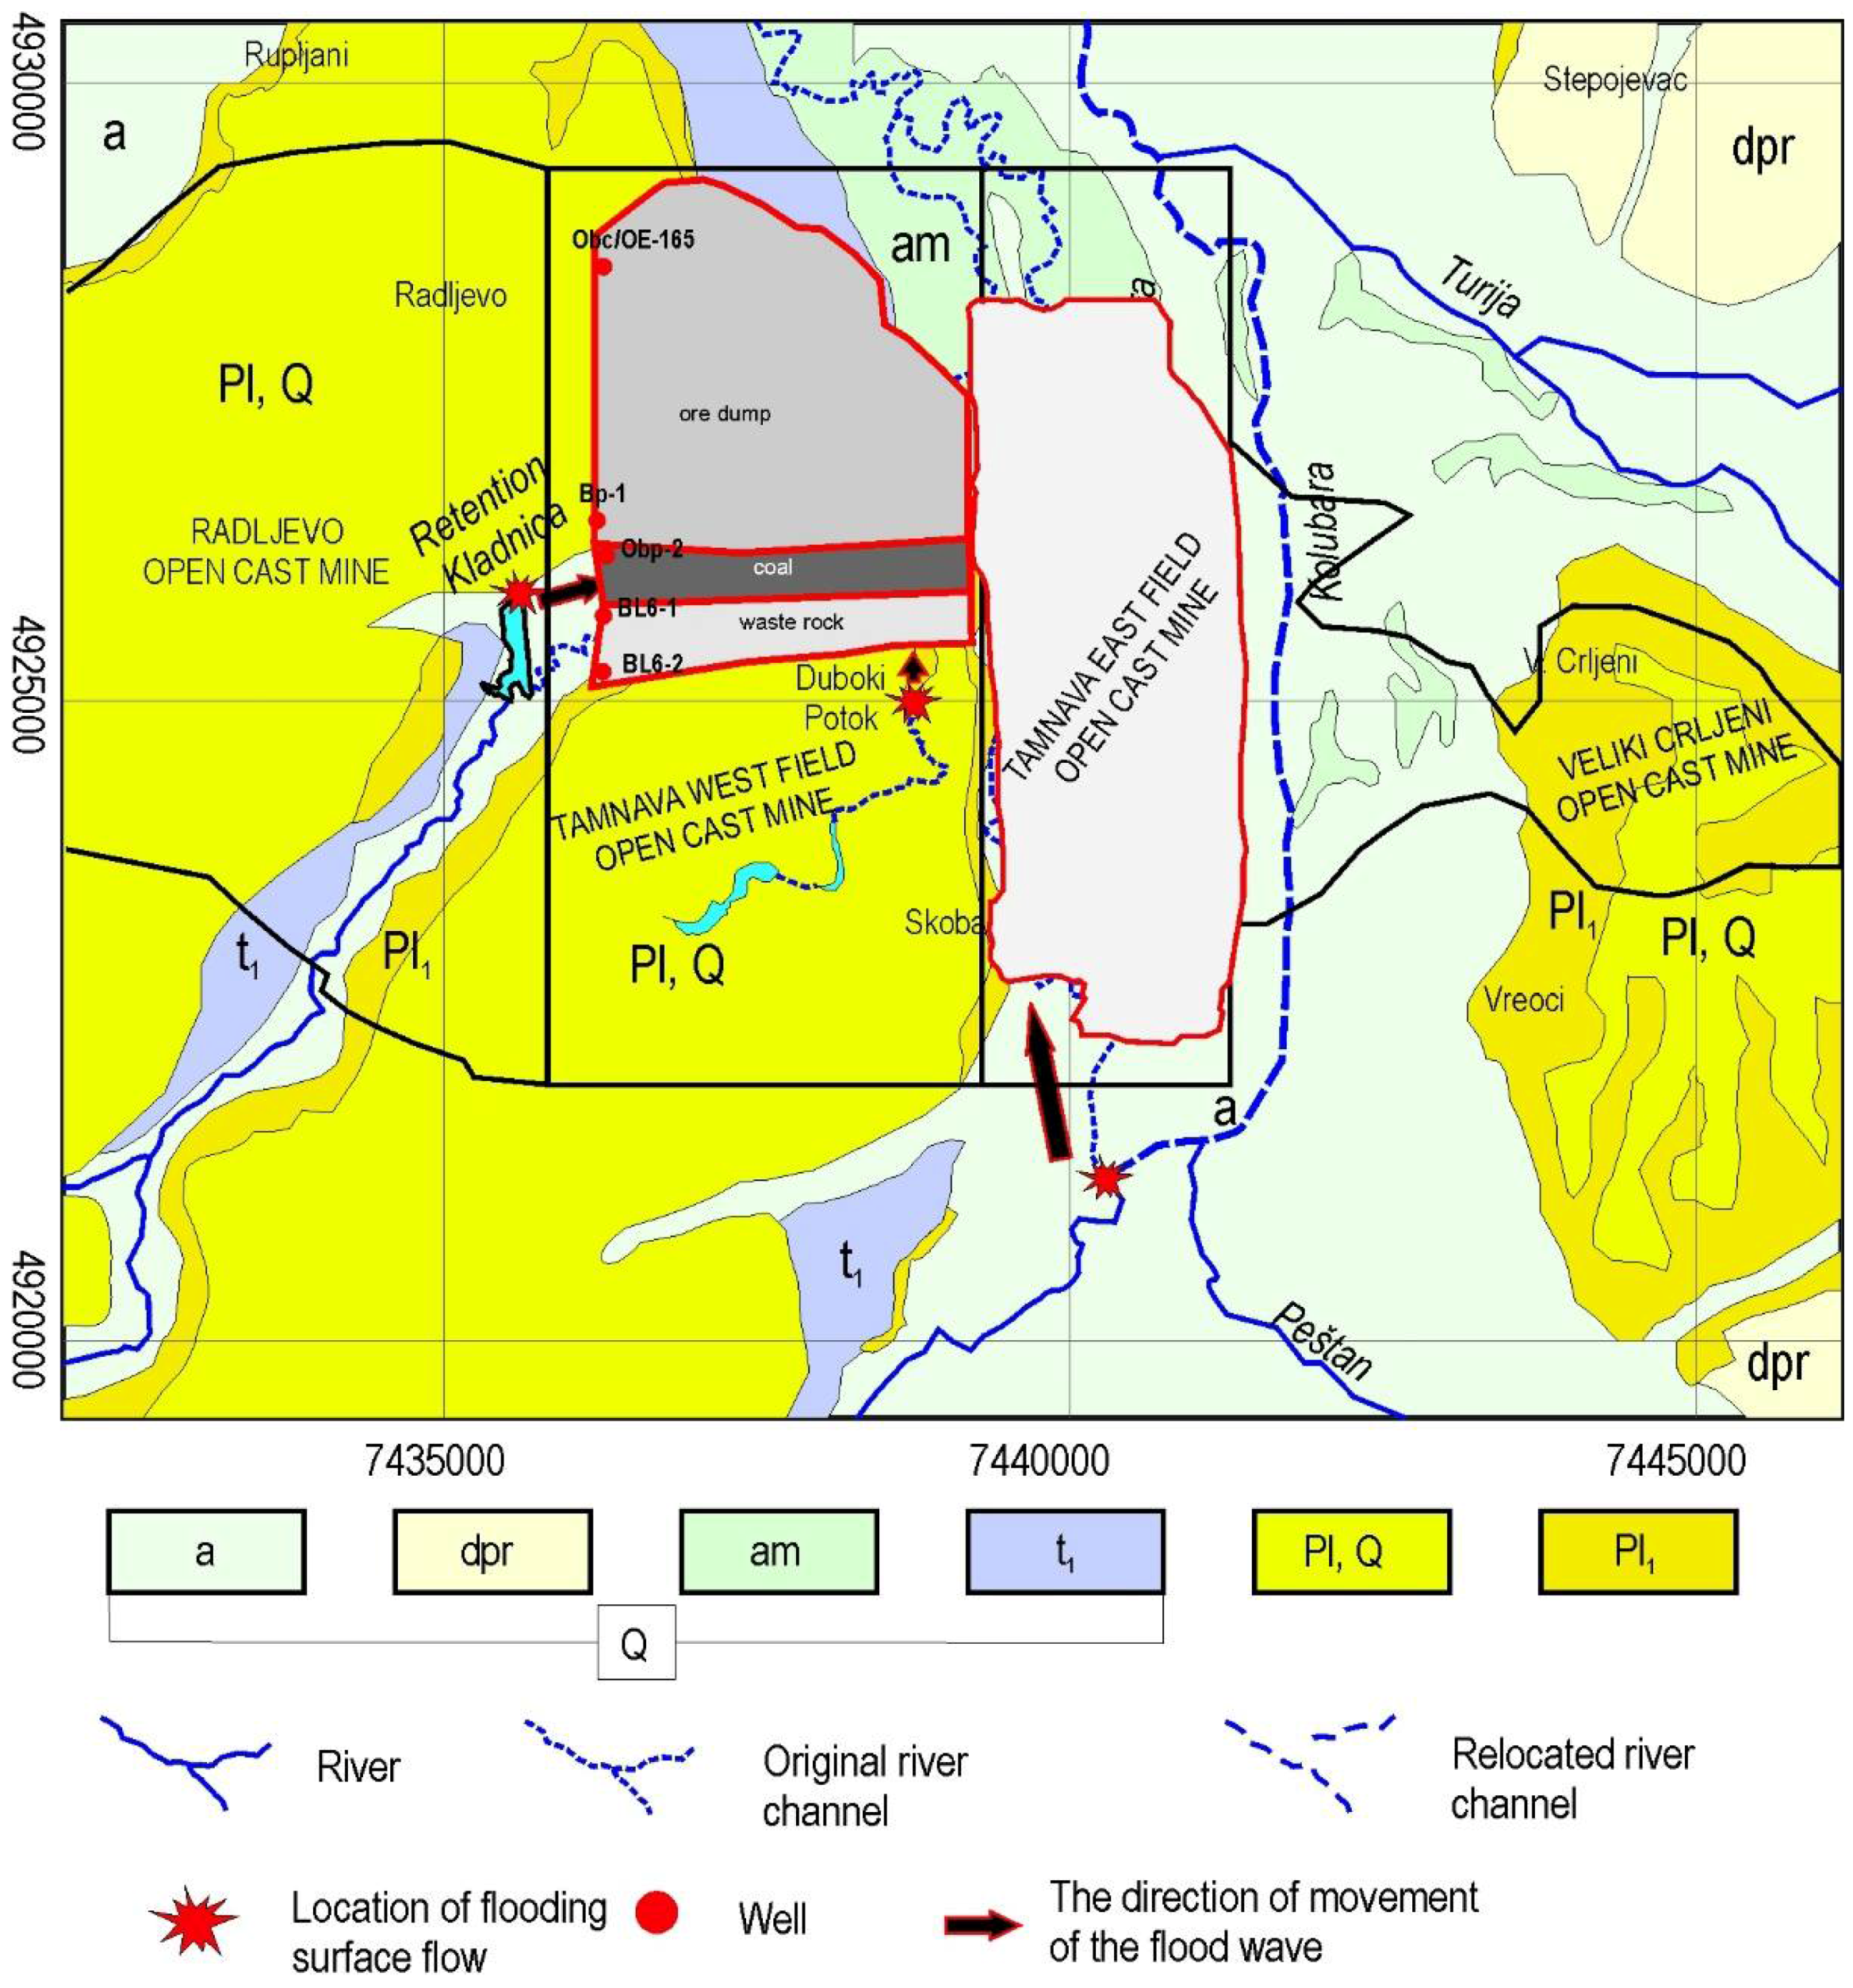
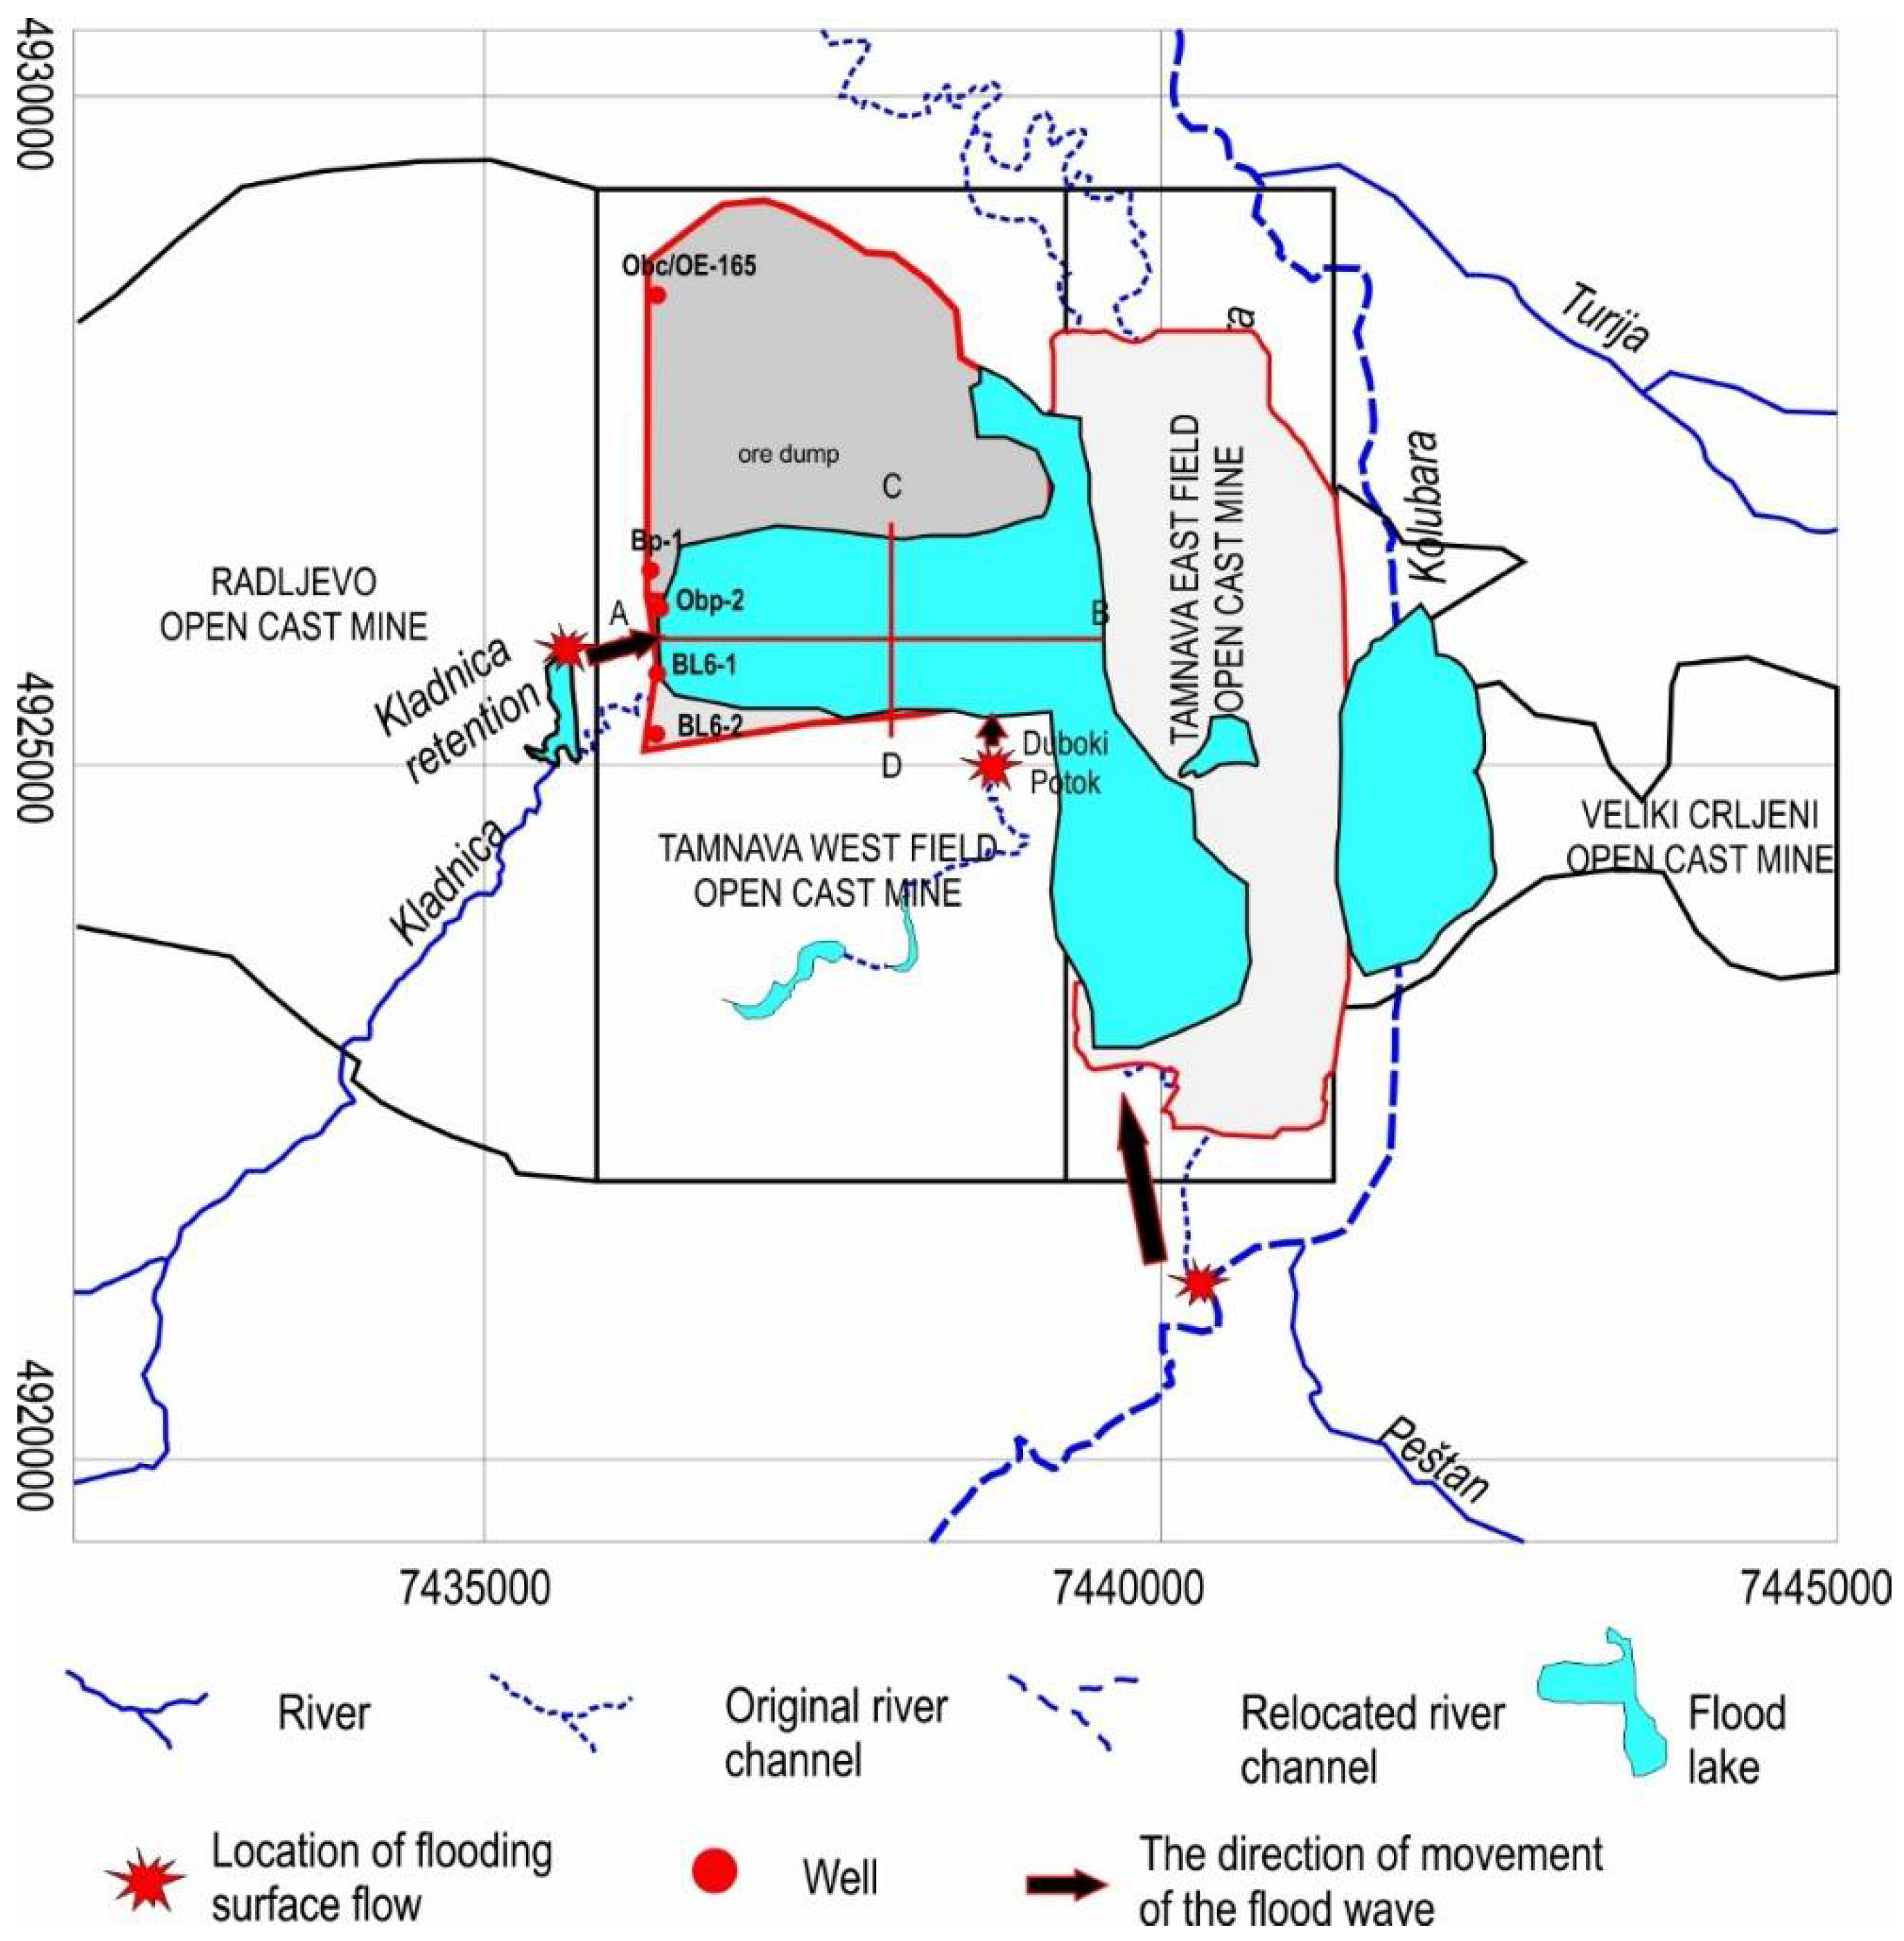
As a result of the heavy rainfall, on 15 May the Kolubara River breached levees west of Vreoci (Figure 2) and altered its course, which reverted to its old channel. It flowed through the decommissioned open-pit mine Tamnava–East Field and from there to the active open-pit mine Tamnava–West Field. The average width of the newly-created river channel was 80–200 m. At the same time, the heavy rainfall and flood wave on the Kladnica River breached the northern part of Kladnica Dam (Figure 2), from where the water flowed west, directly to Tamnava–West Field. The same happened south of the mine, where a dam was breached on the Duboki Potok retention (Figure 2). All of the above resulted in the creation of a flood lake over Tamnava–West Field and Tamnava–East Field, whose surface area was 7,445,428 m2, the volume 187.39 hm3 and the largest depth 66.4 m [3]. In only a few hours, the flooded strip mines became the fourth largest artificial lake in Serbia.
Flooding of Tamnava–West Field, whose share in Serbia’s electric power output is more than 25%, resulted in record damage to the Electric Power Industry of Serbia, which reported a loss of about €30 million each month during that time. According to World Bank estimates, flooding of this open-pit mine resulted in a total loss of €488 million. Serbia’s gross domestic product was 1.2% lower in 2014 because Tamnava–West Field was out of commission for seven months [2].
The flood lake at Tamnava–West Field caused the water table to rise in the extended area of the mine, which had previously been lowered to a predefined elevation to prevent groundwater from interfering with mining operations. The hydraulic link between surface water and groundwater was enhanced by water collectors on the bottom of the pit, which had been used for dewatering. The flood lake, while in place, actually recharged the major aquifer in the area—the so-called lower aquifer. The area of Tamnava–West Field is the most complex example and also the only location in Serbia where the impact of the historic May 2014 flood on the groundwater regime was documented.
Many scientists across the world have studied floods and their impact on groundwater regimes, as well as developed methodologies for addressing flood-related issues. Milzow et al. presented a hydrologic model that defines groundwater and surface water interactions and proposed a management plan—key issues of sustainable wetland management in Botswana (Okavango Delta) [4]. The same area was also studied by Linn et al., who examined groundwater and surface water interactions in terms of aquifer recharge on account of surface water during annual flooding [5], while Ramberg et al. assessed the water balance of a seasonal floodplain [6]. Gotkowitz et al. presented an extreme case of a groundwater flood of a river terrace and an extreme water table rise caused by heavy rainfall [7]. Their paper describes a case study of unconfined sand-and-gravel aquifer recharge as a result of rainstorms that caused spread flooding across the US Midwest. Wu et al. discussed groundwater and surface water interactions in terms of hydraulic conductivity variation, providing a comparative analysis of sediments before and after the flood season [8]. Mosquera-Machado & Ahmad described flood hazard modeling and addressed the problem of assessing flood risks, where flood hazard maps were the end result [9].
Costabile and Macchione used numerical models to simulate flood propagation in a compound channel [10]. Haltas et al. discussed numerical modeling of the propagation and spread of a flood wave for various dam scenarios in two different urban areas of Turkey [11]. Their paper highlights a methodology for predicting a flood wave after a dam breach and analyzes downstream propagation.
Westbrook et al. described overbank floods and discussed the role of dams in groundwater/surface water interactions [12]. Wang et al. studied changes in the depth and quality of a regional shallow aquifer in China, following a major flood, and examined pre- and post-flood records of water table depth and groundwater chemistry [13]. Ghazavi et al. assessed and described variations in groundwater recharge and groundwater quality along an ephemeral stream modified by the propagation of flood waters [14]. Shekhar & Prasad presented a case study of groundwater management options, where flood water was used to recharge groundwater (an aquifer) [15]. Goes presented a groundwater balance of Hadejia-Nguru Wetlands (Nigeria) and studied aquifer recharge on account of flood water, concluding that recharge from annually inundated floodplains was the source of a groundwater mound [16]. Many authors have also discussed groundwater flood risk management. Hughes et al. described groundwater flooding in winter 2000/2001 using a study of the Chalk aquifer underlying the Pang and Lambourn catchments in Berkshire (southern England) [17]. Naughton et al. developed flood hazard maps which represents contribution in the assessment and management of groundwater flood risk in Republic of Ireland [18]. Cobby et al. discused on feasible techniques, available data and limitations for producing groundwater flood maps that could meet the requirements of the EU Floods Directive and advances in data collection and flood warning [19]. Falconer et al. showed a new approaches in flood warning, mapping and risk management and method for identifying locations most susceptible to pluvial flooding has been proposed [20]. Gomes Miguez et al. applied a hydrological-hydrodynamic model for urban flood modeling in a lowland area of the Venetian continental plains [21]. Cuellar & McKinney developed a decision-making methodology in floods risk management for glacial lake outburst areas [22].
Typical case studies of these interactions from Serbia and other parts of the world, as well as of flood propagation and flood hazard simulation, are reported by many authors. For example, Brawner described methods of control of groundwater in surface mining [23]. Zaidel et al. used hydrodynamic modeling for estimation of seepage into underground mine workings and simulate steady-state groundwater flow from different types of rock into a vertical shaft, a horizontal drift, a ramp, two parallel drifts and a combined system of a vertical shaft connected to a horizontal drift [24]. Polomčić et al. and Bajić & Polomčić used hydrodynamic modeling for simulation of groundwater regime and design of groundwater control systems and describe groundwater management scenarios for the Buvač open-cast mine (Bosnia and Herzegovina) until the projected end of mining [25,26]. Morris et al. developed a two-dimensional hydraulic model and described groundwater flood risk mapping in the case of unconfined aquifers [27]; the approach recognizes the synergies between surface water flooding and groundwater flooding once groundwater has emerged at the surface. Patro et al., Pradhan & Youssef and Chen et al. conducted flood susceptibility analyses using hydrologic and hydrodynamic models [28,29,30].
2. Study Area
The study area is the extended zone of the open-pit lignite coal mine Tamnava–West Field. It belongs to the Kolubara Coal Basin (Figure 2), which occupies a land area of about 600 km2. The study area is located about 50 km northwest of Serbia’s capital Belgrade (Figure 1). It spreads along the middle and lower courses of the Kolubara River and its tributaries. To the west and south, Tamnava–West Field borders on the open-pit mine Radiljevo, to the east on the decommissioned open-pit mine Tamnava–East Field (Figure 2), and to the north where the coal beds naturally lense out. Figure 2 also shows the route of the original riverbed and relocated river channel. Relocation of the river channel is a normal consequence of the progression of the open cast mine.
2.1. The Geological and Hydrogeological Settings
The geologic framework of Tamnava–West Field is comprised of Paleozoic and Mesozoic strata in the paleo relief, whereas the coal basin itself is made up of Quaternary and Tertiary (Neogene-Pliocene) sediments. These deposits in the extended zone of the study area (Figure 2) include alluvial and terrace riverine-lacustrine sediments composed of medium-grain gravels and sandy gravels (river terraces and alluvial plains—sediments deposited by the Kolubara, Kladnica, Turija and Peštan rivers). There are also other sediments, such as diluvial-proluvial and oxbow deposits—silty clays and local bog clays (alluvial plains). These sediments cover the highest, hilly, parts of the terrain in the study area, in the zone of riverine-lacustrine terraces, where they are as thick as 30 m or fill alluvial plains along the rivers, up to a depth of about 7 m. Quaternary sediments lie discordantly over Pontian strata (Pl1). The floor of the coal sequence at Tamnava–West Field is comprised of quartz sands, 100 to 120 m thick.
The coal sequence includes two primary coal beds, which in places feature sand and coaly-clay interbeds of different thickness and lateral spread. The thickness of the productive coal sequence is highly variable and increases from the east to the west, and from the north to the south. The average thickness in the study area is about 33 m. The roof of the coal sequence is made up of Upper Pontian and Quaternary sediments and is 7.5 to 72.3 m thick.
In the extended zone of the study area there is a triple aquifer system, comprised of the upper aquifer, intermediate aquifer and lower aquifer. All three aquifers are confined/subartesian.
The upper aquifer is largely comprised of alluvial and riverine-lacustrine terrace gravels of non-uniform grain-size distribution both vertically and horizontally. There are fractions ranging from clay to 50 mm pebbles. According to previous pumping tests at wells that tap the alluvial gravels, the hydraulic conductivity is from 6 × 10⁻⁵ to 6 × 10⁻⁴ m/s [31].
The intermediate aquifer at Tamnava–West Field features sands and two primary coal beds. The sands spread beyond the mine, to the northwest, where they connect with the sands of the lower aquifer. The thickness varies, from 30 m in the northwestern part of the mine to zero, where the sands completely lense out in the northeast. The grain-size distribution of the intermediate aquifer is relatively homogeneous both vertically and horizontally, and comprises fine- and medium-grain sands whose hydraulic conductivity is about 10−5 m/s [31]. Coal beds make up the roof and floor of the intermediate aquifer. In the northern part of the mine, the intermediate aquifer joins the upper aquifer.
The lower aquifer at Tamnava–West Field is comprised of Late Pontian quartz sands. These sands span nearly the entire Kolubara Coal Basin. They are relatively homogeneous at Tamnava–West Field. Two zones can be distinguished along the vertical: the top layer is 20–30 m thick and comprised of coarse sand, with a hydraulic conductivity of (3–4) × 10−5 m/s, whereas the bottom layer is 70–80 m thick and the hydraulic conductivity is (1–2) × 10−5 m/s [31]. Their homogeneity and isotropy are only disturbed by coaly-clay interbeds. The floor is comprised of coal seams, followed by Miocene fine sand, silt and clay.
There is a groundwater-based source of public water supply, Kalenić, at Tamnava–West Field. The original function of the Kalenić wells was to protect the mine from groundwater arriving from the west. Over time, these wells acquired a drinking water supply function, for nearby communities and industrial facilities. Kalenić is currently comprised of 13 drilled wells, 115–151 m deep, but only five are operational (Figure 2) and jointly deliver about 45 L/s.
2.2. Groundwater Regime
Groundwater monitoring was conducted from April 2013 to December 2015 and included the water table, well discharges at the Kalenić source, operation of the water collectors on the bottom of the pit, water levels of the flood lake, rainfall, and stages of the Kolubara River.
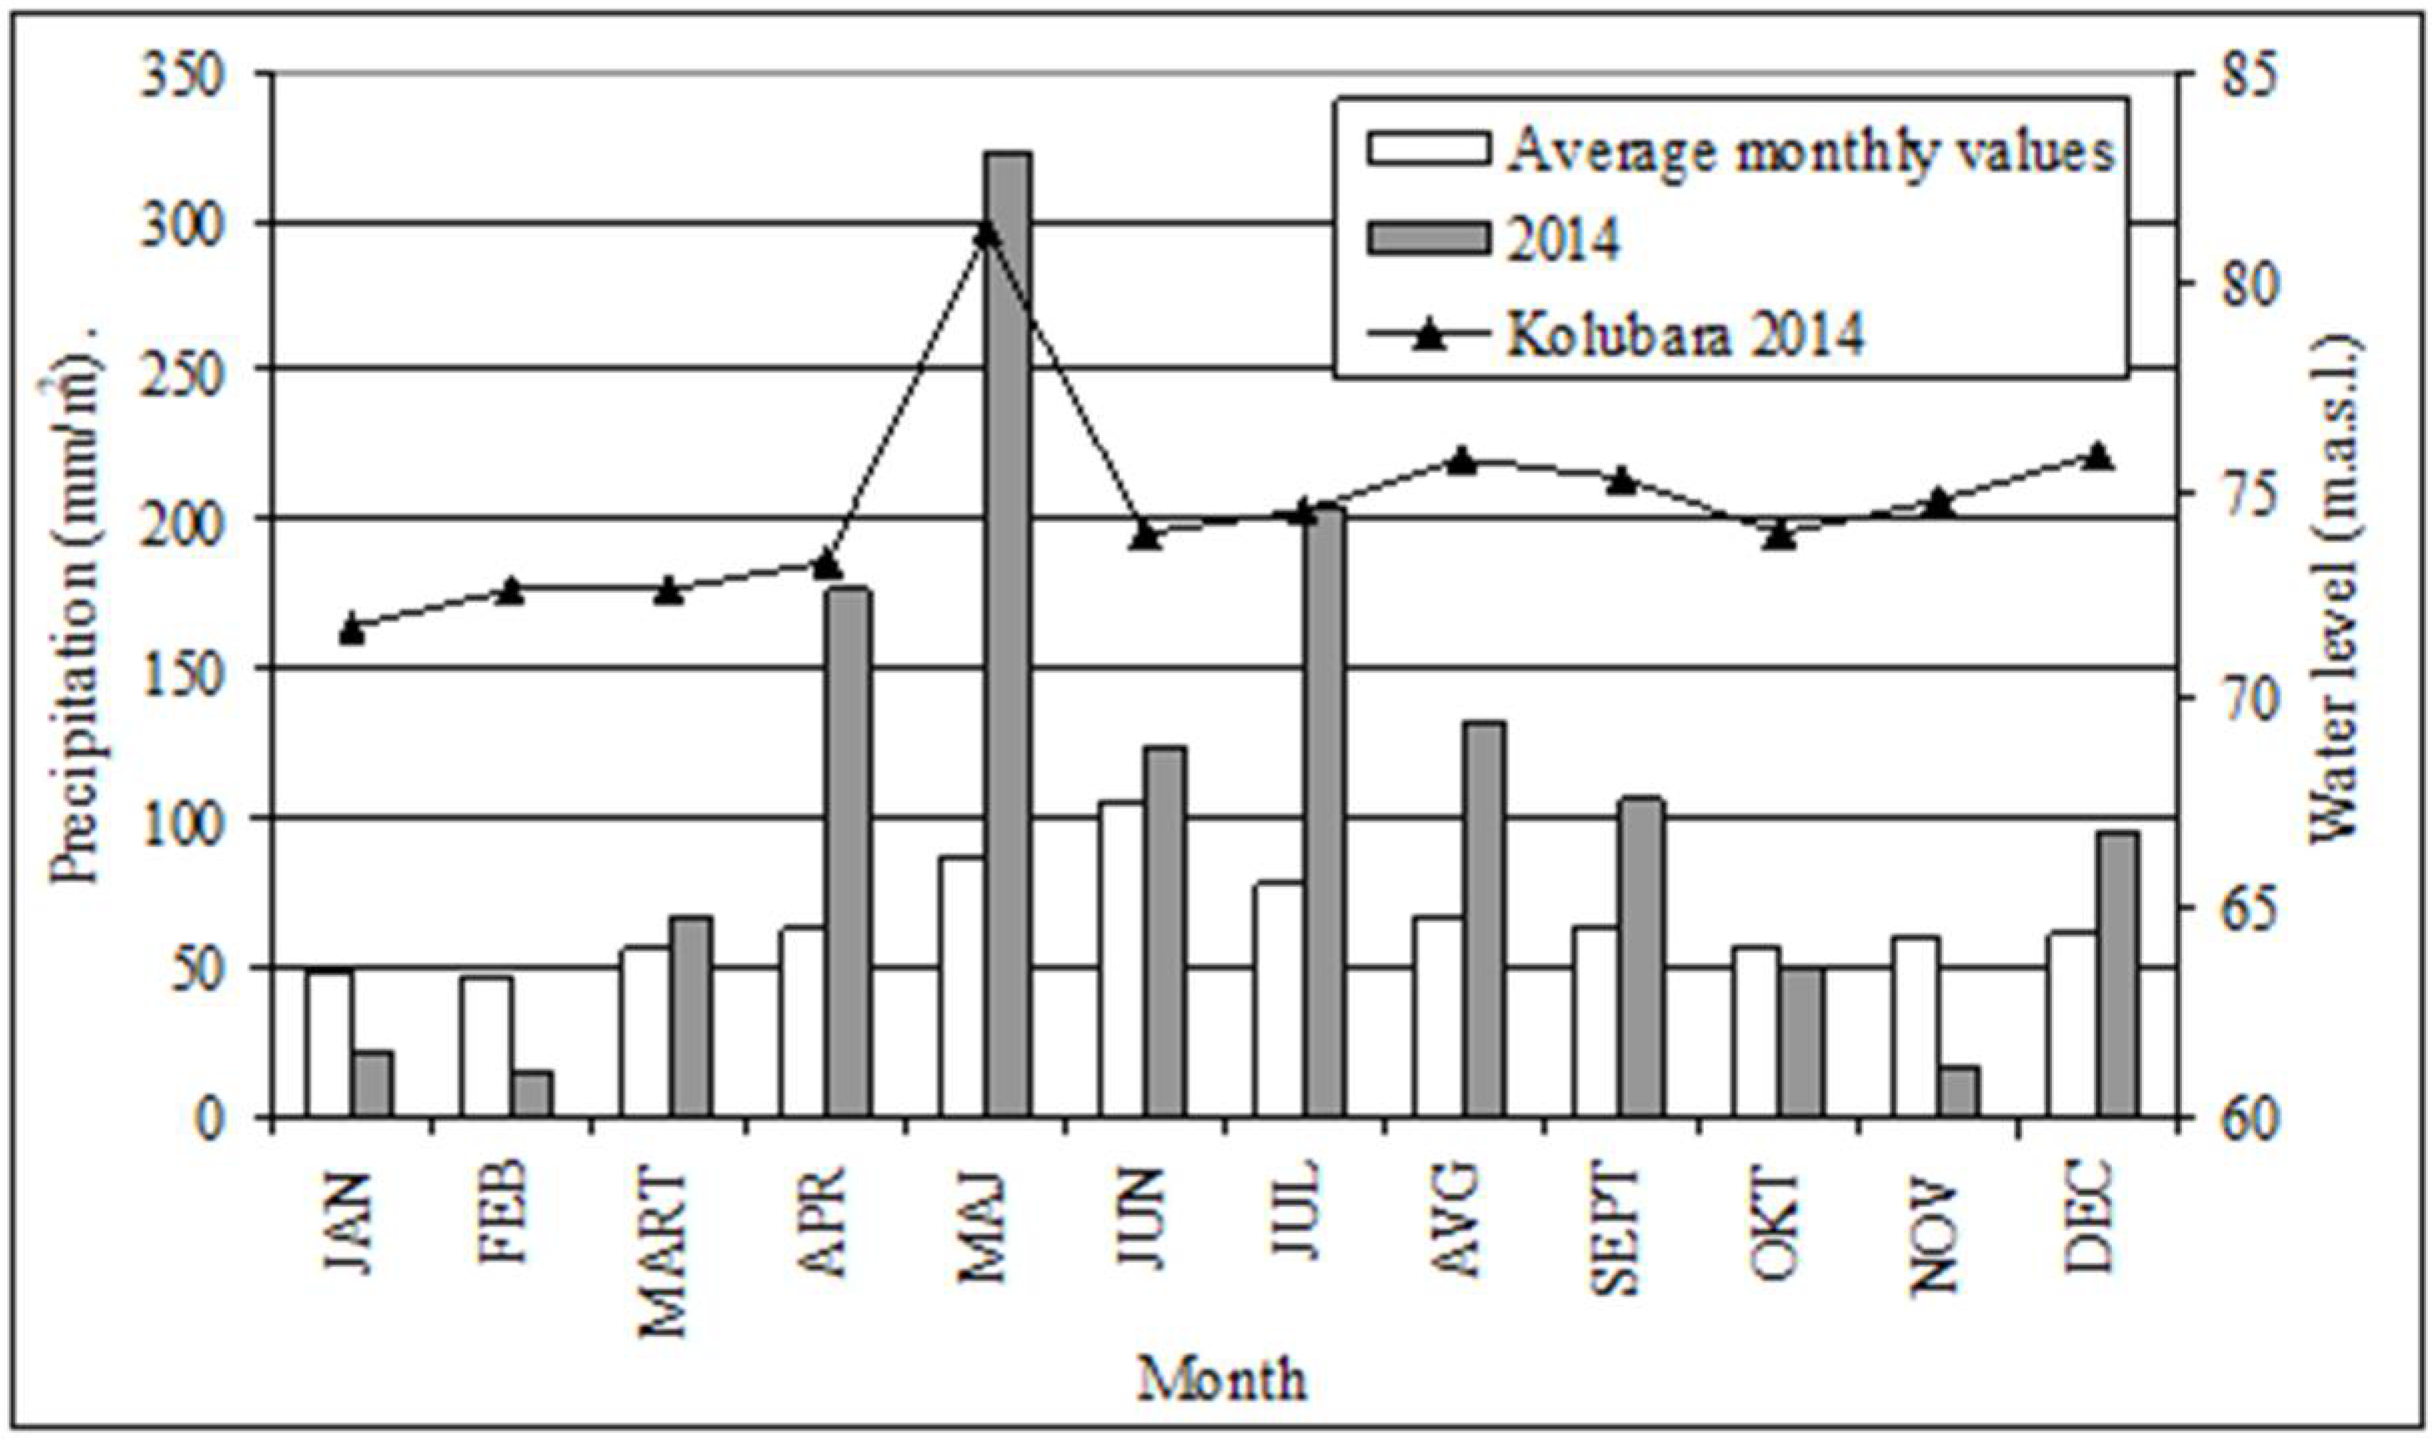
Figure 3 shows monthly average amounts of precipitation in 2014 relative to monthly averages for the period 1961–2013, recorded by the closest weather station at Valjevo, 55 km southwest of a river gauging station at Draževac. It also shows monthly average stages of the Kolubara in 2014. The annual precipitation in 2014 was 68.5 higher than the average for the period 1961–2013. In April 2014, the amount of rainfall was 2.81 greater than the average, and in May 3.68 times greater than the respective average. July and August also recorded absolute maximum rainfall levels. A strong Pearson correlation coefficient of R = 0.764 was established between precipitation and the 2014 stages of the Kolubara, given the distance between the monitoring stations.
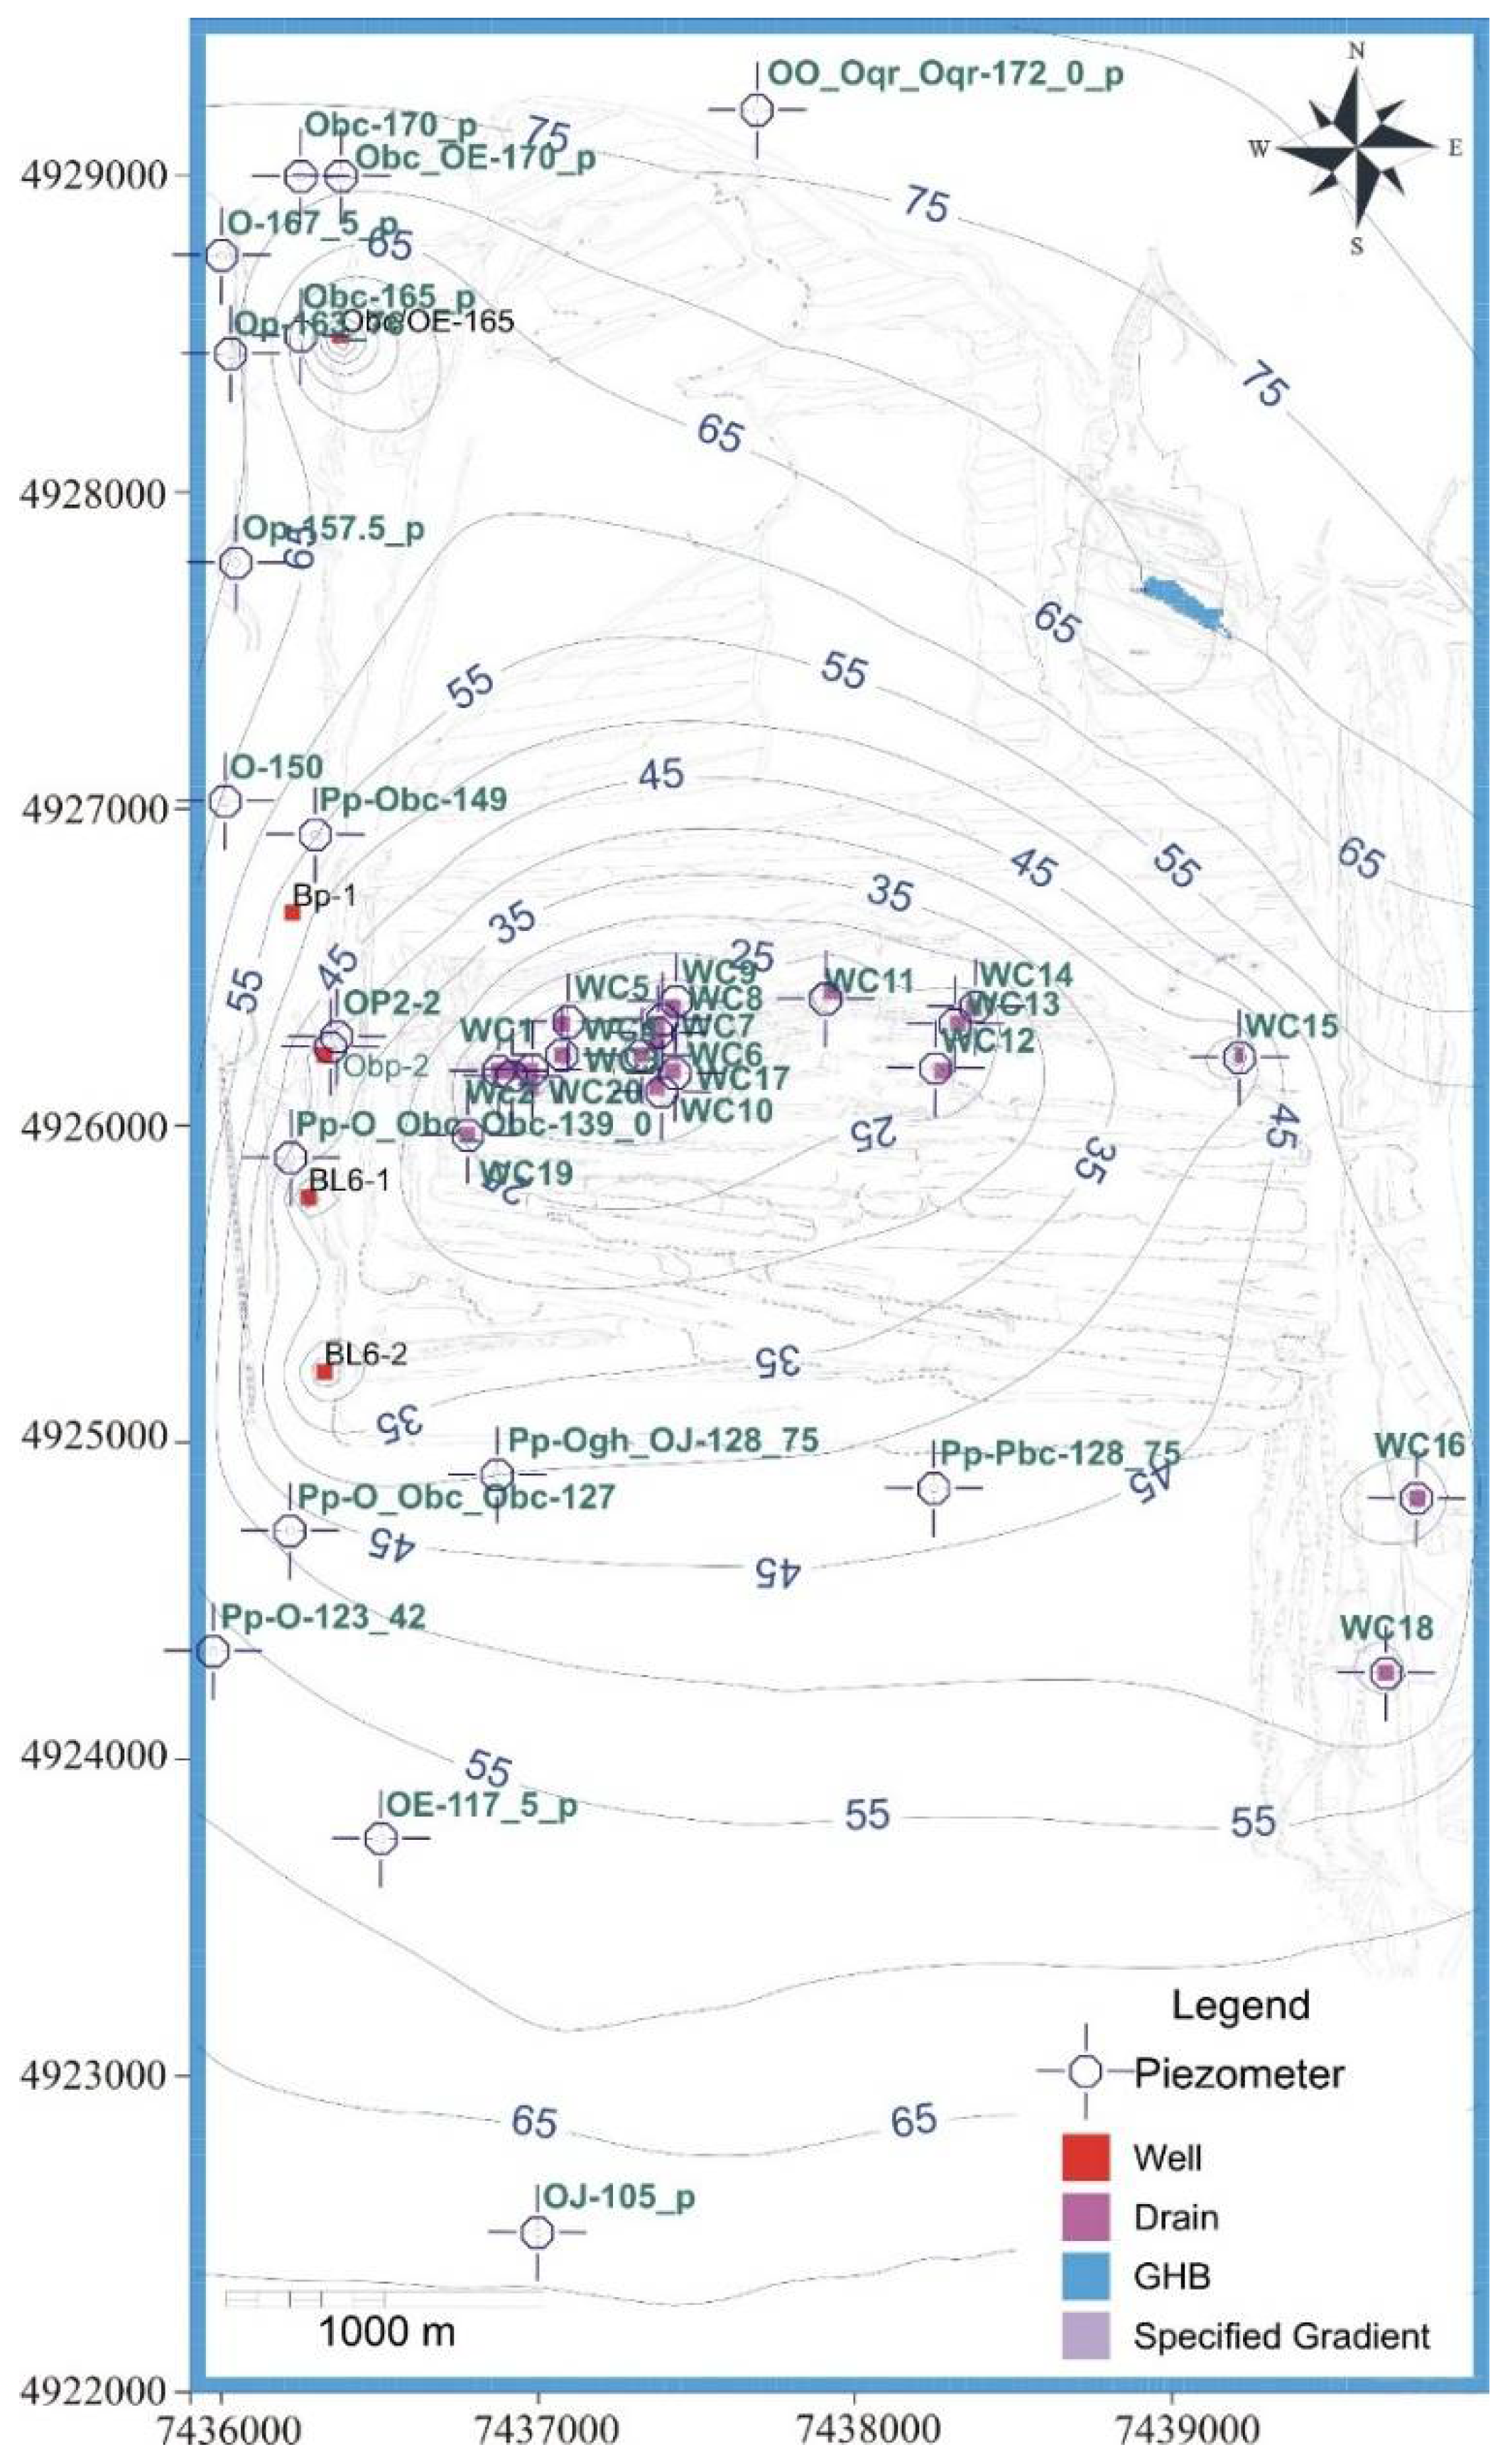
Groundwater in the extended area of Tamnava–West Field is monitored monthly, by observing piezometers. In addition, well discharges and water levels are recorded at Kalenić. Groundwater monitoring ceased after the May 2014 flood and the creation of the flood lake. A large number of the piezometers were plugged up or destroyed, while others were inaccessible for the duration of the flood lake. As a result, groundwater was monitored continuously at only 20 of the initial 116 piezometers, from April 2013 to June 2015, and at seven until the end of December 2015. Seven of the 20 piezometers are located beyond the modeled area, at Radiljevo Polje, along its western border with Tamnava–West Field (NO-120, No-130_85, Nqr_O-175_p, NqrP-125, Pp_Nqr-138.18, Pp-Nlm_NO-139.46 and Pp-Nqr_O-149). In addition to supporting assessment of the groundwater regime, these seven piezometers were used in the model to specify boundary conditions along the western contour of the mine pit. The study area is the only location where groundwater was monitored during the flood event in Serbia. Figure 4 shows groundwater levels recorded by piezometers and water levels of the flood lake, and Figure 5 presents histograms and water level plots of the Kalenić wells from 21 November 2013 to 15 January 2015.
The results of monitoring of the Kalenić source from 21 November 2013 to 15 January 2015 are shown in Figure 5. Individual well capacities range from 2 to 10 L/s. Wells BL6-1 and BL6-2 measure the highest discharge.
According to Figure 4 and Figure 5, the observed groundwater regime can be divided into three characteristic periods:
- First, up to the time of creation of the flood lake in the mine pit (April 2013 to April 2014);
- Second, from the time of creation of the flood lake to the time of recording of the initial water table decline as a result of drainage of the flood lake (May–September 2014); and
- Third, during which the flood lake was continuously drained, up to the time monitoring ceased (October 2014–December 2015).
2.2.1. First Period (April 2013 to April 2014)
Characteristic of the first period of the groundwater regime is that it reflected routine mining at Tamnava–West Field and continuous operation of the mine dewatering system and the Kalenić source. The groundwater regime was determined by local changes in discharge rates of the dewatering system. On the bottom of Tamnava–West Field there are water collectors emplaced in the lower aquifer, which maintained the water table at an average elevation of about 14 m above sea level. Before the May 2014 flood, the effect of the Tamnava–West Field dewatering system and the Kalenić source on the lower aquifer was reflected in a permanent drawdown.
2.2.2. Second Period (May 2014 to September 2014)
The second period began after the heavy rainfall that breached levees along the Kolubara and caused the river to revert to its natural channel and fill up the open pit of the Tamnava–West Field mine. Kladnica Dam in the northern part of the study area was also breached and the water from the catchment area flowed to the open pit as well. There was a similar occurrence at the Duboki Potok retention in the south (Figure 6).
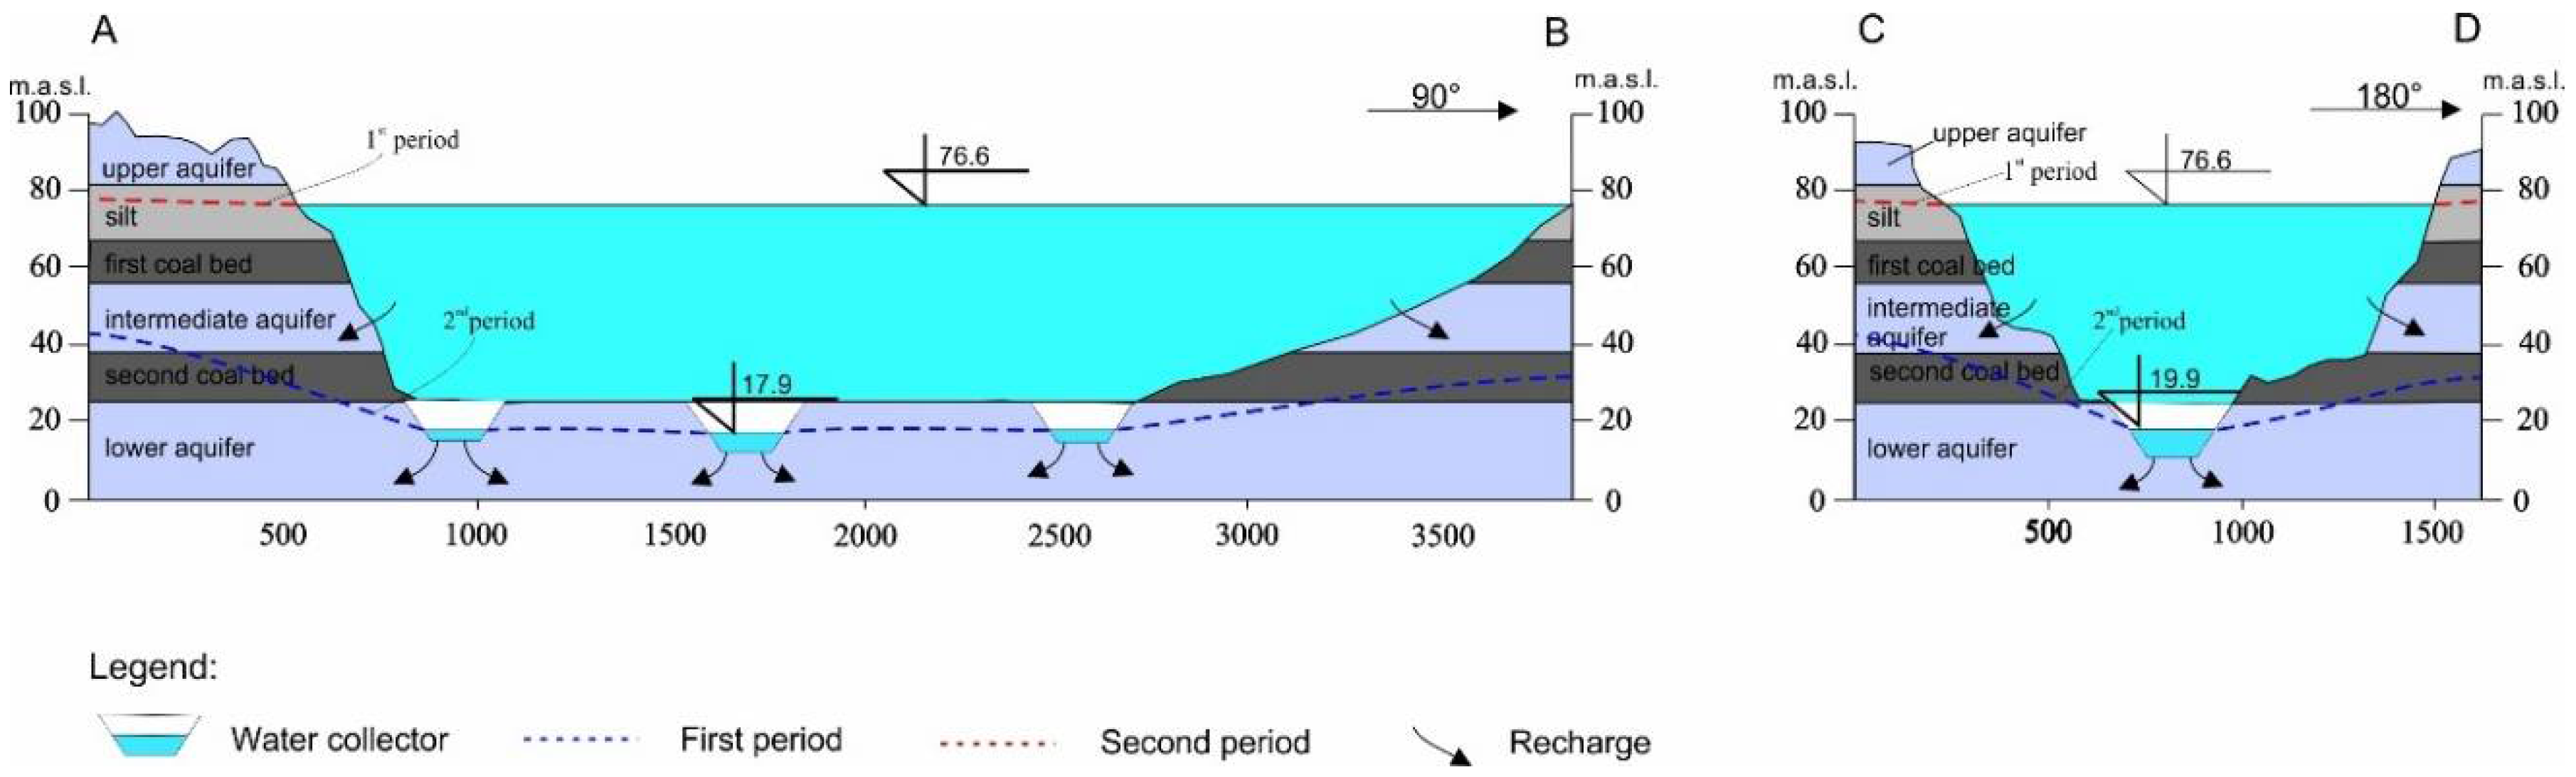
After the creation of the flood lake, lignite coal extraction from the pits ceased for quite a long time. The mine dewatering system was out of commission. Consequently, the water table began to rise and the trend continued throughout this period. A direct hydraulic link between the flood lake and groundwater was established via the water collectors at the lowest coal bench of Tamnava–West Field, which are emplaced in the lower aquifer (Figure 7). During the course of mining, the water level in these water collectors had been maintained at 10–18 m above sea level, or 14 m on average. Apart from the water collectors, while the flood lake was in place, groundwater was also recharged via flooded working benches in the sand interbeds.
Flooding of Tamnava–West Field also included a large number of piezometers. Groundwater levels were recorded by only 20 units throughout the second period of the groundwater regime. These piezometers were located along the western contour of the mine, towards the open-pit mine of Polje Radljevo.
Flooding of the mine caused a rapid rise of groundwater levels of the intermediate and lower aquifers. A comparison of 2013 and 2014 data revealed that the water table along the western contour of the mine rose by as much as 25 m or more (Figure 4). In addition, the wells of the Kalenić source were out of commission for more than two weeks (Figure 5).
Also, samples were taken for thorough chemical analyses in order to monitor groundwater quality (29 May 2014 and 19 July 2014) from well BL6-2 [3]. By comparing the basic and several specific chemical parameters (ions Ca2+, Mg2+, Na+, SO42−, Cl−, Fe, Mn, Al, As, Zn, Pb, cyanides, phenols, detergents and fats and oils) the analyses did not show any drastic changes in the chemical properties of groundwater, apart from a slight increase in ions of SO42−, Cl−, Pb and cyanides. It directly shows the stability of the aquifer regime, although it should definitely not be taken at face value since the sample originates from a single well only.
2.2.3. Third Period (October 2014 to December 2015)
In the third period, the water table declined as a result of continuous dewatering of the flood lake created over the open-pit mines. Twenty pumps (capacity 7000 m3/h each and 140,000 m3/h total, or 3,360,000 m3/day) had been installed for that purpose. Water was evacuated by more than 7500 m of pipes (diameters 800 and 1000 mm). Through to the end of 2014, some 114 hm3 of the water was removed, allowing mining operations to proceed but at only ¼ of full capacity of this largest lignite coal mine in Serbia.
3. Methodology
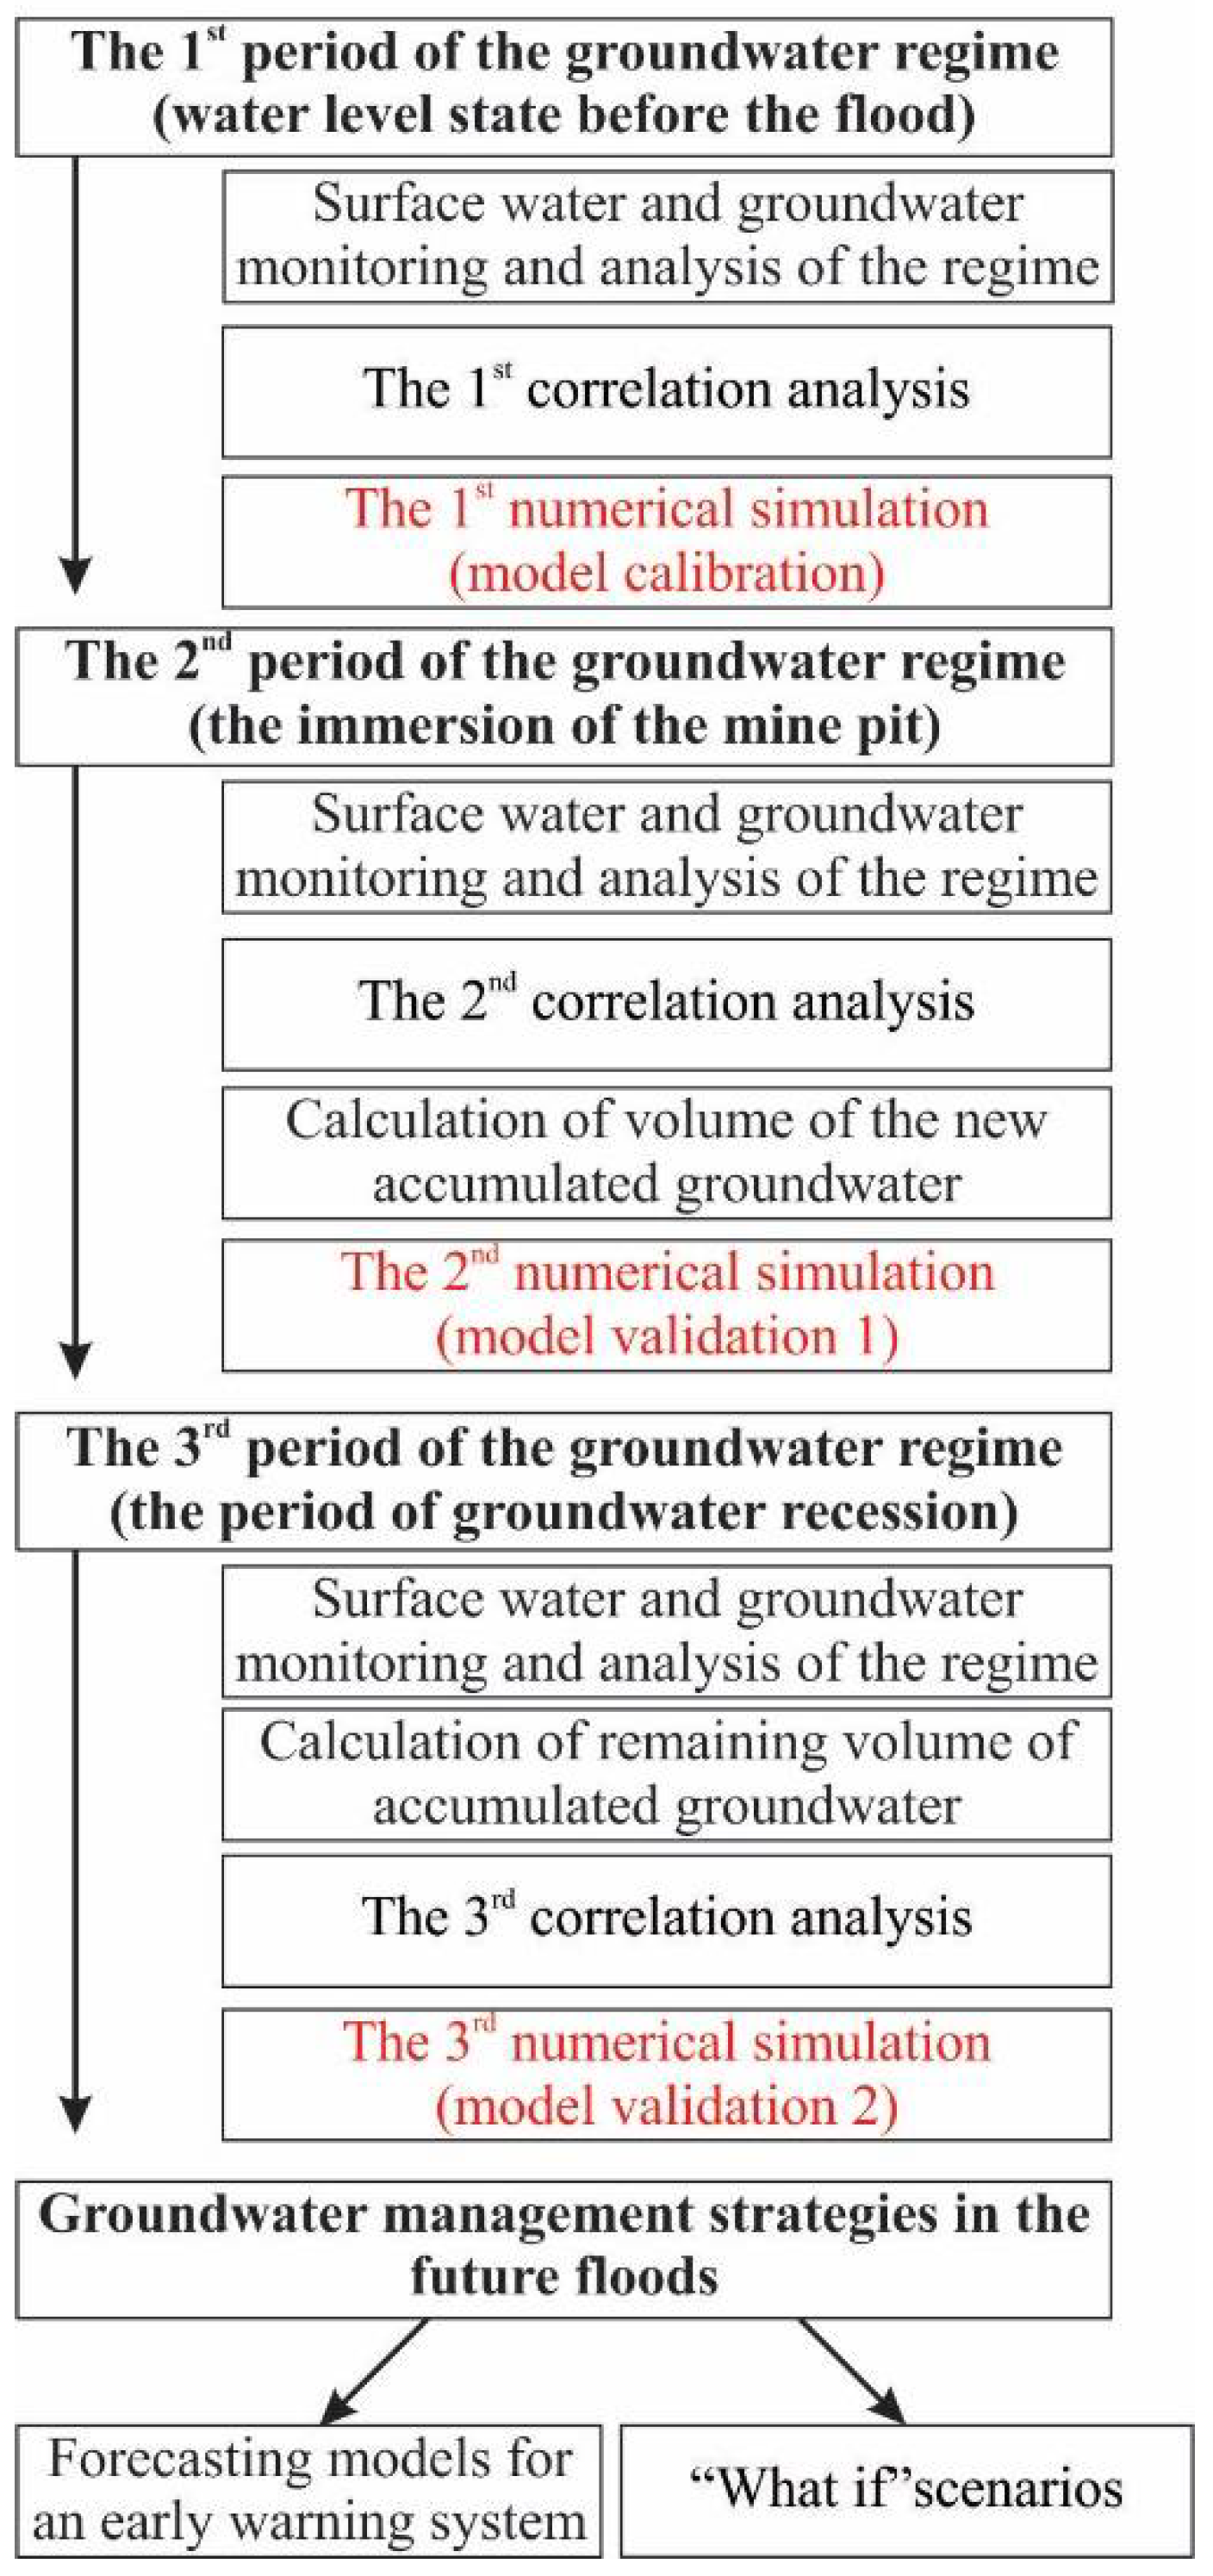
The developed methodology is presented in the operational algorithm of the exploration (Figure 8). It is based on the creation of a groundwater model (GWM) and a fate and transport model (FTM), though an FTM was not created in this paper due to a lack of data. A basic model is created and calibrated for groundwater states that existed prior to the floods (in the defined example and the flooding of the open-pit mine). In the conditions in which the flood wave occurred, an evaluation of the realized hydraulic link between surface and groundwater is made based on surface and groundwater level monitoring, the volume of the ‘new’ groundwater as a consequence of floodwater inflow is determined, chemical analyses are performed on samples of groundwater and the first verification of the created models is done (on the level of groundwater and the balance or concentration of certain parameters of groundwater chemical composition). The second (control) verification of the model corresponds to the period of surface water level decrease (in the defined example of open-pit mine dewatering). It is preceded by identical actions as with the first verification of the model. A doubly verified model (or models) enables appropriately reliable prognostic calculation of the effects of new floods on the groundwater level regime of a certain area and makes it possible to adopt a strategy for groundwater management in a certain area for future floods.
The hydrogeological research reported in this paper included the installation of a piezometer network, monitoring of groundwater levels at observation points within Tamnava–West Field, gauging of river stages of the Kolubara, recording of rainfall data from the nearest weather station, and monitoring of the operation of the Kalenić source. In addition, after the flood lake was created above the mine, its water levels were monitored as well. Groundwater and surface water regimes were observed from April 2013 to the end of December 2015. Precipitation data were collected from the National Hydrometeorological Service of Serbia’s weather station at Valjevo, located 20 km southwest of the open cast mine Tamnava–West Field.
The collected and synthesized rainfall, surface water and groundwater data were subjected to correlation analyses, to determine the interdependence of different variables (precipitation and river stage, surface water and groundwater levels, and, ultimately, measured and modeled groundwater levels).
Surfer v13 software (Golden Software, Inc. Golden, CO, USA) was used to calculate and display the difference between groundwater levels before and after the flood, and to compute the residual groundwater as a result of flooding of the mine and artificial recharge of the aquifer in the study area.
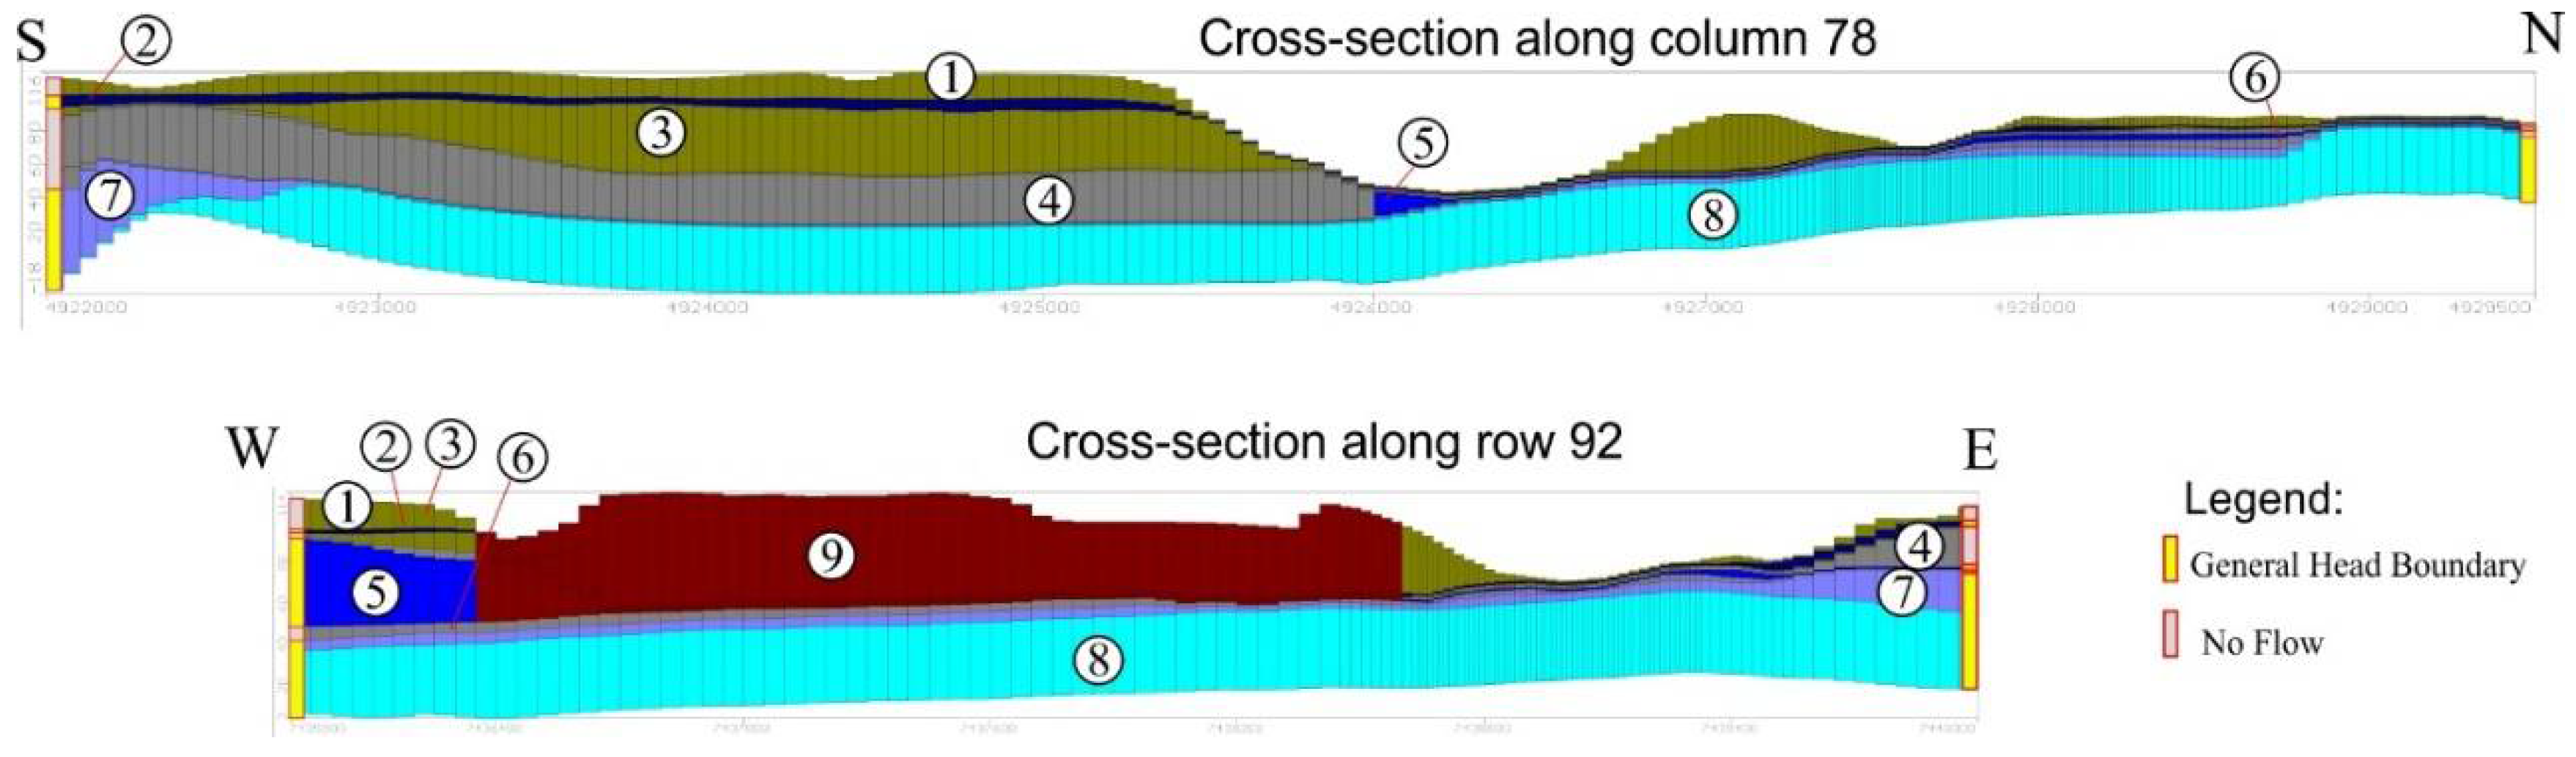
The method used to determine the impact of the flood on the groundwater regime in the study area was hydrodynamic modeling. The development of hydrodynamic models of the aquifer regime in the area of an open-pit mine provides insight into both the water balance and the surface water/groundwater interactions. The ModFlow code [32] with graphic user interface Groundwater Vistas, advanced version 64-Bit 6.74 b.24 [33] was used to develop a three-dimensional model of the study area, for the purposes of a hydrodynamic analysis. The hydrodynamic model of the extended area of Tamnava–West Field was designed and constructed as a multilayer model, comprised of eight layers along the vertical (Table 1). Each of the layers corresponds to a real layer, schematized and distinguished on the basis of knowledge of the terrain and the results of interpretation of field exploration. The input data used in modeling as well as the initial hydraulic conductivities of all the lithologic units were entered on the basis of previous hydrogeological investigations [34,35,36,37].
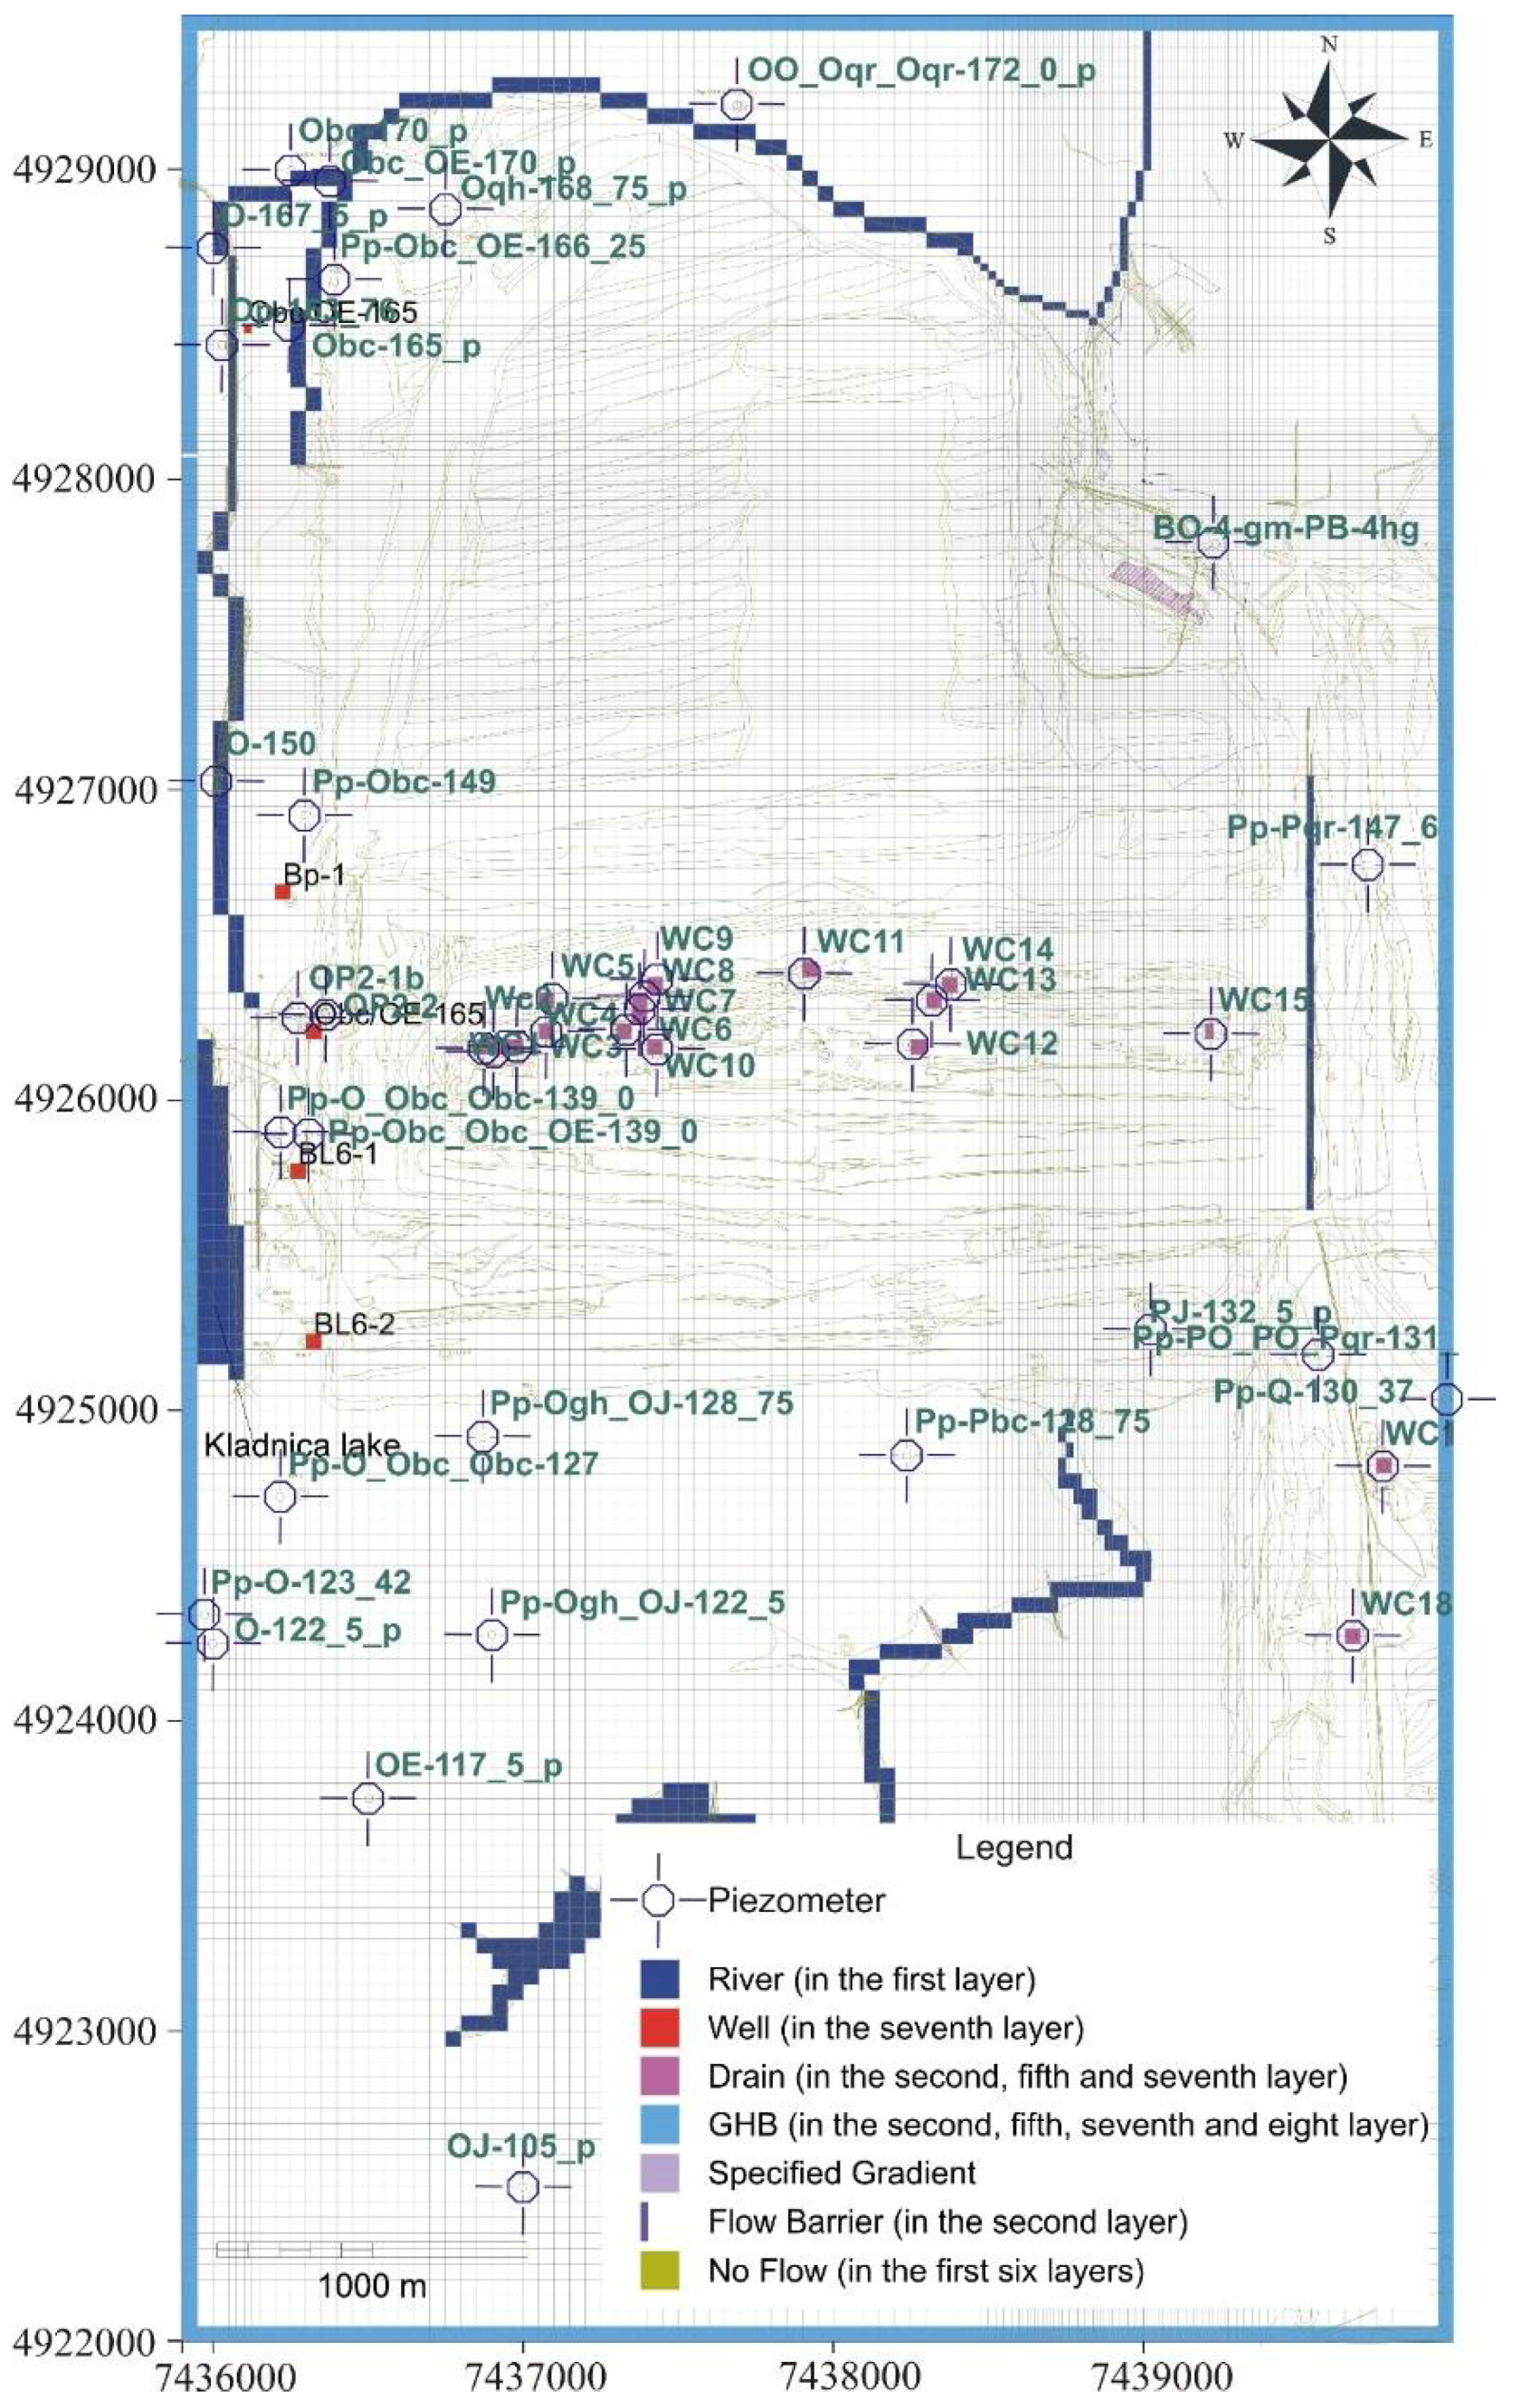
The basic dimensions of the matrix, which encompassed the extended zone of the study area, were 4000 m × 7500 m (or 30 km2). The flow field was generally discretized in plan form by 50 m × 50 m cells, with a higher density grid (12.5 m × 12.5 m) in zones of particular interest (Figure 9). The modeled area was divided by means of a grid of squares and rectangles, comprised of 223 rows × 135 columns, and 227,977 active out of a total of 240,840 model cells. Figure 10 shows the vertical discretization and spread of the lithologic units and aquifers.
A head-dependent flux boundary condition (Cauchy’s or mixed boundary condition) and a prescribed flux boundary (Neumann boundary condition) were used in the model (Figure 9 and Figure 10). The head-dependent flux boundary served to simulate the impact of surface water–the Kolubara River, the Kladnica retention and other retentions (Layer 1), leakage from the aquifers along the working benches of the open-pit mine (Layers 2 and 5), and the operation of water collectors on the bottom of the coal benches (Figure 5). In the ModFlow code, the simulation was performed using the river (or drain) boundary condition. By specifying head-dependent flux boundary conditions, the model simulated groundwater inflow into and outflow from the model (Layers 2, 5, 7 and 8). This was represented by a general head boundary (GHB).
The operating wells (at the Kalenić source) in the western part of Tamnava–West Field (Layers 2 and 7 in Figure 10) were assigned a “prescribed flux” boundary condition. With this type of boundary condition, the case of no flow was also specified (q = 0), i.e., selected cells were designated as “no-flow” cells in the ModFlow code. Under natural conditions, these zones are virtually impermeable (all boundary contours of the modeled layers comprised of semipermeable lithological units–Layers 1, 2, 3, 4, 5 and 6). The impermeable screen located in the western part of Tamnava–West Field, near the Kladnica retention, was simulated with a prescribed flux boundary condition (Neumann boundary condition), i.e., a flow barrier in the ModFlow code (Layer 2). Recharge was simulated by selecting a prescribed flux boundary condition in the first model layer only. This created an influx as the difference between total recharge and evapotranspiration.
The model of Tamnava–West Field was calibrated under unsteady flow condition, with a time step of one day. At lower iteration levels, the basic time step was divided into ten parts of unequal duration (factor 1.2). Groundwater flow was modeled and simulated as real flow, confined or unconfined, in each of the cells individually. The flow over time was varied on the model per real conditions.
The model calibration results were presented applying a single methodology: the piezometric head of the lower aquifer (the most important aquifer in the study area) at the end of the simulation period and the correlation between recorded and simulated groundwater levels at all observation points and of all aquifers, also at the end of the simulation period.
4. Results and Discussion
The water table data recorded by the piezometers and water collectors were used in the model calibration process, as target points of the flow field. The Tamnava–West Field groundwater monitoring data are related to the period from April 2013 and April 2014. The system of piezometers was comprised of a total of 116 units, of which 54 were in the upper aquifer, 22 in the intermediate aquifer, and 40 in the lower aquifer. Absolute water table elevations were also recorded at the water collectors, 13 in the upper and 18 in the lower aquifer.
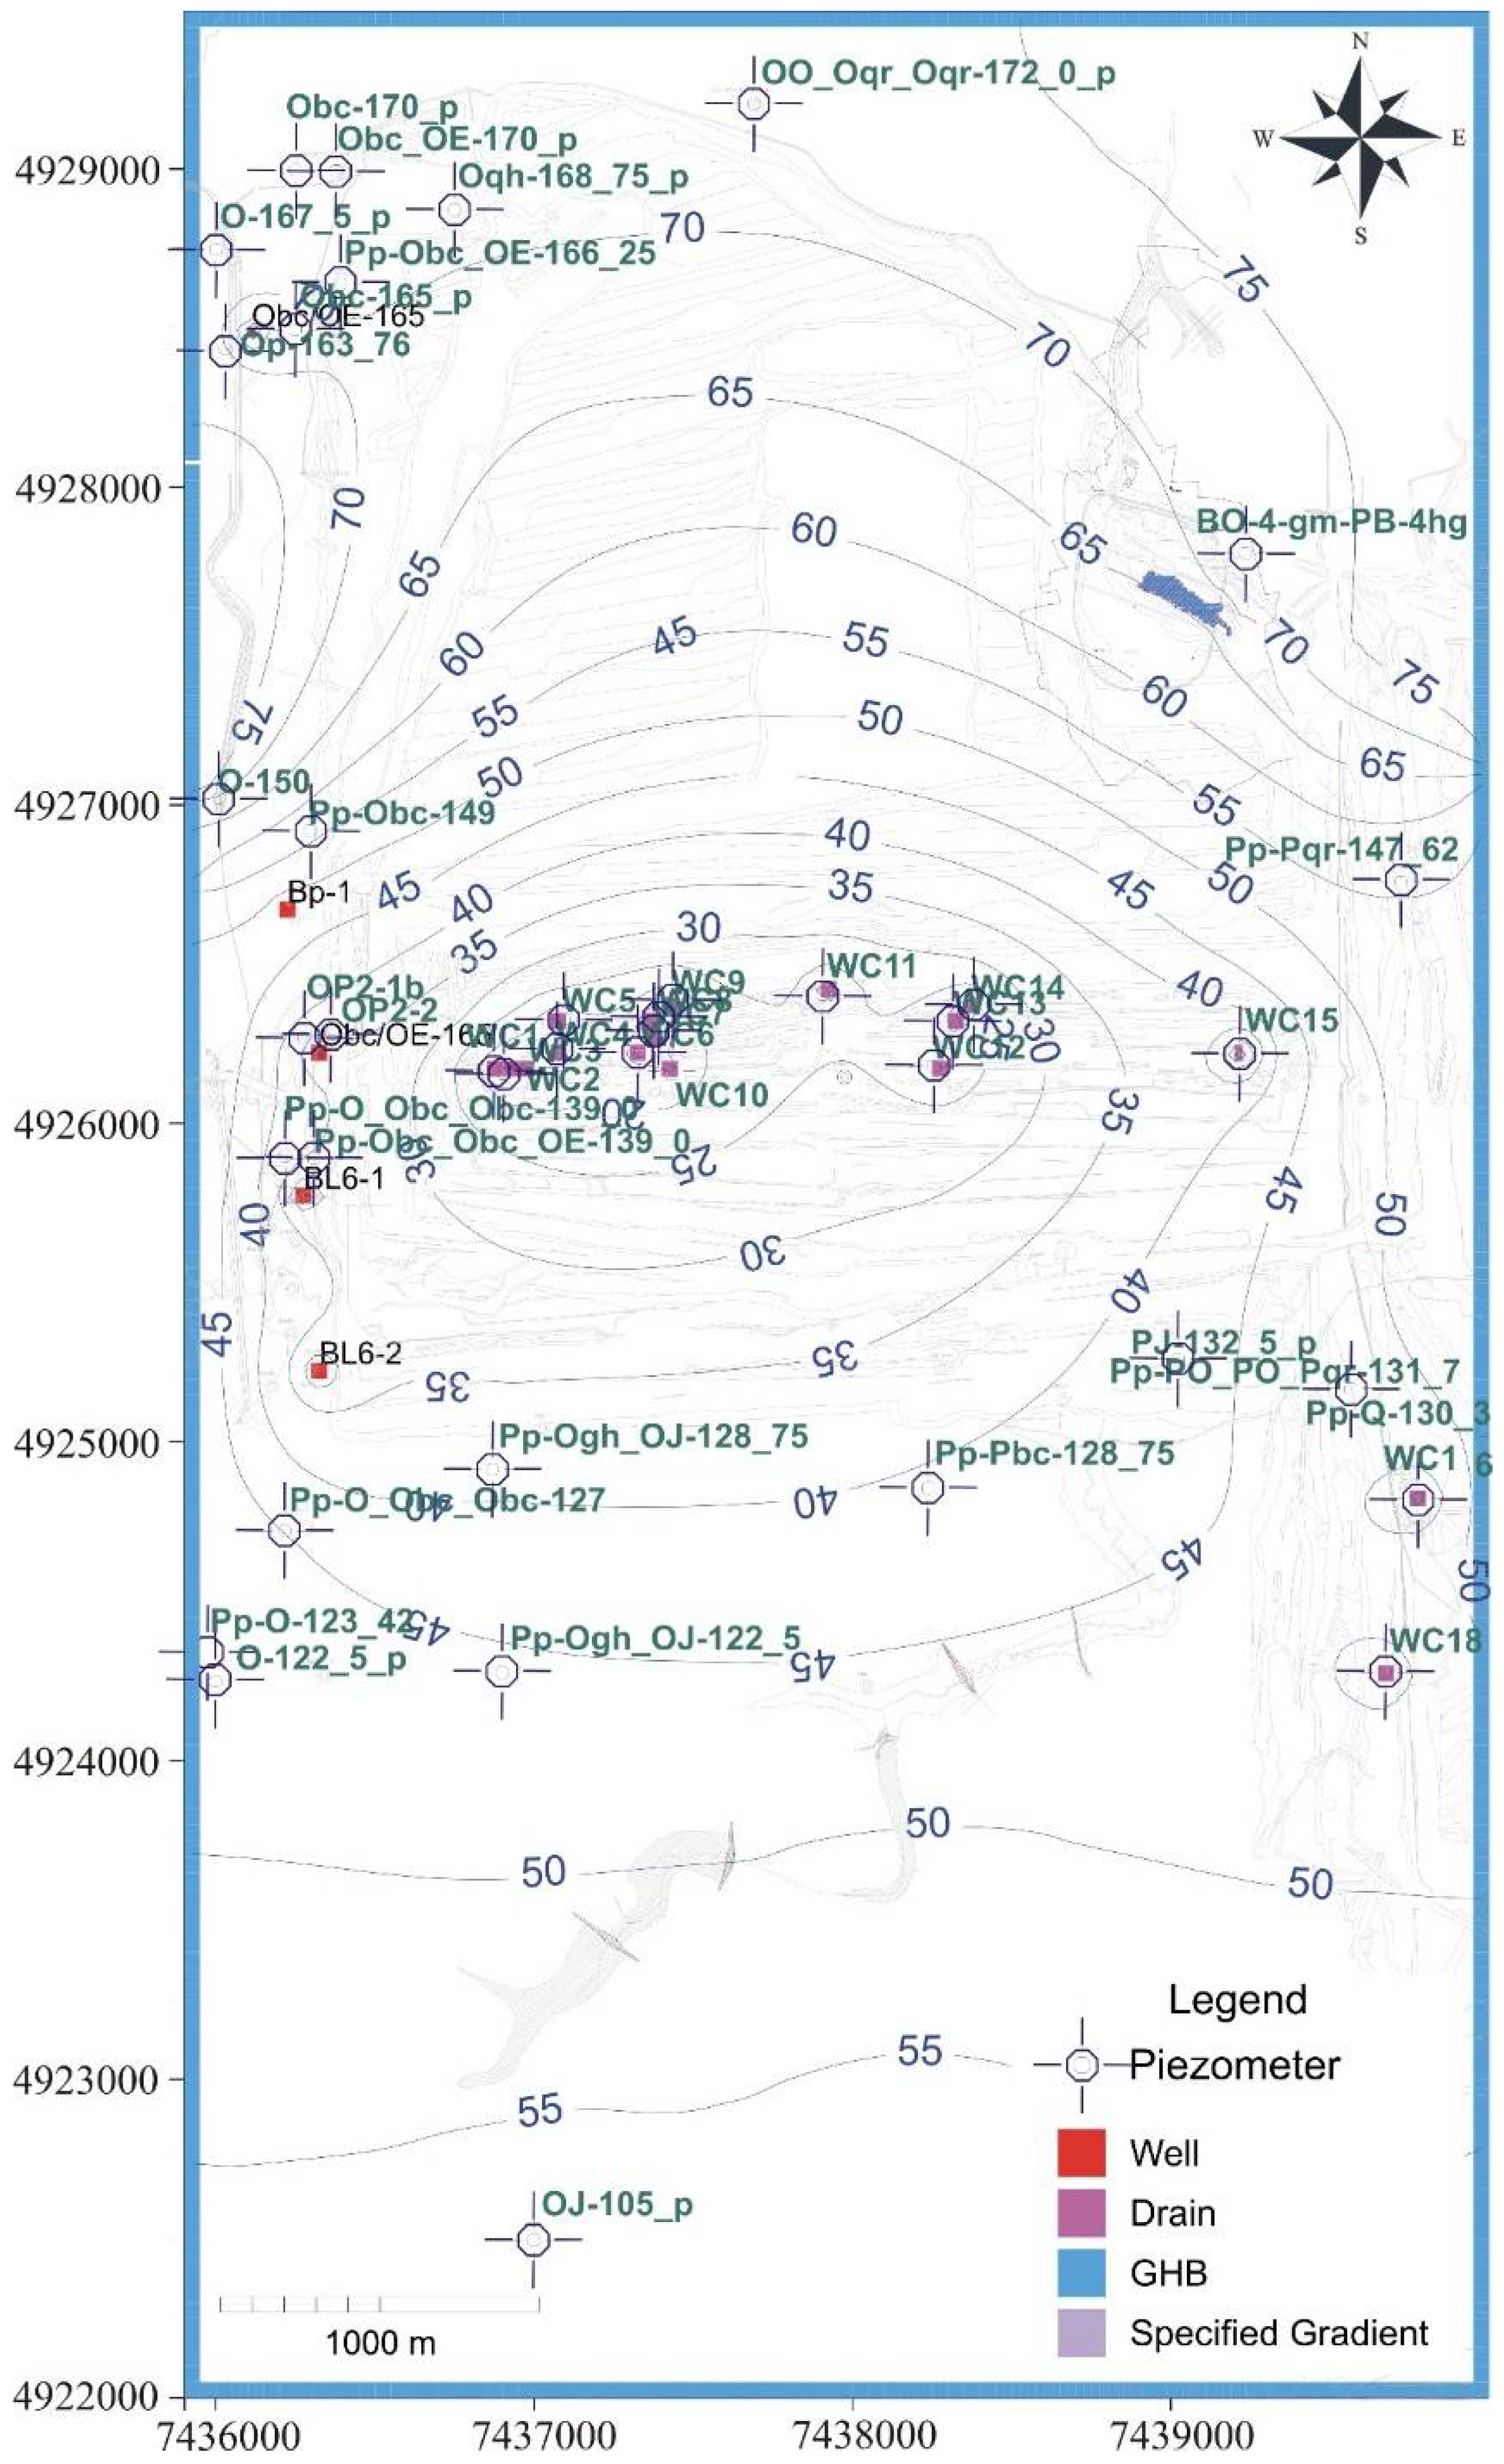
Model calibration was both manual and automatic—using the PEST program with a regulation option that supported specifying of pilot points, or control points that enabled predefining of heterogeneous zones with hydrogeologic parameters of the setting [38]. Figure 11 shows the groundwater level distribution of the lower aquifer at the end of the analytical period (April 2014). Figure 12 shows the calibration graph of registered and simulated values of piezometric head at a total of 147 observation points (piezometers and water collectors), for the status of all the aquifers as on April 2014. One of the results is also the determination of the groundwater balance, which is presented in Polomčić et al. [39].
It is apparent in Figure 11 that the general direction of groundwater flow in the lower aquifer was from the north and northeast to the south of the study area. As a result of operation of the mine dewatering system (18 water collectors), the largest drawdown occurred in the central part of the model, where the water collectors are installed. Additionally, there were local drawdowns within the zones of the wells of the Kalenić source.
The calibration graph indicated generally good agreement of recorded and simulated values of piezometric head at the observation points, with the exception of several piezometers along the western part of the flow field, for virtually all the aquifers.
To simulate the groundwater regime in the second period (May 2014–September 2014), the flood lake at Tamnava–West Field was specified in the first six model layers using the boundary condition “river”, which reflected the spread and depth of the lake. An aggravating circumstance during the simulation was the fact that recorded groundwater levels were available only for the western part of the study area and only for the lower aquifer. The other parts could not be monitored due to the presence of the flood lake.
Figure 13 shows the piezometric head distribution of the lower aquifer at the end of the study period (September 2014). Compared to the situation during the first period, it is evident that there was a groundwater mound. Due to flooding of the mine and dewatering system, the only structures that affected the groundwater were the wells of the Kalenić source, which lowered the water table along the western contour. The presence of a lake above the underlying sands and the active hydraulic link between the aquifers in them with the flood lake, caused the groundwater level to rise above the elevation of 75 m a.s.l. in a large part of the lower aquifer.
Figure 14 shows the calibration graph of recorded and modeled piezometric head at the end of the simulation of the second period. It is apparent that the results of model validation agreed very well with the values measured at the observation points, with the exception of one piezometer where the modeled water table was 3.66 m lower than actually recorded.
The achievement of the maximum level of groundwater occurs after 2.5 months after the formation of the flood lake (end of July 2014).
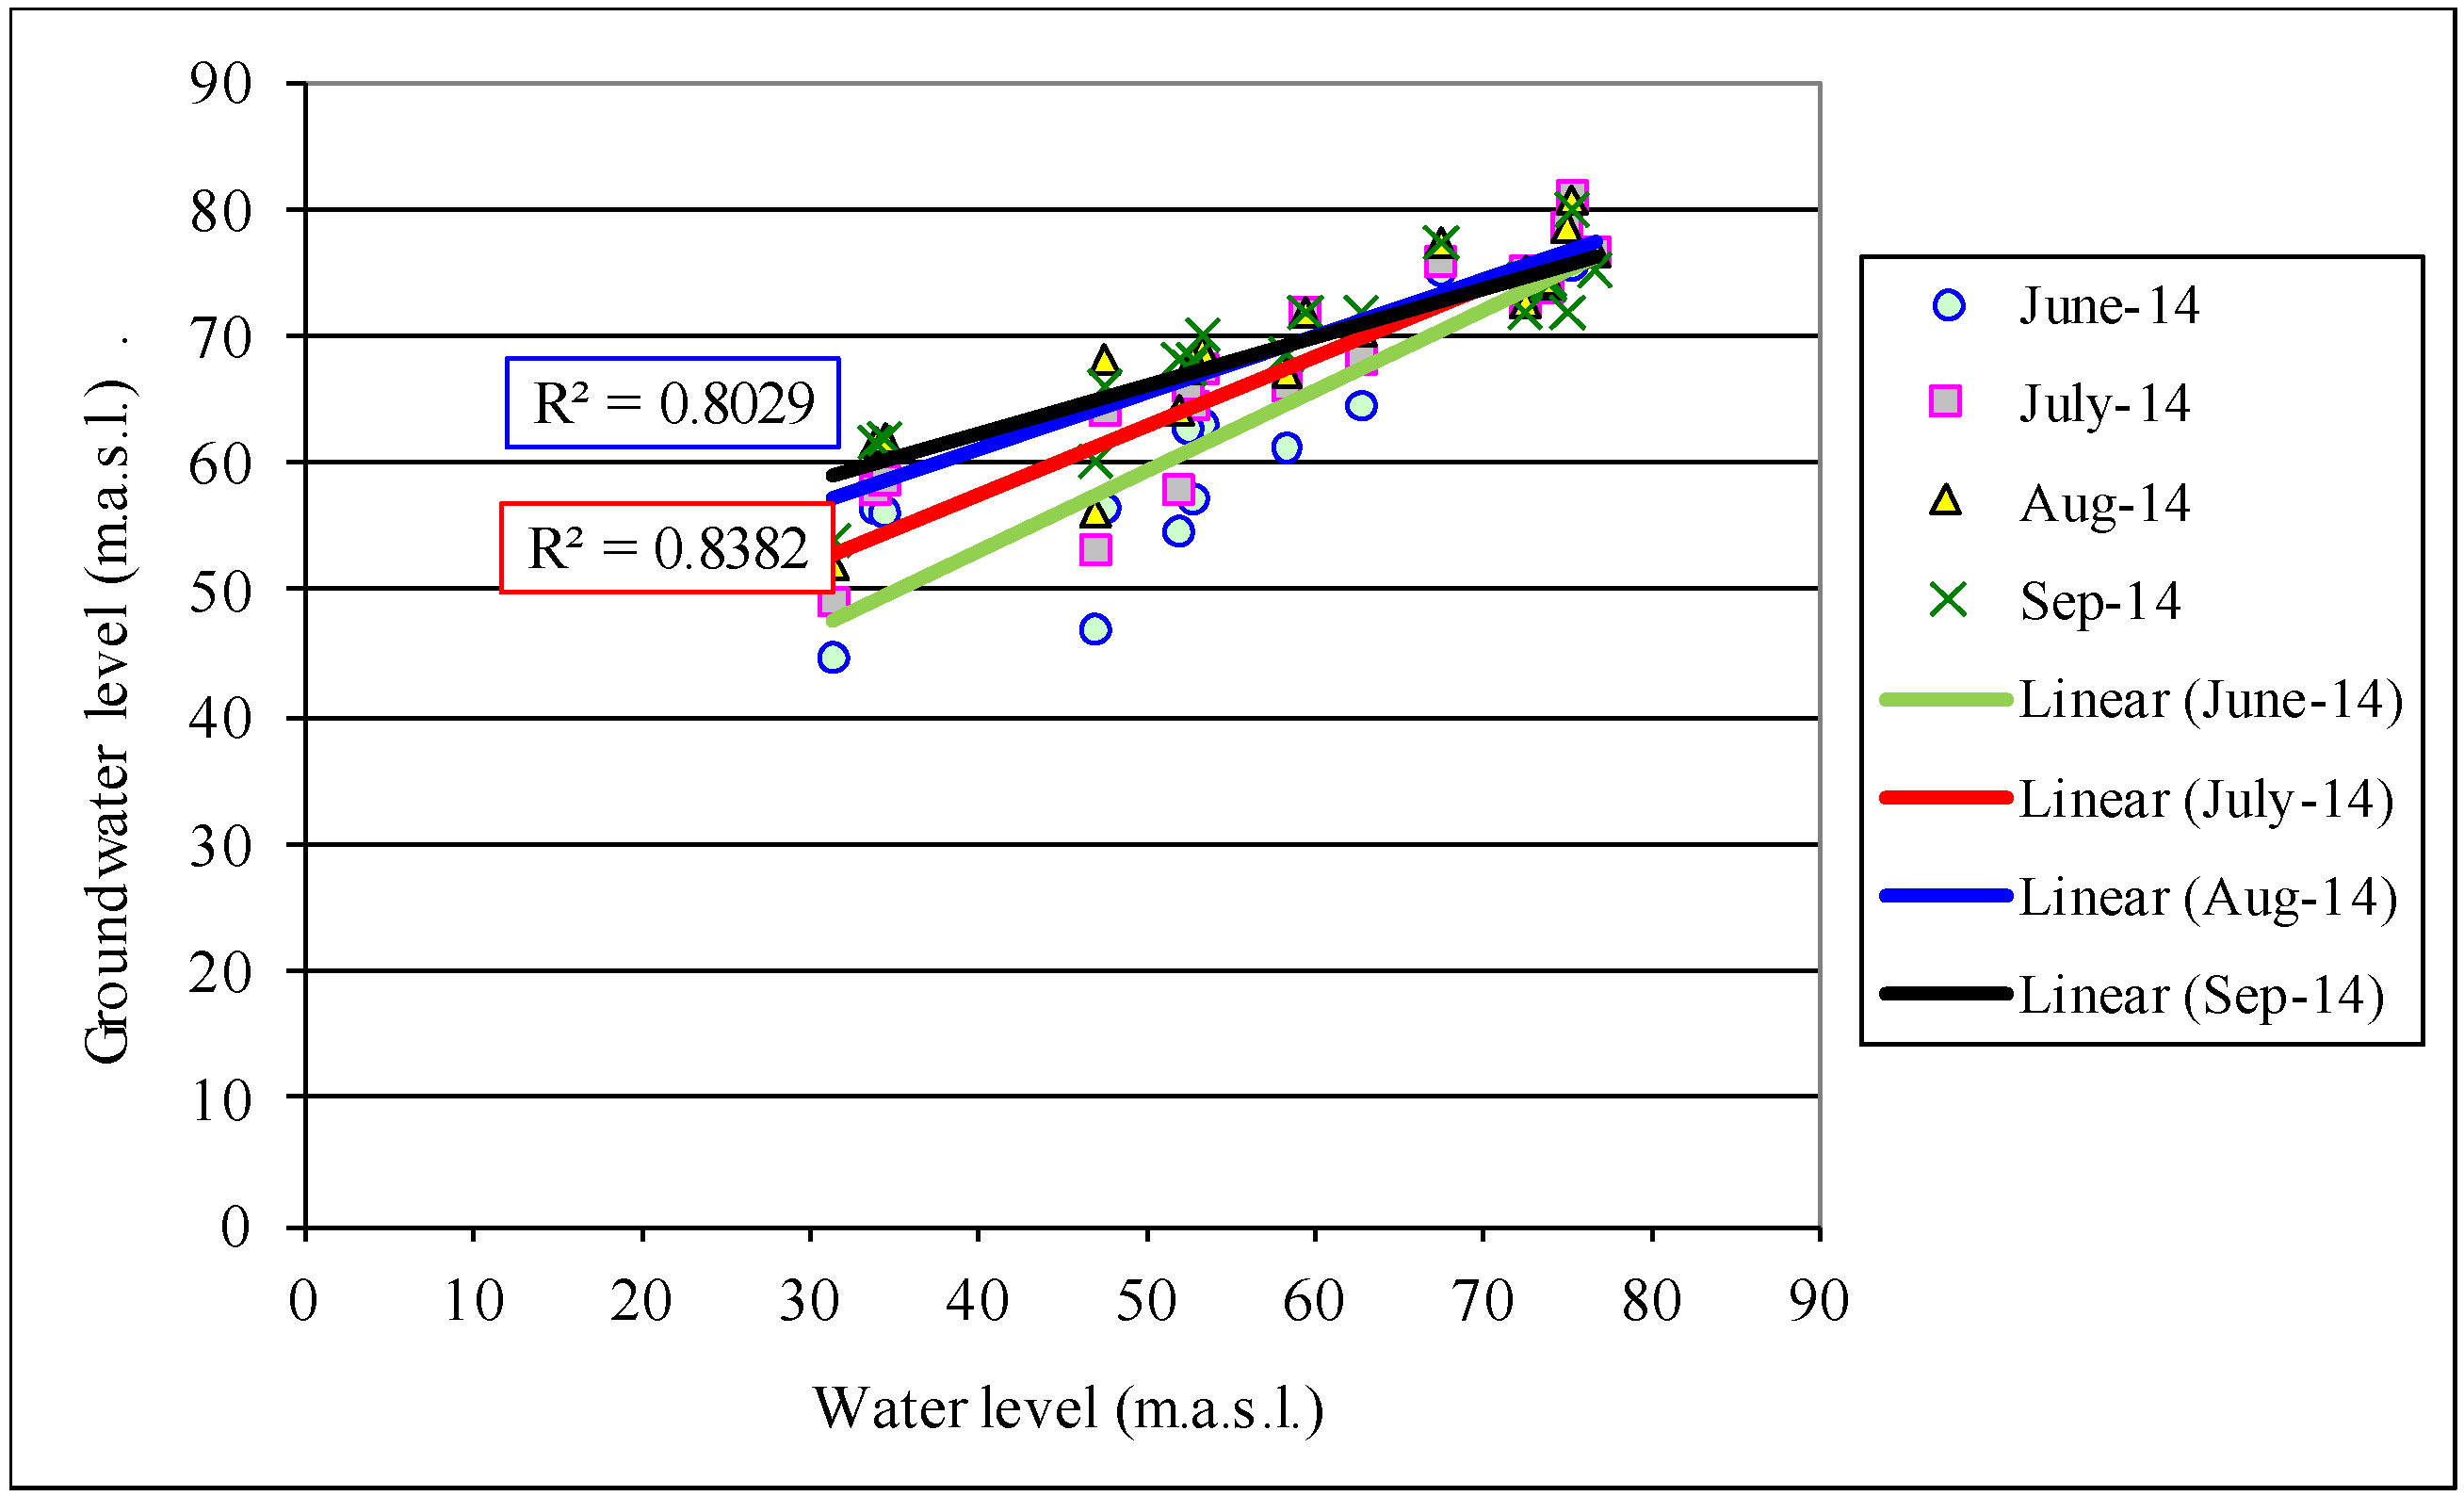
The correlation between the water level of the flood lake and the groundwater level of the lower aquifer was analyzed for this period (Figure 15). The conclusion was that an active hydraulic link had been established between the flood lake and the lower aquifer, with an excellent Pearson correlation coefficient, from 0.896 (minimum value in August 2014) to 0.916 (maximum value in July 2014). Values of coefficient of determination range from 0.8029 (minimum in August 2014) to 0.8382 (maximum in July 2014).
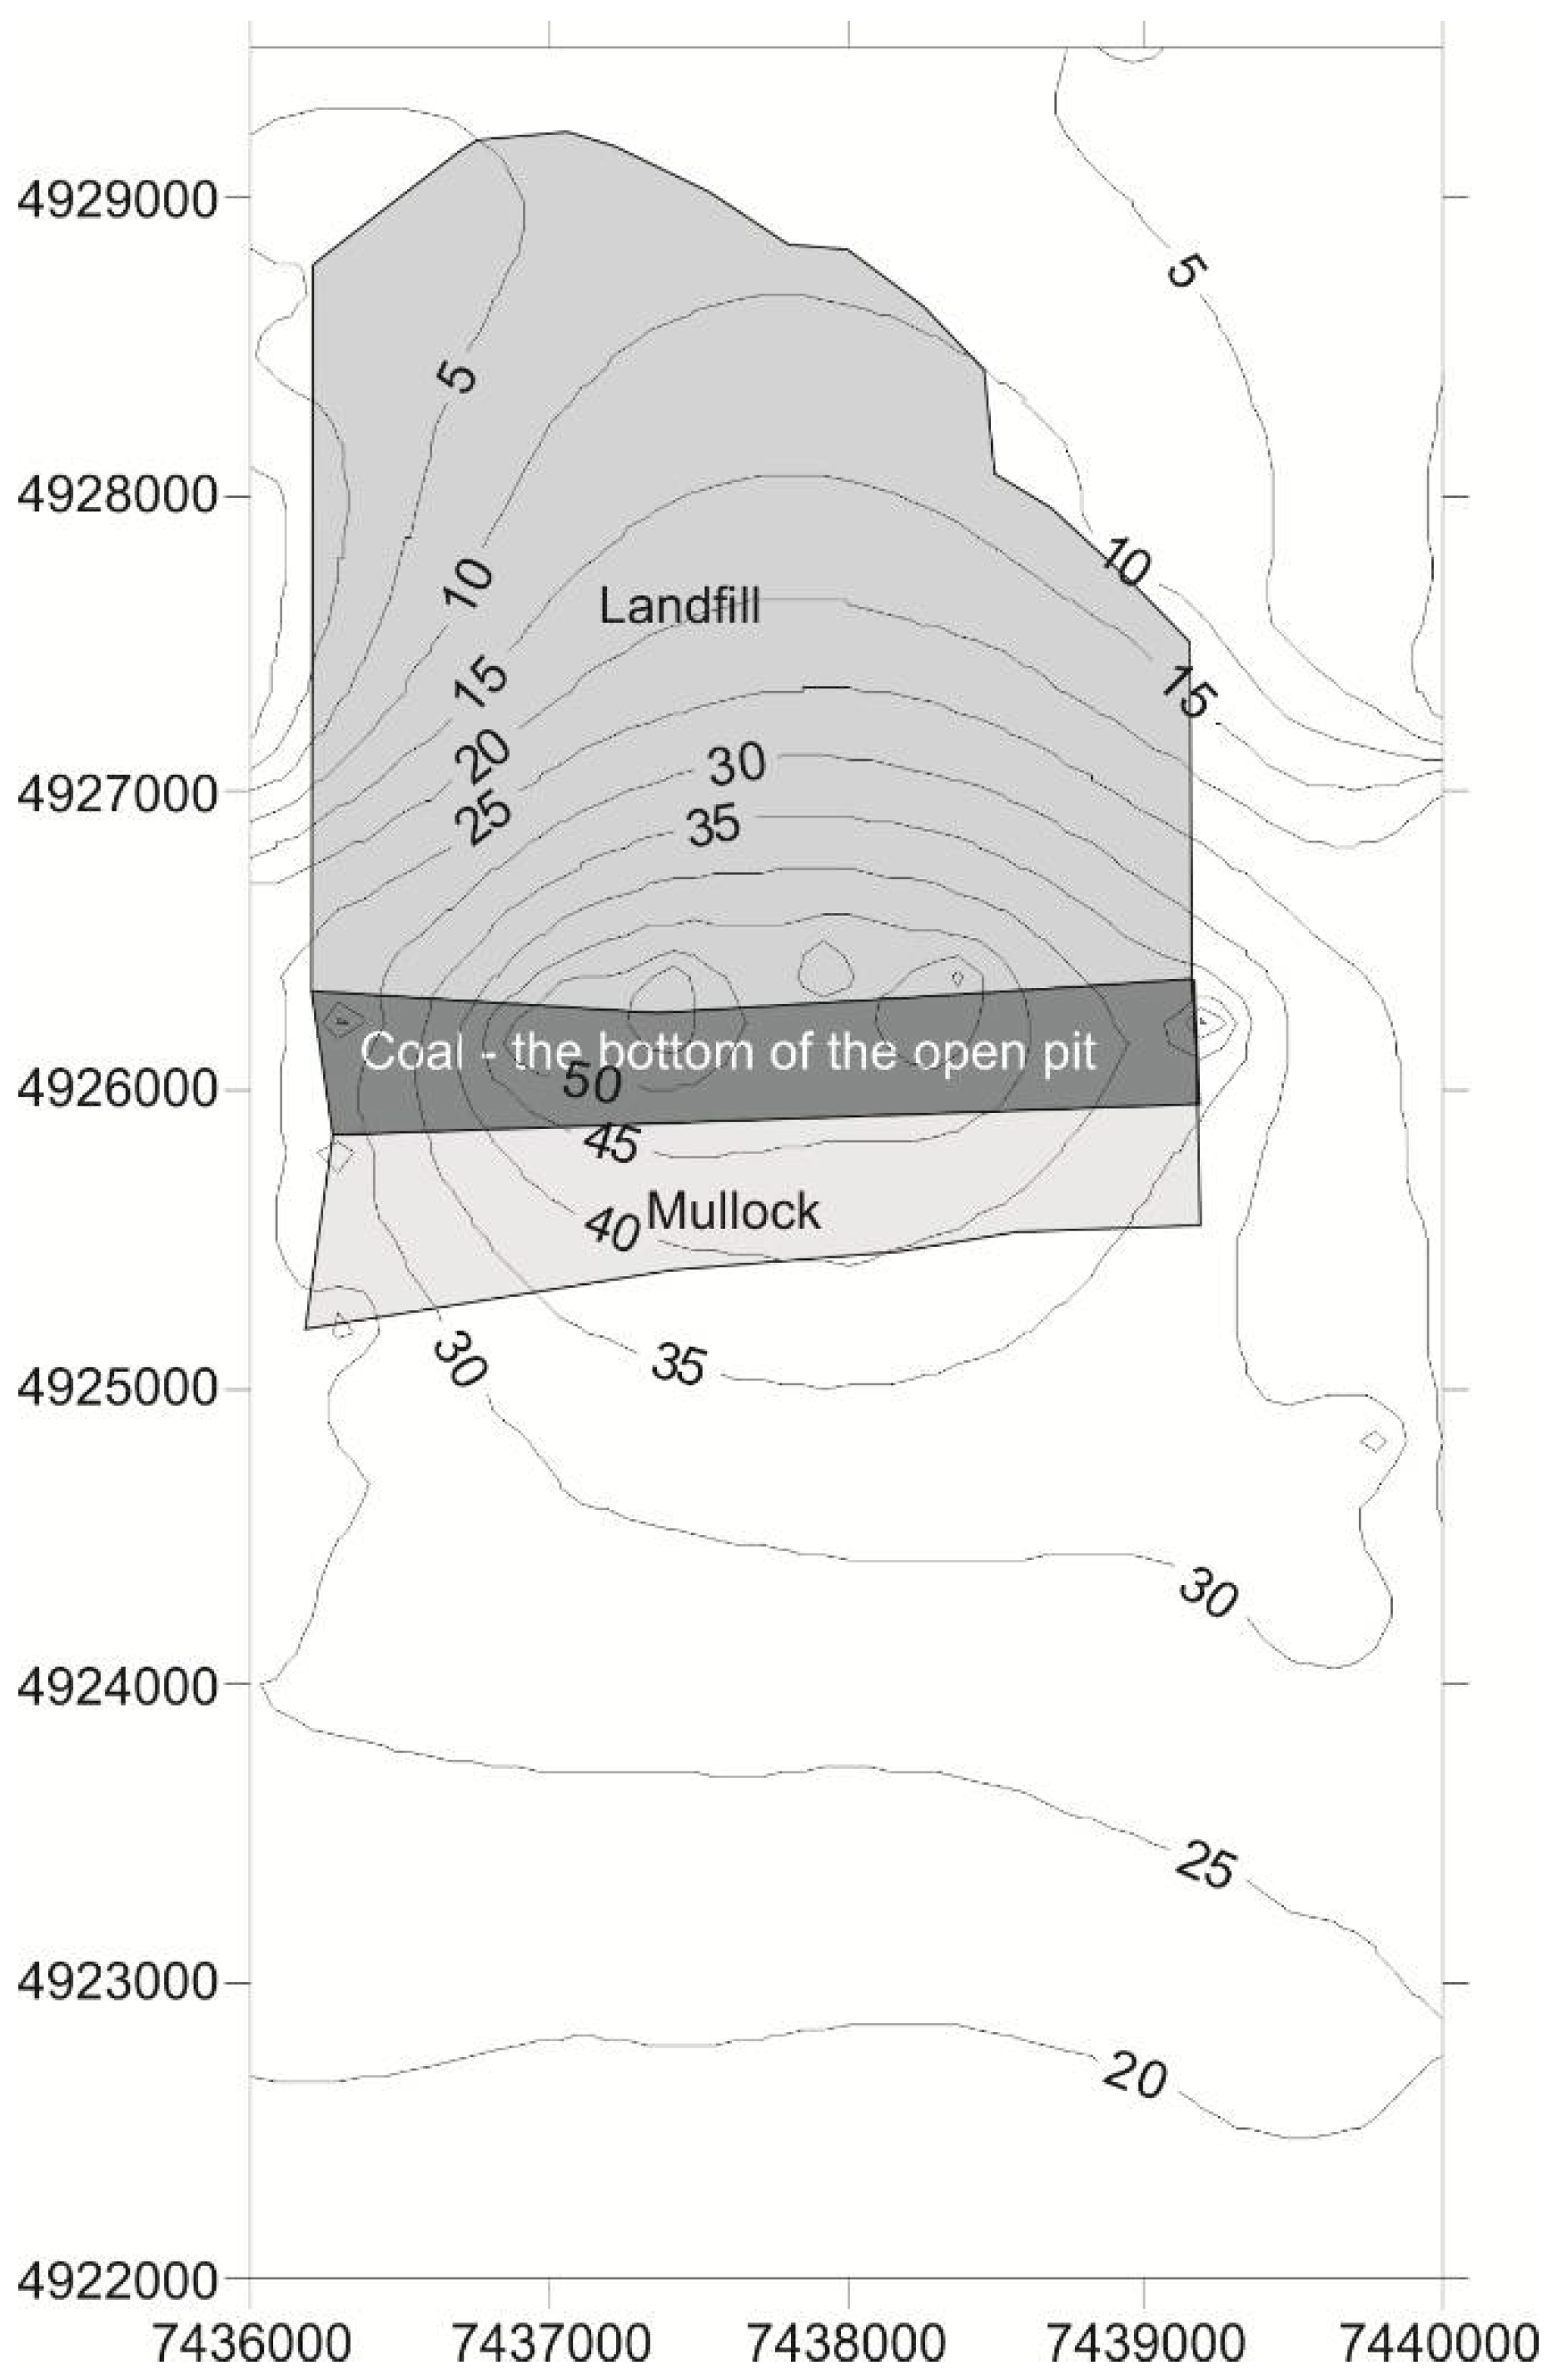
The groundwater mound was simulated as the difference between the highest recorded groundwater level (July 2014) and the groundwater level before the disastrous flood (April 2014), as shown in Figure 16. The largest groundwater mound was noted in the central parts, where the dewatering system comprised of water collectors was located and where the open-pit mine was the deepest. In the north, the groundwater mound was more than 10 m on average, and in the south more than 20 m compared to pre-flood conditions. The simulated increase in groundwater volume, as a result of the hydraulic link with the flood lake, was 5.09 hm3.
The simulated third period was from October 2014 to December 2015. Monitoring was undertaken at more piezometers compared to the second period (a total of 84), but fewer than in the first period. The status, spread and depth of the flood lake were modeled per recorded data (Figure 4).
Figure 17 shows the simulation of the third period in the form of a map of groundwater level distribution of the lower aquifer (June 2015). June 2015 was selected to present the results because thereafter groundwater was monitored at only a few observation points. A new monitoring campaign began five months later, although a number of observation points had been destroyed in the meantime. The presented flow pattern is reminiscent of that from April 2014, although the water table is somewhat higher due to “residual” flood waters. The general direction of groundwater flow was the same as before the flood and the creation of the flood lake—the mine dewatering system and production wells dictated the groundwater levels in the same way as before. The general conclusion was that the groundwater regime in the study area reverted to the original status, after the stress caused by the historical flood.
Figure 18 shows the calibration graph of recorded and simulated piezometric head in June 2015. The calibration graph attest to generally good agreement. However, five observation points reported higher residuals for which there was no reasonable explanation. They were close to the observation points where the agreement between the recorded and simulated values was very good, and there was no structure there that could have a local impact on a single piezometer.
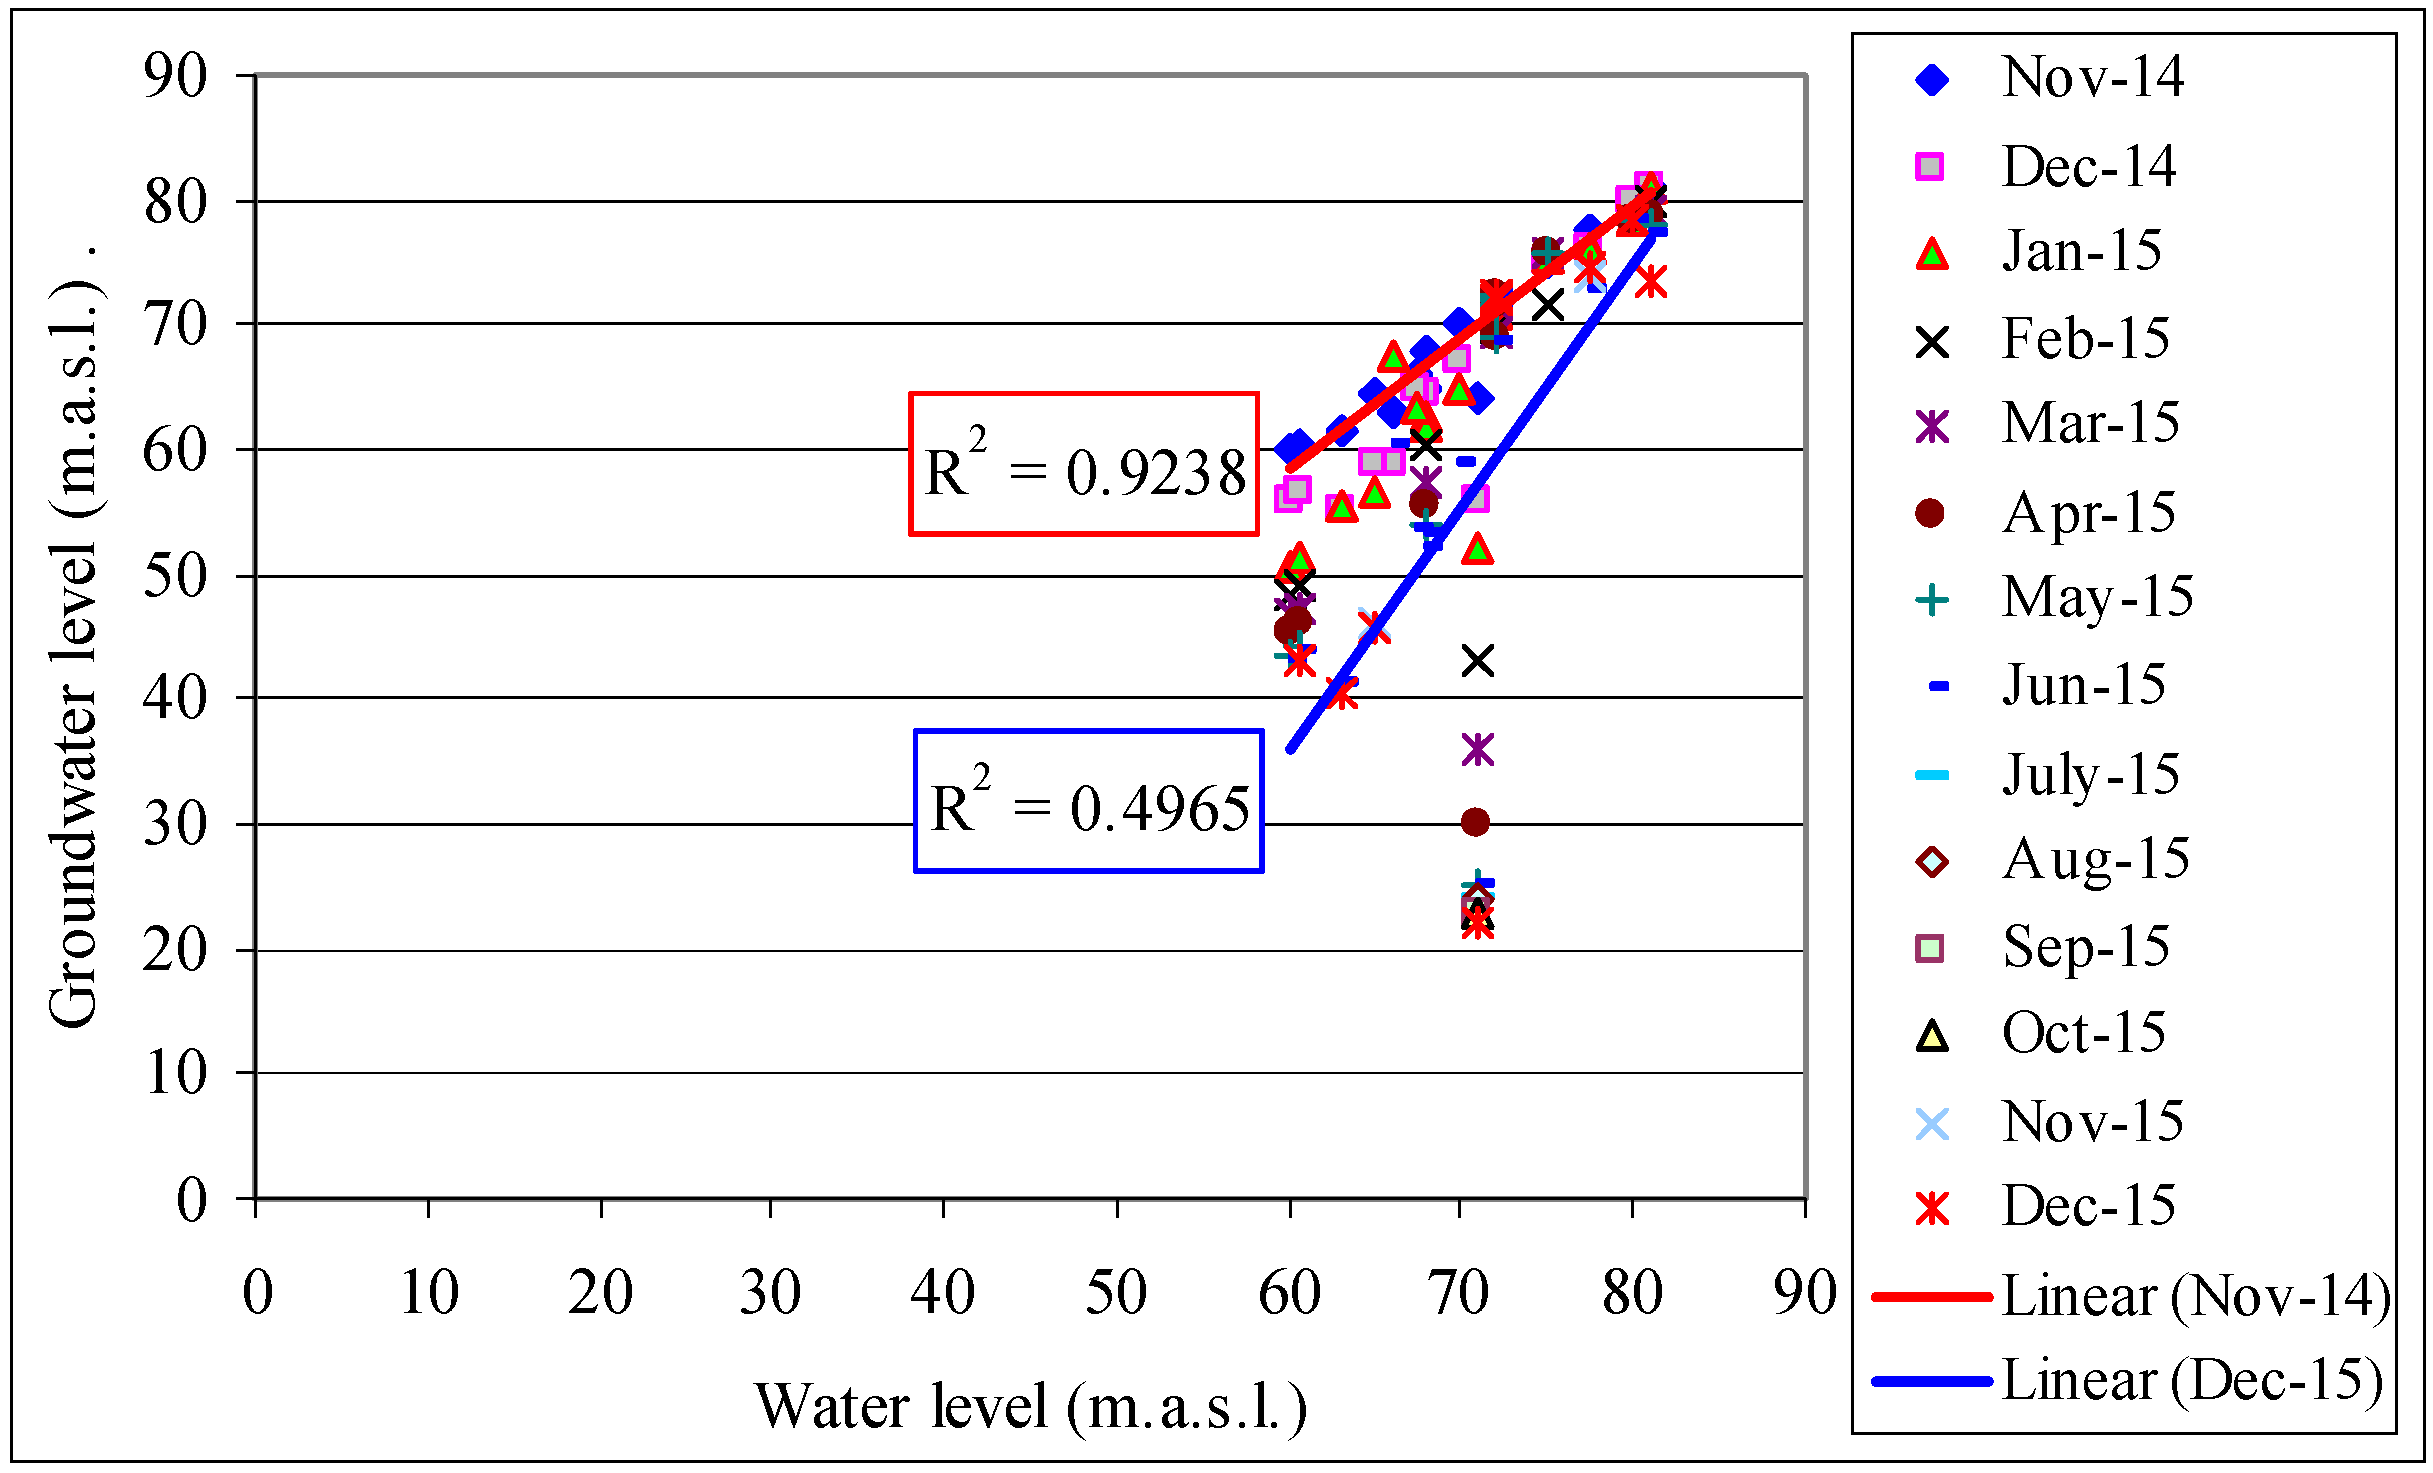
Figure 19 shows the correlation between the water level of the flood lake and the groundwater level of the lower aquifer in the third period. The Pearson correlation coefficient ranged from excellent (0.961 in November 2014) to good (0.704 in December 2015). The Pearson correlation coefficient in the final months of monitoring is lower due to fewer samples (fewer piezometers), but also because the groundwater mound decline “lagged” behind the decline in the water level of the flood lake. Values of coefficient of determination range from 0.4965 (minimum in November 2014) to 0.9238 (maximum in December 2014).
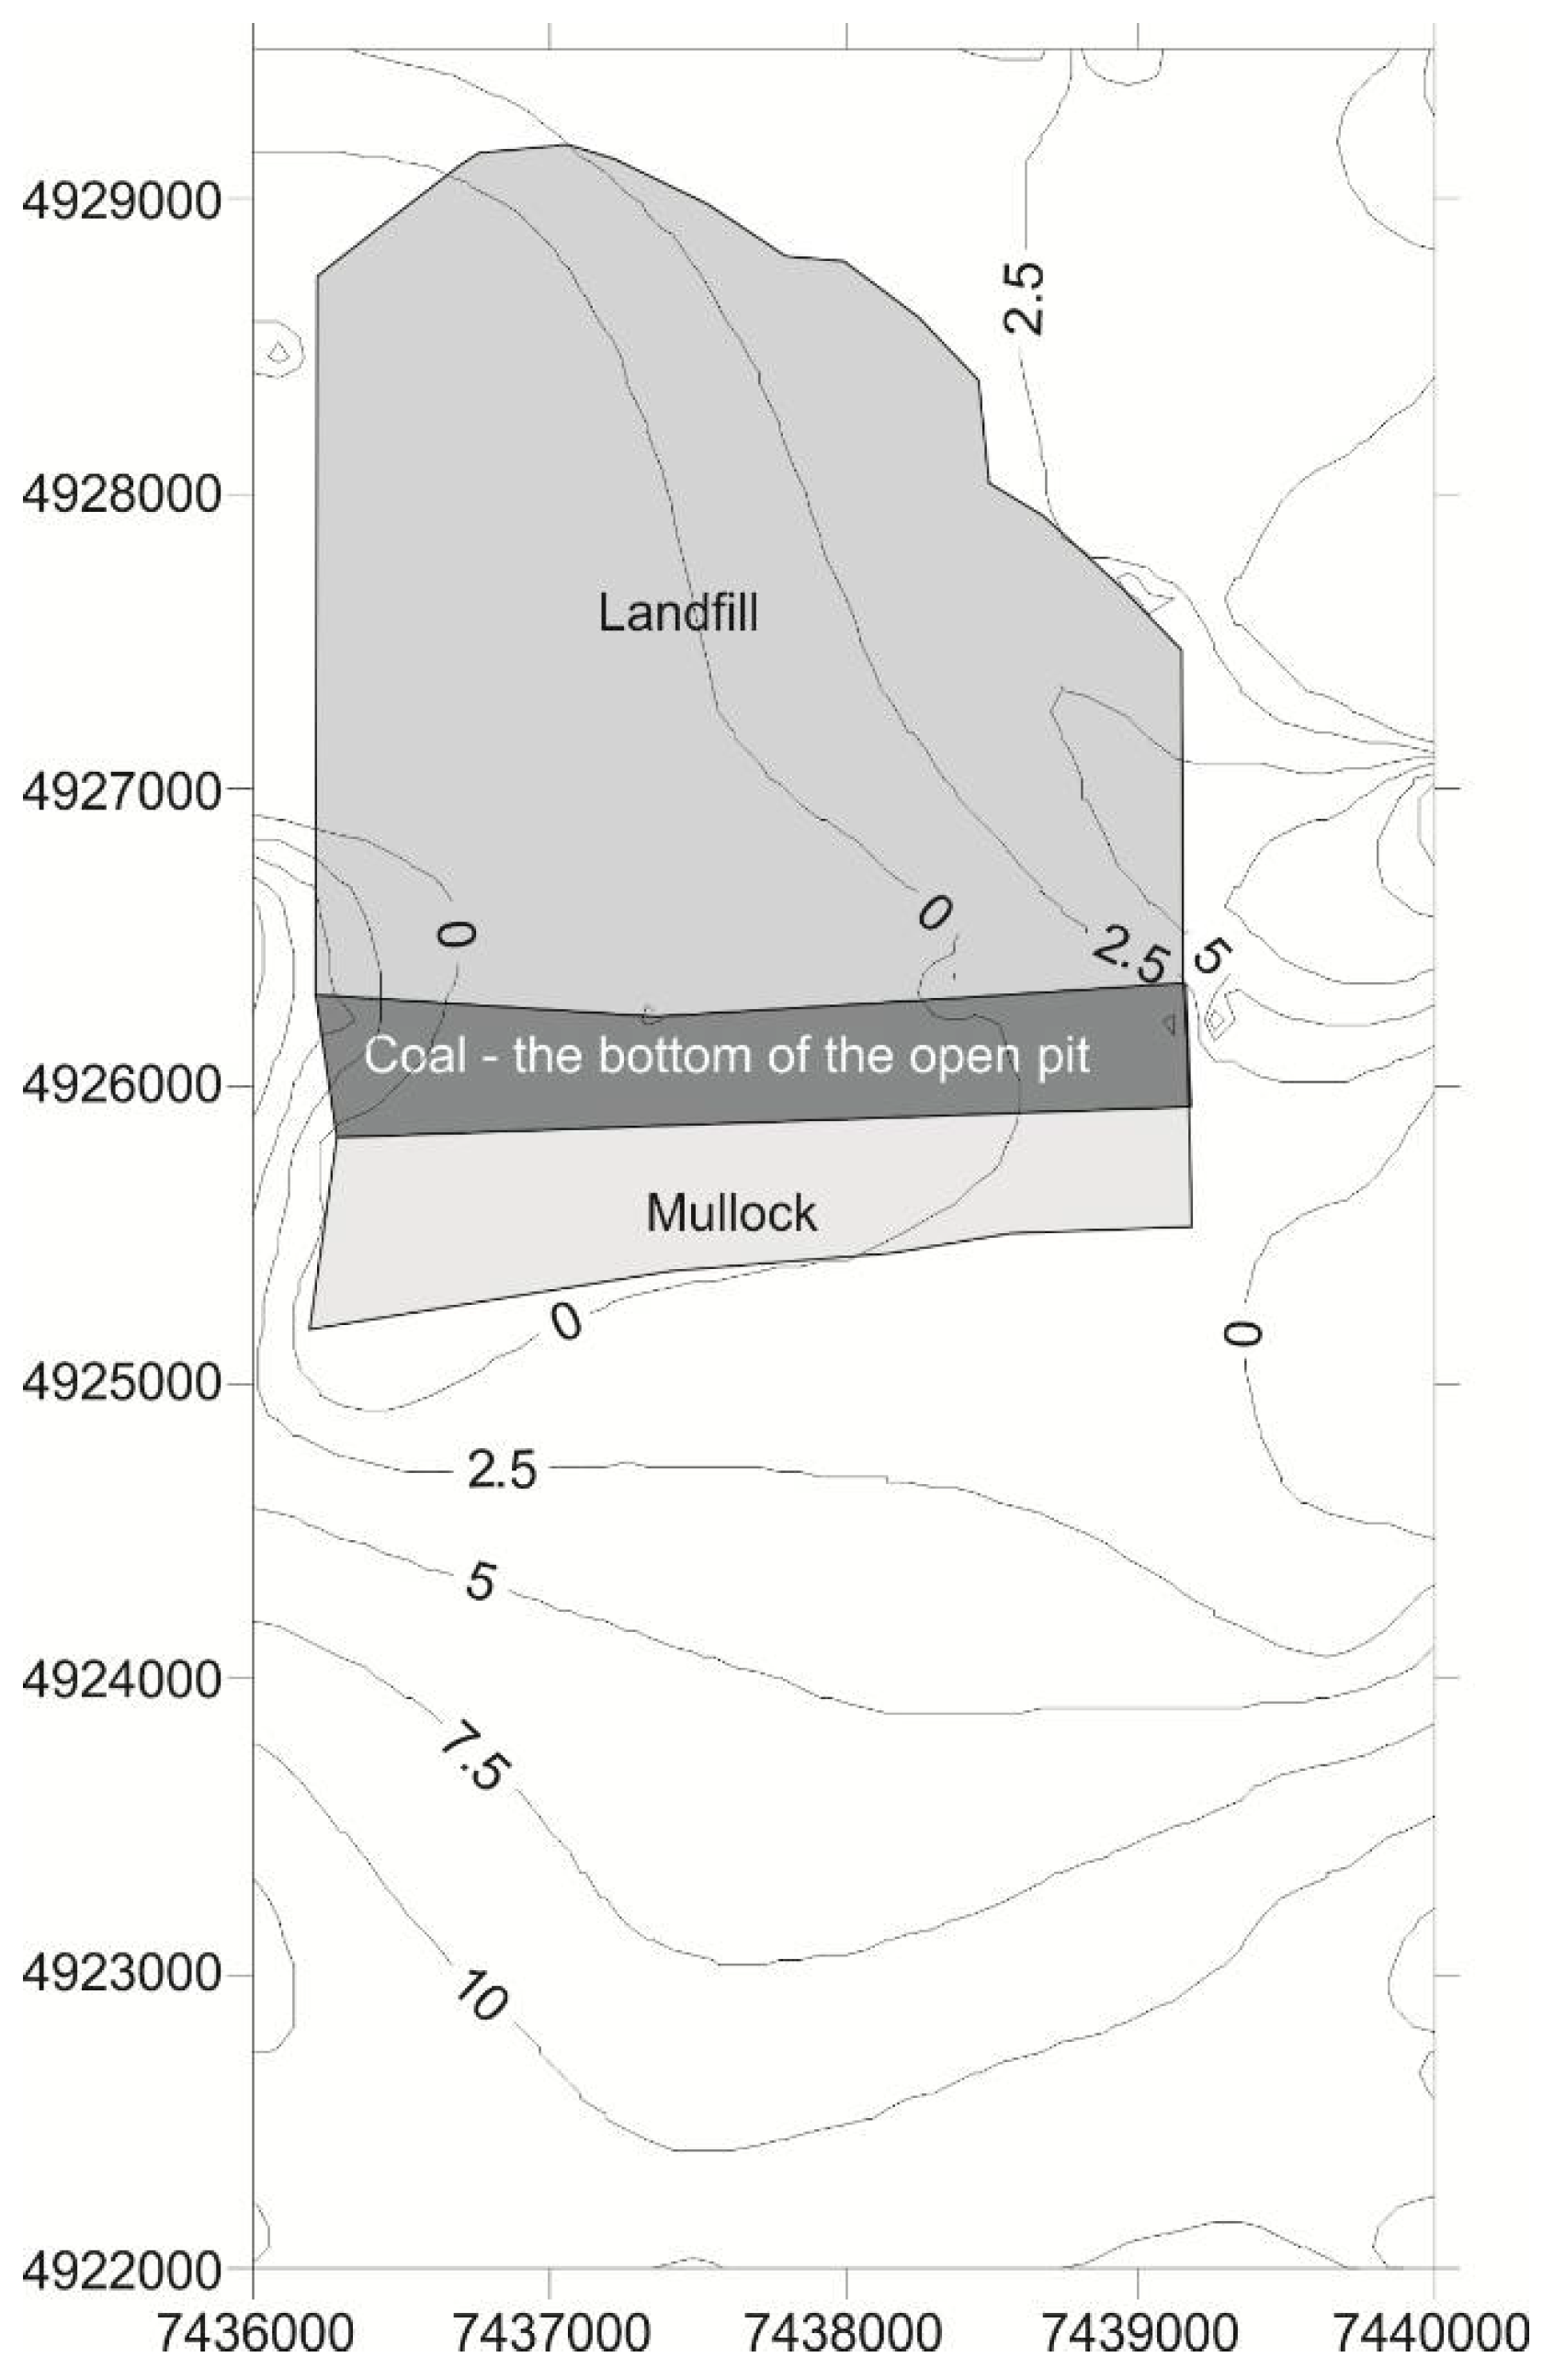
The residual groundwater as a result of the May 2014 flood was determined as the difference between groundwater levels in December 2014 and April 2014. The resulting map of the groundwater mound is shown in Figure 20. It is apparent that most of the groundwater had been drained through the activation and operation of the mine dewatering system and the Kalenić wells. The simulated volume of the residual groundwater was 1.05 hm3, which is 4.86 times less than the volume of groundwater from July of the second period.
5. Conclusions
This paper dealt with the effects of the historically maximal values of daily and monthly precipitation during the spring and summer of 2014 in Serbia, causing considerable flooding of urban, agricultural and industrial areas. One of the most dramatic shifts in the groundwater regime in Serbia occurred in the wider area of open-pit mine Tamnava–West Field as a consequence of levee breaches on the Kolubara river and the collapse of two dams on surface accumulations, causing several open-pit mines to be flooded by a layer of water over 65 m deep.
The hydraulic connection between the flood lake and the groundwater was enhanced by mining works on the bottom of the mine. This location is the only one in Serbia where the change in the groundwater regime as a result of the disastrous flood in May 2014 was documented.
The applied methodology of exploration is not just connected to the defined example of open-pit mine flooding. The described methodology may be also applied for analyzing the effect of increases in groundwater level in coastal areas during regular floods, and for analyzing potential groundwater pollution in flood conditions. Though the paper does not analyze the detrimental effects of the historic floods on groundwater quality due to a lack of data, the developed operational algorithm for exploration presupposes the creation of both a groundwater model and fate and transport models. It is expected that two verifications of calibrated models be created for each model (two for GWM and two for FTM) for the period during the floods and the period after the flood wave which are preceded by analyses of groundwater monitoring and accumulated groundwater as a consequence of flooding. A doubly verified model (or models) for states of extreme water regimes create(s) a reliable base for forecasting the effects of floods. The developed operational algorithm of exploration can be applied for: (a) early statements regarding the effects of floods, (b) to simulate what-if scenarios that would enable the design and dimensioning of a system of urban, industrial and agricultural flood protection, (c) for environmental protection, and (d) for the analysis of the effects of climate change on larger drainage areas.
Author Contributions
All authors contributed to the finalization of paper by joint efforts: D.P. designed the methodology and wrote the final manuscript with D.B. Research plan, fieldwork and initial data analysis was conducted by J.R.
Funding
This research received no external funding.
Acknowledgments
Our gratitude goes to the Ministry of Education, Science and Technological Development of the Republic of Serbia for financing projects: Potential and groundwork for sustainable use of groundwater (OI176022), Improvement of open-pit lignite mining technologies for better energy efficiency, security and safety at work (TR33039), and Simultaneous bioremediation and soilification of degraded areas with a view to conserving natural resources of biologically active substances and developing and producing biomaterials and dietary supplements (III43004). Three anonymous reviewers are also acknowledged for their contribution and effort in providing constructive criticism and improving the manuscript.
Conflicts of Interest
The authors declare no conflicts of interest.
References
- Republic of Serbia, National Hydrometeorological Service. Meteorological Yearbook—Climate Data; Republic of Serbia, National Hydrometeorological Service: Beograd, Serbia, 2015; 206p. (In Serbian)
- Nišavić, A.; Zarić, M.; Gulan, M.; Dekić, L.J. Meteorological Conditions in May 2014 and Possibility of Forecasting Heavy Rainfall; Republic of Serbia, National Hydrometeorological Service: Belgrade, Serbia, 2014; 28p. (In Serbian)
- Đinđić, I.; Planičić, M.; Obradović, I.; Vinčić, T.; Špadijer, S.; Drašković, D.; Mrkonja, L.J. The impact of dewatering of open pit “Tamnava” on groundwater regime of water supply “Kalenić”. In Proceedings of the XV Serbian Symposium on Hydrogeology, Kopaonik, Serbia, 14–17 September 2016; Vranješ, A., Vukićević, M., Eds.; Faculty of Mining and Geology, University of Belgrade: Belgrade, Serbia, 2016; pp. 173–178. [Google Scholar]
- Milzow, C.; Kgotlhang, L.; Bauer-Gottwein, P.; Meier, P.; Kinzelbach, W. Regional review: The hydrology of the Okavango Delta, Botswana—Processes, data and modeling. Hydrogeol. J. 2009, 17, 1297–1328. [Google Scholar] [CrossRef]
- Linn, F.; Masie, M.; Rana, A. The impacts on groundwater development on shallow aquifers in the lower Okavango Delta, northwestern Botswana. Environ. Geol. 2003, 44, 112–118. [Google Scholar]
- Ramberg, L.; Wolski, P.; Krah, M. Water balance and infiltration in a seasonal floodplain in the Okavango Delta, Botswana. Wetlands 2006, 26, 677–690. [Google Scholar] [CrossRef]
- Gotkowitz, B.M.; Attig, W.J.; McDermott, T. Groundwater flood of a river terrace in southwest Wisconsin, USA. Hydrogeol. J. 2014, 22, 1421–1432. [Google Scholar] [CrossRef]
- Wu, G.; Shu, L.; Lu, C.; Chen, X.; Zhang, X.; Appiah-Adjei, E.K.; Zhu, J. Variations of streambed vertical hydraulic conductivity before and after a flood season. Hydrogeol. J. 2015, 23, 1603–1615. [Google Scholar] [CrossRef]
- Mosquera-Machado, S.; Ahmad, S. Flood hazard assessment of Atrato River in Colombia. Water Resour. Manag. 2007, 21, 591–609. [Google Scholar] [CrossRef]
- Costabile, P.; Macchione, F. Analysis of One-Dimensional Modelling for Flood Routing in Compound Channels. Water Resour. Manag. 2012, 26, 1065–1087. [Google Scholar] [CrossRef]
- Haltas, I.; Elçi, S.; Tayfur, G. Numerical Simulation of Flood Wave Propagation in Two-Dimensions in Densely Populated Urban Areas due to Dam Break. Water Resour. Manag. 2016, 30, 5699–5721. [Google Scholar] [CrossRef]
- Westbrook, J.C.; Cooper, J.D.; Baker, W.B. Beaver dams and overbank floods influence groundwater–surface water interactions of a Rocky Mountain riparian area. Water Resour. Manag. 2006, 42. [Google Scholar] [CrossRef]
- Wang, X.; Zhang, G.; Xu, Y.J. Impacts of the 2013 Extreme Flood in Northeast China onRegional Groundwater Depth and Quality. Water 2015, 7, 4575–4592. [Google Scholar] [CrossRef]
- Ghazavi, R.; Vali, A.B.; Eslamian, S. Impact of Flood Spreading on Groundwater Level Variation and Groundwater Quality in an Arid Environment. Water Resour. Manag. 2012, 26, 1651–1663. [Google Scholar] [CrossRef]
- Shekhar, S.; Prasad, R.K. The groundwater in the Yamuna flood plain of Delhi (India) and the management options. Hydrogeol. J. 2009, 17, 1559–1560. [Google Scholar] [CrossRef]
- Goes, B.J.M. Estimate of shallow groundwater recharge in the Hadejia–Nguru Wetlands, semi-arid northeastern Nigeria. Hydrogeol. J. 1999, 7, 294–304. [Google Scholar] [CrossRef]
- Hughes, A.G.; Vounaki, T.; Peach, D.W.; Ireson, A.M.; Jackson, C.R.; Butler, A.P.; Bloomfield, J.P.; Finch, J.; Wheater, H.S. Flood risk from groundwater: Examples from a Chalk catchment in southern England. J. Flood Risk Manag. 2011, 4, 143–155. [Google Scholar] [CrossRef]
- Naughton, O.; Johnston, P.M.; McCormack, T.; Gill, L.W. Groundwater flood risk mapping and management: Examples from a lowland karst catchment in Ireland. J. Flood Risk Manag. 2015, 10, 53–64. [Google Scholar] [CrossRef]
- Cobby, D.; Morris, S.; Parkes, A.; Robinson, V. Groundwater flood risk management: Advances towards meeting the requirements of the EU floods directive. J. Flood Risk Manag. 2009, 2, 111–119. [Google Scholar] [CrossRef]
- Falconer, R.H.; Cobby, D.; Smyth, P.; Astle, G.; Dent, J.; Golding, B. Pluvial flooding: New approaches in flood warning, mapping and risk management. J. Flood Risk Manag. 2009, 2, 198–208. [Google Scholar] [CrossRef]
- Gomes Miguez, M.; Peres Battemarco, B.; Martins De Sousa, M.; Moura Rezende, O.; Pires Veról, A.; Gusmaroli, G. Urban Flood Simulation Using MODCEL-An Alternative Quasi-2D Conceptual Model. Water 2017, 9, 445. [Google Scholar] [CrossRef]
- Cuellar, A.D.; McKinney, D.C. Decision-Making Methodology for Risk Management Applied to Imja Lake in Nepal. Water 2017, 9, 591. [Google Scholar] [CrossRef]
- Brawner, C.O. Control of groundwater in surface mining. Mine Water Environ. 1982, 1, 1–16. [Google Scholar] [CrossRef]
- Zaidel, J.; Markham, B.; Bleiker, D. Simulating seepage into mine shafts and tunnels with ModFlow. Ground Water 2010, 48, 1–11. [Google Scholar] [CrossRef] [PubMed]
- Polomčić, D.; Bajić, D. Application of Groundwater modeling for designing a dewatering system: Case study of the Buvač Open Cast Mine, Bosnia and Herzegovina. Geol. Croatica 2015, 68, 123–137. [Google Scholar] [CrossRef]
- Polomčić, D.; Bajić, D.; Papić, P.; Stojković, J. Hydrodynamic model of the open-pit mine “Buvač” (Republic of Srpska). J. Sustain. Dev. Energy Water Environ. Syst. 2013, 1, 260–271. [Google Scholar] [CrossRef]
- Morris, S.E.; Cobby, D.; Zaidman, M.; Fisher, K. Modelling and mapping groundwater flooding at the ground surface in Chalk catchments. J. Flood Risk Manag. 2012, 11, S251–S268. [Google Scholar] [CrossRef]
- Patro, S.; Chatterjee, C.; Singh, R.; Raghuwanshi, S.N. Hydrodynamic modelling of a large flood-prone river system in India with limited data. Hydrol. Process. 2009, 23, 2774–2791. [Google Scholar] [CrossRef]
- Pradhan, B.; Youssef, A.M. A 100-year maximum flood susceptibility mapping using integrated hydrological and hydrodynamic models: Kelantan River Corridor, Malaysia. J. Flood Risk Manag. 2011, 4, 189–202. [Google Scholar] [CrossRef]
- Chen, Y.; Overeem, I.; Kettner, J.A.; Gao, S.; Syvitski, P.M.J. Modeling flood dynamics along the superelevated channel belt of the Yellow River over the last 3000 years. J. Geophys. Res. 2015, 120, 1321–1351. [Google Scholar] [CrossRef]
- Avramović, A. Report on the Construction and Testing of Wells on Coal Deposit Tamnava-West field, Kolubara Basin; Georad: Drmno, Serbia, 2011; 98p. [Google Scholar]
- Harbaugh, A.W.; Banta, E.R.; Hill, M.C.; McDonald, M.G. MODFLOW-2000: The U.S. Geological Survey Modular Ground-Water Model, User Guide to Modularization Concepts and the Ground-Water Flow Process; U.S. Geological Survey Open-File Report 00-92; U.S. Geological Survey: Reston, VA, USA, 2000; p. 121.
- Rumbaugh, J.O.; Rumbaugh, D.B. Guide to Using Groundwater Vistas, version 6; Environmental Simulations: New York, NY, USA, 2011. [Google Scholar]
- Savić, D. Study of Conducted Detailed Geological, Geotechnical and Hydrogeological Exploration for the Project Design of Regional Landfill Site (Non-Toxic) of Communal Waste ‘Kalenić’; Geoing Group: Belgrade, Serbia, 2014; 80p. [Google Scholar]
- Mikavica, D. Technical Project of Open-Pit Mine ‘Tamnava-Zapadno Polje’ Groundwater Control; Institute for the Management of Water Resources ‘Jaroslav Černi’: Belgrade, Serbia, 2008; 156p. [Google Scholar]
- Planičić, M. Detailed (Hydro)geological Information of PD RB Kolubara d.o.o. Lazarevac Regarding the Area Planned for the Construction of Future Regional Landfill Site ‘Kalenić’; Act No. 7-21-6801; PD RB Kolubara: Lazarevac, Serbia, 2003. [Google Scholar]
- Ratković, J.; Polomčić, D.; Bajić, D.; Hajdin, B. A hydrogeological model of the open-cast mine Tamnava—West Field (Kolubara Coal Basin, Serbia). Undergr. Min. Eng. 2016, 29, 43–54. [Google Scholar] [CrossRef]
- Polomčić, D.; Bajić, D.; Ratković, J.; Šubaranović, T.; Ristić Vakanjac, V. Hydrodynamic model of the open-cast mine Tamnava—West field. In Proceedings of the VIII International Conference “Coal 2017”, Zlatibor, Serbia, 11–14 October 2017; Pavlović, V., Ed.; Yugoslav Opencast Mining Committee: Belgrade, Serbia, 2017; pp. 327–339. [Google Scholar]
- Polomčić, D.; Bajić, D.; Ratković, J.; Čokorilo Ilić, M. Groundwater balance and its components at Tamnava West field open-pit coal mine). In Proceedings of the XV Serbian Symposium on Hydrogeology, Kopaonik, Serbia, 14–17 September 2016; Vranješ, A., Vukićević, M., Eds.; Faculty of Mining and Geology, University of Belgrade: Belgrade, Serbia, 2016; pp. 483–487. [Google Scholar]
Figure 1.
Geographic location.

Figure 2.
Geological map of the extended zone of the study area. Legend: a: bedload sediments (gravel, sand and clay); dpr—diluvial-proluvial sediments; am—oxbow sediments (clay); t1—lower river terrace; Pl, Q—riverine-lacustrine terrace; Pl1—sand and clay (marly and coaly).
Figure 2.
Geological map of the extended zone of the study area. Legend: a: bedload sediments (gravel, sand and clay); dpr—diluvial-proluvial sediments; am—oxbow sediments (clay); t1—lower river terrace; Pl, Q—riverine-lacustrine terrace; Pl1—sand and clay (marly and coaly).

Figure 3.
Histograms of monthly precipitation averages for the period 1961–2013 vs. 2014 (weather station at Valjevo) and monthly average stages of the Kolubara River (gauging station at Draževac).
Figure 3.
Histograms of monthly precipitation averages for the period 1961–2013 vs. 2014 (weather station at Valjevo) and monthly average stages of the Kolubara River (gauging station at Draževac).

Figure 4.
Water levels in the open-pit mine and groundwater levels from April 2013 to December 2015.
Figure 4.
Water levels in the open-pit mine and groundwater levels from April 2013 to December 2015.

Figure 5.
Histograms and water level plots of some of the wells of the Kalenić source from 21 November 2013 to 15 January 2015: (A) Obc-OE-165 (B-2); (B) OBp-2; (C) Bp-1; (D) BL6-1; (E) BL6-2.
Figure 5.
Histograms and water level plots of some of the wells of the Kalenić source from 21 November 2013 to 15 January 2015: (A) Obc-OE-165 (B-2); (B) OBp-2; (C) Bp-1; (D) BL6-1; (E) BL6-2.

Figure 6.
Flood lakes in the western part of the Kolubara Coal Basin after the flood on 14 May 2014—status as on 22 May 2015.
Figure 6.
Flood lakes in the western part of the Kolubara Coal Basin after the flood on 14 May 2014—status as on 22 May 2015.

Figure 7.
Two typical sections of the flood lake at Tamnava West-Field.

Figure 8.
Operational research algorithm.

Figure 9.
Discretization of the extended area of the open-pit mine Tamnava–West Field, including boundary conditions.
Figure 9.
Discretization of the extended area of the open-pit mine Tamnava–West Field, including boundary conditions.

Figure 10.
Schematic representation of the lithological section in the north–south (columns) and west–east (rows) directions. Key: 1. Clay sediments (Q); 2. Upper aquifer sands and gravel (Pl1) 3. Aleurite sediments (Pl1); 4. First coal bed (Pl1); 5. Intermediate aquifer sands (Pl1); 6. Second coal bed (Pl1) 7. Lower aquifer of high hydraulic conductivity (Pl1); 8. Lower aquifer sands of lower hydraulic conductivity (Pl1); and 9. Heterogeneous material at waste disposal site.

Figure 11.
Groundwater levels of the lower aquifer (7th model layer)–April 2014.

Figure 12.
Calibration graph of recorded and modeled piezometric head (April 2014).

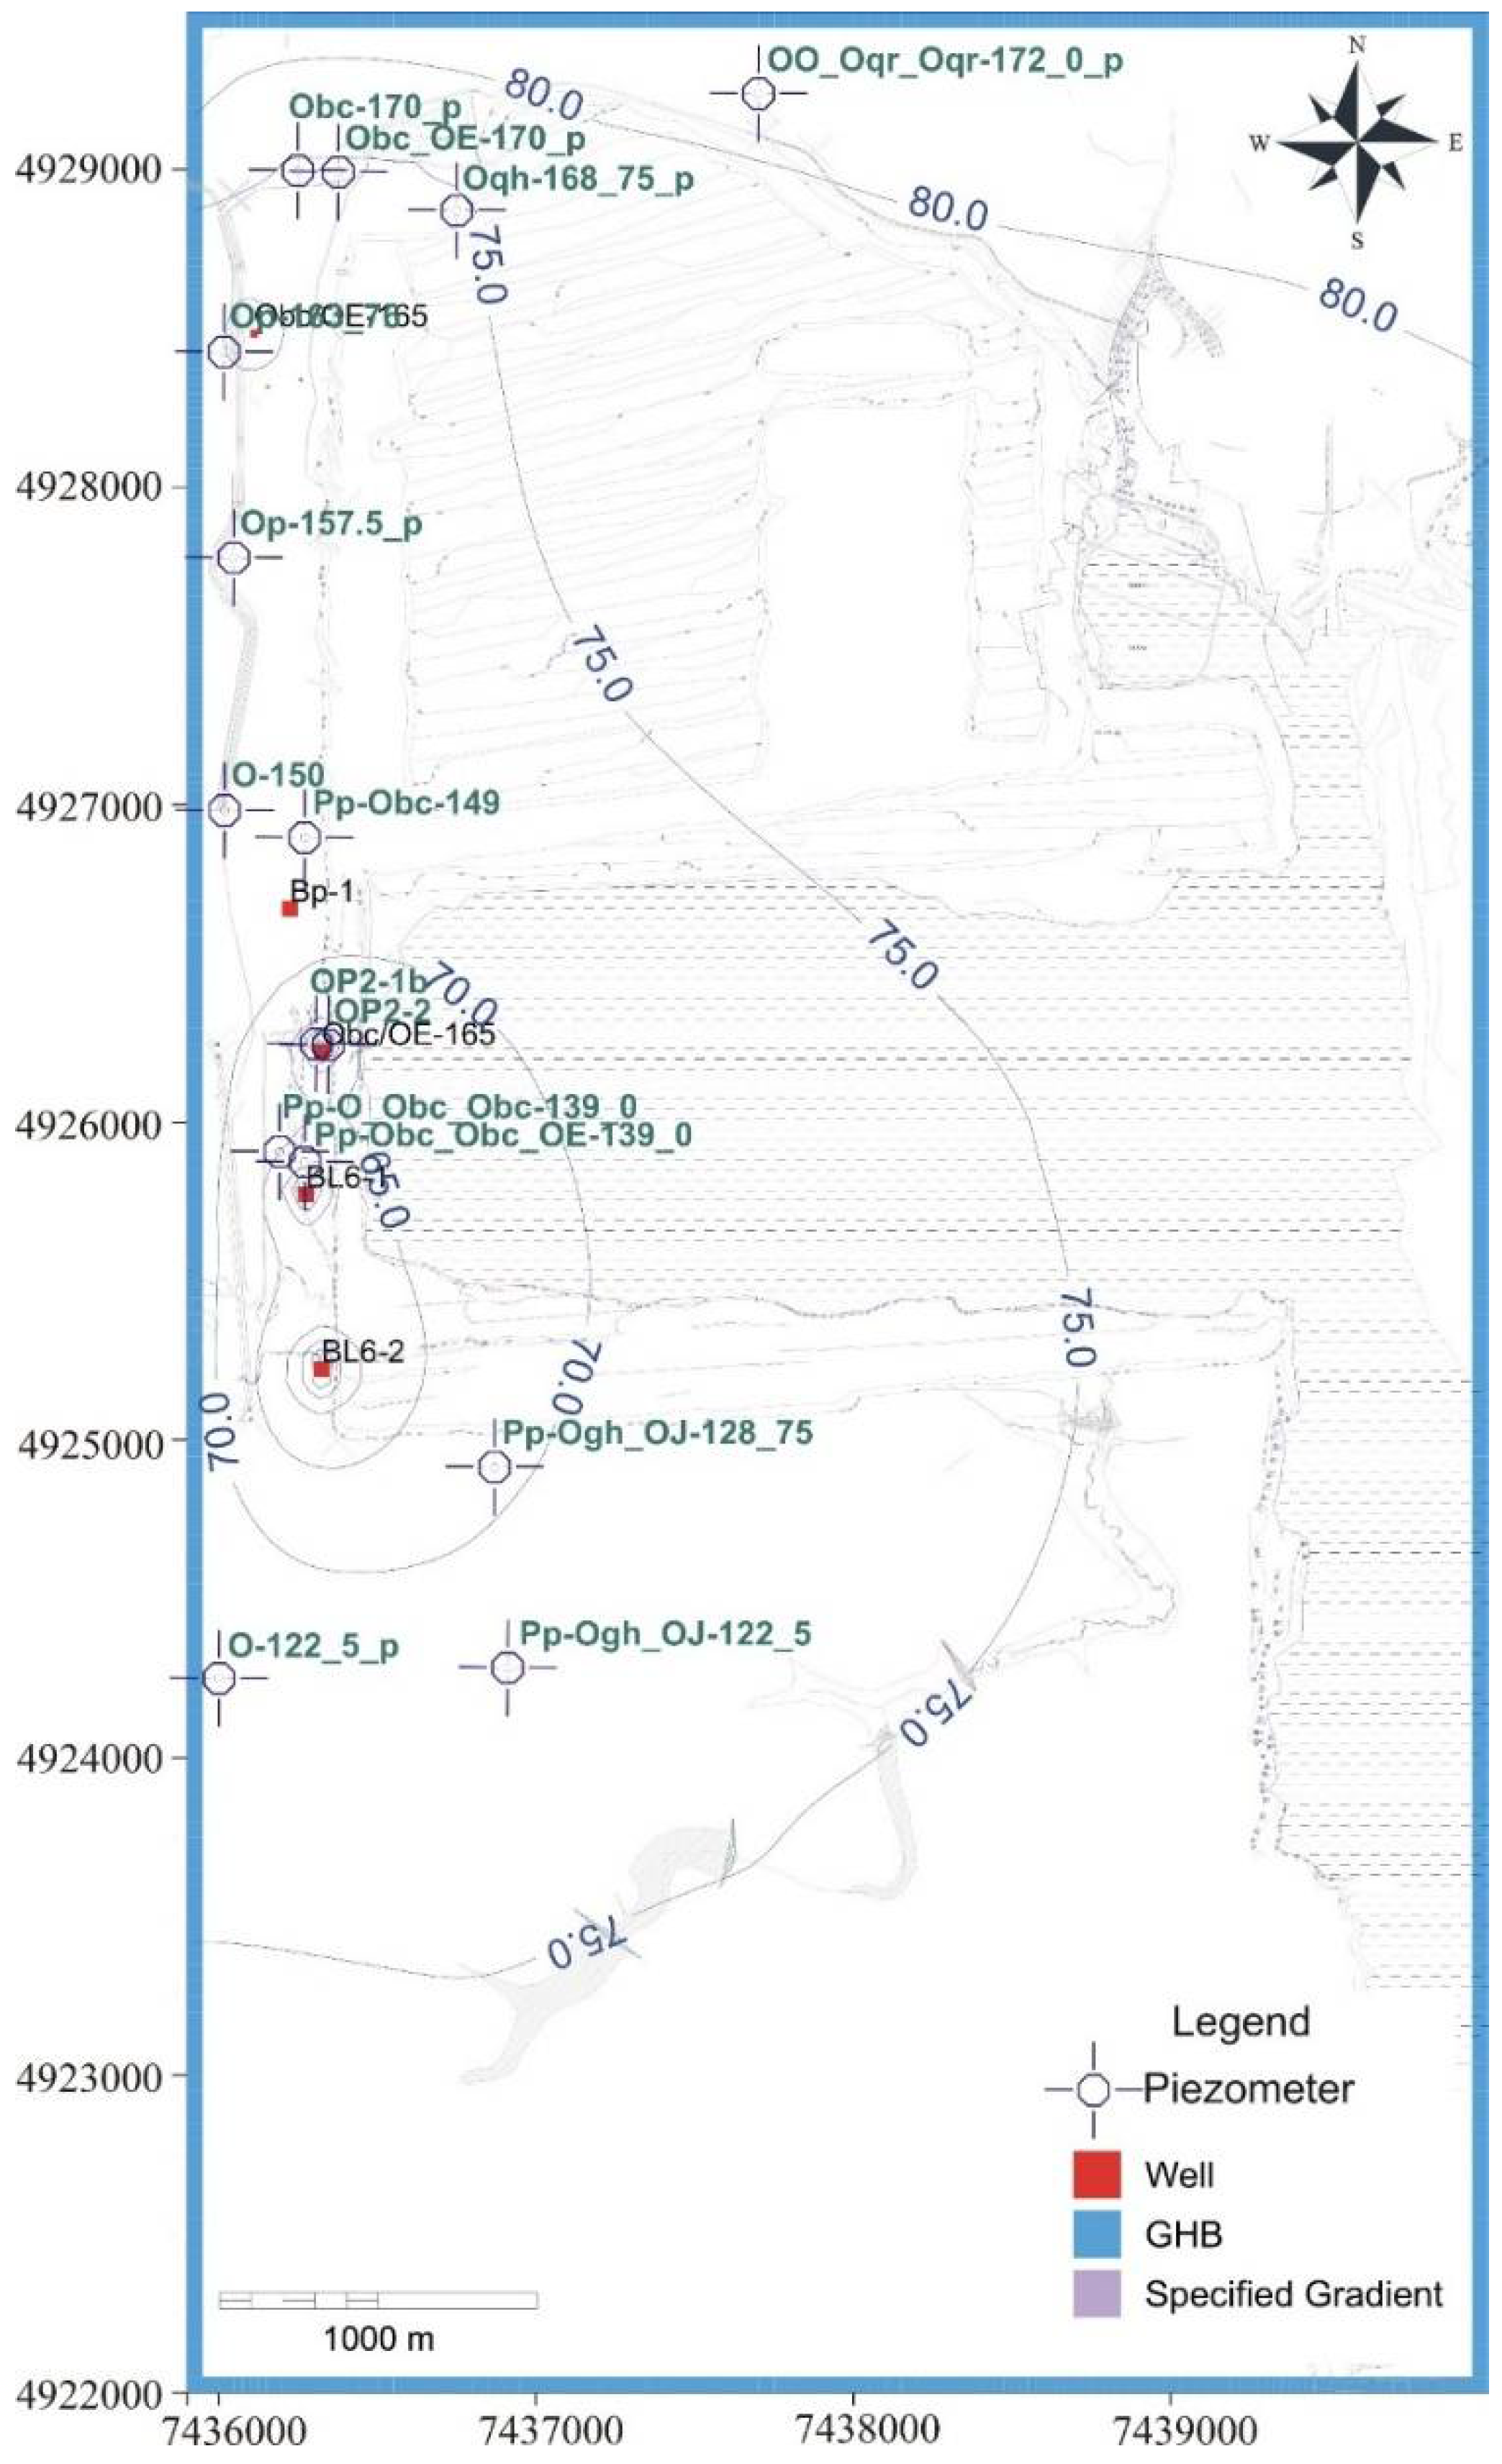
Figure 13.
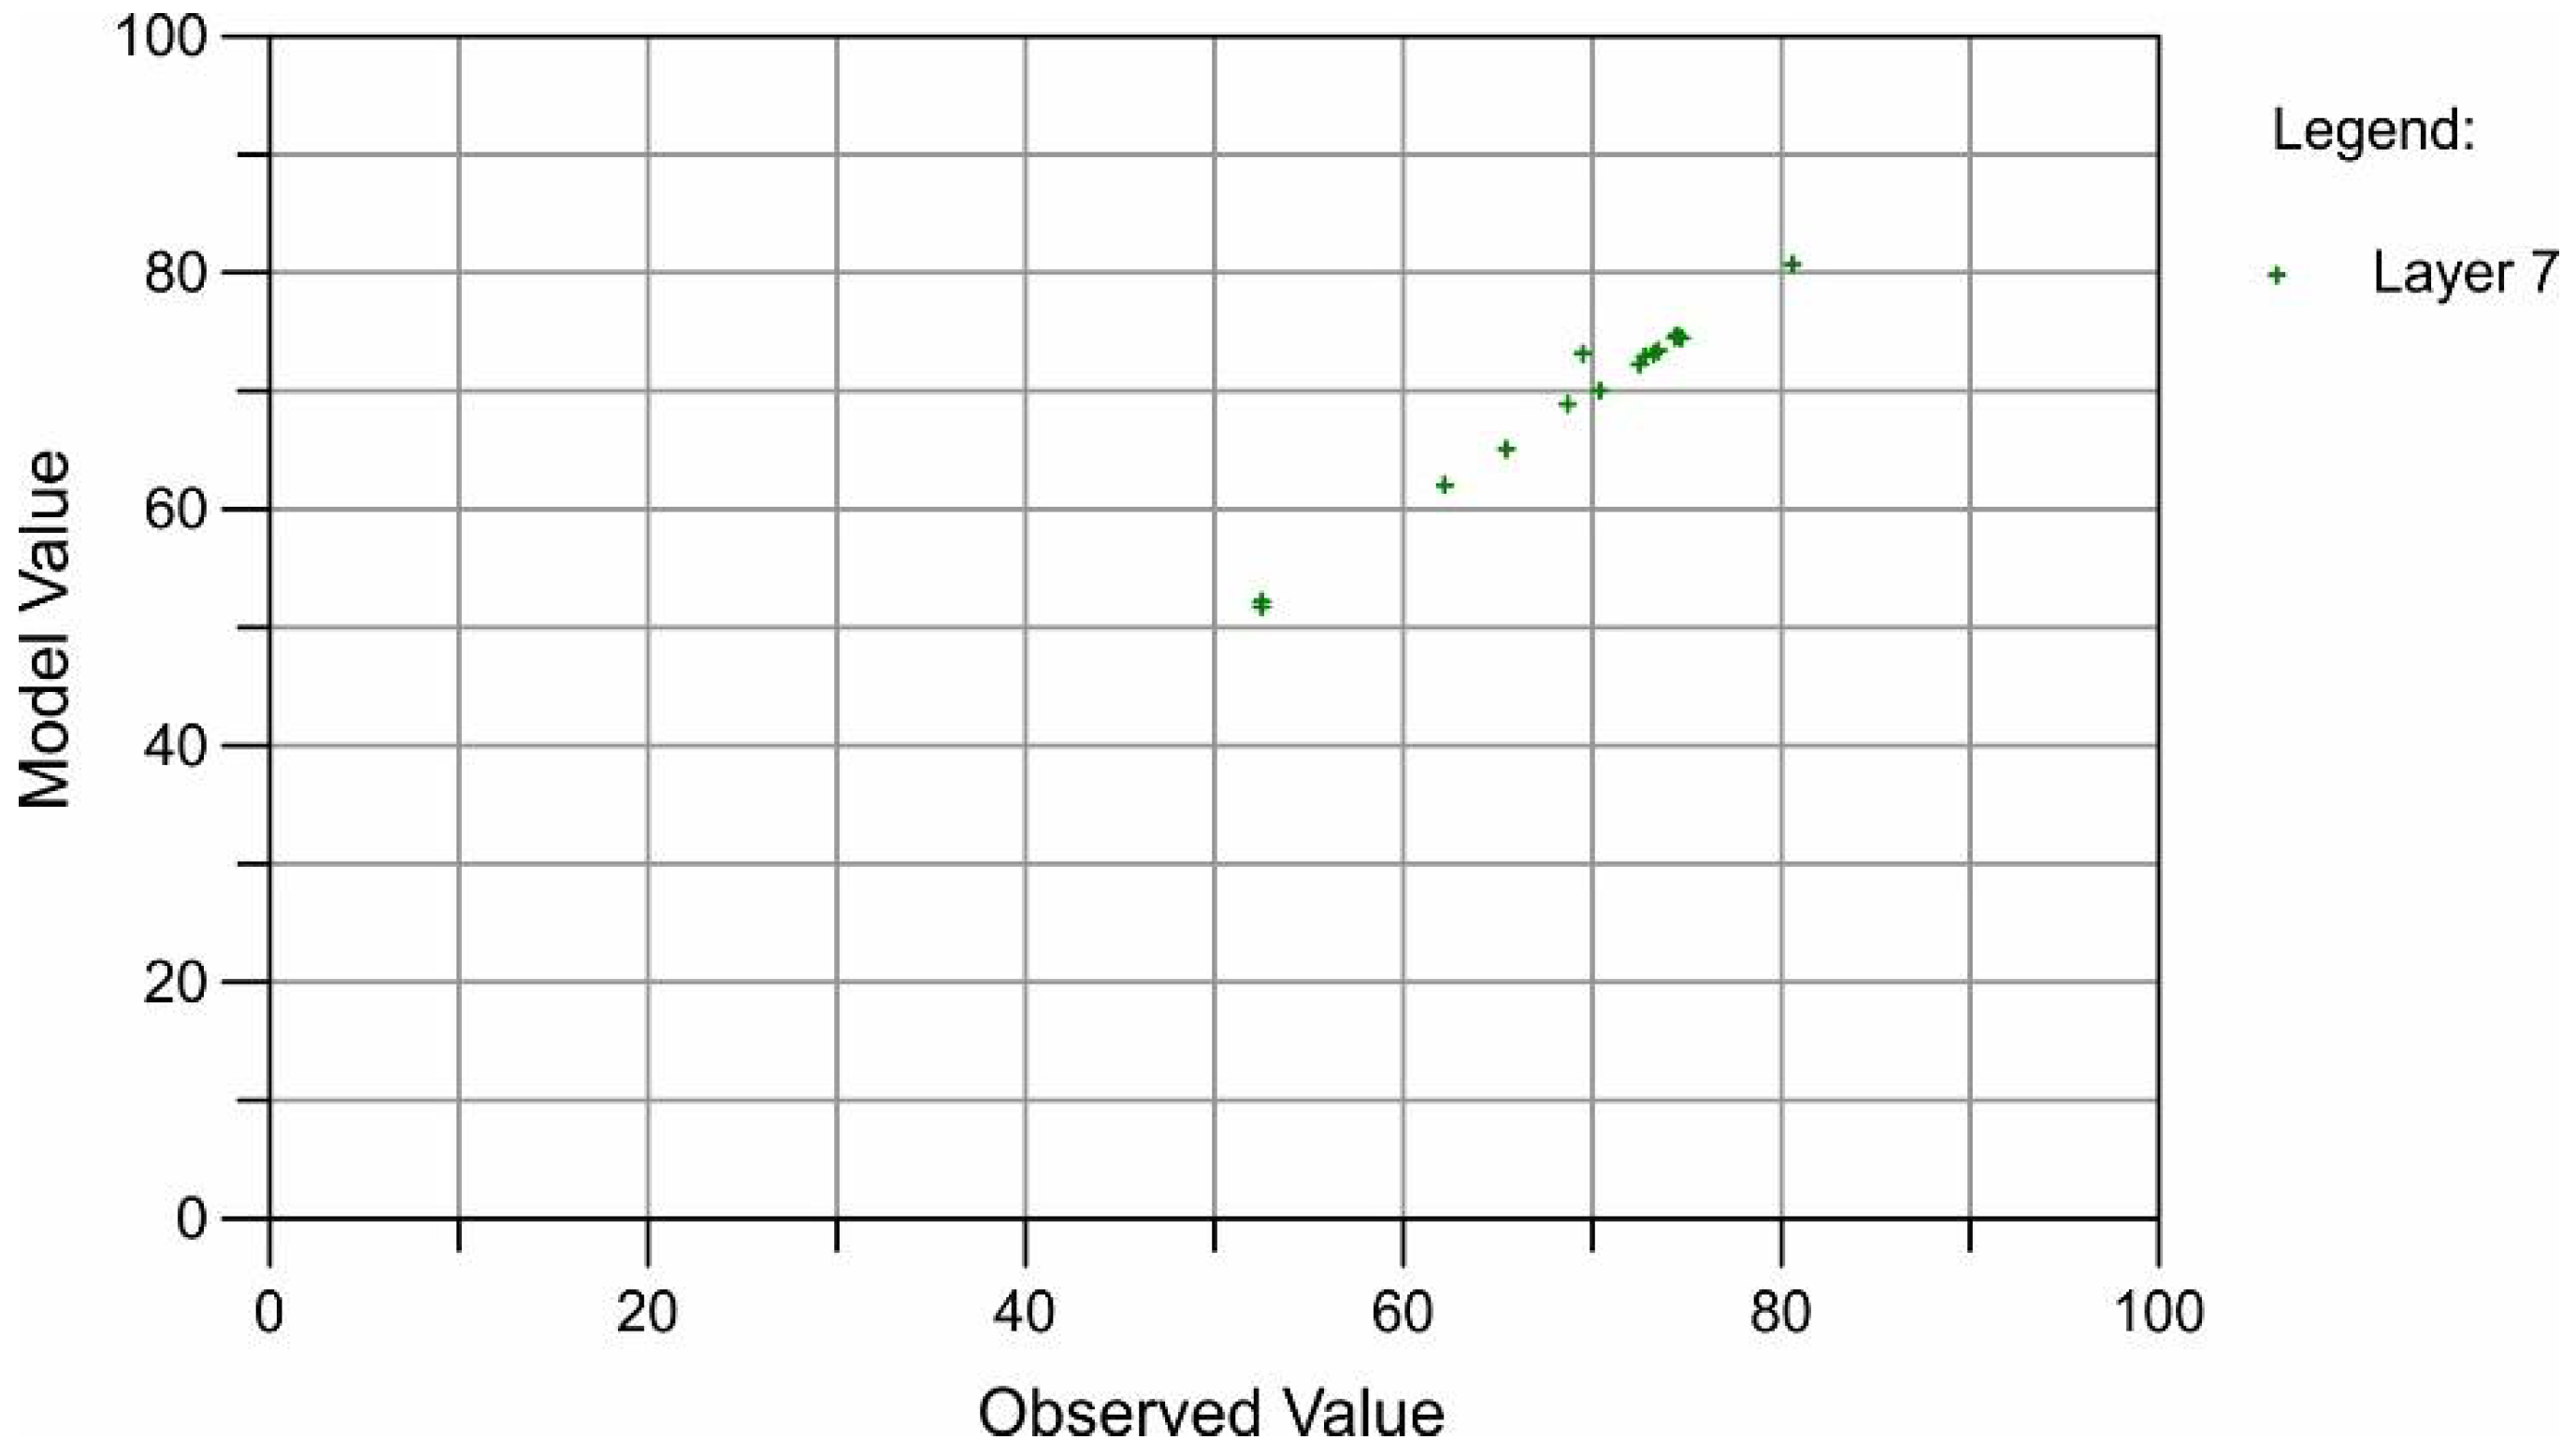
Groundwater levels of the lower aquifer (7th modeled layer)—September 2014.

Figure 14.
Calibration graph of recorded and simulated piezometric head (September 2014).

Figure 15.
Coefficient of determination of parameters during the second period (May–September 2014).
Figure 15.
Coefficient of determination of parameters during the second period (May–September 2014).

Figure 16.
Groundwater mound two months after the flood (July 2014).

Figure 17.
Groundwater levels of the lower aquifer (7th modeled layer)—June 2015.

Figure 18.
Calibration graph of registered and calculated piezometric head at observation points in June 2015.
Figure 18.
Calibration graph of registered and calculated piezometric head at observation points in June 2015.

Figure 19.
Coefficient of determination of parameters during the second period (October 2014–December 2015).
Figure 19.
Coefficient of determination of parameters during the second period (October 2014–December 2015).

Figure 20.
“Residual” groundwater 19 months after the creation of the flood lake at Tamnava–West Field (December 2015).
Figure 20.
“Residual” groundwater 19 months after the creation of the flood lake at Tamnava–West Field (December 2015).


Table 1.
Schematic view of the flow field—presentation of the lithological units in the model layers with initial values of hydraulic conductivity and specific storage.
Table 1.
Schematic view of the flow field—presentation of the lithological units in the model layers with initial values of hydraulic conductivity and specific storage.
| Model Layer | Lithological Units | Kx = Ky (m/s) | Kz (m/s) | Ss (1/m) |
|---|---|---|---|---|
| First confining layer (stratum) | Quaternary clay and heterogeneous mine waste in the northern part of the area | 5 × 10⁻⁶ | 5 × 10⁻⁷ | 0.001 |
| Second combined water-bearing layer | Upper aquifer sand and gravel | 5 × 10⁻⁴ | 5 × 10⁻⁵ | 2.2 × 10⁻⁵ |
| confining layer | and heterogeneous mine waste in the northern part of the area | 1 × 10⁻⁶ | 1 × 10⁻⁷ | 0.001 |
| Third confining layer | Aleurites and mine waste in the northern part of the area | 5 × 10⁻⁶ | 5 × 10⁻⁷ | 0.001 |
| Fourth confining layer | First coal bed | 5 × 10⁻⁹ | 5 × 10⁻¹⁰ | 6.0 × 10⁻⁵ |
| Fifth combined water-bearing confining layer | Intermediate aquifer sands in the western and central parts in front of the mine contour | 1 × 10⁻⁵ | 5 × 10⁻⁶ | 3.2 × 10⁻⁵ |
| confining layer | Heterogeneous mine waste in the northern part of the area, clay sediments in the north-eastern part and coals in the eastern and southern parts of the area | 1 × 10⁻⁶ | 1 × 10⁻⁷ | 0.001 |
| Sixth confining layer | Second coal bed | 5 × 10⁻⁹ | 5 × 10⁻¹⁰ | 6.0 × 10⁻⁵ |
| Seventh water-bearing layer | Lower aquifer sands of high hydraulic conductivity | 3 × 10⁻⁵ | 5 × 10⁻⁶ | 3.2 × 10⁻⁵ |
| Eighth water-bearing layer | Lower aquifer sands of low hydraulic conductivity | 1 × 10⁻⁵ | 5 × 10⁻⁶ | 3.2 × 10⁻⁵ |
© 2018 by the authors. Licensee MDPI, Basel, Switzerland. This article is an open access article distributed under the terms and conditions of the Creative Commons Attribution (CC BY) license (http://creativecommons.org/licenses/by/4.0/).
Share and Cite
MDPI and ACS Style
Polomčić, D.; Bajić, D.; Ratković, J. Assessment of Historical Flood Risk to the Groundwater Regime: Case Study of the Kolubara Coal Basin, Serbia. Water 2018, 10, 588. https://doi.org/10.3390/w10050588
AMA Style
Polomčić D, Bajić D, Ratković J. Assessment of Historical Flood Risk to the Groundwater Regime: Case Study of the Kolubara Coal Basin, Serbia. Water. 2018; 10(5):588. https://doi.org/10.3390/w10050588
Chicago/Turabian StylePolomčić, Dušan, Dragoljub Bajić, and Jelena Ratković. 2018. "Assessment of Historical Flood Risk to the Groundwater Regime: Case Study of the Kolubara Coal Basin, Serbia" Water 10, no. 5: 588. https://doi.org/10.3390/w10050588
Note that from the first issue of 2016, this journal uses article numbers instead of page numbers. See further details here.