Article

Assessment of the Water Treatment Process’s Empirical Model Predictions for the Management of Aesthetic and Health Risks Associated with Cyanobacteria

1
UNSW Water Research Centre, School of Civil and Environmental Engineering, The University of New South Wales (UNSW Sydney), Sydney, NSW H3T 1J4, Australia
2
Civil, Mineral and Mining Engineering Department, École Polytechnique de Montreal, Montreal, QC H3C 3A7, Canada
3
The bioMASS Lab, School of Chemical Engineering, The University of New South Wales (UNSW Sydney), Sydney, NSW H3T 1J4, Australia
4
South Australian Water Corporation (SA Water), Adelaide, SA 5001, Australia
*
Author to whom correspondence should be addressed.
Water 2018, 10(5), 590; https://doi.org/10.3390/w10050590
Submission received: 16 March 2018 / Revised: 16 April 2018 / Accepted: 17 April 2018 / Published: 2 May 2018
(This article belongs to the Special Issue Eutrophication of Waterways: An Old Problem with Modern Consequences)

Abstract

:
Potentially toxic cyanobacteria have been increasingly detected worldwide in water supply systems in recent years. The management of cyanobacteria in source water and through drinking water treatment processes has been a focus of global research for over thirty years. However, despite the volume of research outcomes and the publication of guidance documents, gaps still exist in the knowledge base that inhibits the confident application of individual treatment strategies for the mitigation of aesthetic and health risks associated with cyanobacteria and their metabolites at the full-scale. The main objective of this project is to deliver a suite of tools and other resources to the water industry to support the implementation of a regulatory framework for the management of water quality for the assessment and management of aesthetic and toxicity risks associated with cyanobacteria. This study includes (1) the development of a guide (based on real-world examples) for treatment plant operators to perform plant audits and investigative sampling to assess the risk associated with cyanobacteria in their plants, and validate the performance of existing unit processes, and (2) the validation of a treatment model that can be applied at any plant and used to as a guide to the removals of cyanobacteria and metabolites and the expected quality of treated water under a range of challenges from cyanobacteria. Full-scale sampling was undertaken at three Australian regions in 14 water treatment plants to validate the model. The results presented in this paper represent a comprehensive database of full-scale removal efficiencies of 2-methylisoborneol (MIB) and geosmin for a range of water quality and treatment processes. The major findings and conclusions from this project include: (1) the investigative sampling procedures developed are effective and have been successfully applied by utilities; and (2) while routine monitoring data is important, investigative sampling within the water treatment plant provides more detailed and insightful information about the effectiveness of unit processes within the plant. This paper also identifies the knowledge gaps and needs for further studies.

1. Introduction

Potentially toxic cyanobacteria have been increasingly detected in water supply systems in recent years across the planet including Australia [1,2,3,4,5,6,7]. Several factors including eutrophication and climate change, influence the growth of cyanobacteria and these must be considered when predicting and managing the levels of cells, toxins, and taste and odor (T&O) compounds in water treatment plants [8,9]. The most undesirable effects of cyanobacterial blooms in the water supply systems include:
  • Sudden changes in raw water characteristics (for example, pH), disruption of treatment processes including malfunction of flocculation reactions, increasing the consumption of coagulant and generation of disinfection by-products due to organic materials associated with bloom matrix;
  • Production of potent toxins with human health hazards from hepatotoxins to neurotoxins;
  • Production of T&O compounds such as the most commonly occurring geosmin and 2-methylisoborneol (MIB). These T&O compounds are very difficult to remove from water, for example, conventional treatment (coagulation/clarification, filtration, and oxidation using chlorine and hydrogen peroxide) is inefficient for their treatment;
  • Accumulation of toxic cells and T&O producing cells during the treatment processes within water treatment plants and the consequent breakthrough of toxins, cells and, T&O compounds into treated water [6,10,11,12,13,14,15,16].
Cyanobacterial management in source water and through drinking water treatment processes has been the focus of global research for over thirty years worldwide including in North America, Europe, and South-East Asia [7,16,17]. Australia is considered a world leader in cyanobacteria management, due to the Australian extensive research programs and the practical application of the outcomes from the many investigations that have been undertaken since the early 1980’s [6,18,19,20,21]. However, despite the volume of research outcomes and the publication of guidance documents, gaps still exist in the knowledge base that inhibit the confident application of individual treatment strategies for the mitigation of aesthetic and health risks associated with cyanobacteria and their metabolites at the full-scale [16,21].
Some of the questions that reflect the current knowledge gaps and risks are:
  • How can utilities have confidence in the application of various treatment processes when they are often site/system specific?
  • What is the evidence of the removals of cyanobacteria and metabolites reported in the literature and of the achievability of guidance manuals at the full-scale?
  • How can we assess and validate the efficiencies of unit processes at individual treatment plants?
  • What is the combined mitigation effect of the entire treatment train?
  • In the case of a toxic bloom, how can we determine the point at which we are at risk of distributing water that does not meet the guidelines for toxin concentrations?
The main objective of this project is to deliver a suite of tools and other resources to the water industry to support the implementation of the regulatory framework for the management of water quality for the assessment and management of the aesthetic and toxicity risks associated with cyanobacteria. The specific objectives of this project are (1) to develop a guide (based on real-world examples) for treatment plant operators to perform plant audits and investigative sampling to assess the risk associated with cyanobacteria in their plants, and to validate the performance of existing unit processes, and (2) to validate a treatment model that can be applied at any plant and used to as a guide to the removals of cyanobacteria and metabolites and the expected quality of treated water under a range of challenges from cyanobacteria. To the best of authors’ knowledge, this paper presents, for the first time, the step-by-step process for plant audit and process performance modeling for the removal of potentially harmful cyanobacteria.

2. Materials and Methods

2.1. Development of Empirical Models for the Removal of Cyanobacteria and Their Metabolites

An empirical, Excel-based tool that could be used to estimate the removals for cyanobacterial metabolites through individual treatment processes and the treatment plant as a whole was developed during this project [21]. The unit process removals were based on previous research undertaken by the South Australian Water Corporation (SA Water) over the past 20 years. The spreadsheet was modified for the target treatment plants depending on the treatment processes in use at each plant [21]. The models are empirically-based and designed to be used only as a simple tool to give guidance as to the removals that might be expected under optimum conditions.
A number of assumptions were used in the development of the tools [21]:
When powdered activated carbon (PAC) is used there is a contact time of 30 min prior to the addition of coagulant (considered optimum)
  • The removals of the metabolites by PAC are the same in all water quality
  • The PAC used is the equivalent of Activated Carbon Technologies’ PS1000 (unless otherwise stated)
  • PAC adsorption will achieve the same removal of metabolites as determined in batch experiments undertaken in the laboratory
  • PAC application removes only dissolved metabolites and does not affect the intracellular component
  • The removal of the cyanobacteria through coagulation and clarification is constant at 95% regardless of the type of cyanobacteria, coagulant, or clarification process
  • Coagulation and clarification does not affect the concentration of the dissolved metabolites
  • Filtration does not remove dissolved or intracellular metabolites
  • Chorine will lyse any cyanobacteria reaching the disinfection point
  • Chlorination will achieve the same oxidation of toxins as determined in batch experiments undertaken in the laboratory
  • The removals of the cyanotoxins by chlorination are the same in all water quality

2.1.1. PAC and Chlorine Removal Equations

The PAC removals are based on laboratory batch experiments where metabolites were spiked into raw water and the removals were determined at a range of doses after 30 min of contact time. This was undertaken on two PACs, both supplied by Activated Carbon Technologies, PS1000 and PS1000F. These PACs are of good quality coal-based carbons with high adsorption capacities and good kinetic properties. Similar batch experiments were used for the chlorination of cells and metabolites [21].

2.1.2. Cyanobacteria and Metabolite Removal Tools

Two cyanobacteria and metabolite removal tools were developed (Newcombe et al., 2018). The first tool was a generic tool that incorporates the unit processes: (i) PAC application, (ii) coagulation/clarification, and (iii) chlorination. Figure SI-1 (see Supplementary Materials) shows the generic tool. The required user inputs are dissolved and intracellular concentrations, PAC dose, and chlorine CT (for toxins). The empirical equations within the tool estimate the concentrations of dissolved and intracellular metabolites after each unit process and at the end of the treatment train according to the assumptions outlined above.
The second tool was a specific tool. As the spreadsheet is a simple calculator with empirical equations in specific cells, the tools can be modified for any system where specific treatment data exists. For example in a plant where granular activated carbon (GAC) is used as the filtration step after coagulation and dissolved air flotation, the removals for MIB and geosmin were based on the removals by adsorption obtained from historic GAC filters which have treated a similar volume of water.

2.2. Monitoring in Full-Scale Plants for Verification of the Estimates Produced by the Tools

Full-scale sampling was undertaken at three Australian regions in 14 water treatment plants (WTPs): South Australia, Wannon, and Hunter [21]. In all, there were 27 treatment train sampling events. The treatment trains all had coagulation as a first step with sedimentation, flotation or ultrafiltration as the clarification step. PAC was used in some of the plants, and filtration was through sand, dual media, or granular activated carbon (GAC). Two plants demonstrated biological removal through filtration [21]. Sampling was conducted in South Australian water treatment plants at 10 locations from 2015 to 2017 (Figure SI-2, see Supplementary Materials). Cyanotoxins were not detected during any sampling. Wannon water sampled at three treatment plants during 2015–2016 and Hunter water sampled only in 2015 at one plants. Furthermore, these plants and the conditions of their source water provided the unique opportunity for investigative sampling from source to treated water during bloom events. For detailed information on studied treatment plants refer to Newcombe et al. [21].

3. Results and Discussion

3.1. Guide Development to Perform Plant Audits and Investigative Sampling to Assess Risk Associated with Cyanobacteria

The first objective of this project is the development of a guide for the treatment of plant operators to perform plant audits and investigative sampling to assess the risk associated with cyanobacteria in their plants, and to validate the performance of existing unit processes. From the total number of plants used in this study, the authors have decided to present the results of two plants as examples of audit and risk assessment process (WTP-A and WTP-B). These plants were selected because they provided the largest number sampling points and conditions that would facilitate implementation of the study results to our water treatment plants. A similar process was used in the other plants [21] with great success. Processed data from all plants are presented in Section 3.2.2 and used to validate the model.
Figure 1 shows the routine monitoring data for geosmin in the raw and product waters for a three year period in WTP-A [21]. Concentrations in the raw water can reach over 200 ng/L, with the concentration of dissolved geosmin less than 50% of the total. The ratio of dissolved and intracellular metabolites plays an important role in the performance of treatment processes [22,23,24,25,26,27]. Treated water geosmin concentrations rarely exceed the 10 ng/L goal; however, during the summer of 2016/2017, high concentrations of geosmin were breaking through the plant at times. These results help to identify the processes at the risk of metabolite breakthrough (Figure 1).
While routine monitoring data is important for the verification of the efficiency of the entire treatment train for producing high-quality drinking water, it does not identify the efficiencies of the individual unit processes. The assessment of both the long-term data and “snapshot” in-plant sampling are both important for the assessment of potential risks to water quality from T&O and cyanotoxins.
Investigative sampling was undertaken through the WTP-A three times in February 2017 while the reservoir was experiencing high concentrations of Dolichospermum circinale producing geosmin. The operators were dosing 30 mg/L PAC during this period as there was a significant breakthrough in the treated water; operator experience and the use of PAC dosing calculators indicated that this dose should have been sufficient to mitigate the problem in an efficiently operating dissolved air flotation filtration (DAFF) plant where the dissolved component of the geosmin was only one quarter to one third of the total. The investigative sampling results shown in Figure 2 provide strong evidence of several potential causes of the breakthrough of geosmin into treated water [21].
The PAC appears to be moderately effective (72–84% removals) for the removal of these T&O compounds; however, these removals were lower than would be expected from previous experience [6,20,21]. In addition, during each sampling, the intracellular geosmin was reduced during the PAC application in the pipe to the treatment plant (43–74%). If it is assumed that this reduction was caused by damage to the cells and consequent release as dissolved geosmin, the percentage removals of extracellular geosmin increase to 87–91%. Subsequent sampling through WTP-A indicated that all intracellular geosmin remaining after PAC treatment was released during the flotation process where no further removal occurred (Figure 2). The two issues negatively impacting on the removal efficiencies identified by investigative sampling at this plant were: (1) There was damage to the cyanobacteria and release of dissolved geosmin during the PAC treatment; and (2) all remaining cyanobacteria were lysed during the flotation processes increasing the dissolved concentration without further removal by PAC during this process.
An unexpected mitigation factor was the additional removal of dissolved geosmin during the filtration process, possibly due to some biological removal. The filters at WTP-A are not disinfected, allowing a biofilm to flourish. The sand in the filters is of a small particle size, which has been identified in previous work as a factor enhancing biological activity due to providing a higher surface area for greater biomass growth [16].
Investigative sampling was undertaken through the WTP-B in February and March 2015 [21]. The results are shown in Figure 3. The dissolved MIB removals by PAC are low due to the low contact time and relatively ineffective mixing. No further removal occurred from post-PAC to the end of sedimentation. For the three sampling days, intracellular MIB appeared to decrease during PAC treatment which may suggest a higher percent removal by PAC than indicated by the decrease in dissolved MIB alone. A lower than expected removal of intracellular MIB during coagulation and clarification was found on 24 February 2015 (80% compared with >95% for the other sampling days). On the three sampling days, the most effective unit process for dissolved MIB removal was the conventional rapid dual media filters which displayed removal below detection, indicating the use of PAC was not required. The sampling in WTP-A and WTP-B provide two complete examples of the audit process in full-scale water treatment plants to identify the critical treatment points.

3.2. Model Development and Validation

This section presents a validated treatment model that can be applied at any plant and used a guide to assess the removal of cyanobacteria and their metabolites and the expected quality of treated water under a range of challenges from cyanobacteria [21].

3.2.1. Model Development

To develop the model, a number of assumptions were made (presented in Section 2.1). These assumption are based on the knowledge gathered from previous published studies [6,12,13,14,15,20,21,28,29,30]. It should be noted that, due to these assumptions, in most cases, the tools will provide an overestimation of the removals as full-scale treatment plants represent less than ideal conditions compared with laboratory-derived data. An example of the results for MIB and geosmin removal with PS1000F is given in Figure 4a. Graphical software (Origin 8 SR2) was then used to fit the data with an empirical exponential equation. The fitted curve is also shown in the graph. The equation is then applied to the appropriate sheet of the calculator to calculate the remaining concentration given an initial concentration and PAC dose. For example, the equation used to fit the MIB removal curve in this example is
Percent removal = −100.732 × exp(−PAC dose/12.73842) + 96.68222
Therefore, for a given PAC dose and initial concentration, the final concentration can be estimated by
Final conc. = Initial conc. × (Percent removal/100)
The final concentration of toxins after chlorination is calculated within the spreadsheets in a similar manner. An example of the chlorine oxidation data and fitted curve is given in Figure 4b. It is recommended that the datasets such as these are generated for individual WTPs using plant relevant design and operational info such as PAC type, contact time, and water quality conditions, to obtain more relevant estimations from the tools.
As mentioned above, these tools are based on laboratory data and should be considered guides only for the estimation of finished water quality during a cyanobacteria challenge to a WTP. Prior to application, the tools must be tested to determine their validity at the full-scale. This task was undertaken by using full-scale monitoring data, where available, and investigative sampling in individual plants.
In the next section, the routine monitoring data and results from individual plant investigative sampling for MIB and geosmin are presented. Then in Section 4, actual removals achieved through the plants as shown by the investigative sampling are compared with the removals predicted by the spreadsheet calculators.

3.2.2. Model Validation

In this section, the predictions based on the tools introduced in Section 3.2.1 are compared with the full-scale investigative sampling results [21]. The raw water metabolite concentrations ranged up to 611 ng/L. The lowest concentration reported was 9 ng/L. Graphical representation of the results is given in Figure 5. The results are grouped according to the type of treatment:
  • Conventional treatment with PAC where there is no (or very low) contact time prior to coagulant addition (conv with PAC no contact)
  • Conventional treatment with PAC where there is a contact time prior to coagulant addition (conv with PAC)
  • Dissolved air flotation with PAC (DAF with PAC)
  • Dissolved air flotation without PAC (DAF no PAC)
  • Dissolved air flotation followed by GAC (DAF GAC)
  • Plants where biological filtration is known to occur through comprehensive laboratory testing (biological filtration)
The tools predicted the final concentrations of MIB and geosmin to within 5 ng/L for the conventional treatment plants with pre-coagulation contact time, with the exception of one sample where the initial concentration of geosmin was 611 ng/L. The other samples had initial concentrations ranging from 9 ng/L to 91 ng/L (n = 10, mean = 41, median = 35). The plants without a pre-contact time for PAC were also reasonably close, within 2 ng/L and 11 ng/L.
The predictions for the DAF plants displayed larger deviation from the predicted values, due to the damage to the cells and the release of intracellular metabolites within the flotation cell. The plants known to achieve effective removal by biological filtration displayed the greatest deviation from the predicted values in the final product water, as expected, as the values in the treated water were below detection regardless of the filter inlet concentration. When the concentrations in all of the plants were compared prior to the filtration stage, the deviations were less for the two plants with biological filtration and in general, very good. In contrast, the results from WTP-A displayed a greater variation from predicted as the filters appeared to remove a large percentage of the metabolites (Figure 5 and Figure 6). When the investigative sampling data were compared with concentrations estimated by the modeling tool:
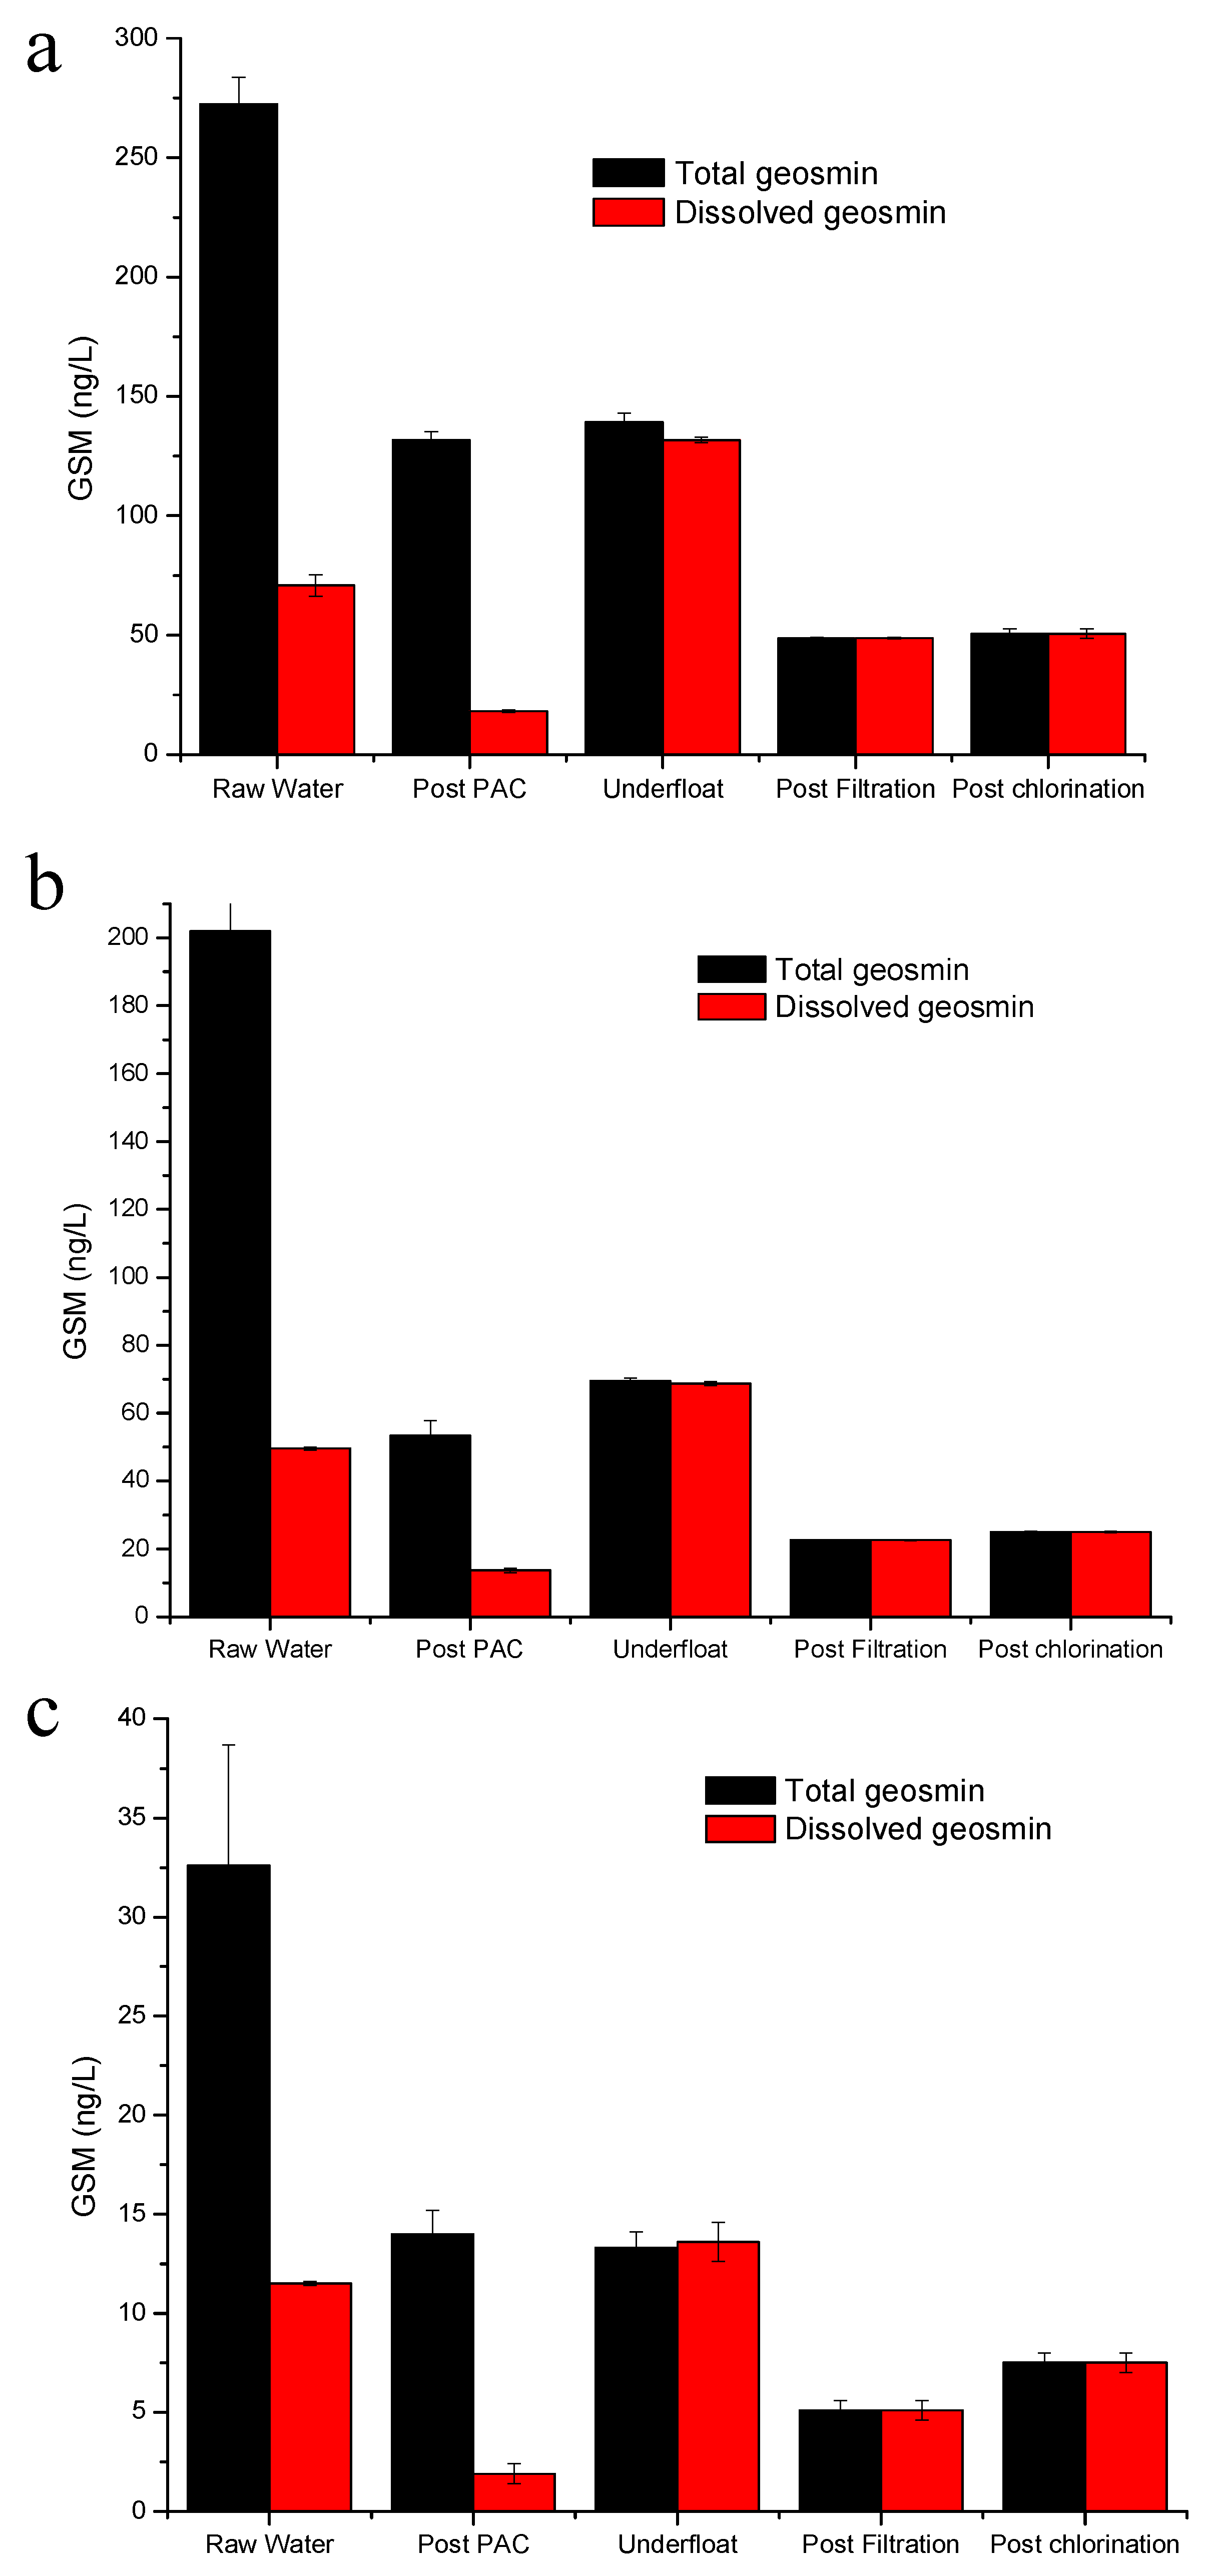
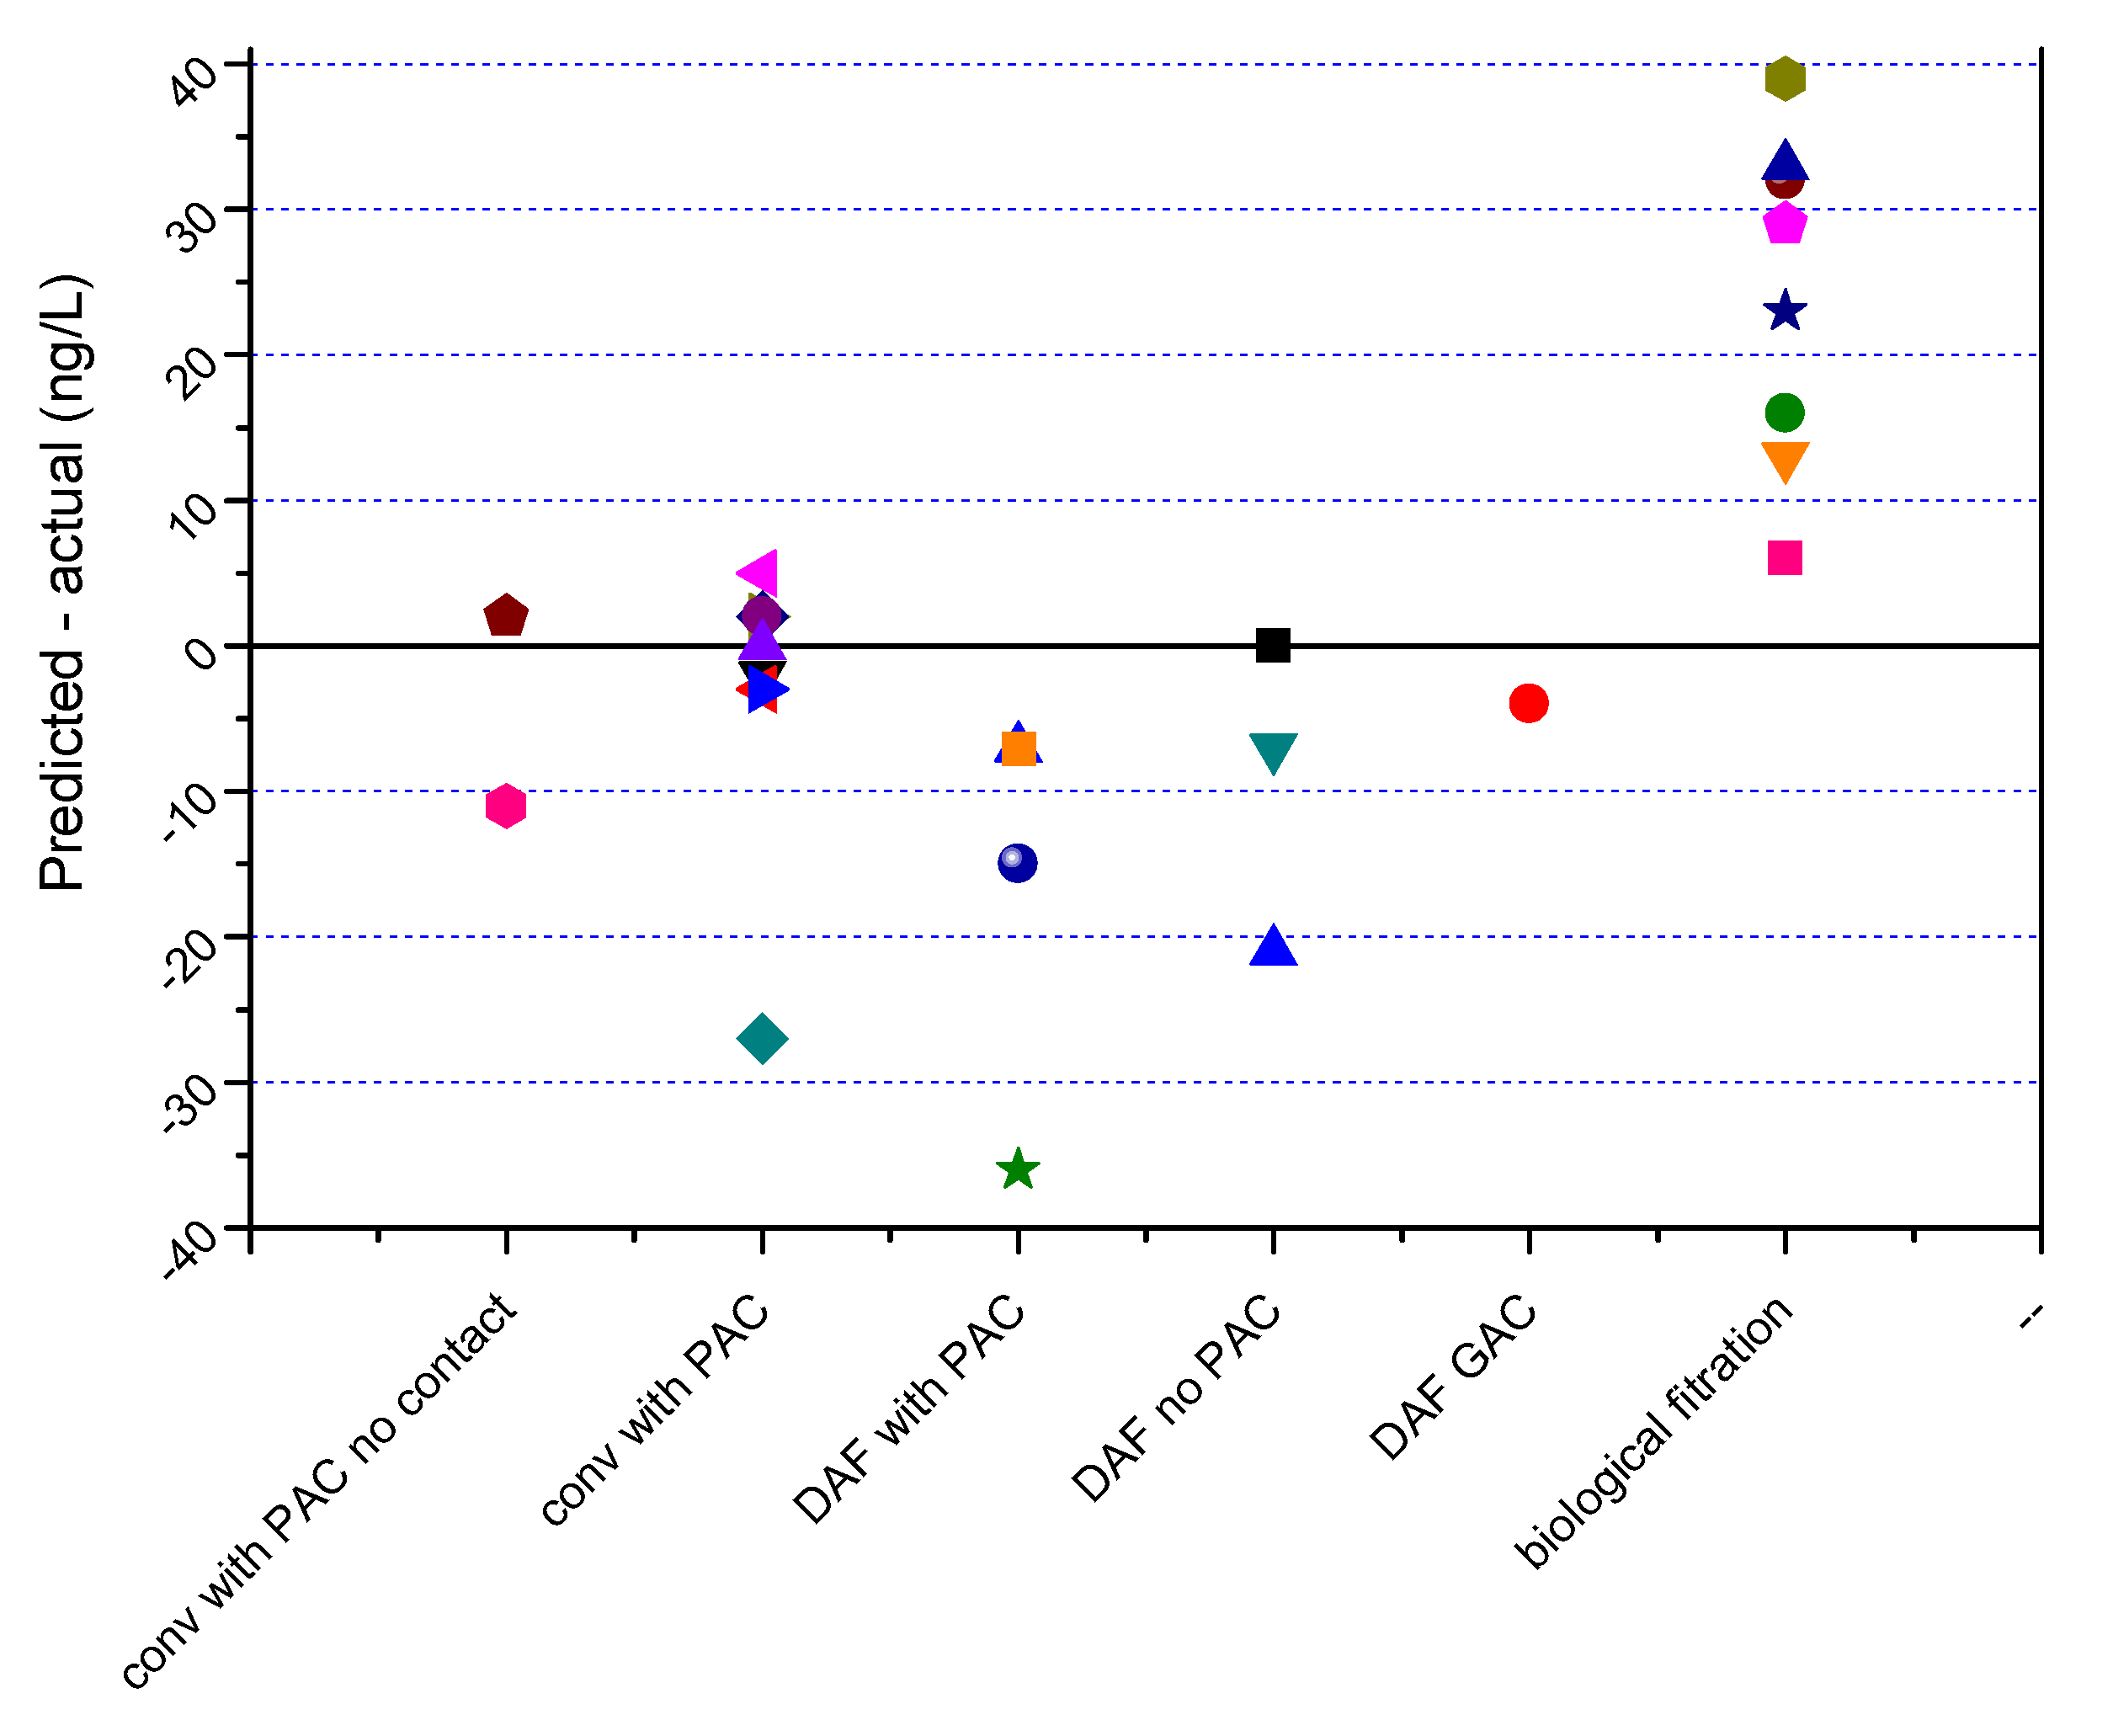
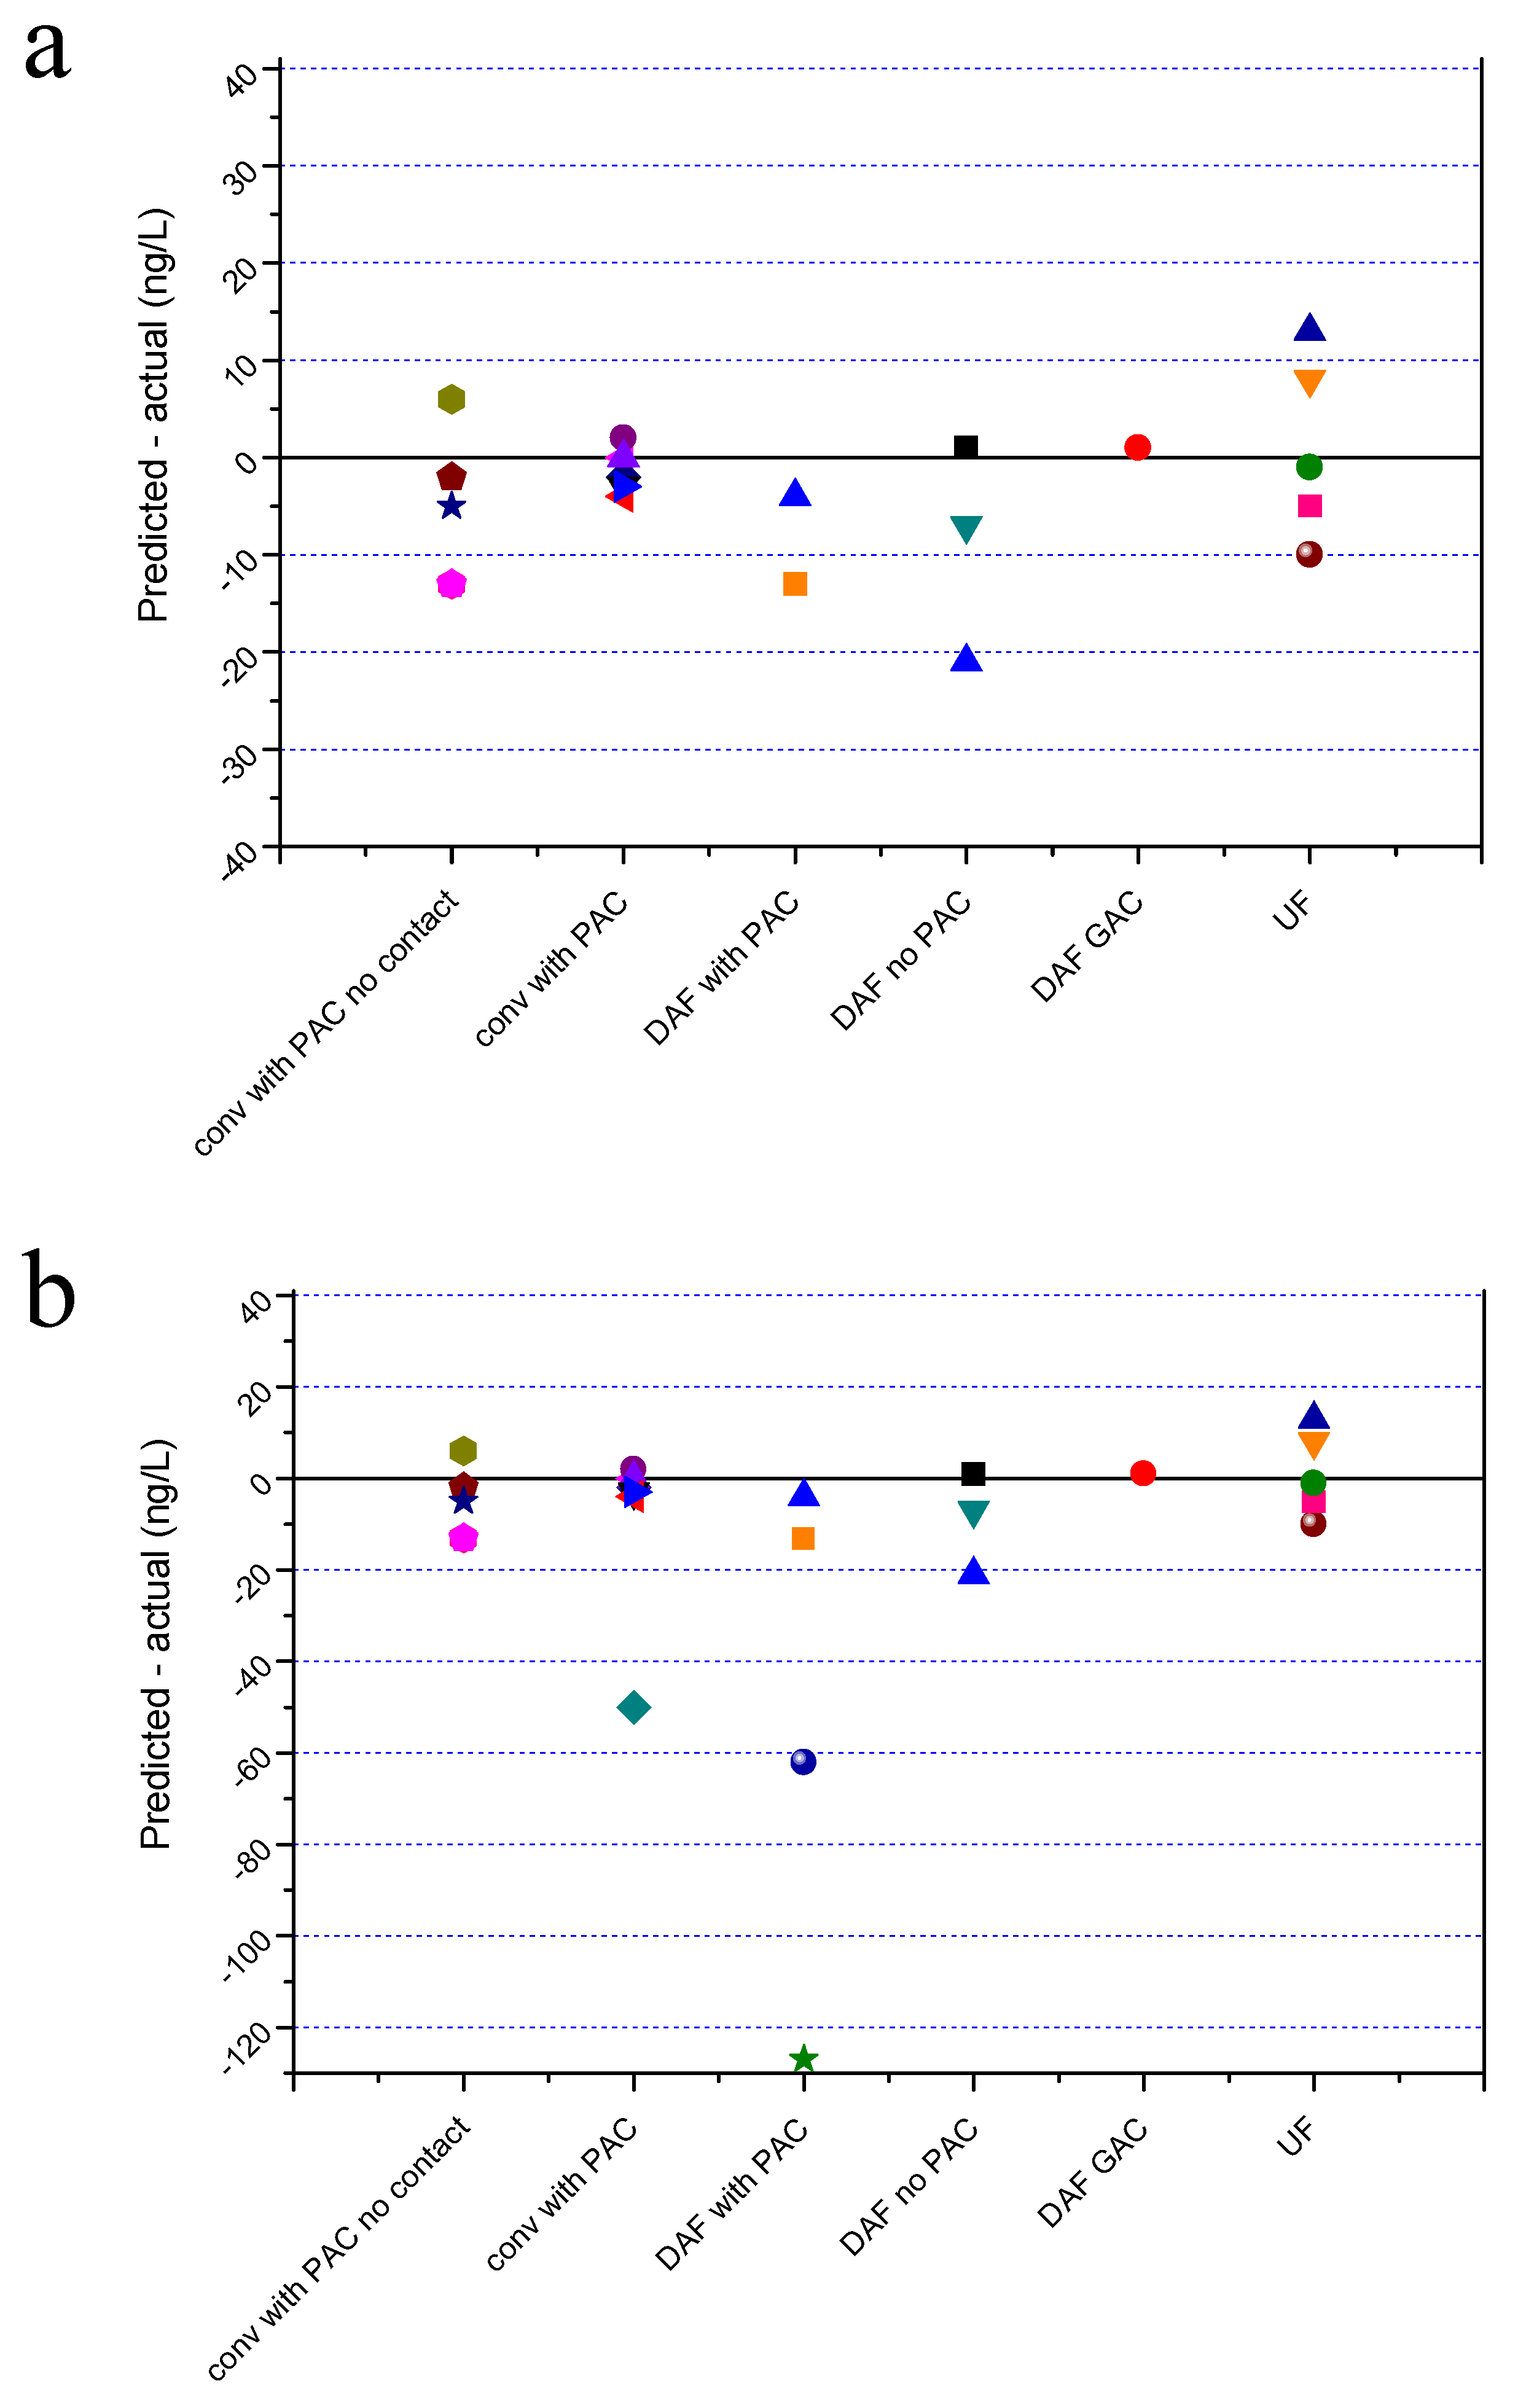
  • For the plants with pre-contact tanks for PAC followed by conventional treatment, the spreadsheet predicted the actual final concentrations within +/−5 ng/L in 8 of the 9 sampling events. The other sampling represented an extreme event with raw water geosmin concentration of 611 ng/L where the PAC may have lysed cells and released further geosmin.
  • For the two conventional plants without a pre-coagulation contact time, the predictions were within 2 ng/L and 11 ng/L.
  • The plants utilizing DAF, and where biological filtration was effective, deviated from the predictions to a greater degree.
  • Where there is known and consistent biological removal, the spreadsheet could easily be modified to take this into account.
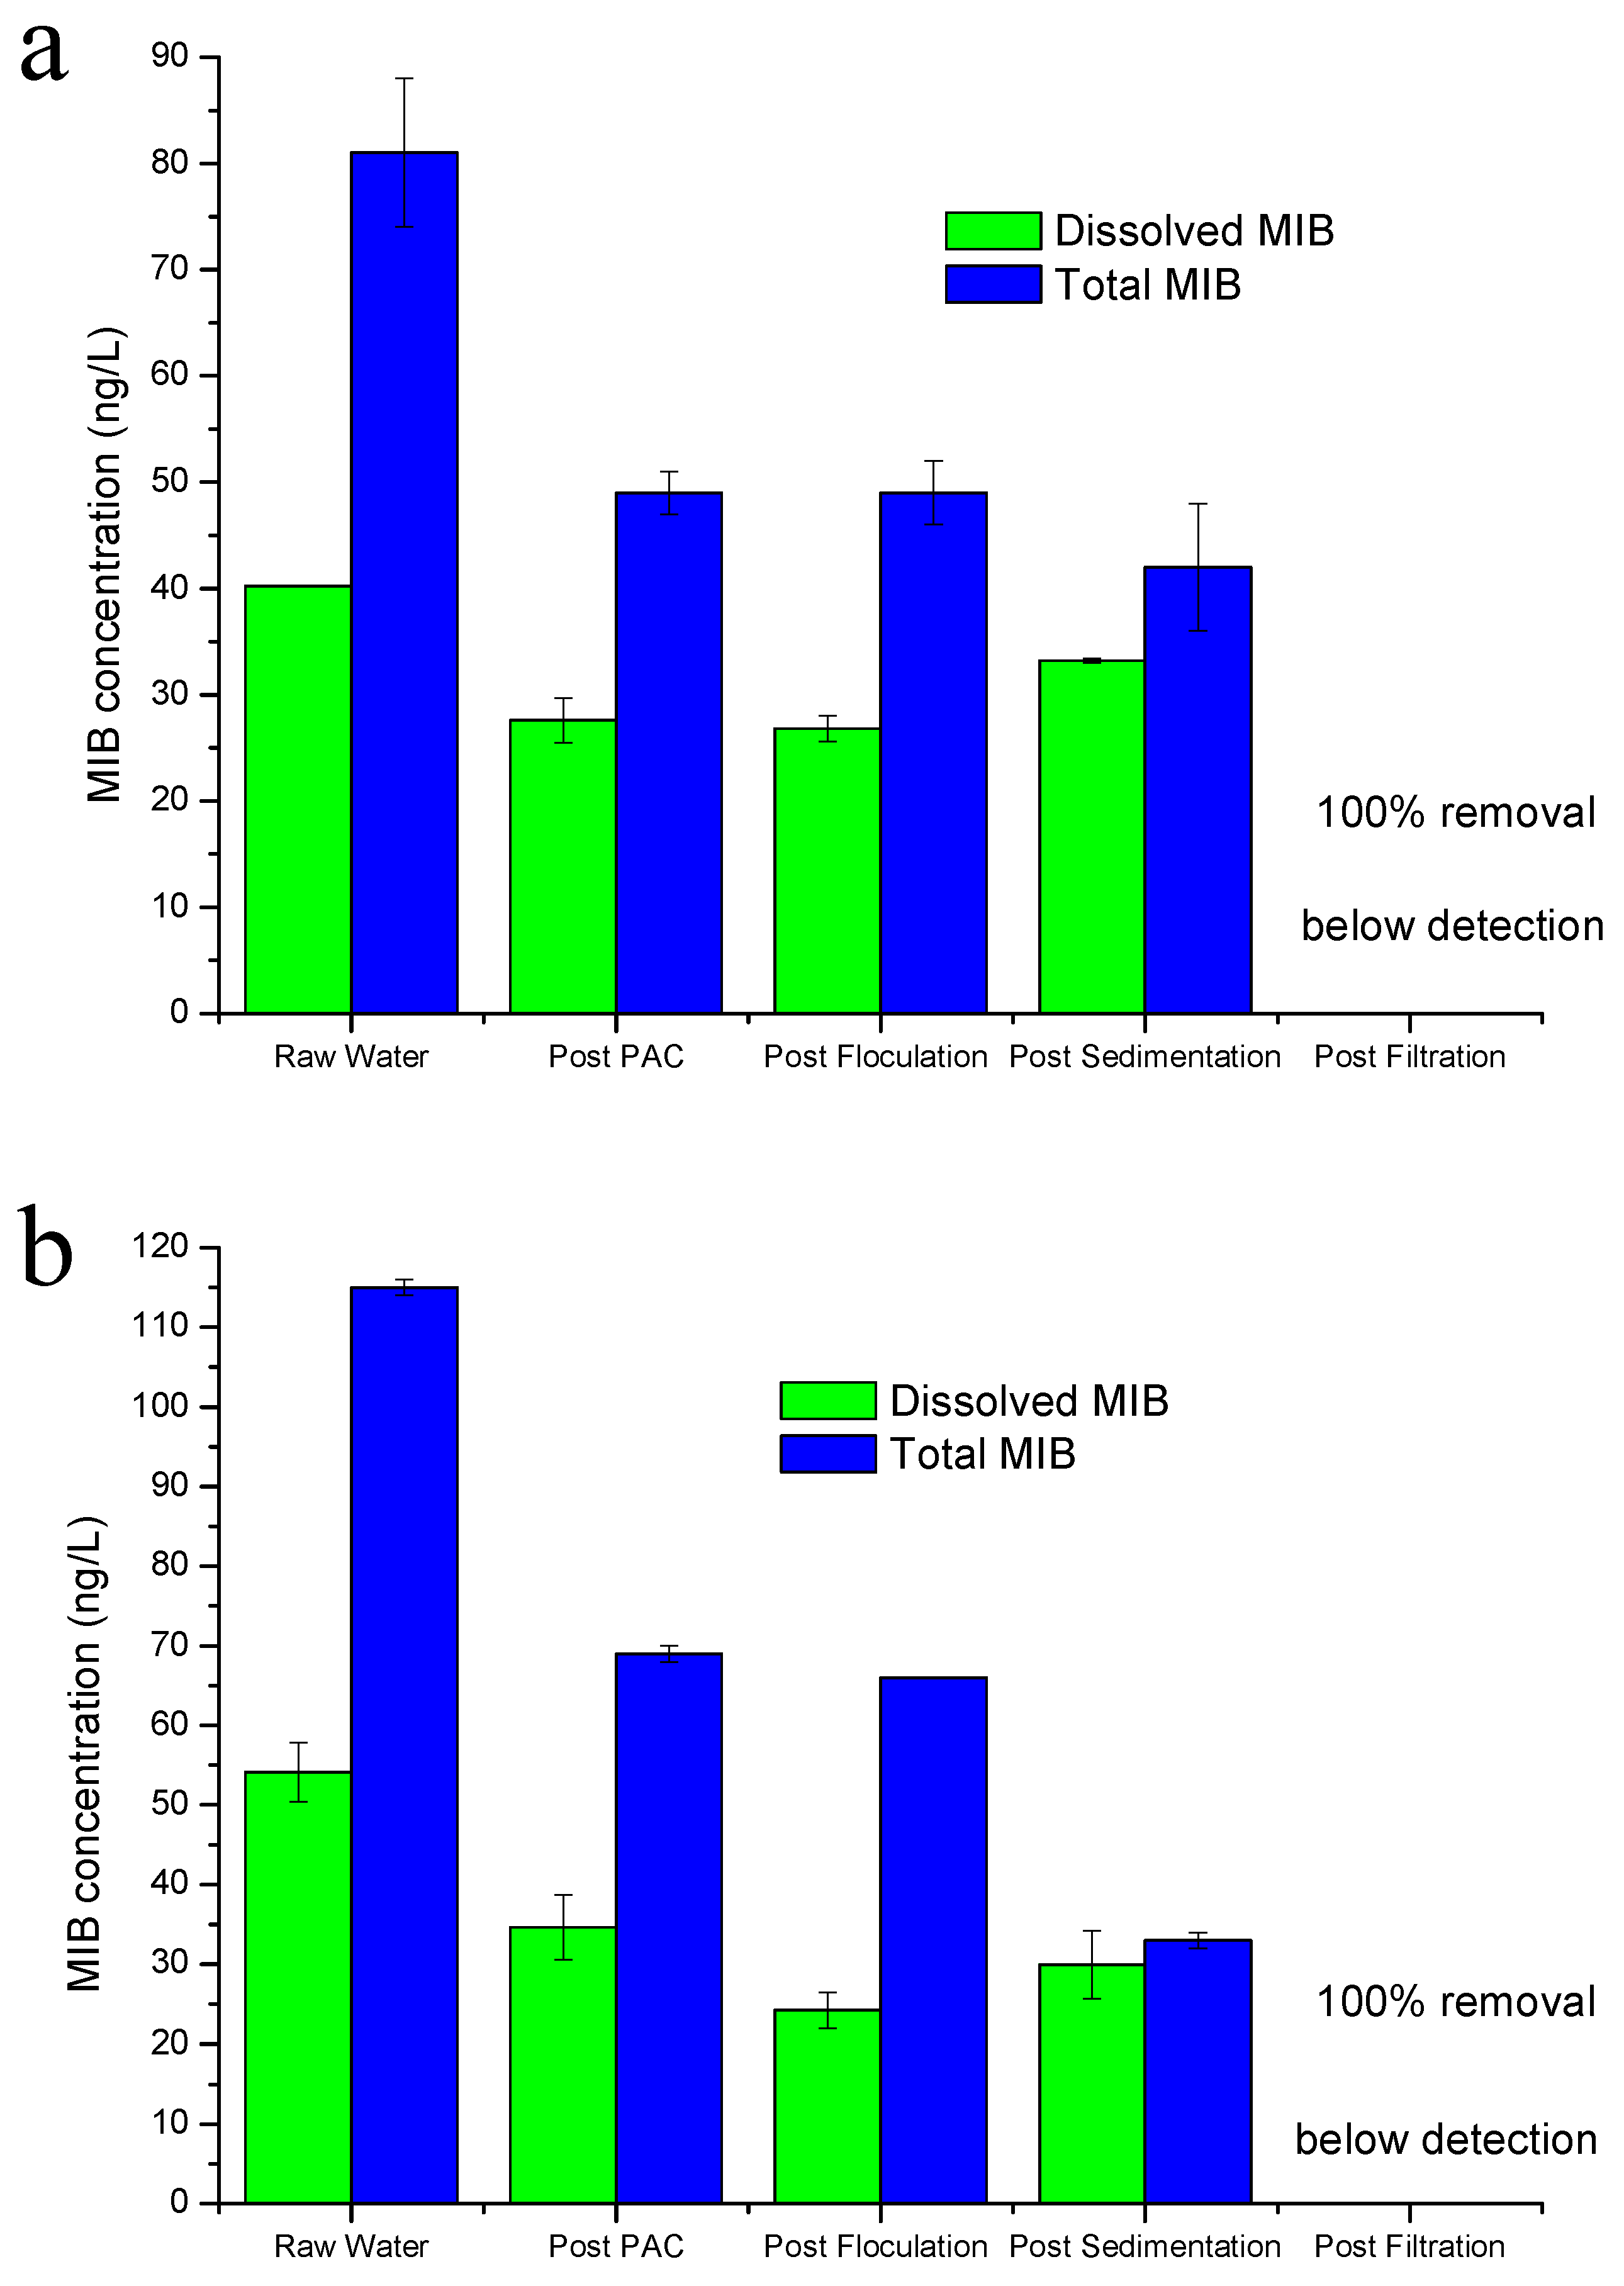
  • For the DAF plants, the calculator spreadsheet predictions deviated from the actual by between 1 ng/L and 127 ng/L for the sample prior to filtration and between 0 and 36 ng/L for the filtered samples.
Overall, the calculator tool performed well and could be considered a useful tool for indicative finished water quality for T&O, taking into account the assumptions made in their development and the points outlined above.

4. Conclusions

The results presented in this paper represent a comprehensive database of full-scale removal efficiencies of MIB and geosmin for a range of water quality and treatment processes. The major findings and conclusions from this project have been
  • The investigative sampling procedures developed are effective and have been successfully applied by three project partners;
  • While routine monitoring data is important, investigative sampling within the WTP provides more detailed and insightful information about the effectiveness of unit processes within the plant;
  • PAC can be effective for the removal of dissolved T&O, with the optimum application point at least 20 min prior to coagulant addition;
  • When there is a pre-contact time there is little or no further removal of dissolved T&O during the subsequent treatment processes;
  • Water transfer and reactive spiking techniques may damage cyanobacteria cells and release metabolites into the dissolved state. Particularly at high T&O concentrations, this could lead to lower removals than expected and/or higher PAC dose requirements;
  • Coagulation and clarification using sedimentation or UF are very effective for the removal of intracellular metabolites, generally with removals of >95%;
  • Dissolved air flotation may lead to lysis of cyanobacteria within the plant. With no further removal processes, this may lead to a breakthrough of unacceptable T&O (or toxins if present) levels into the treated water;
  • Biological processes can take place within full-scale treatment plants and can be extremely effective for T&O. However, biological removal does not take place on filters that are backwashed with chlorinated or chloraminated water.
Some recommendations for further work and the application of the tool are as follows:
  • Further work is required to quantify the damage to cells during PAC mixing at the full-scale plants. Some laboratory testing has suggested that cultured cells are robust and are not damaged by mixing with PAC in a jar test environment. At the full-scale, the bloom may be in decline, resulting in cells that are more prone to damage, or the more rigorous mixing regime, for example, turbulent flow in the pipeline at WTP-A, may result in damage to cells and release of T&O.
  • Clearly, DAF can result in damages to the cells, possibly due to the points outlined above. The flotation process may be more disruptive than the settling process, and the float may be subject to further stresses as the bubbles continue to impact the flocculated cells, potentially causing metabolite release. This finding requires further clarification and the identification of operational mitigation strategies.
  • While based on a very simple concept, the tools show potential for use at the full-scale to aid in operational decisions. For more accurate predictions, it is recommended that the empirical models used in the calculations are generated for individual WTPs (PAC type and contact time, water quality conditions, and so forth). In addition, it should be noted that there is no full-scale verification for the toxin calculators. The limited full-scale data in the literature suggests that the cyanobacteria are effectively removed by conventional processes, there may be accumulation in sedimentation tanks, and that chlorination of toxins in filtered water is not as effective as suggested by laboratory tests. Therefore it is recommended that the toxin calculators are not relied upon to aid in operational decisions at this stage. When further full-scale verification data is available improvements can be made to these calculators to allow more confident application.
  • Further research is required to develop a real-time, in-situ technique for the measurement of metabolites entering WTPs. Currently, the lead time for cell counts and/or metabolite concentration analysis prevents the tools and predictions being applied as they are required for PAC dosing for example.

Supplementary Materials

The following are available online at https://www.mdpi.com/2073-4441/10/5/590/s1, Figure SI-1: Generic cyanobacteria and metabolite removal tool [21], Figure SI-2: Treatment processes at (a) WTP-A and (b) WTP-B. For further details on all studied plants refer to Newcombe et al. [21].

Author Contributions

Arash Zamyadi, Rita K. Henderson, Kelly Newton, Jose Capelo Neto and Gayle Newcombe conceived and designed the experiments, analyzed the data, contributed analysis tools, wrote the paper.

Acknowledgments

Many people have contributed greatly to this project and we would like to gratefully acknowledge them: Claire McInnes (Water Research Australia–WaterRA), Radisti Praptiwi, Megane Delacroix, Lea Collignon, Ben Chong, Kuan-Min Liao, Edith Kozlic, Con Kapralos, Martin Harris and David Cook (SA Water), Florence Choo and Richard Stuetz (UNSW), Abigail Morrow and Ashley Sneddon (Hunter Water), Keith Craig (Veolia Water), Wayne Murdoch and Jenith Jesuthasan (Wannon Water), Brendan Gladman (Melbourne Water), David Cunliffe (SA Health), Uwe Kaeding (Allwater), and Adam Medlock (Trility); and to all of the operators who helped with the sampling so willingly.

Conflicts of Interest

The authors declare no conflict of interest. The founding sponsors had no role in the design of the study; in the collection, analyses, or interpretation of data; in the writing of the manuscript, and in the decision to publish the results.

References

  1. Chorus, I.; Bartram, J. Toxic Cyanobacteria in Water: A Guide to Their Public Health Consequences, Monitoring and Management; World Health Organization (WHO): Geneva, Switzerland, 1999. [Google Scholar]
  2. Boyer, G.L.; Yang, X.; Patchett, E.A.; Satchwell, M.F. Cyanobacteria toxins in upstate New York waters: A comparison on Onondaga Lake and Oneida Lake (summary of a poster presentation). In Proceedings of the 2nd Annual Onondaga Lake Conference, Syracuse, NY, USA, 20 November 2000. [Google Scholar]
  3. Carmichael, W.W. Assessment of Blue-Green Algal Toxins in Raw and Finished Drinking Wate; American Water Works Association Research Foundation; American Water Works Association: Denver, CO, USA, 2001. [Google Scholar]
  4. Tarczyriska, M.; Romanowska-Duda, Z.; Jurczak, T.; Zalewski, M. Toxic cyanobacterial blooms in a drinking water reservoir-causes, consequences and management strategy. Water Sci. Technol. Water Supply 2001, 1, 237–246. [Google Scholar]
  5. Svrcek, C.; Smith, D.W. Cyanobacteria toxins and the current state of knowledge on water treatment options: A review. J. Environ. Eng. Sci. 2004, 3, 155–185. [Google Scholar] [CrossRef]
  6. Newcombe, G.; House, J.; Ho, L.; Baker, P.; Burch, M. Management Strategies for Cyanobacteria (Blue-Green Algae): A Guide for Water Utilities; Water Quality Research Australia (WQRA): Adelaide, Australia, 2010. [Google Scholar]
  7. Zamyadi, A. Emerging toxic cyanobacterial issues in freshwater sources: Influence of climate change. In Seafood and Freshwater Toxins: Pharmacology, Physiology, and Detection, 3rd ed.; Botana, L.M., Ed.; Taylor & Francis: New York, NY, USA, 2014; Chapter 5. [Google Scholar]
  8. Paerl, H.W.; Paul, V.J. Climate change: Links to global expansion of harmful cyanobacteria. Water Res. 2012, 46, 1349–1363. [Google Scholar] [CrossRef] [PubMed]
  9. Sinha, R.; Pearson, L.A.; Davis, T.W.; Burford, M.A.; Orr, P.T.; Neilan, B.A. Increased incidence of Cylindrospermopsis raciborskii in temperate zones—Is climate change responsible? Water Res. 2012, 46, 1408–1419. [Google Scholar] [CrossRef] [PubMed]
  10. Maatouk, I.; Bouaïcha, N.; Fontan, D.; Levi, Y. Seasonal variation of microcystin concentrations in the Saint-Caprais reservoir (France) and their removal in a small full-scale treatment plant. Water Res. 2002, 36, 2891–2897. [Google Scholar] [CrossRef]
  11. Rapala, J.; Niemela, M.; Berg, K.; Lepisto, L.; Lahti, K. Removal of cyanobacteria, cyanotoxins, heterotrophic bacteria and endotoxins at an operating surface water treatment plant. Water Sci. Technol. 2006, 54, 23–28. [Google Scholar] [CrossRef] [PubMed]
  12. Kommineni, S.; Amante, K.; Karnik, B.; Sommerfeld, M.; Dempster, T. Strategies for Controlling and Mitigating Algal Growth within Water Treatment Plants; Water Research Foundation: Denver, CO, USA, 2009. [Google Scholar]
  13. Zamyadi, A.; MacLeod, S.L.; Fan, Y.; McQuaid, N.; Dorner, S.; Sauvé, S.; Prévost, M. Toxic cyanobacterial breakthrough and accumulation in a drinking water plant: A monitoring and treatment challenge. Water Res. 2012, 46, 1511–1523. [Google Scholar] [CrossRef] [PubMed]
  14. Zamyadi, A.; Ho, L.; Newcombe, G.; Bustamante, H.; Prevost, M. Fate of toxic cyanobacterial cells and disinfection by-products formation after chlorination. Water Res. 2012, 46, 1524–1535. [Google Scholar] [CrossRef] [PubMed]
  15. Zamyadi, A.; Dorner, S.; Sauvé, S.; Ellis, D.; Bolduc, A.; Bastien, C.; Prévost, M. Species-dependence of cyanobacteria removal efficiency by different drinking water treatment processes. Water Res. 2013, 47, 2689–2700. [Google Scholar] [CrossRef] [PubMed]
  16. Faruqi, A.; Henderson, M.; Henderson, R.K.; Stuetz, R.; Gladman, B.; McDowall, B.; Zamyadi, A. Removal of algal taste and odour compounds by granular and biological activated carbon in full-scale water treatment plants. Water Sci. Technol. Water Supply 2018, 17. [Google Scholar] [CrossRef]
  17. Agence Française de Sécurité Sanitaire des Aliments (AFSSA); l’Agence Française de Sécurité Sanitaire de l’Environnement et du Travail (AFSSET). Rapport sur L’évaluation des Risques liés à La présence de Cyanobactéries et de Leurs Toxines Dans les Eaux Destinées à L’alimentation, à la Baignade et Autres Activités Récréatives; AFSSA, Maisons-Alfort: Paris, France, 2006. [Google Scholar]
  18. Fitzgerald, D.J.; Cunliffe, D.A.; Burch, M.D. Development of heath alerts for cyanobacteria related toxins in drinking water in South Australia. Environ. Toxicol. 1999, 14, 203–209. [Google Scholar] [CrossRef]
  19. Hoeger, S.J.; Shaw, G.; Hitzfeld, B.C.; Dietrich, D.R. Occurrence and elimination of cyanobacterial toxins in two Australian drinking water treatment plants. Toxicon 2004, 43, 639–649. [Google Scholar] [CrossRef] [PubMed]
  20. Newcombe, G. Identifying and Quantifying the Outcomes of Cyanobacteria Research: Impacts on the Australian Water Industry; WaterRA Impact Study: Adelaide, Australia, 2013. [Google Scholar]
  21. Newcombe, G.; Newton, K. Assessment and Management of Aesthetic and Health Risks Associated with Cyanobacteria; WaterRA Project 1078; Water Research Australia (WaterRA): Adelaide, Australia, 2018. [Google Scholar]
  22. Drikas, M.; Chow, C.W.K.; House, J.; Burch, M.D. Using coagulation, and settling to remove toxic cyanobacteria. J. Am. Water Works Assoc. 2001, 93, 100–111. [Google Scholar] [CrossRef]
  23. Schmidt, W.; Willmitzer, H.; Bornmann, K.; Pietsch, J. Production of drinking water from raw water containing cyanobacteria—Pilot plant studies for assessing the risk of microcystin breakthrough. Environ. Toxicol. 2002, 17, 375–385. [Google Scholar] [CrossRef] [PubMed]
  24. Hoeger, S.J.; Hitzfeld, B.C.; Dietrich, D.R. Occurrence and elimination of cyanobacterial toxins in drinking water treatment plants. Toxicol. Appl. Pharmacol. 2005, 203, 231–242. [Google Scholar] [CrossRef] [PubMed]
  25. Daly, R.I.; Ho, L.; Brookes, J.D. Effect of chlorination on Microcystis aeruginosa cell integrity and subsequent microcystin release and degradation. Environ. Sci. Technol. 2007, 41, 4447–4453. [Google Scholar] [CrossRef] [PubMed]
  26. Ding, J.; Shi, H.; Timmons, T.; Adams, C.D. Release and removal of microcystins from Microcystis during oxidative-, physical-, and UV-based disinfection. J. Environ. Eng. 2010, 136, 2–11. [Google Scholar] [CrossRef]
  27. Zamyadi, A.; Fan, Y.; Daly, R.; Prévost, M. Chlorination of Microcystis aeruginosa: Toxin release and oxidation, cellular chlorine demand and disinfection by-products formation. Water Res. 2013, 47, 1080–1090. [Google Scholar] [CrossRef] [PubMed]
  28. Rodríguez, E.; Onstad, G.D.; Kull, T.P.J.; Metcalf, J.S.; Acero, J.L.; von Gunten, U. Oxidative elimination of cyanotoxins: Comparison of ozone, chlorine, chlorine dioxide and permanganate. Water Res. 2007, 41, 3381–3393. [Google Scholar] [CrossRef] [PubMed]
  29. Lin, T.-F.; Chang, D.; Lien, S.; Tseng, Y.; Chiu, Y.; Wang, Y. Effect of chlorination on the cell integrity of two noxious cyanobacteria and their releases of odorants. J. Water Supply Res. Technol. AQUA 2009, 58, 539–551. [Google Scholar] [CrossRef]
  30. Zamyadi, A.; Ho, L.; Newcombe, G.; Daly, R.I.; Burch, M.; Baker, P.; Prévost, M. Release and oxidation of cell-bound saxitoxins during chlorination of Anabaena circinalis cells. Environ. Sci. Technol. 2010, 44, 9055–9061. [Google Scholar] [CrossRef] [PubMed]
Figure 1. The routine geosmin monitoring data from WTP-A (Horizontal axis: date) [21].
Water 10 00590 g001
Figure 2. The total and dissolved geosmin concentration sampled at strategic points within the WTP-A: (a) on 1 February 2017, PAC dose = 30 mg/L; (b) on 3 February 2017, PAC dose = 30 mg/L; and (c) on 8 February 2017, PAC dose = 30 mg/L [21].
Water 10 00590 g002
Figure 3. The total and dissolved 2-methylisoborneol (MIB) concentration sampled at strategic points within the WTP-B (a) on February 2015 and (b) on March 2015 [21].
Water 10 00590 g003
Figure 4. The experimental data and curve fitting for (a) MIB and geosmin removal by powdered activated carbon (PAC); (b) microcystin-LA removal by chlorine [21].
Water 10 00590 g004
Figure 5. The representation of the difference between the measured metabolite concentrations in the treated water and the concentration predicted by the spreadsheet calculators [21].
Water 10 00590 g005
Figure 6. The representation of the difference between the measured metabolite concentrations in the treated water prior to filtration and the concentration predicted by the spreadsheet calculators at that point in the treatment train (a) with the same y-axis scale as Figure 5 and (b) with an expanded scale to show variations in the WTP-A samples [21].
Water 10 00590 g006

