Effects of Land Cover Change on Urban Floods and Rainwater Harvesting: A Case Study in Sharjah, UAE

 , and
, and
Abstract
:1. Introduction
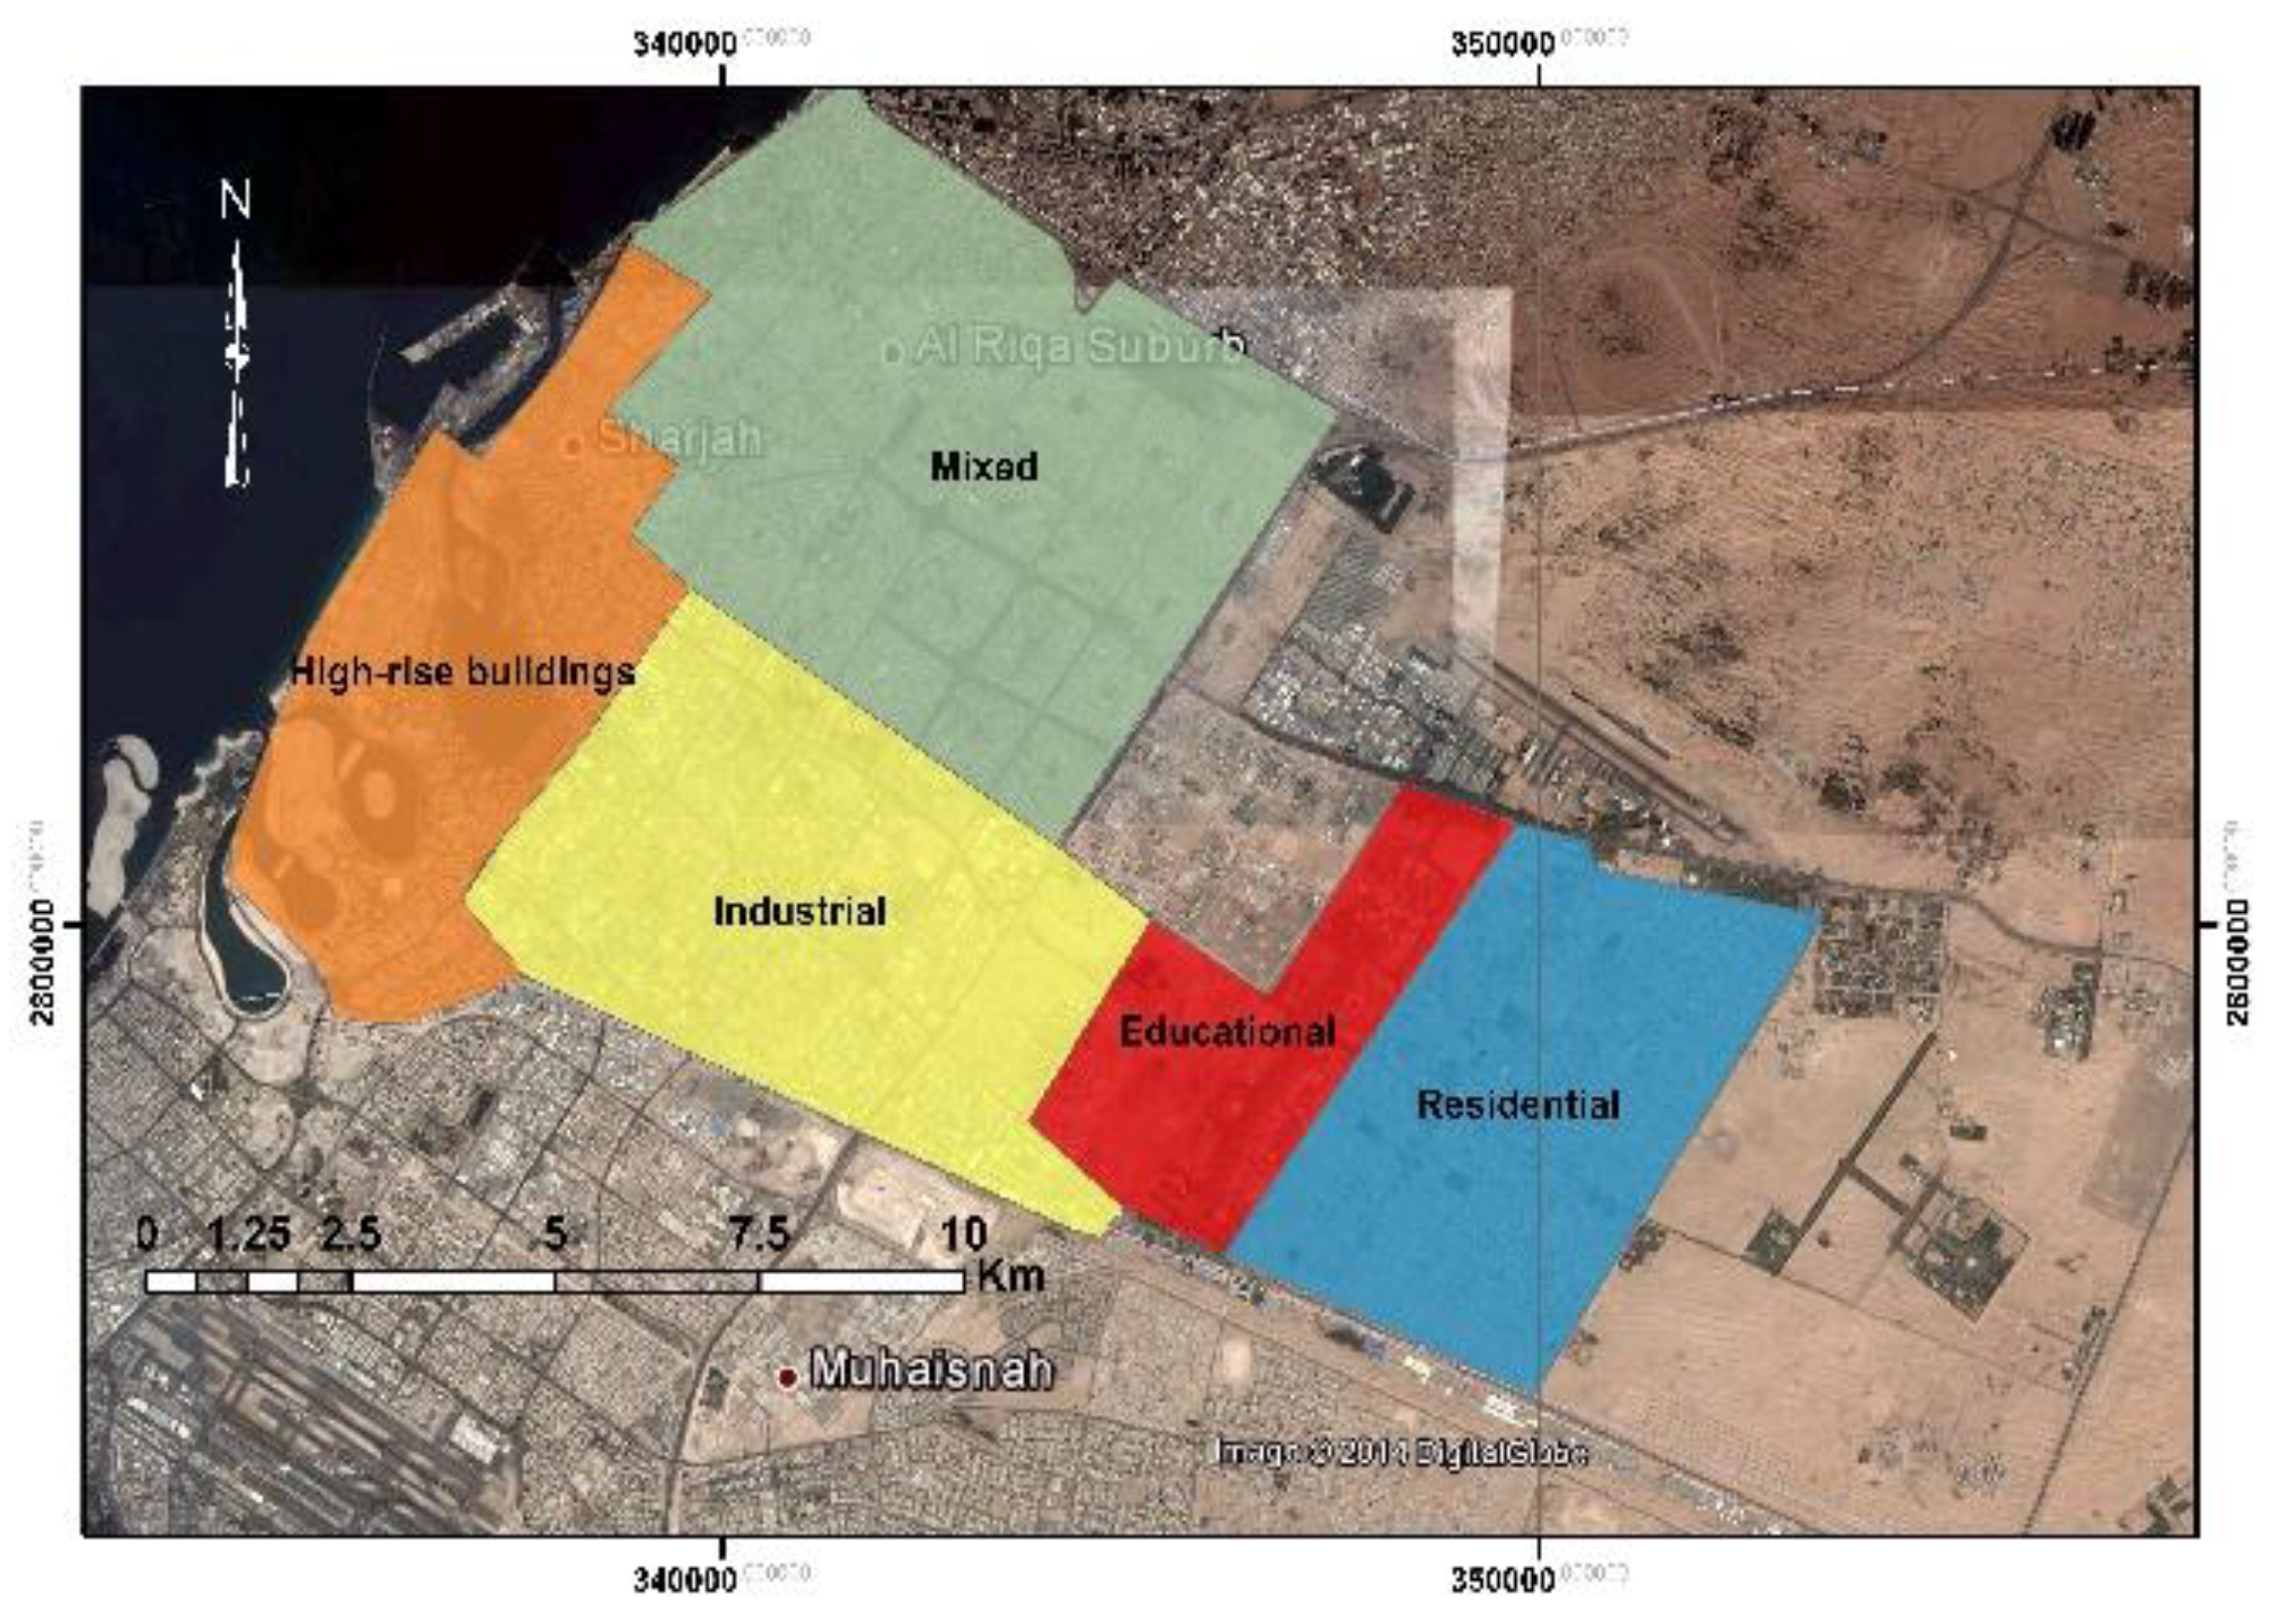
2. Study Area
3. Methodology
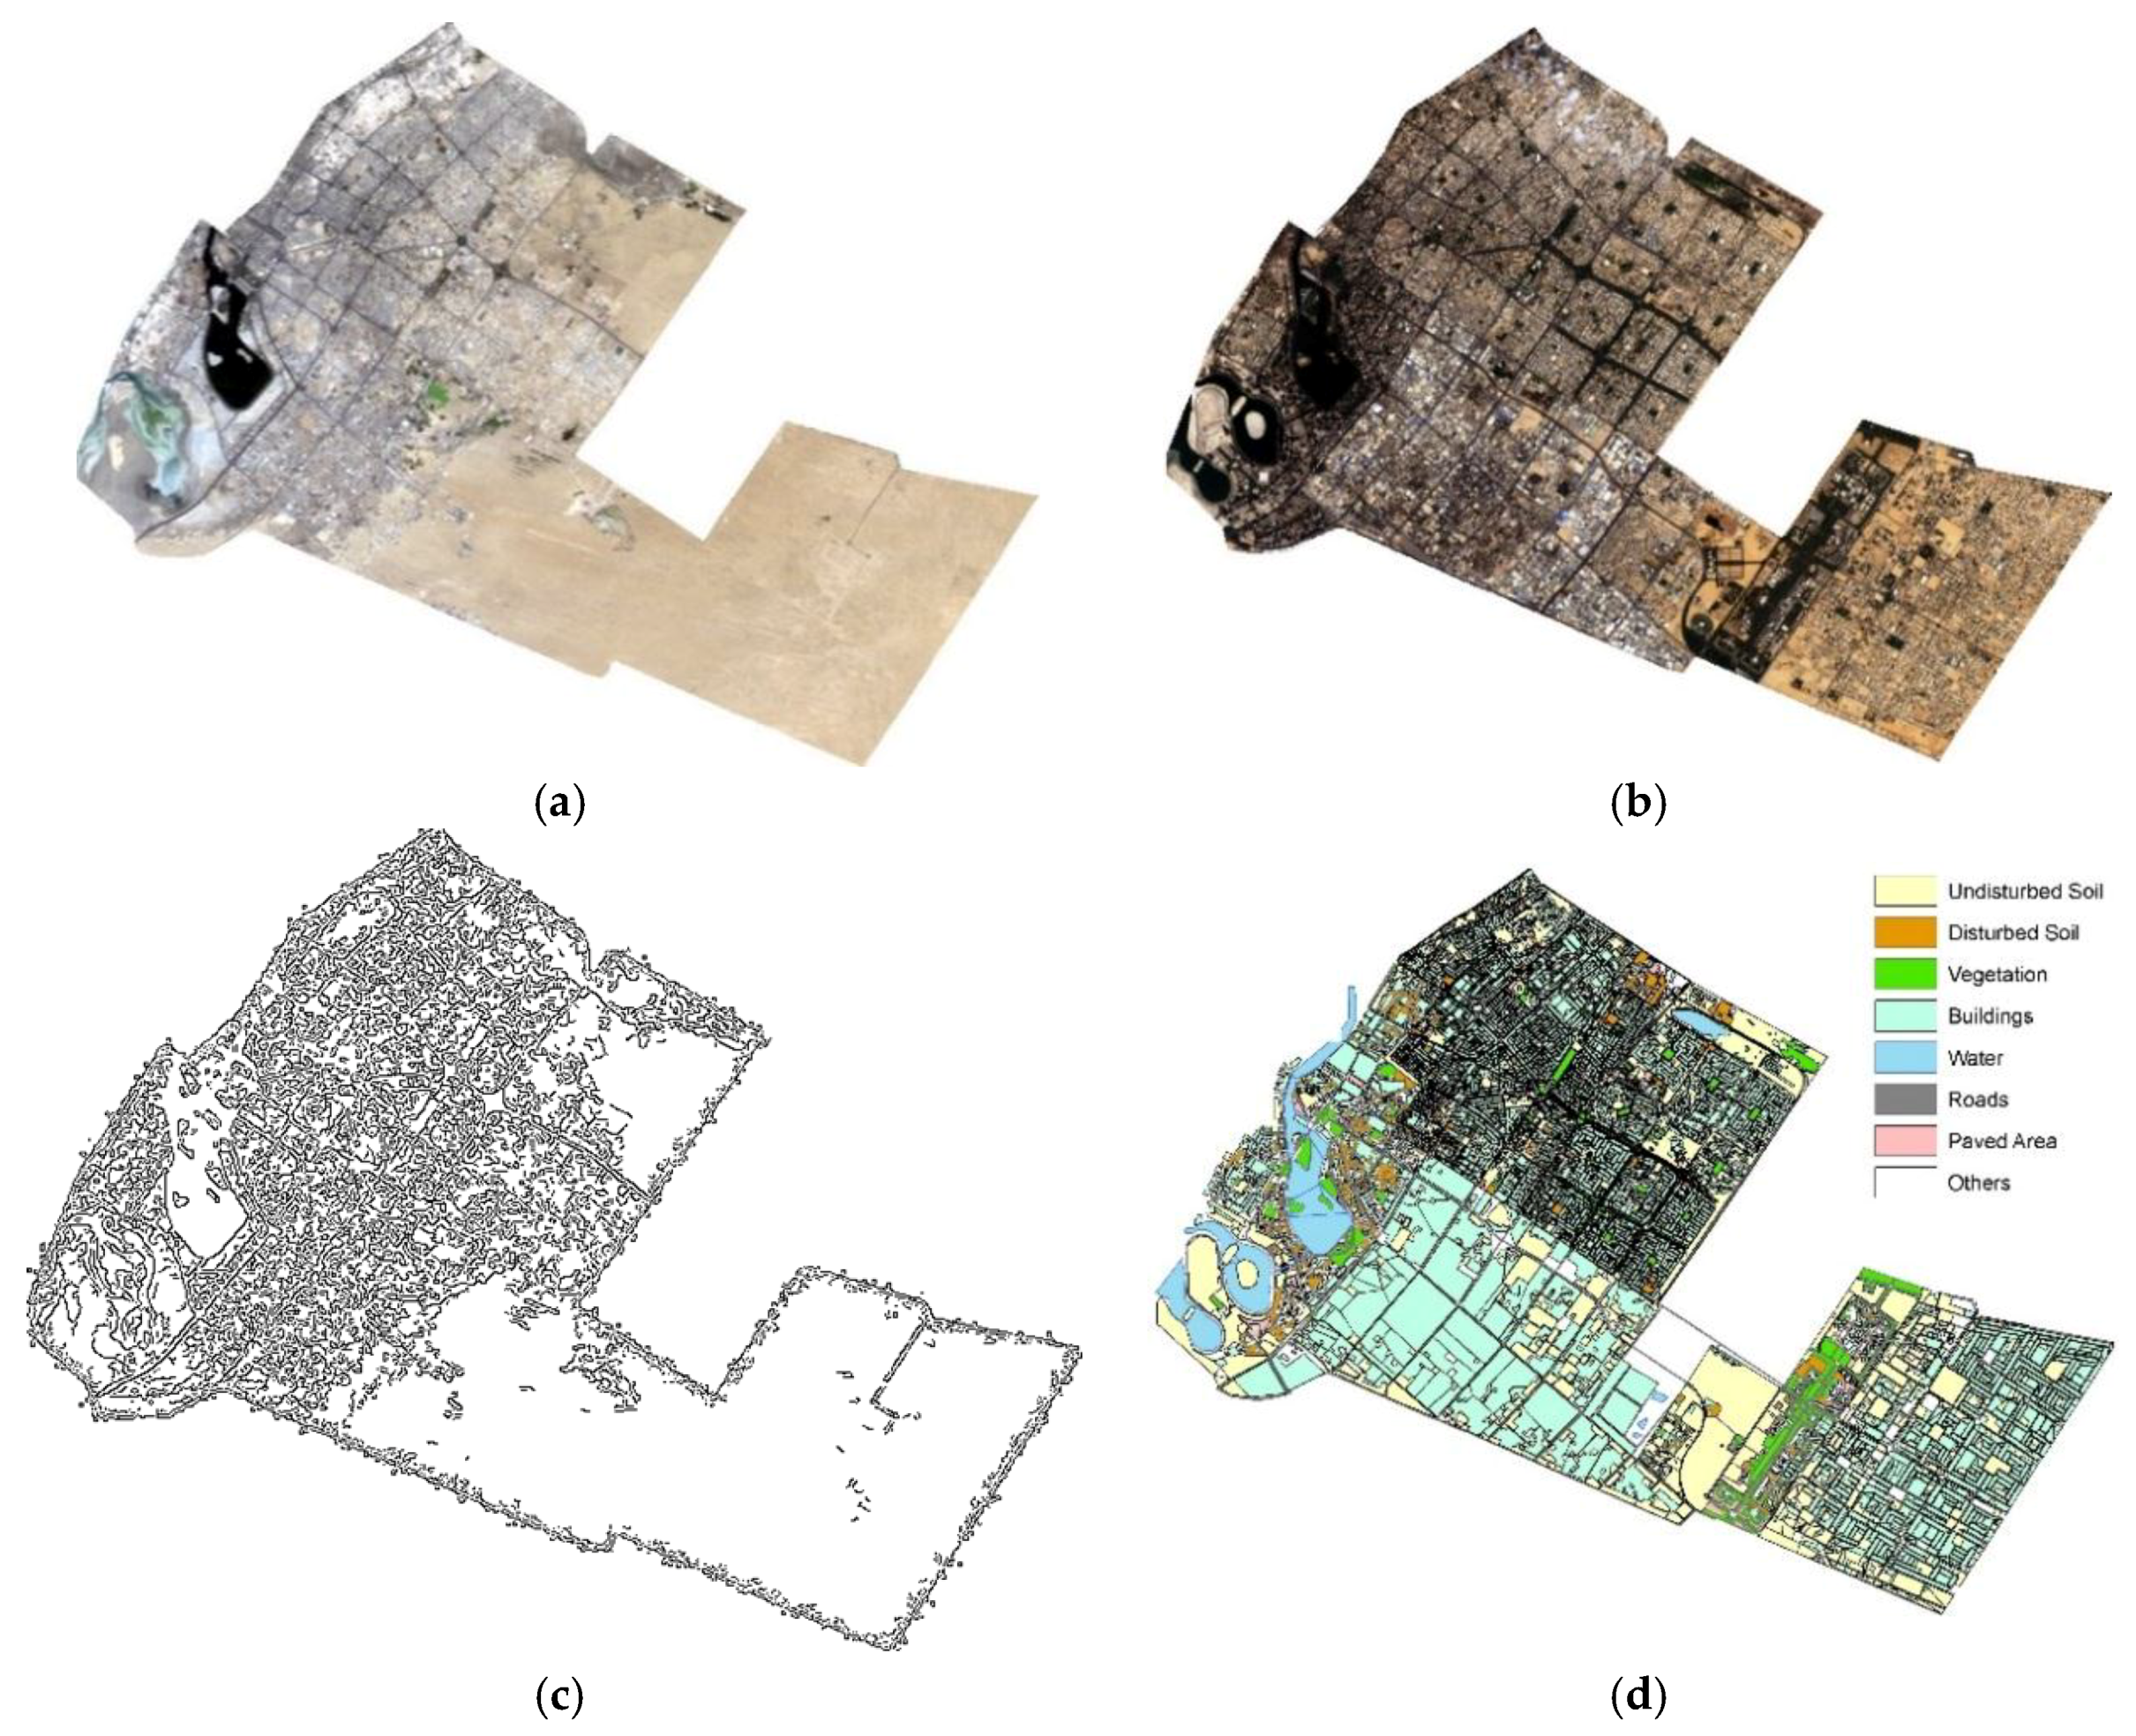
3.1. Analysis of Land Cover Changes
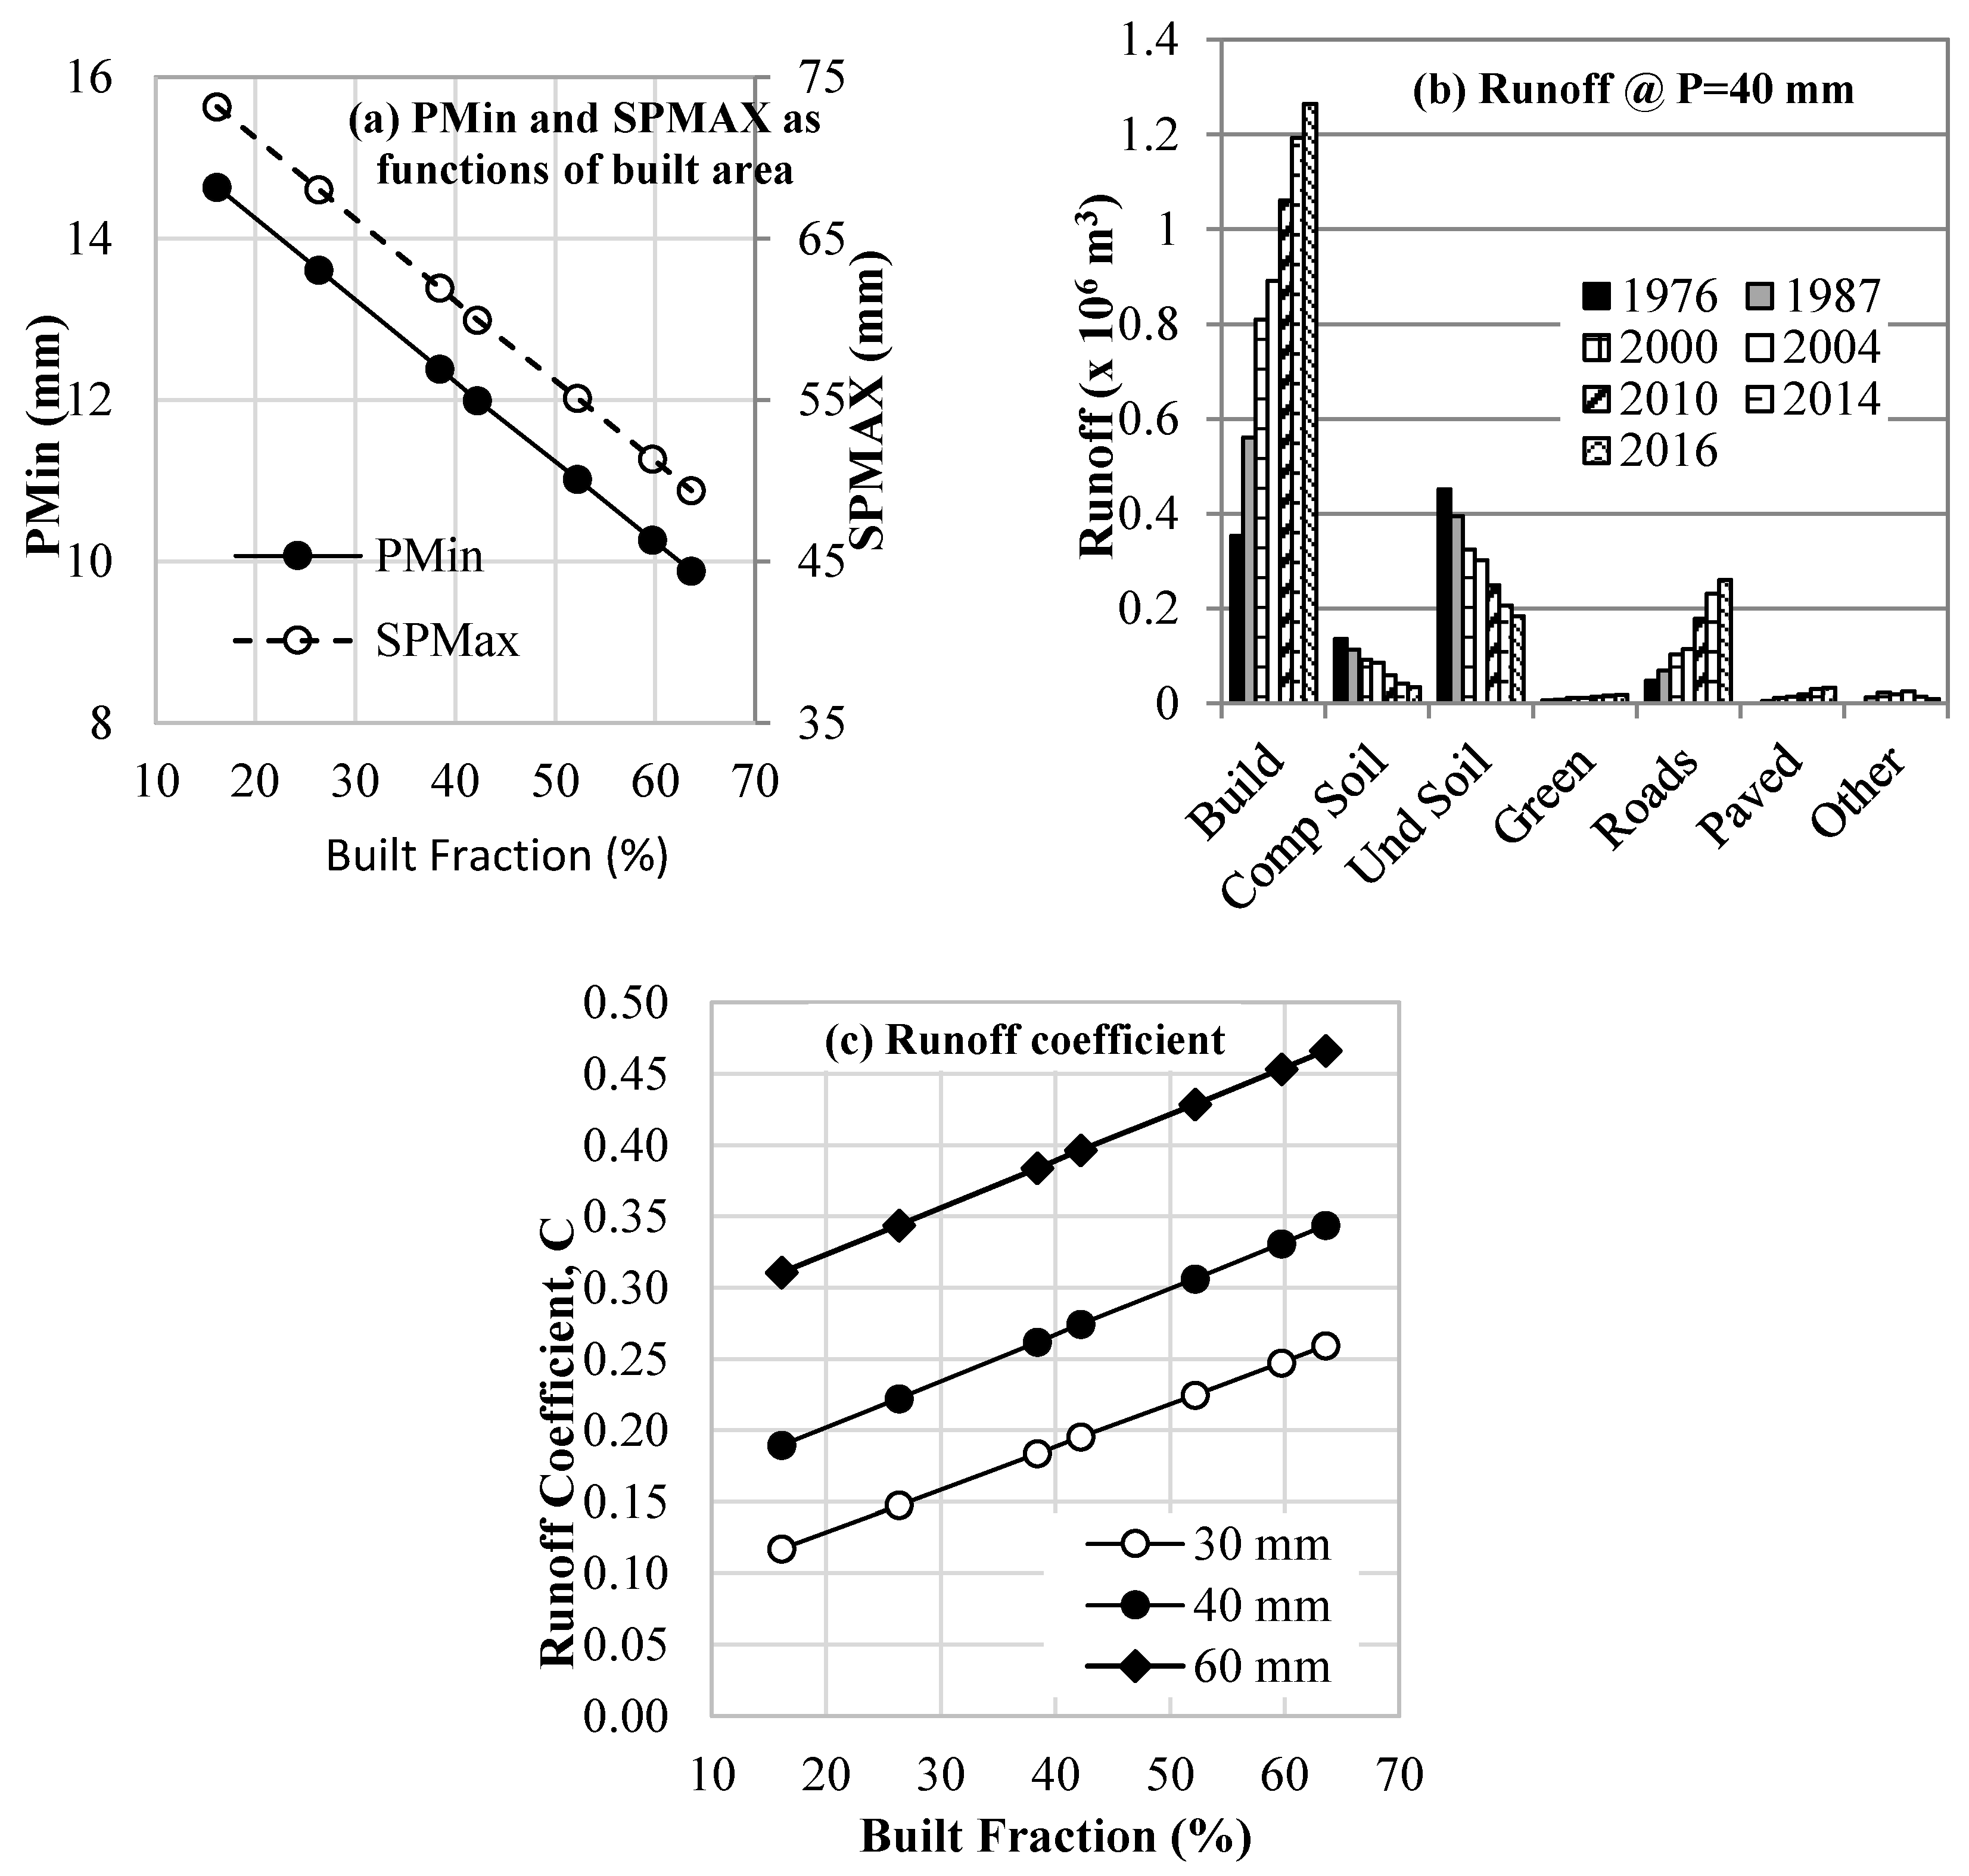
3.2. Runoff Analysis
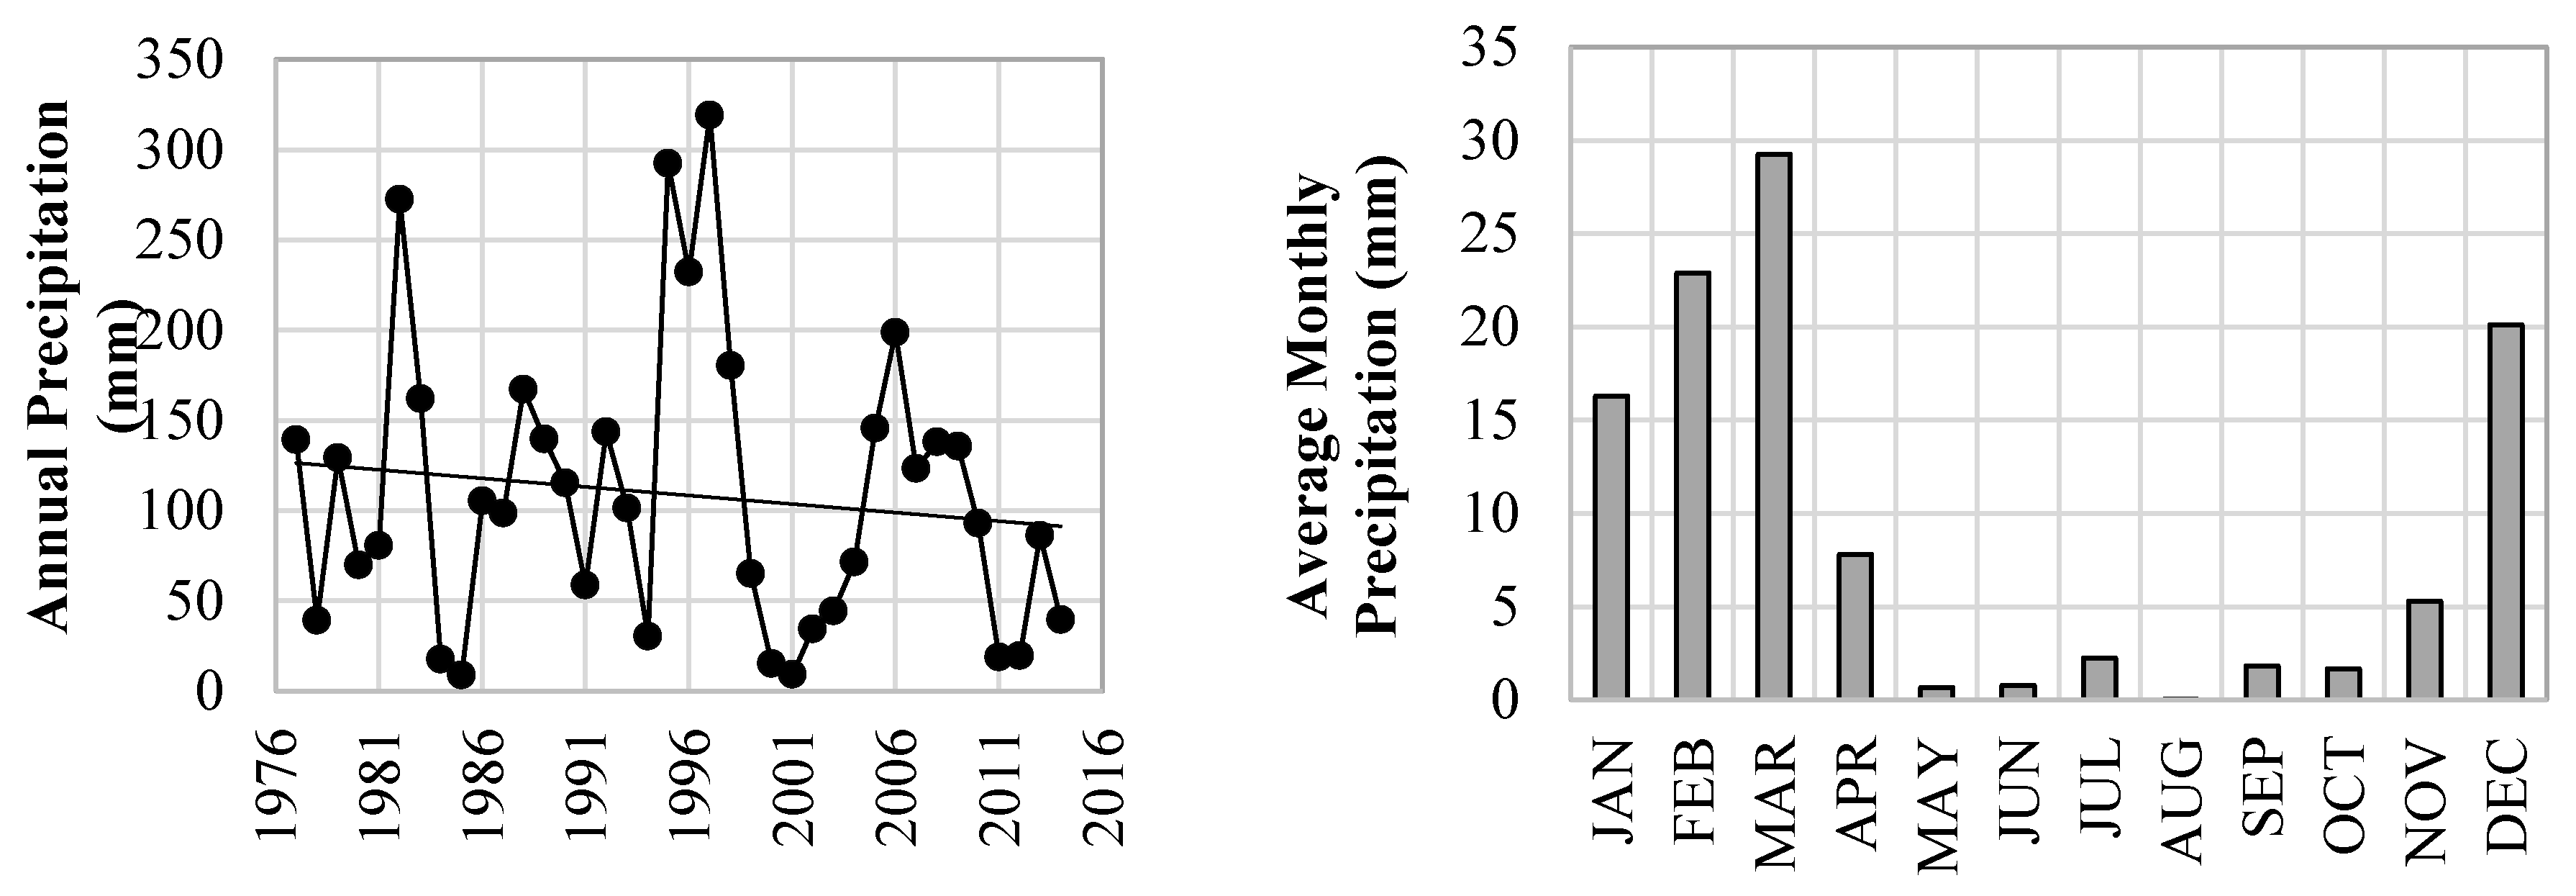
3.3. Rainfall Analysis
3.4. Generation of Local Flood Maps in Sharjah City
4. Results and Discussion
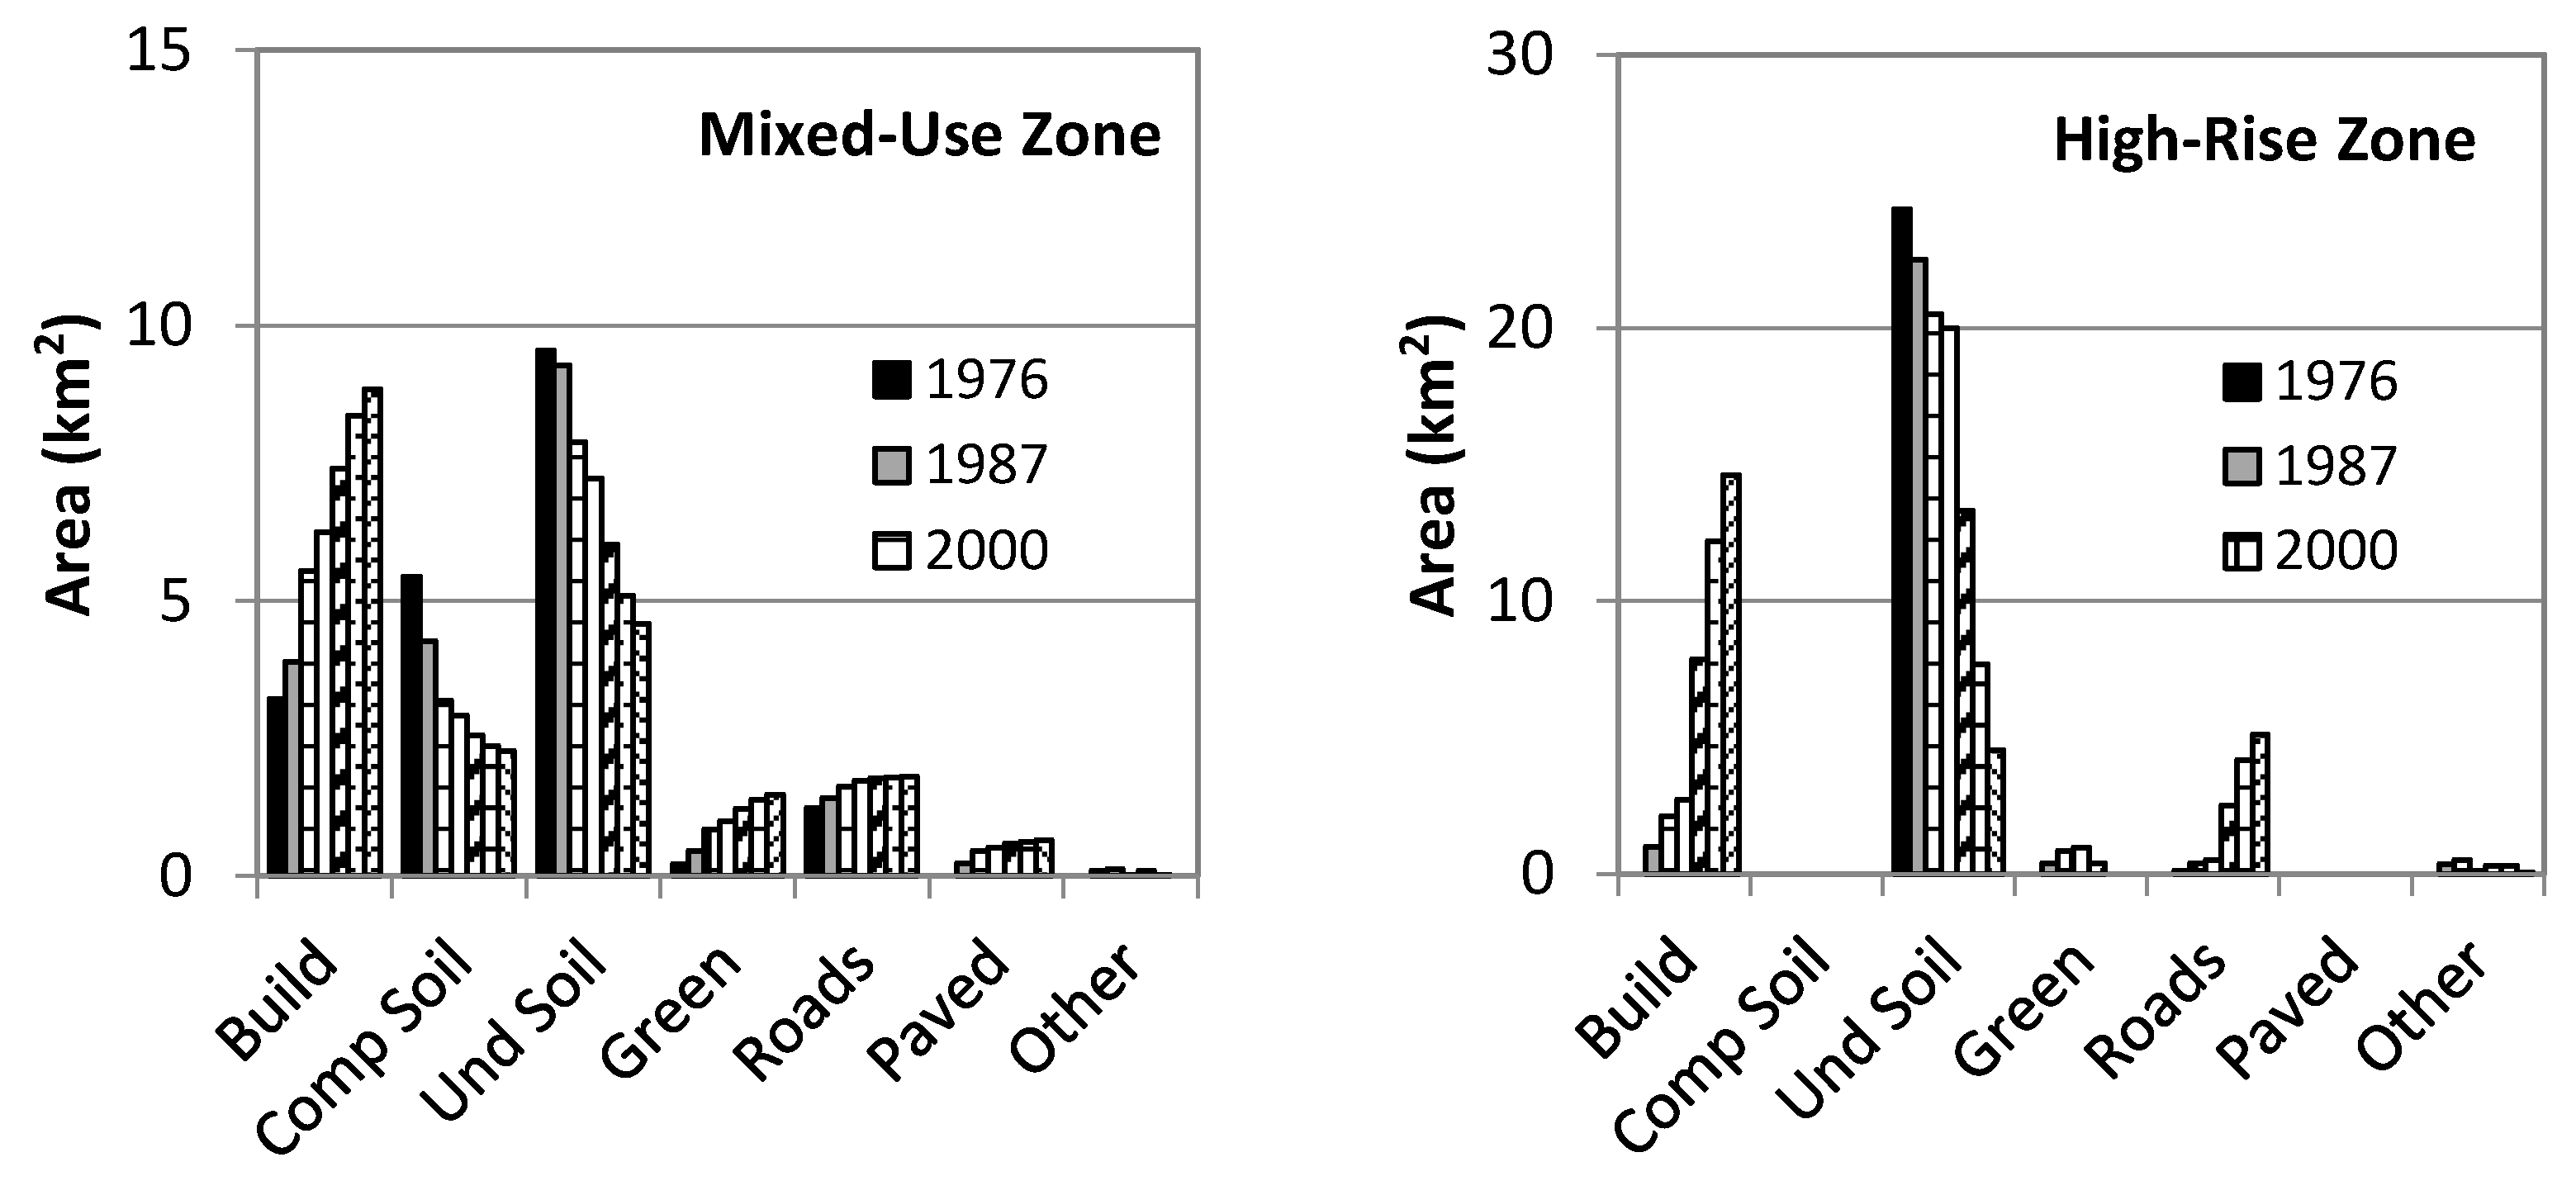
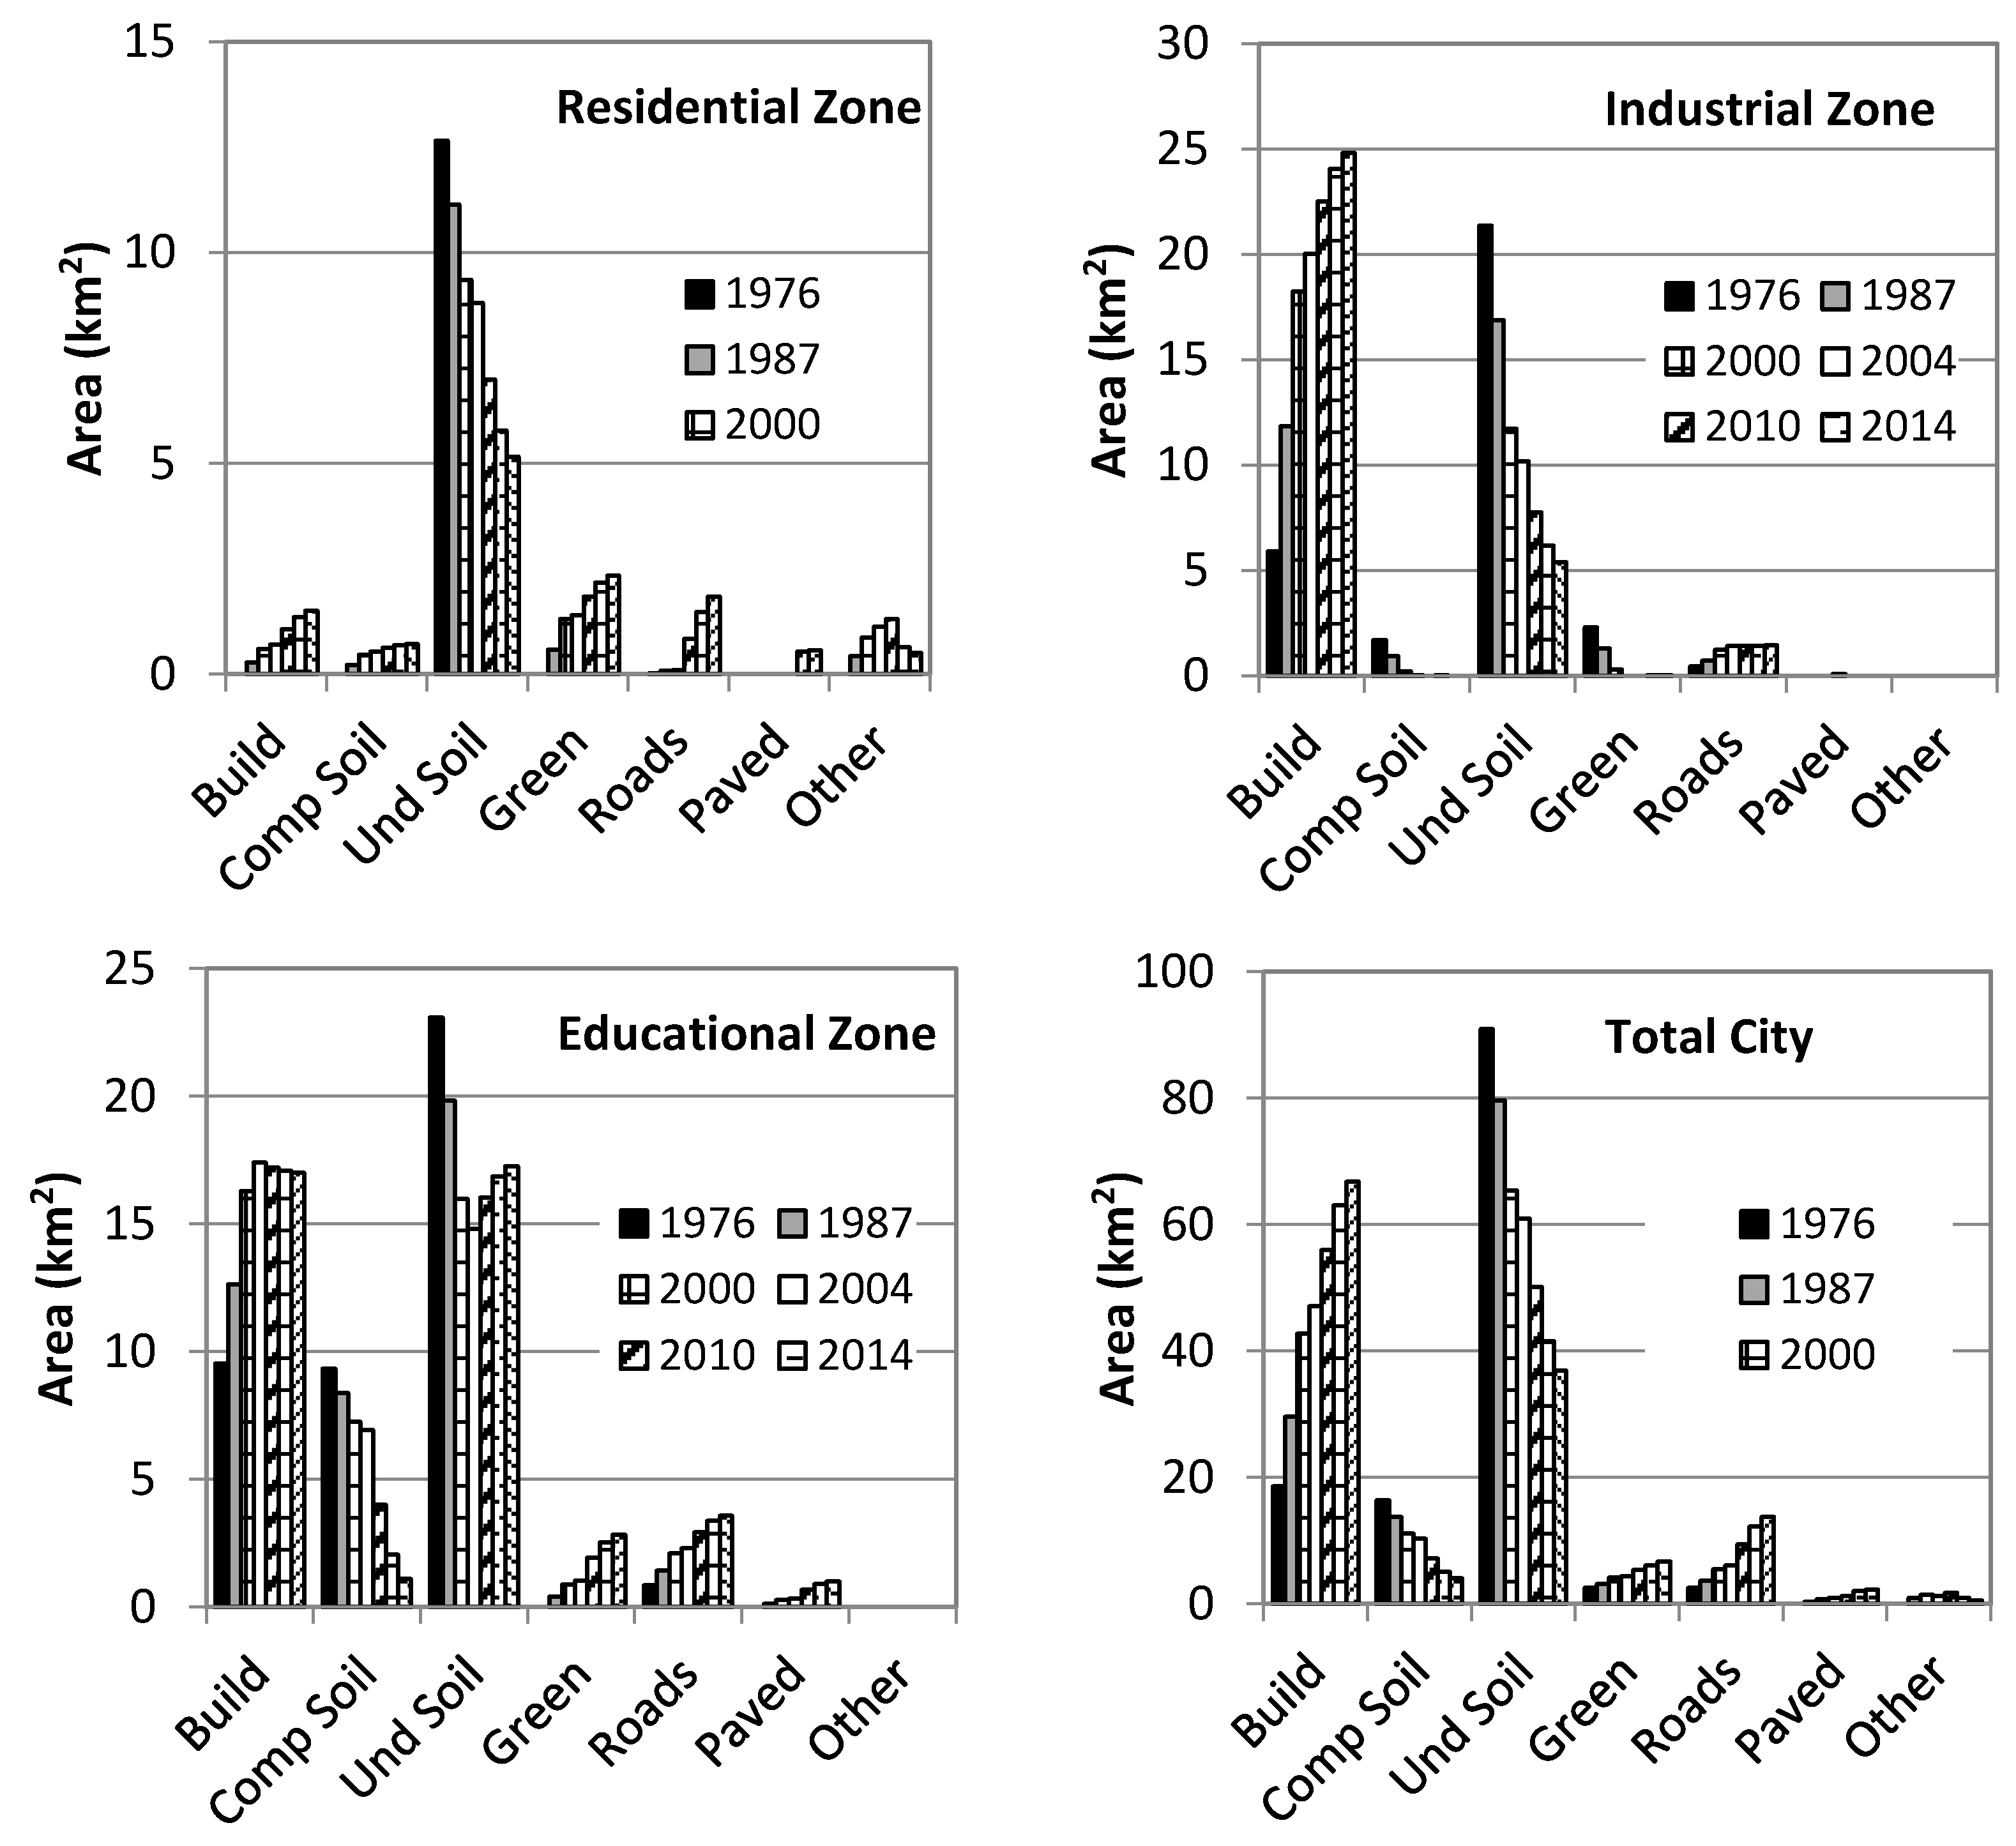
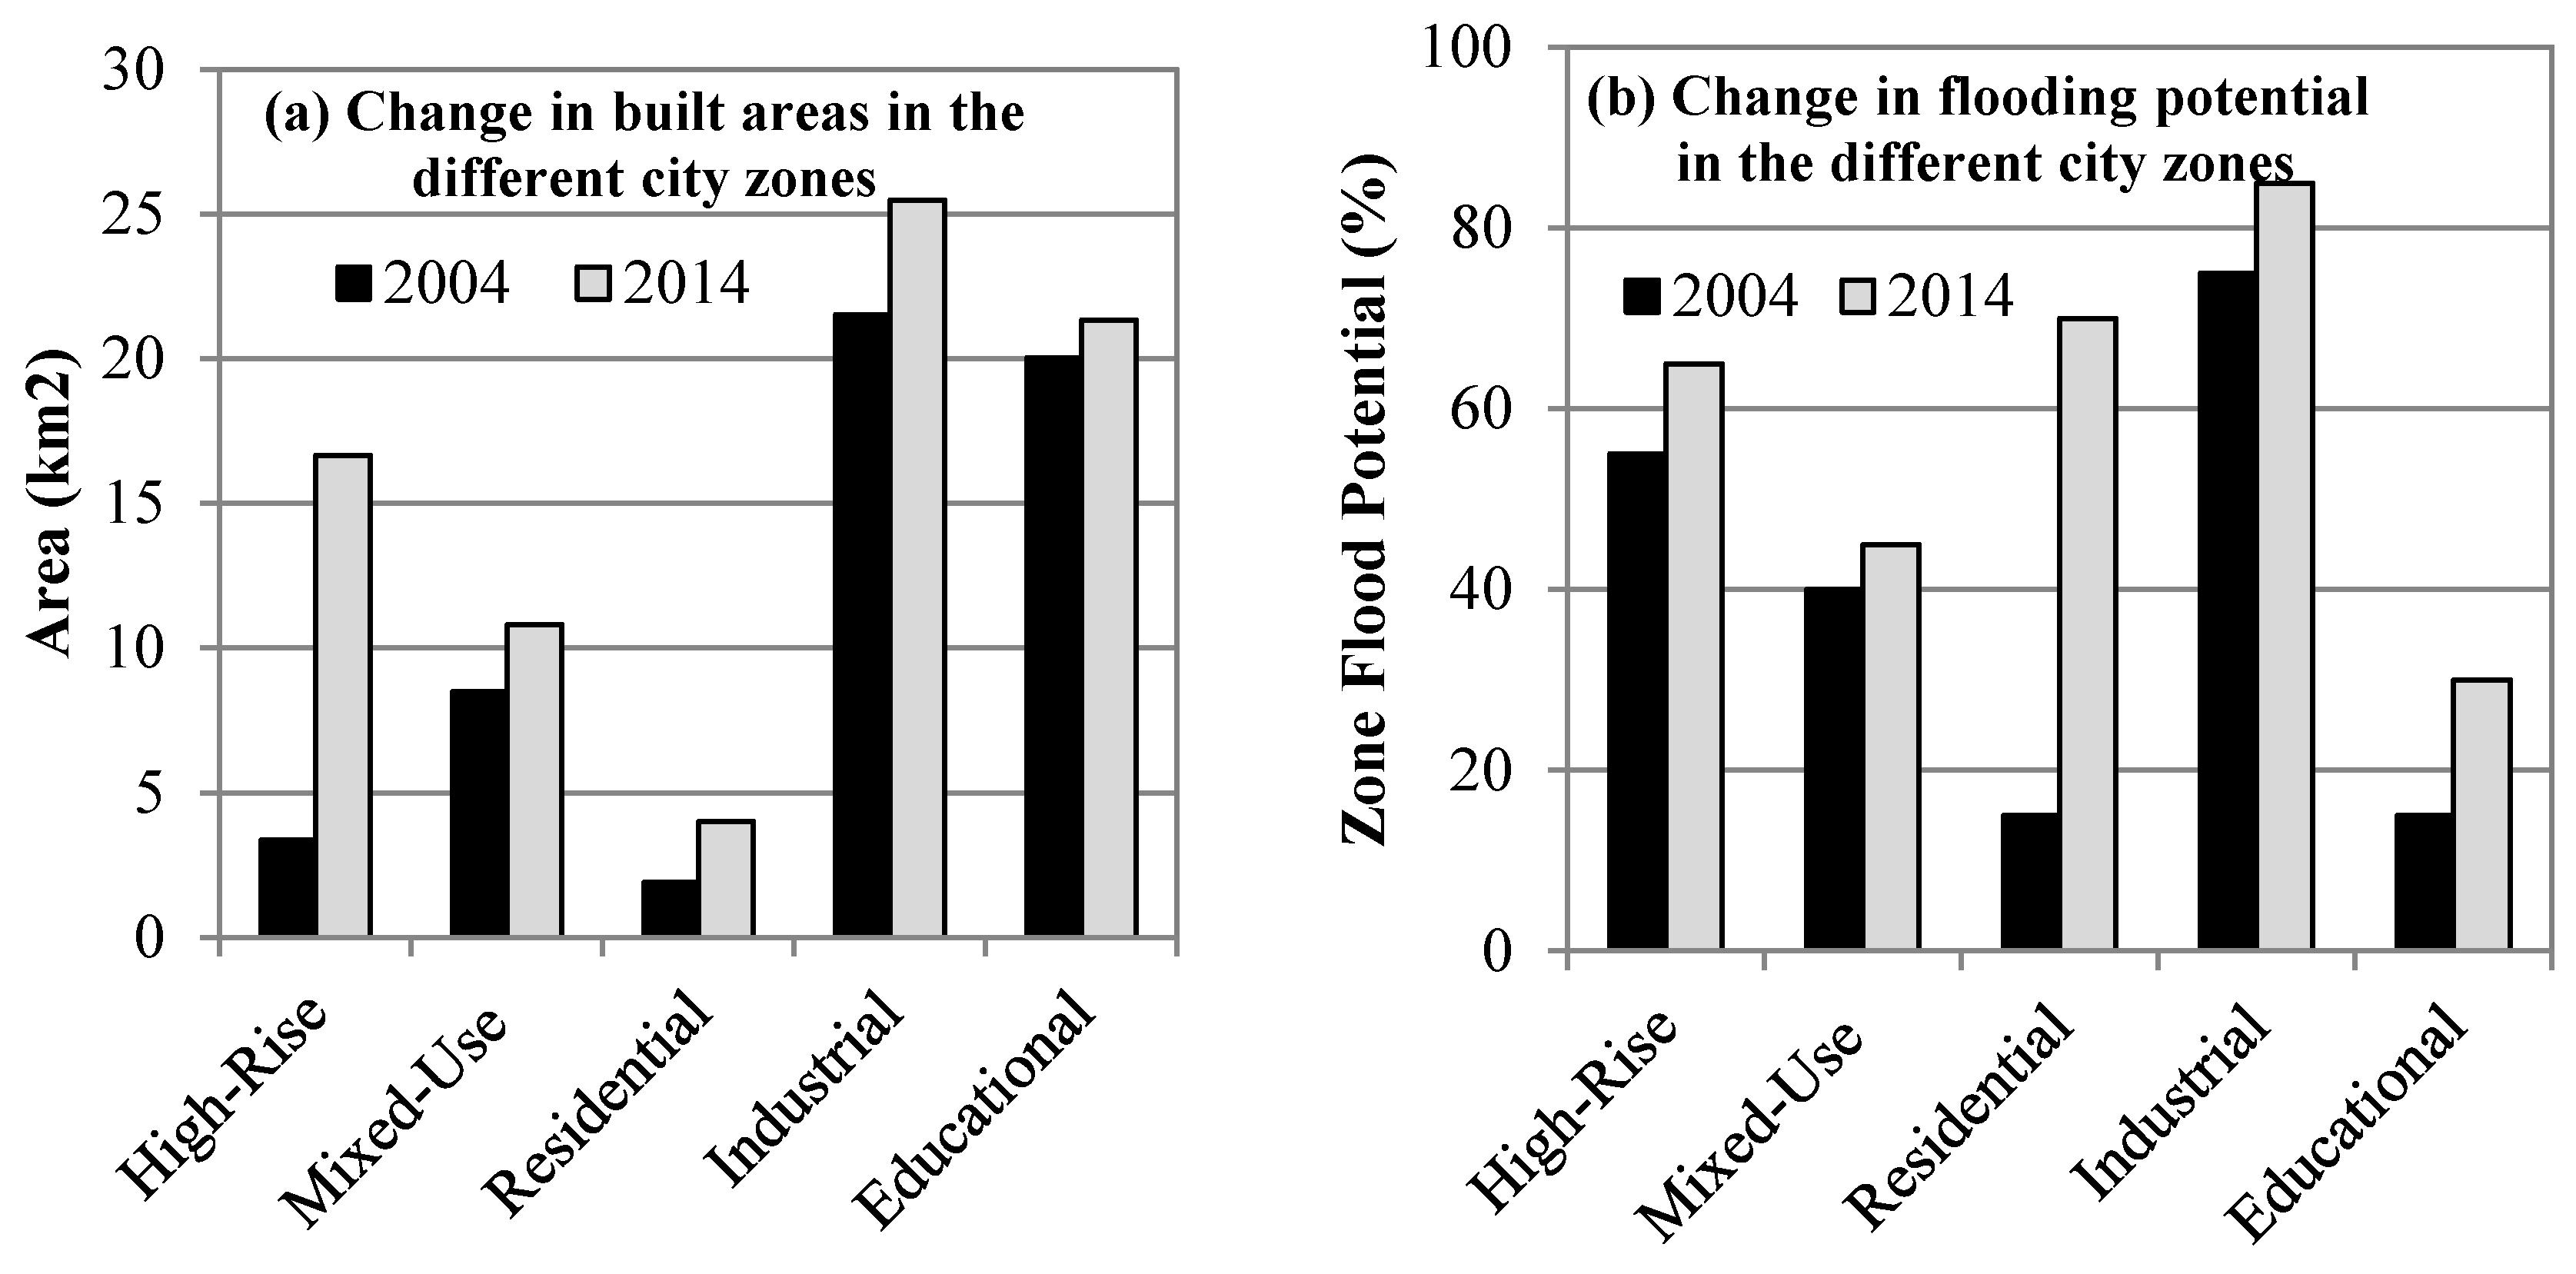
4.1. Land Cover Change and Urbanization of Sharjah City
4.2. Flooding Potential
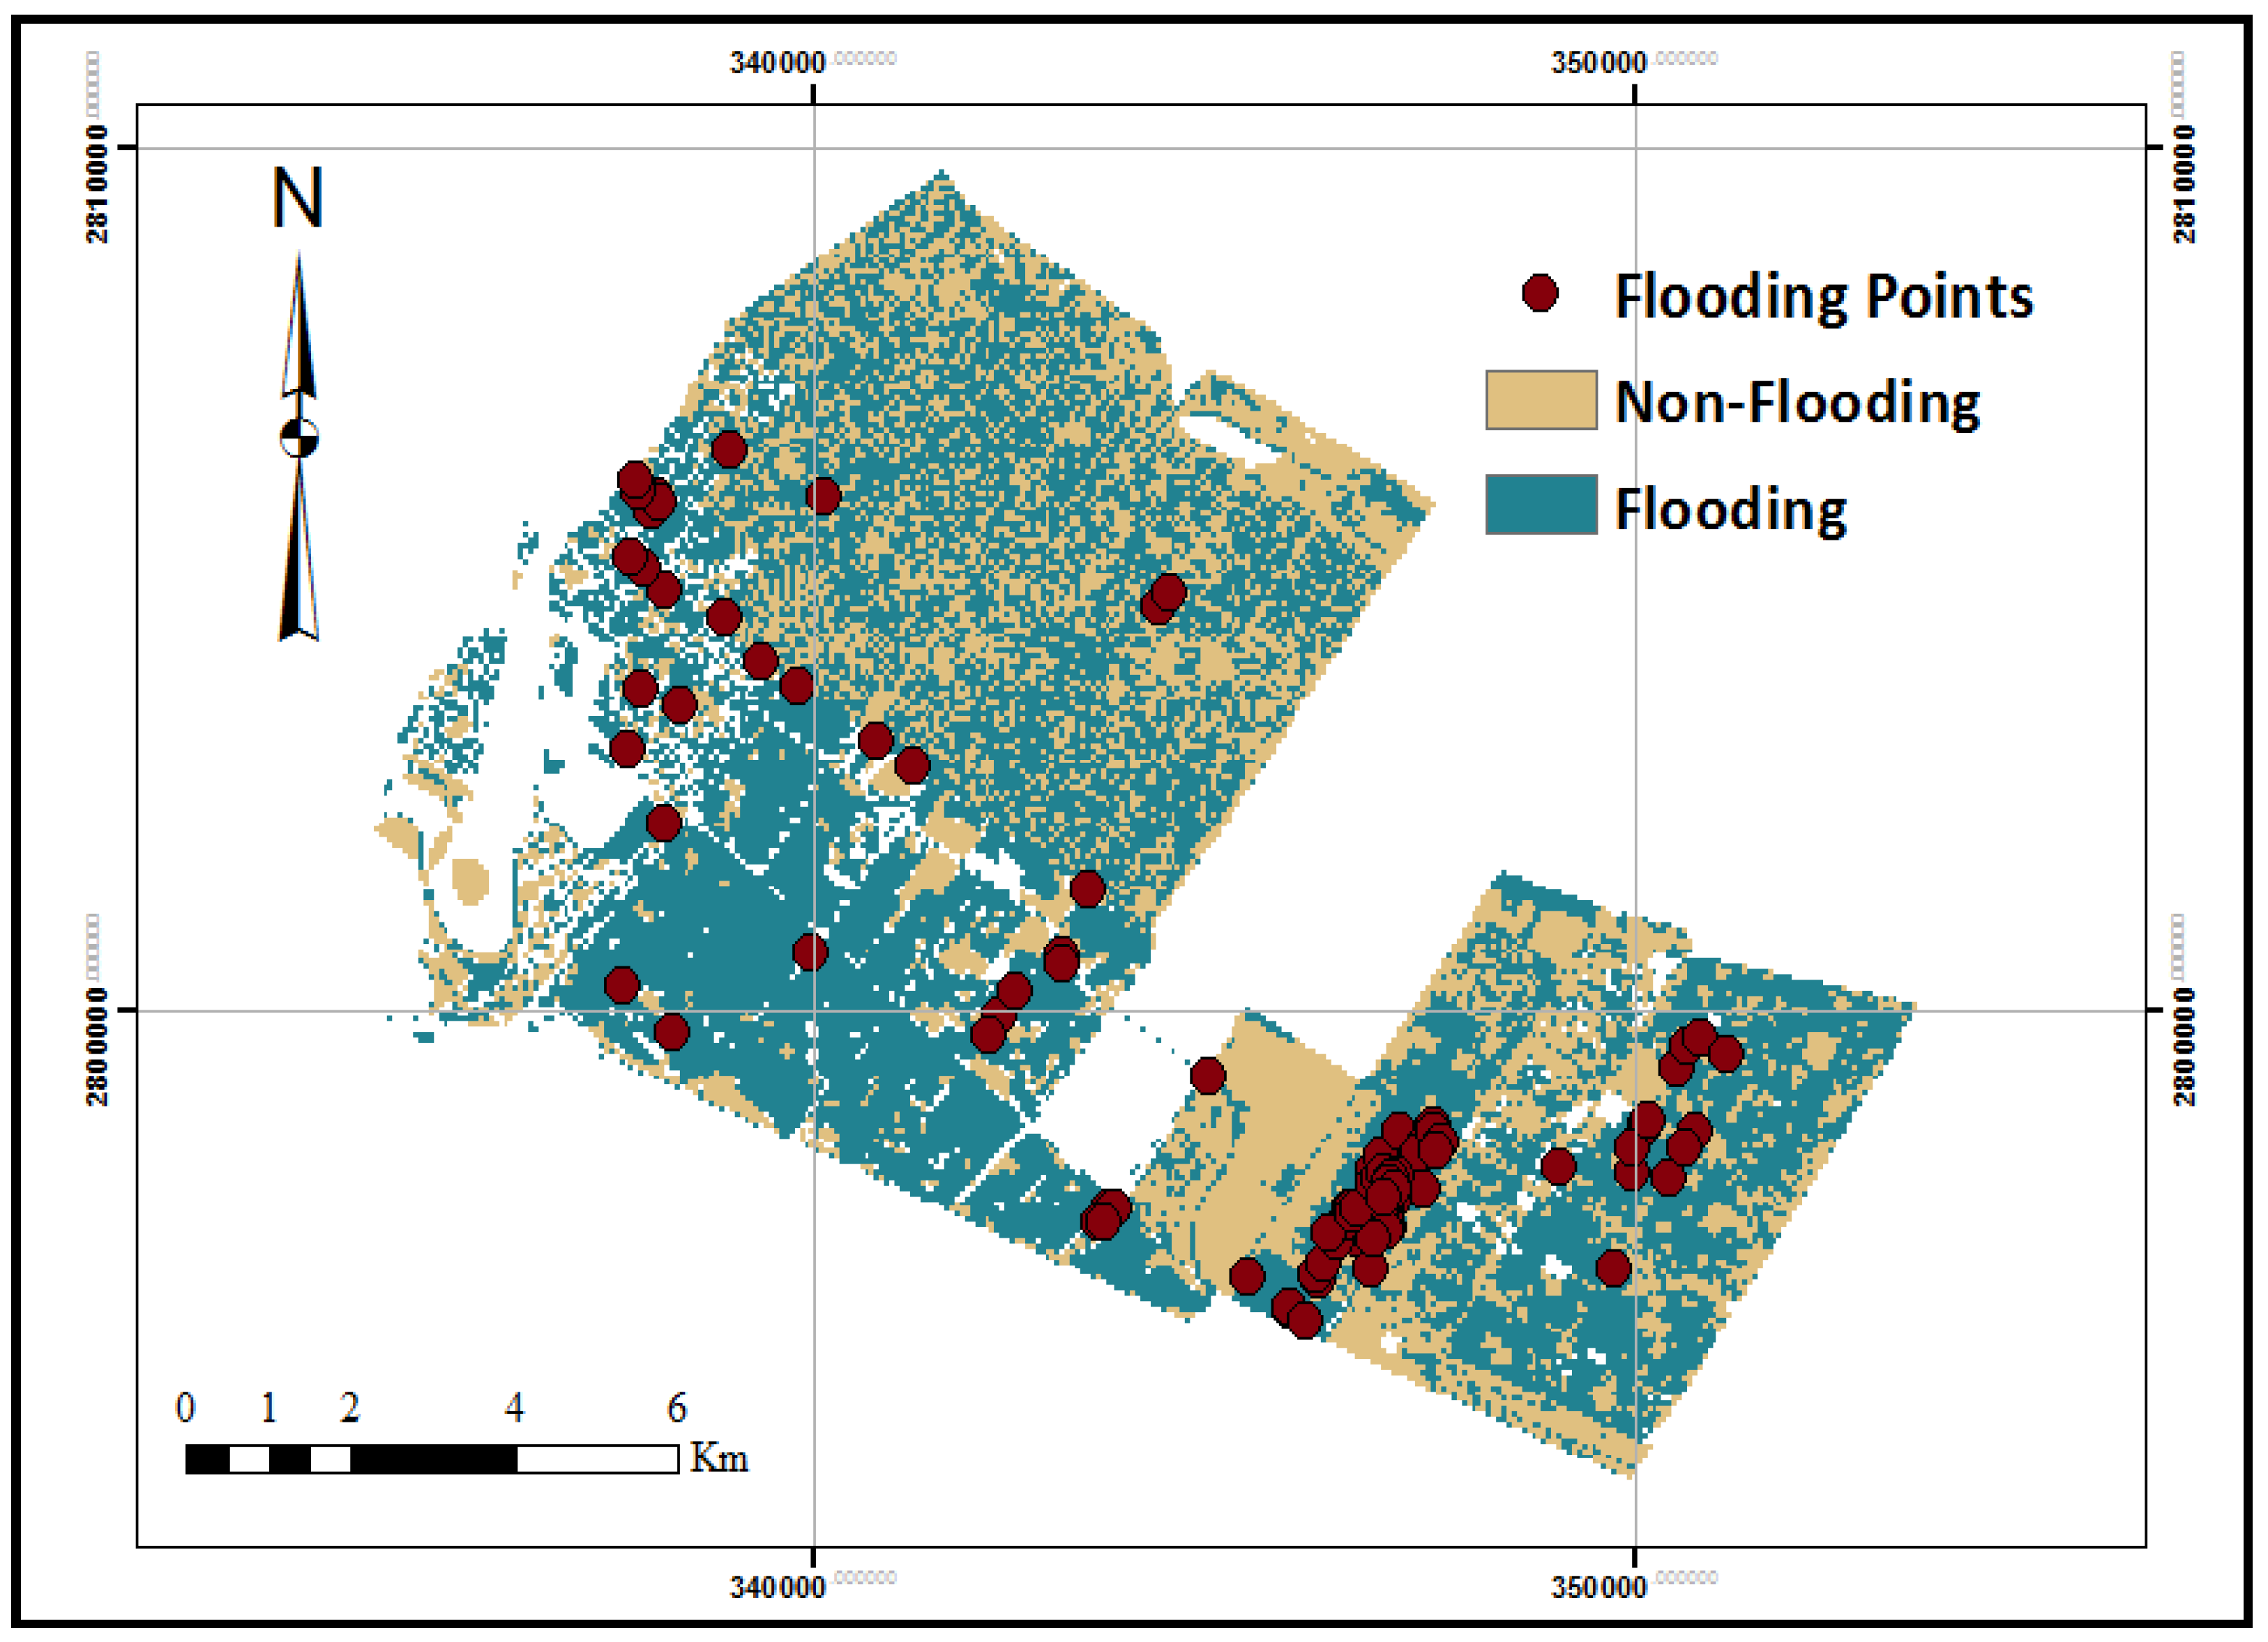
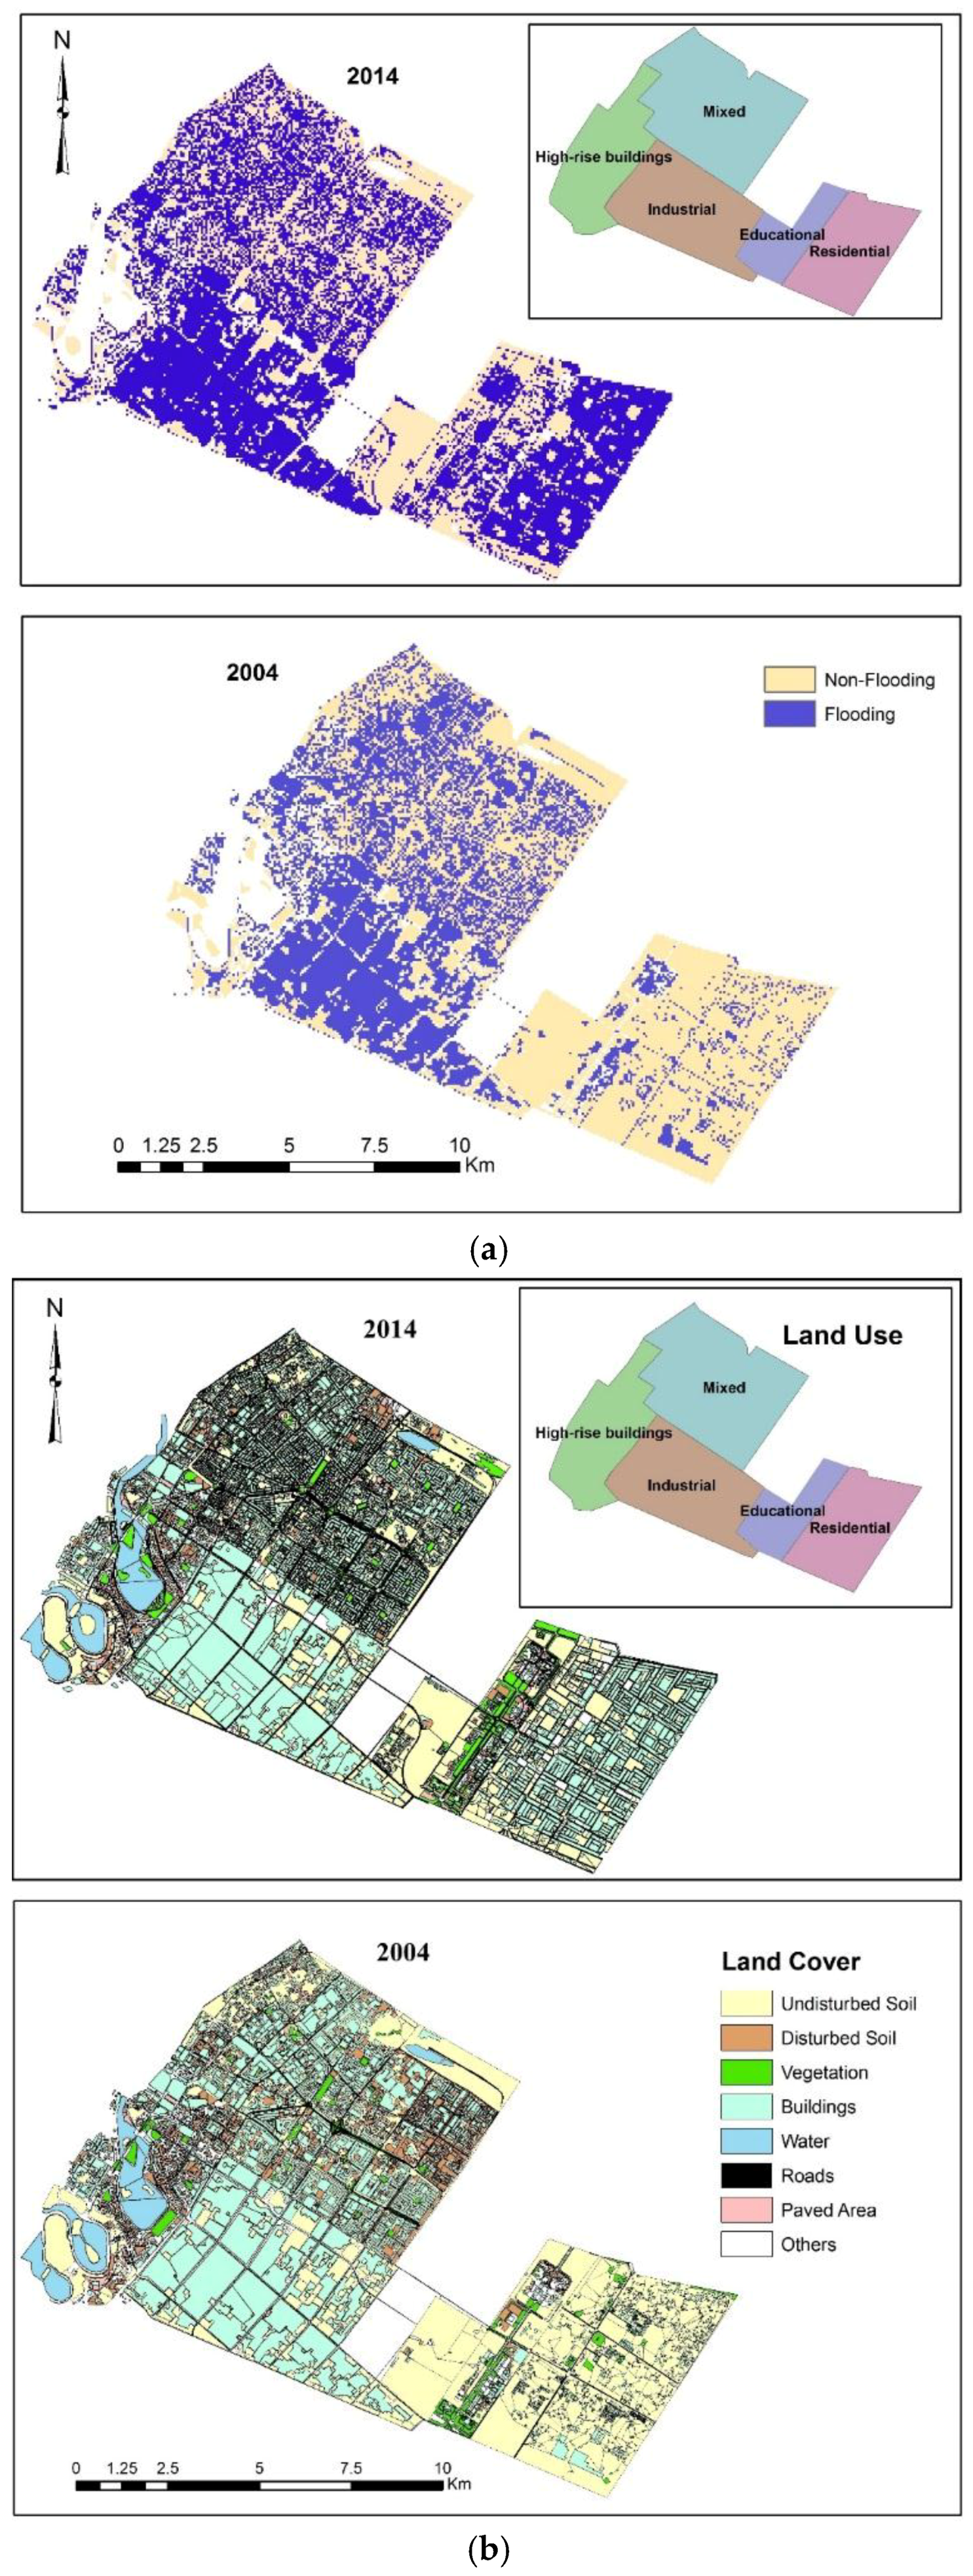
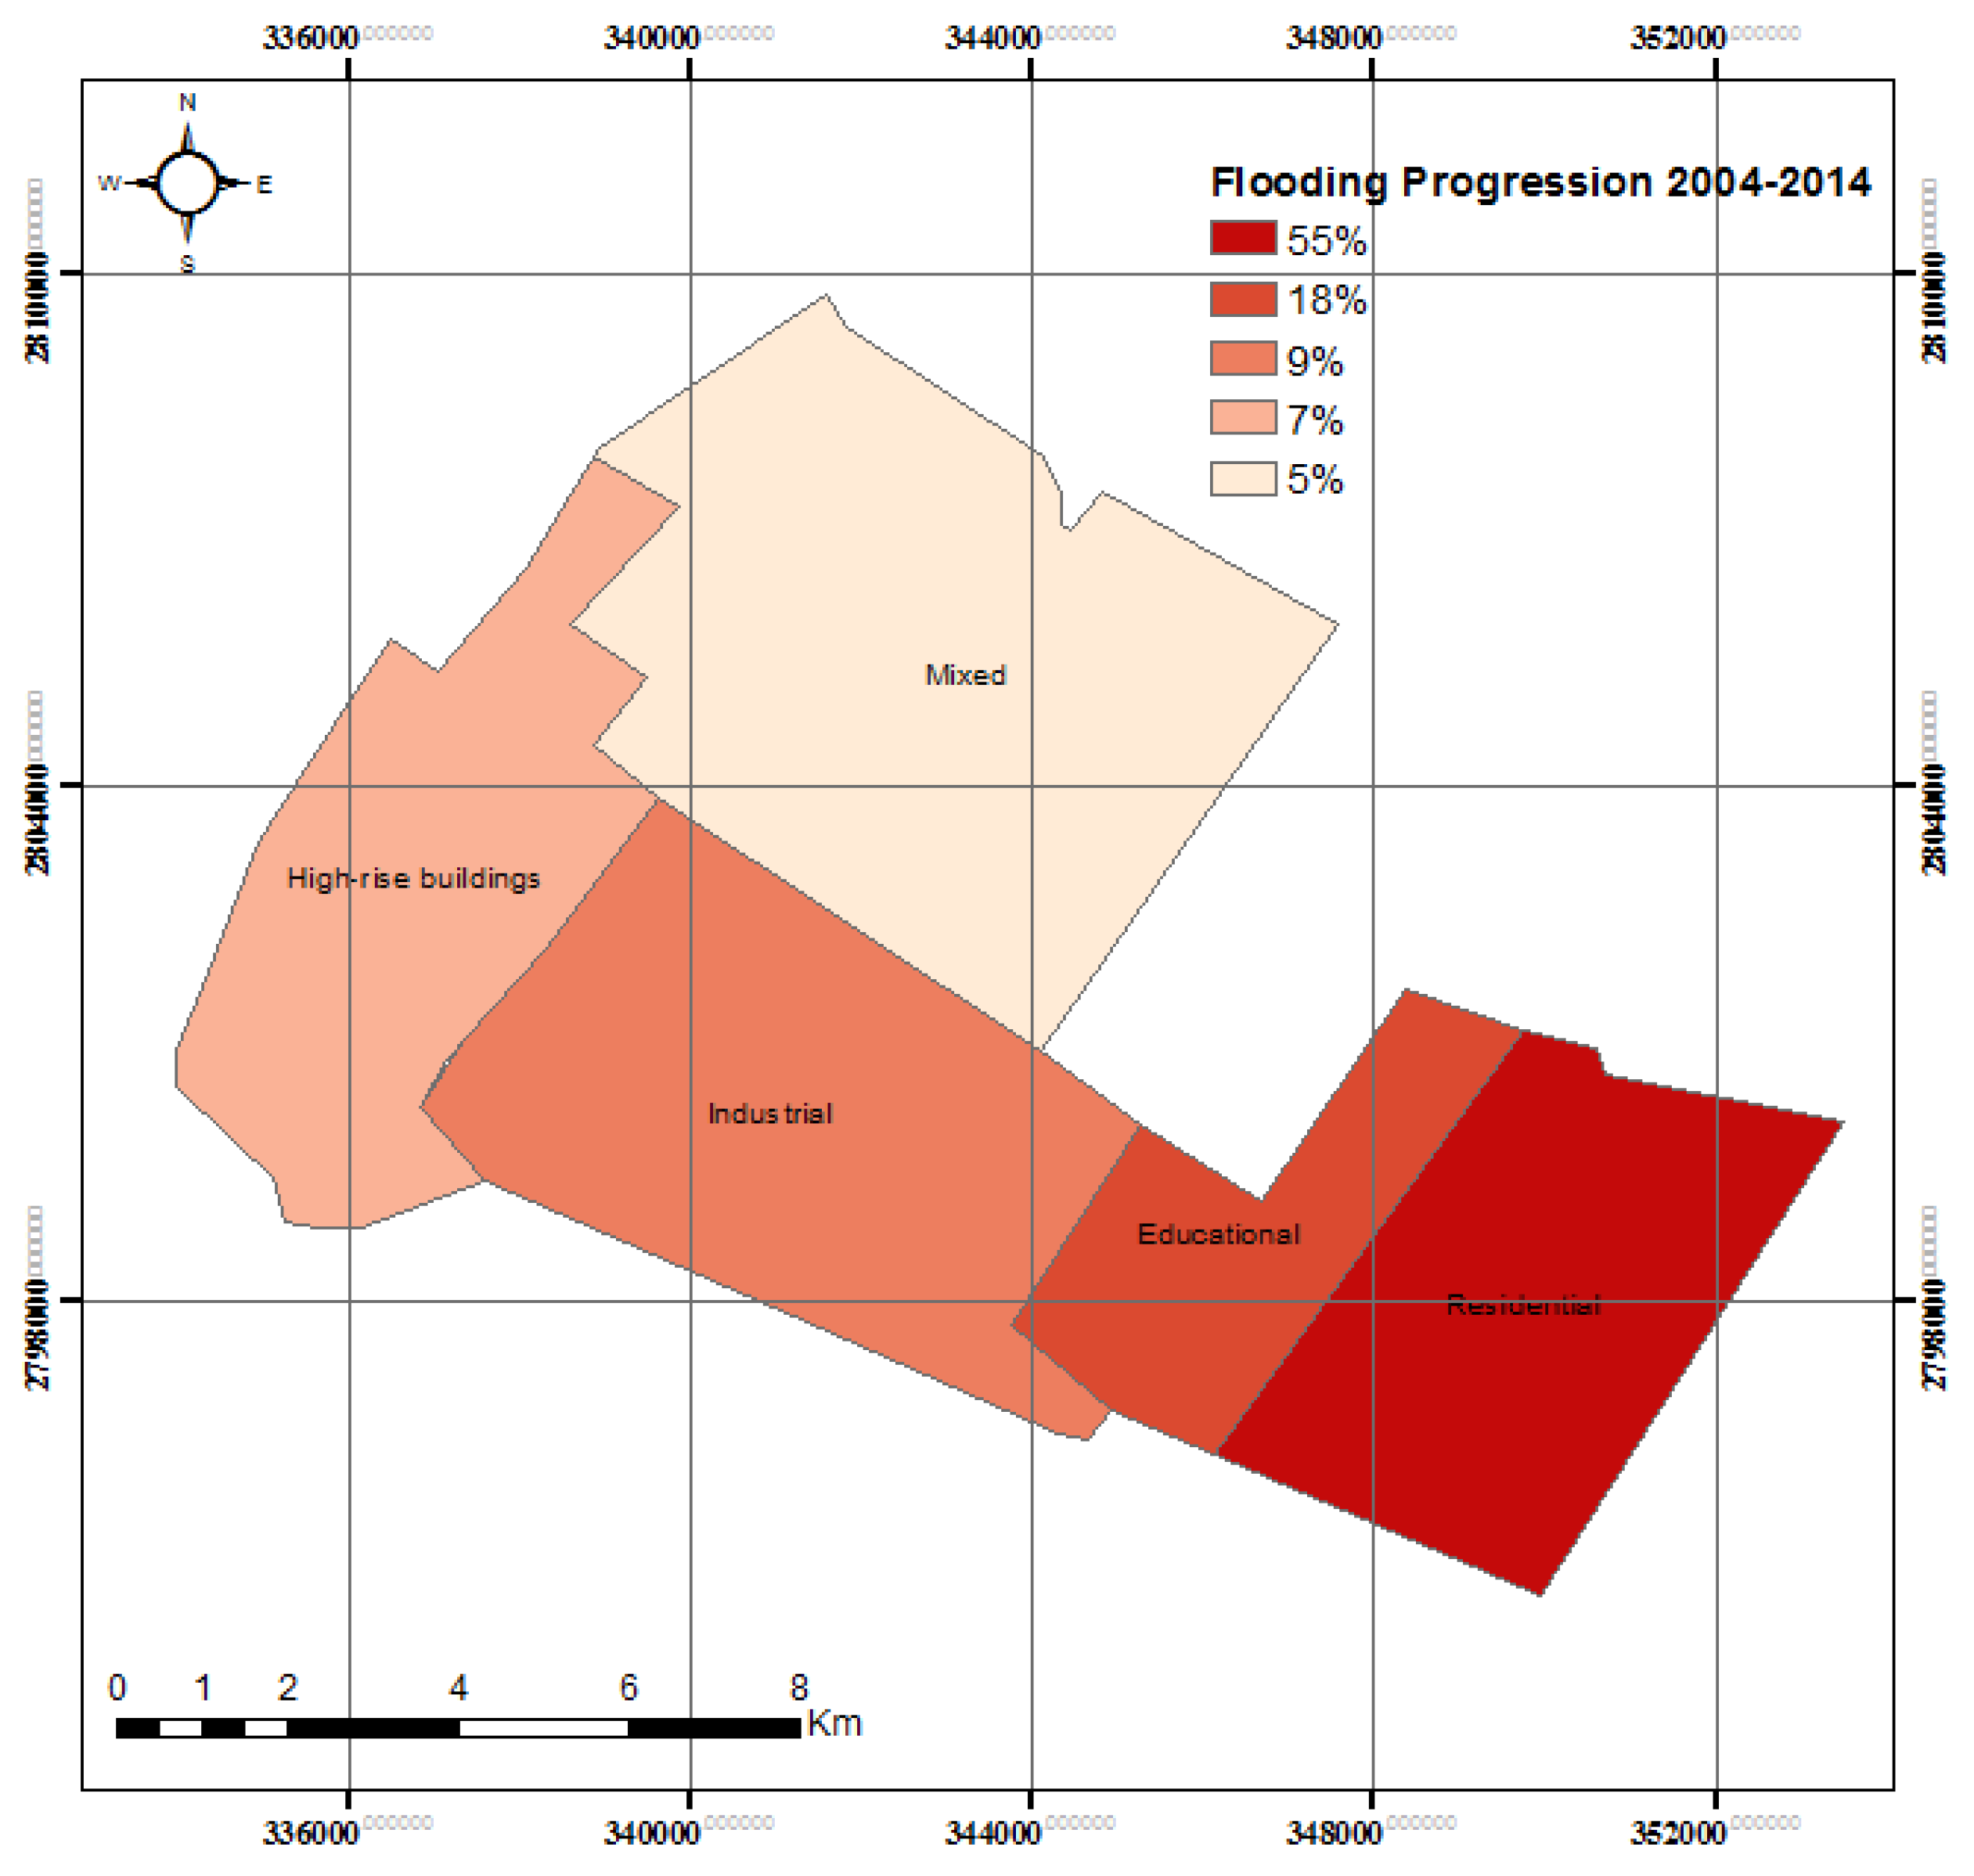
4.3. Flood Maps in Sharjah City
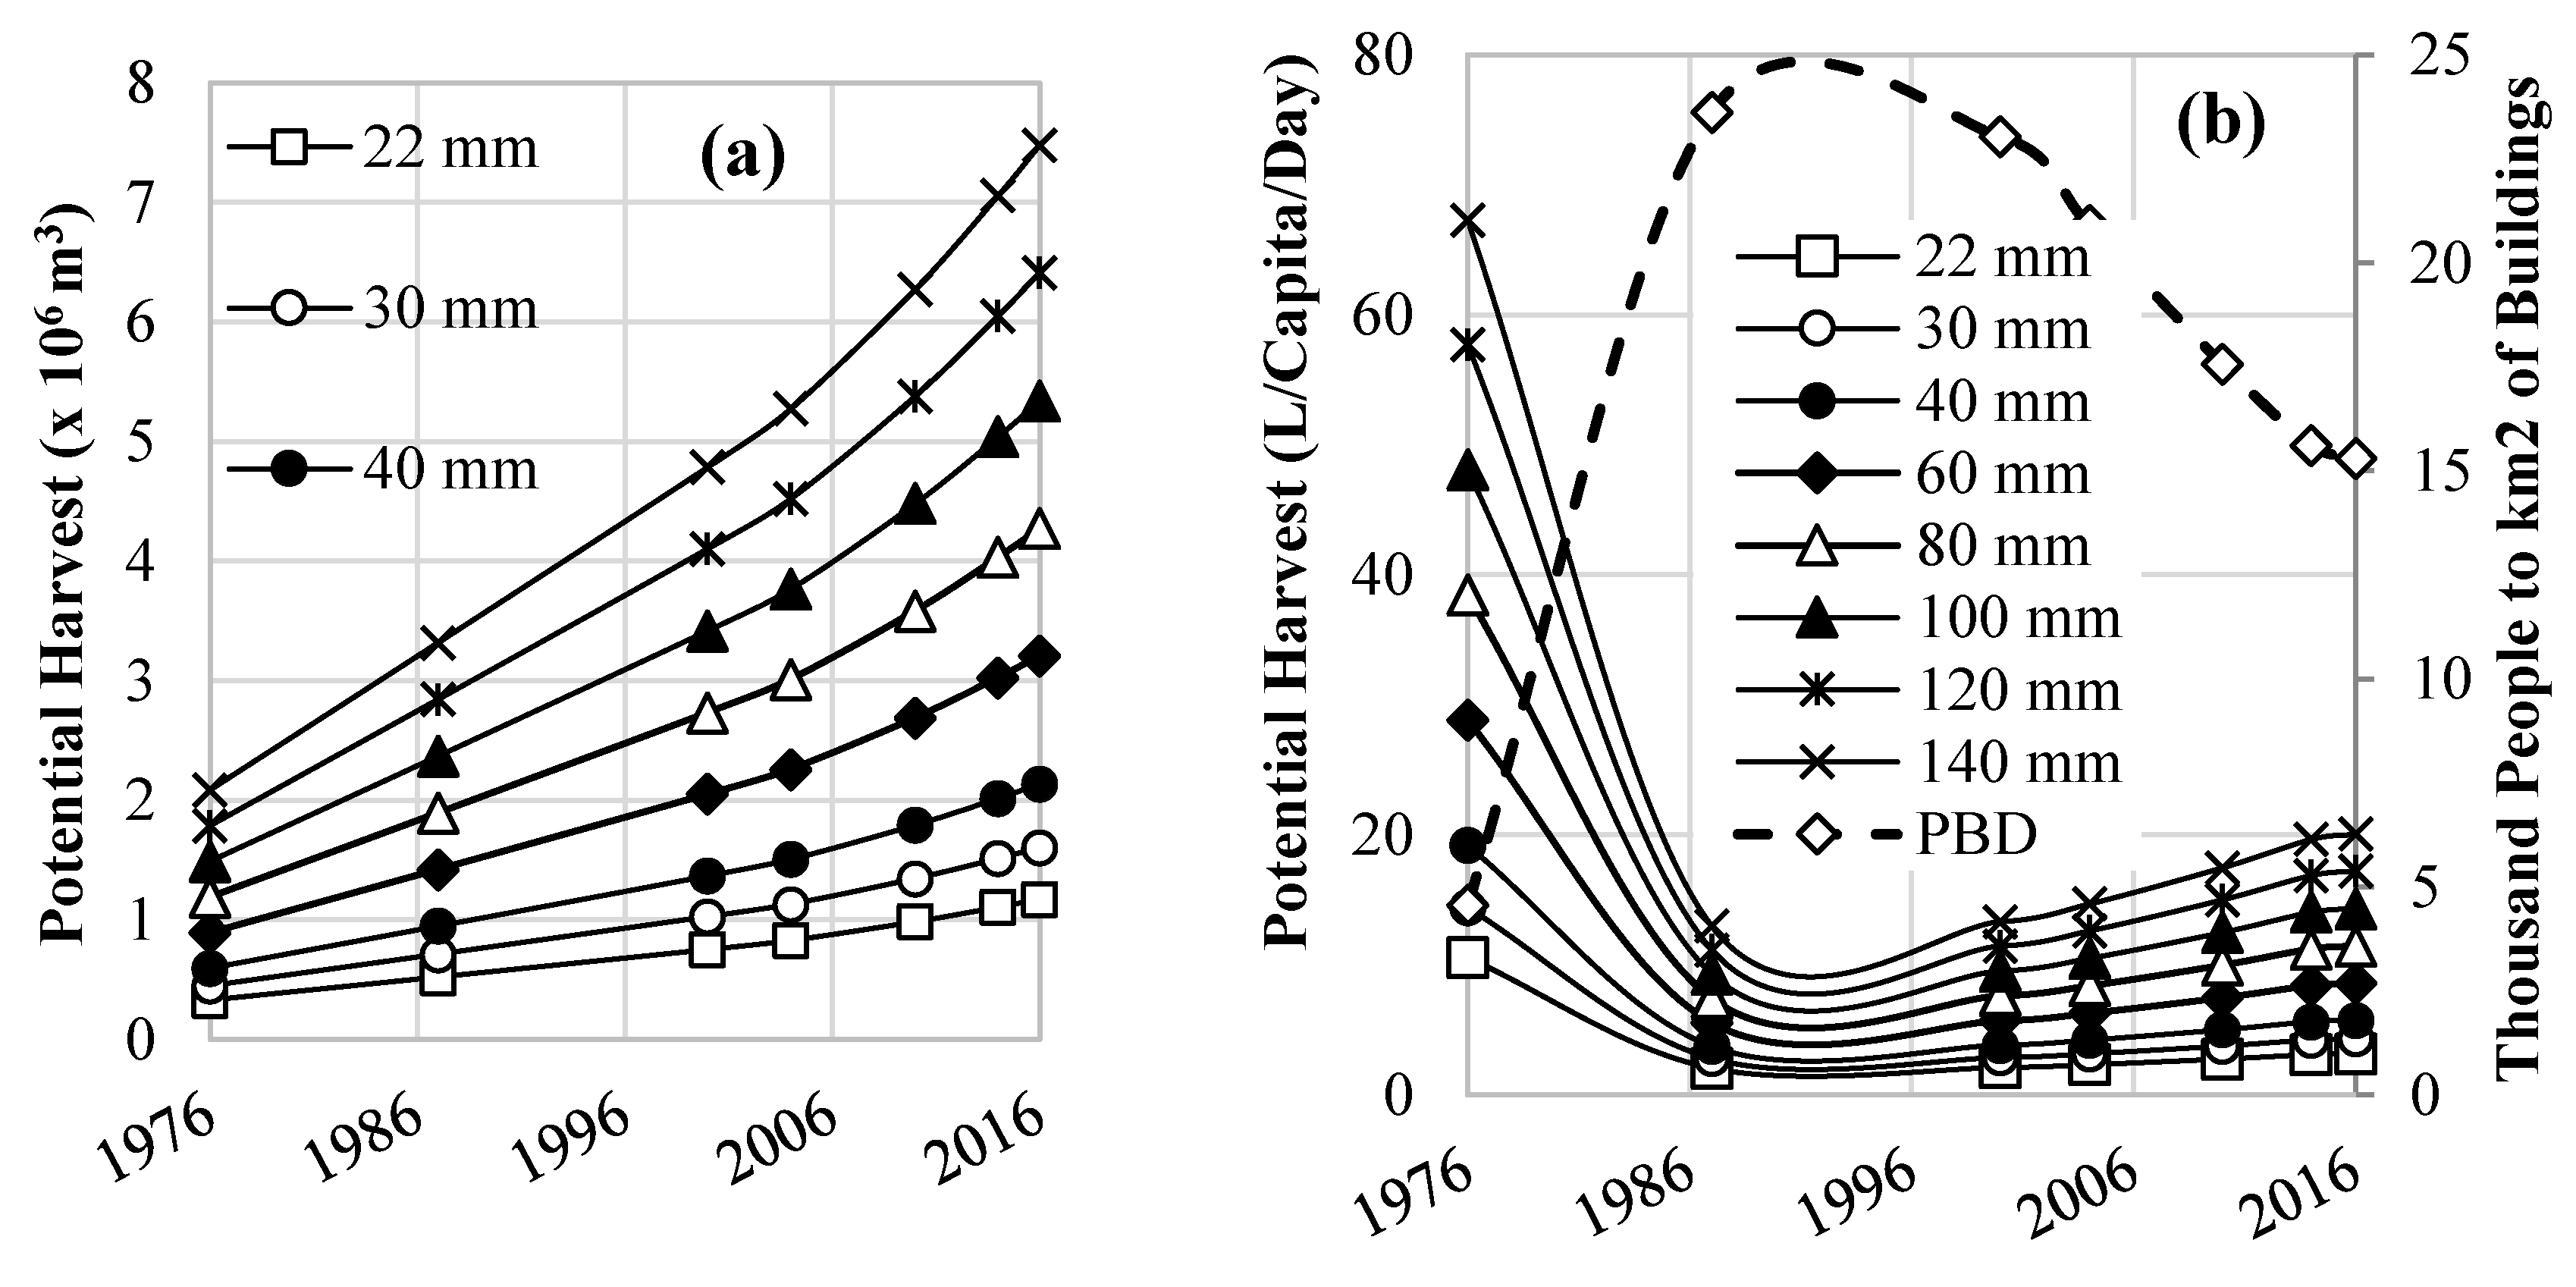
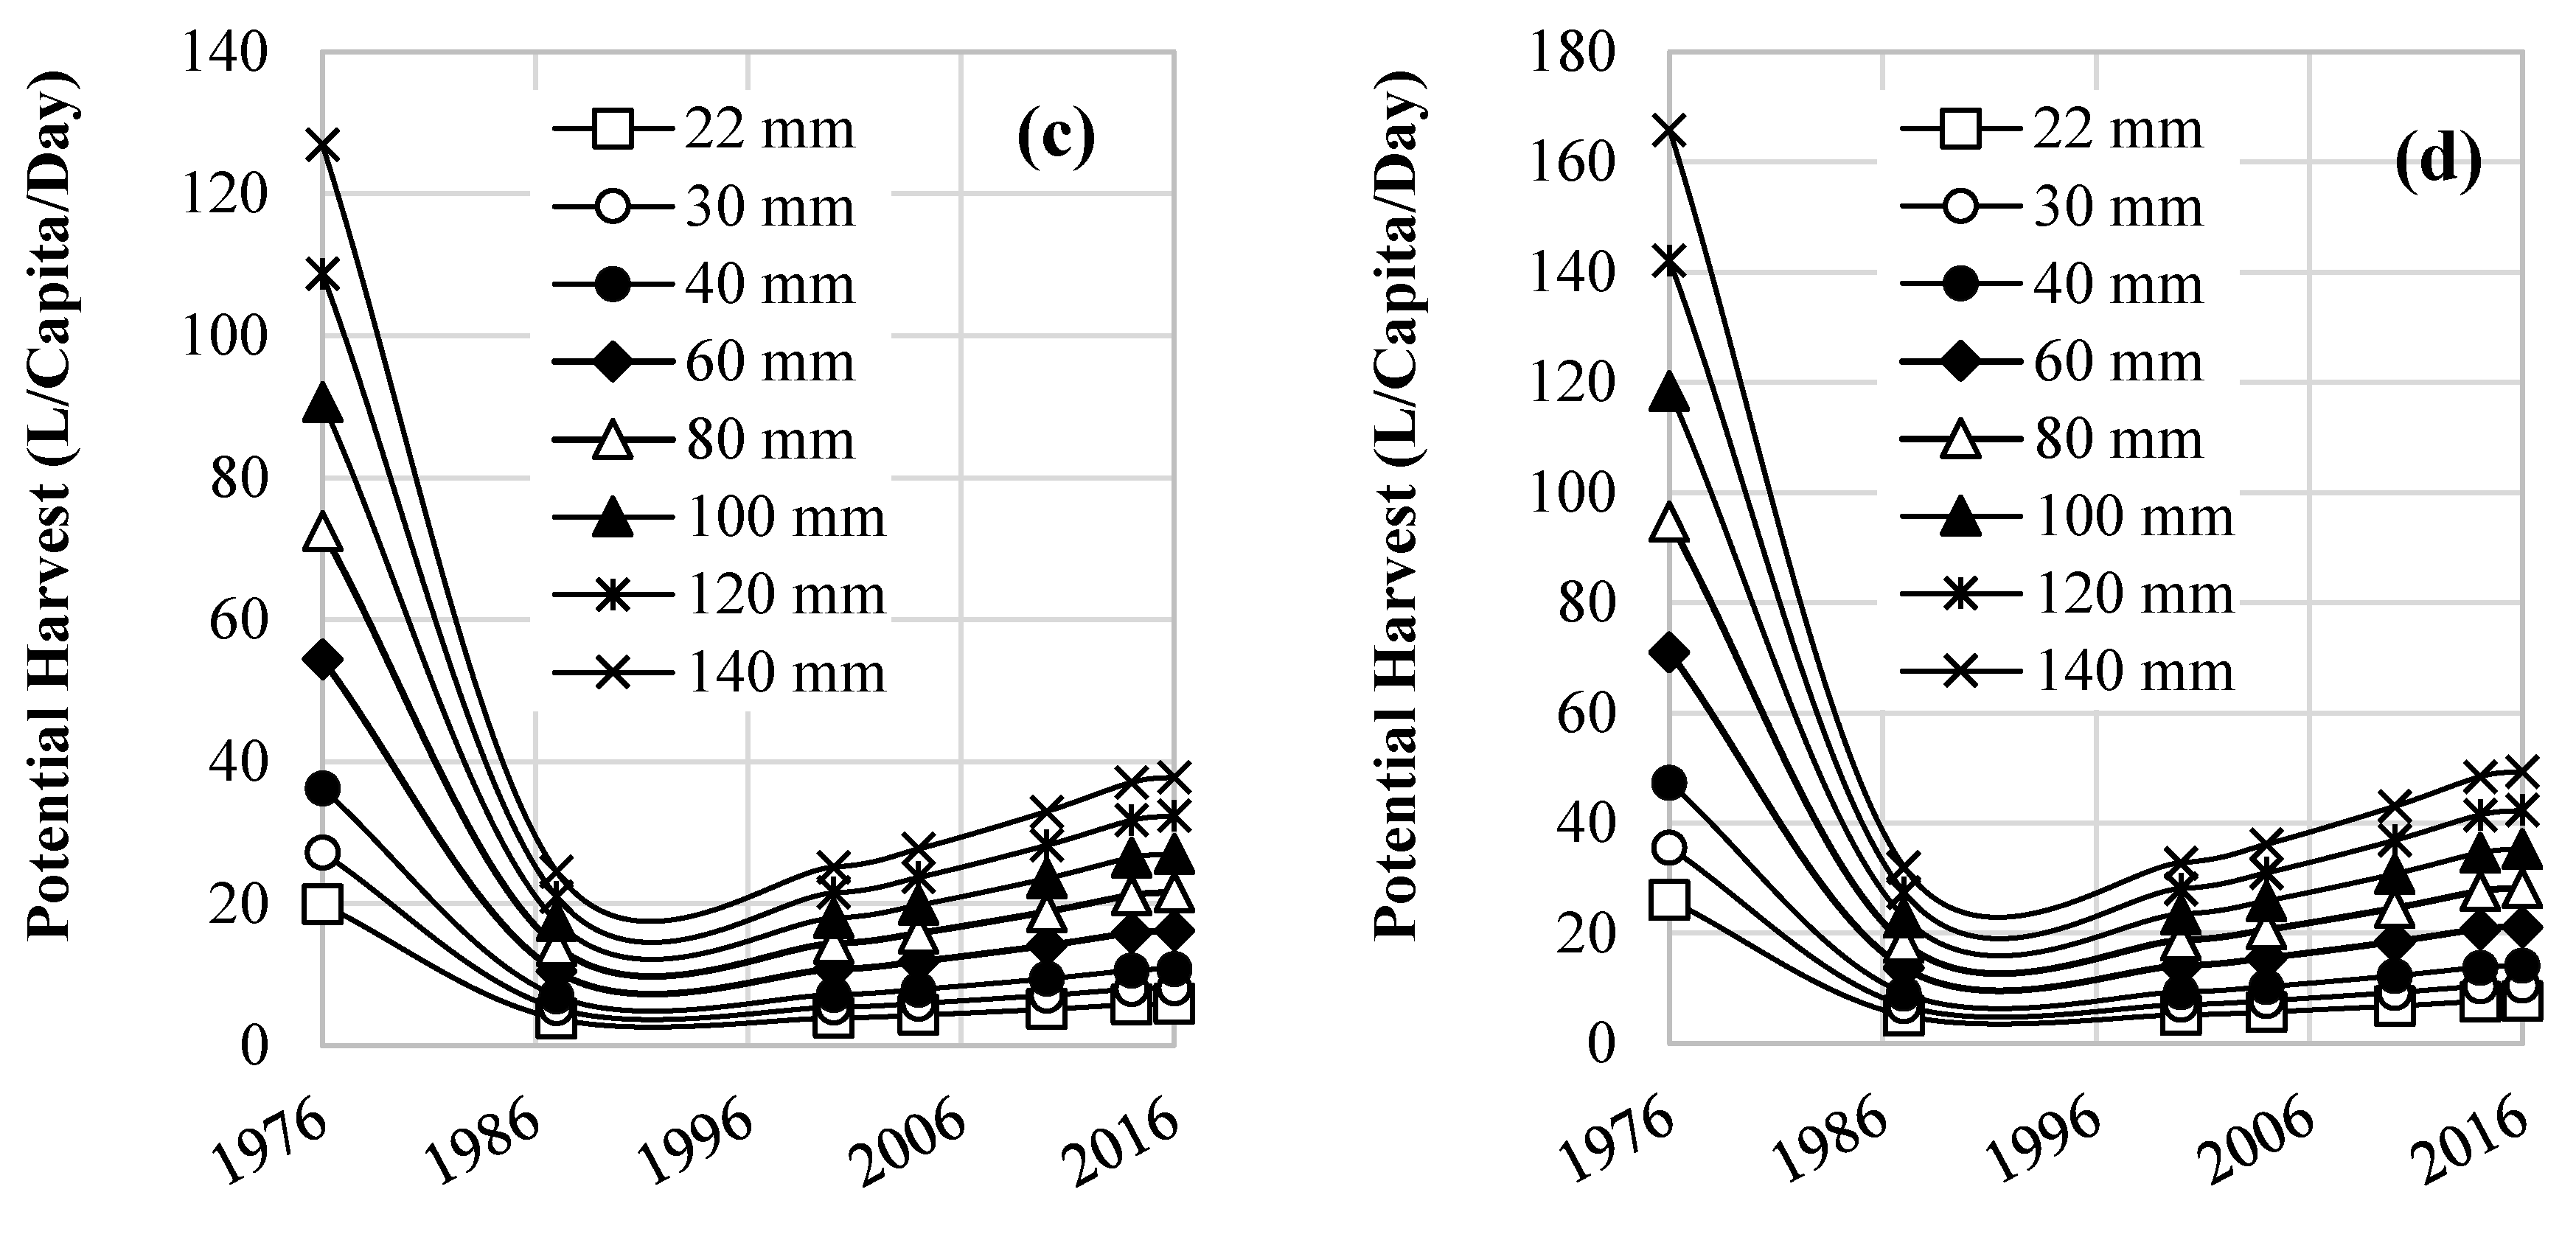
4.4. Urban Rain Water Harvesting Potential
5. Summary and Conclusions
Author Contributions
Conflicts of Interest
References
- Du, S.; Shi, P.; Van Rompaey, A.; Wen, J. Quantifying the impact of impervious surface location on flood peak discharge in urban areas. Nat. Hazards 2015, 76, 1457–1471. [Google Scholar] [CrossRef]
- Ogden, F.L.; Raj Pradhan, N.; Downer, C.W.; Zahner, J.A. Relative importance of impervious area, drainage density, width function, and subsurface storm drainage on flood runoff from an urbanized catchment. Water Resour. Res. 2011, 47, 1–12. [Google Scholar] [CrossRef]
- Du, J.; Qian, L.; Rui, H.; Zuo, T.; Zheng, D.; Xu, Y.; Xu, C.Y. Assessing the effects of urbanization on annual runoff and flood events using an integrated hydrological modeling system for Qinhuai River basin, China. J. Hydrol. 2012, 464–465, 127–139. [Google Scholar] [CrossRef]
- Suriya, S.; Mudgal, B.V. Impact of urbanization on flooding: The Thirusoolam sub watershed—A case study. J. Hydrol. 2012, 412–413, 210–219. [Google Scholar] [CrossRef]
- Choi, J.Y.; Engel, B.A.; Muthukrishnan, S.; Harbor, J. GIS based long term hydrologic impact evaluation for watershed urbanization. JAWRA J. Am. Water Resour. Assoc. 2003, 39, 623–635. [Google Scholar] [CrossRef]
- Franczyk, J.; Chang, H. The effects of climate change and urbanization on the runoff of the Rock Creek basin in the Portland metropolitan area, Oregon. USA. Hydrol. Process. 2009, 23, 805–815. [Google Scholar] [CrossRef]
- Chu, H.J.; Lin, Y.P.; Huang, C.W.; Hsu, C.Y.; Chen, H.Y. Modelling the hydrologic effects of dynamic land-use change using a distributed hydrologic model and a spatial land-use allocation model. Hydrol. Process. 2010, 24, 2538–2554. [Google Scholar] [CrossRef]
- Sharif, H.O.; Al-Juaidi, F.H.; Al-Othman, A.; Al-Dousary, I.; Fadda, E.; Jamal-Uddeen, S.; Elhassan, A. Flood hazards in an urbanizing watershed in Riyadh, Saudi Arabia. Geomat. Nat. Hazards Risk 2016, 7, 702–720. [Google Scholar] [CrossRef]
- Zope, P.E.; Eldho, T.I.; Jothiprakash, V. Impacts of urbanization on flooding of a coastal urban catchment: A case study of Mumbai City, India. Nat. Hazards 2015, 75, 887–908. [Google Scholar] [CrossRef]
- Nigussie, T.A.; Altunkaynak, A. Assessing the Hydrological Response of Ayamama Watershed from Urbanization Predicted under Various Landuse Policy Scenarios. Water Resour. Manag. 2016, 30, 3427–3441. [Google Scholar] [CrossRef]
- Al-Rawas, G.A.; Valeo, C.; Khan, U.T.; Al-Hafeedh, O.H. Effects of urban form on wadi flow frequency analysis in the Wadi Aday watershed in Muscat, Oman. Urban. Water J. 2015, 12, 263–274. [Google Scholar] [CrossRef]
- Huang, Q.; Wang, J.; Li, M.; Fei, M.; Dong, J. Modeling the influence of urbanization on urban pluvial flooding: A scenario-based case study in Shanghai, China. Nat. Hazards 2017, 87, 1035–1055. [Google Scholar] [CrossRef]
- Schilling, K.E.; Chan, K.-S.; Liu, H.; Zhang, Y.-K. Quantifying the effect of land use land cover change on increasing discharge in the Upper Mississippi River. J. Hydrol. 2010, 387, 343–345. [Google Scholar] [CrossRef]
- Ali, M.; Khan, S.J.; Aslam, I.; Khan, Z. Simulation of the impacts of land-use change on surface runoff of Lai Nullah Basin in Islamabad, Pakistan. Landsc. Urban Plan. 2011, 102, 271–279. [Google Scholar] [CrossRef]
- Turnbull, L.; Wainwright, J.; Brazier, R.E. Changes in hydrology and erosion over a transition from grassland to shrubland. Hydrol. Process. 2010, 24, 393–414. [Google Scholar] [CrossRef]
- Alexakis, D.D.; Grillakis, M.G.; Koutroulis, A.G.; Agapiou, A.; Themistocleous, K.; Tsanis, I.K.; Michaelides, S.; Pashiardis, S.; Demetriou, C.; Aristeidou, K.; et al. GIS and remote sensing techniques for the assessment of land use change impact on flood hydrology: The case study of Yialias basin in Cyprus. Nat. Hazards Earth Syst. Sci. 2014, 14, 413–426. [Google Scholar] [CrossRef] [Green Version]
- Chen, J.; Theller, L.; Gitau, M.W.; Engel, B.A.; Harbor, J.M. Urbanization impacts on surface runoff of the contiguous United States. J. Environ. Manag. 2017, 187, 470–481. [Google Scholar] [CrossRef] [PubMed]
- Liu, C.; Li, Y.; Li, J. Geographic information system-based assessment of mitigating flash-flood disaster from green roof systems. Comput. Environ. Urban Syst. 2017, 64, 321–331. [Google Scholar] [CrossRef]
- Shanableh, A.; Al-Ruzouq, R. Integration of multi-temporal satellite imagery in modeling urban expansion effects on runoff in the city of Sharjah, United Arab Emirates. In Proceedings of the Hydrology and Water Resources Symposium 2014, Berth, Australia, 24–27 February 2014; pp. 223–230. [Google Scholar]
- Shanableh, A.; Al-Ruzouq, R.; Siddique, M.; Merabtene, T.; Yilmaz, A.; Imteaz, M. Impact of urban expansion on potential flooding, storage and water harvesting in the city of Sharjah, United Arab Emirates. In Proceedings of the Advances in Sustainable Construction Materials & Civil Engineering Systems (ASCMCES-17) Conference, Sharjah, UAE, 18–20 April 2017. [Google Scholar]
- Al-Ruzouq, R.I. Data fusion of multi-source imagery based on linear features registration. Int. J. Remote Sens. 2010, 31, 5011–5021. [Google Scholar] [CrossRef]
- Al-Ruzouq, R.; Hamad, K.; Shanableh, A.; Khalil, M. Infrastructure growth assessment of urban areas based on multi-temporal satellite images and linear features. Ann. GIS 2017, 1–19. [Google Scholar] [CrossRef]
- Al-Ruzouq, R.I.; Habib, A.F. Linear features for automatic registration and reliable change detection of multi-source imagery. J. Spat. Sci. 2012, 57, 51–64. [Google Scholar] [CrossRef]
- Weng, Q. Modeling urban growth effects on surface runoff with the integration of remote sensing and GIS. Environ. Manag. 2001, 28, 737–748. [Google Scholar] [CrossRef]
- Mockus, V.; Hjelmfelt, A.T. Chapter 10: Estimation of Direct Runoff from Storm Rainfall. In Part 630 Hydrology National Engineering Handbook; United States Department of Agriculture: Washington, DC, USA, 2004; p. 79. [Google Scholar]
- Merabtene, T.; Siddique, M.; Shanableh, A. Assessment of Seasonal and Annual Rainfall Trends and Variability in Sharjah City, UAE. Adv. Meteorol. 2016, 2016. [Google Scholar] [CrossRef]
- Sherif, M.; Almulla, M.; Shetty, A.; Chowdhury, R.K. Analysis of rainfall, PMP and drought in the United Arab Emirates. Int. J. Climatol. 2014, 34, 1318–1328. [Google Scholar] [CrossRef]
- Saaty, T.L. The Analytic Hierarchy Process.: Planning, Priority Setting, Resource Allocation; McGraw-Hill: New York, NY, USA, 1980. [Google Scholar]
- Ouma, Y.O.; Tateishi, R. Urban flood vulnerability and risk mapping using integrated multi-parametric AHP and GIS: Methodological overview and case study assessment. Water 2014, 6, 1515–1545. [Google Scholar] [CrossRef]
- Forman, E.; Gass, S. The Analytic Hierarchy Process—An Exposition. Oper. Res. 2001, 49, 469–486. [Google Scholar] [CrossRef]
- Lyu, H.M.; Sun, W.J.; Shen, S.L.; Arulrajah, A. Flood risk assessment in metro systems of mega-cities using a GIS-based modeling approach. Sci. Total Environ. 2018, 626, 1012–1025. [Google Scholar] [CrossRef]
- Chen, Y.R.; Yeh, C.H.; Yu, B. Integrated application of the analytic hierarchy process and the geographic information system for flood risk assessment and flood plain management in Taiwan. Nat. Hazards 2011, 59, 1261–1276. [Google Scholar] [CrossRef]
- Sutadian, A.D.; Muttil, N.; Yilmaz, A.G.; Perera, B.J.C. Using the Analytic Hierarchy Process to identify parameter weights for developing a water quality index. Ecol. Indic. 2017, 75, 220–233. [Google Scholar] [CrossRef]
- Al-Ruzouq, R.I.; Al-Zoubi, A.; Akawi, E.E.; Abueladas, A.A.; Niemi, T.M. Multiple source imagery and linear features for detection of urban expansion in Aqaba City, Jordan. Int. J. Remote Sens. 2012, 33, 2563–2581. [Google Scholar] [CrossRef]
- Hsieh, J.; Liao, H.; Fan, K.; Ko, M.; Hung, Y. Image Registration Using a New Edge-Based Approach. Comput. Vis. Image Underst. 1997, 67, 112–130. [Google Scholar] [CrossRef]
- Cavallaro, A.; Touradj, E. Change Detection Based on Color Edges. In Proceedings of the IEEE International Symposium on Circuits and Systems (ISCAS-2001), Sydney, NSW, Australia, 6–9 May 2001. [Google Scholar]
- Pavan Kumar, K.; Barik, D.K.; Manideep, C. A Comparative Study of Storm Water Drainage Methods for Urban Storm Water Management. Indian J. Sci. Technol. 2015, 8. [Google Scholar] [CrossRef]


| Built Area | Compact Soil | Undisturbed Soil | Vegetation | Roads | Paved Areas | Others |
|---|---|---|---|---|---|---|
| 90 | 80 | 75 | 70 | 90 | 87 | 87 |
| Duration (min) | 1000 Year Return Period | 2 Year Return Period | ||
|---|---|---|---|---|
| Intensity (mm/h) | Rainfall (mm) | Intensity (mm/h) | Rainfall (mm) | |
| 5 | 250 | 21 | 50 | 4 |
| 25 | 130 | 54 | 25 | 10 |
| 50 | 75 | 63 | 18 | 15 |
| 100 | 50 | 83 | 10 | 17 |
| 150 | 35 | 88 | 7 | 18 |
| 200 | 30 | 100 | 6 | 20 |
© 2018 by the authors. Licensee MDPI, Basel, Switzerland. This article is an open access article distributed under the terms and conditions of the Creative Commons Attribution (CC BY) license (http://creativecommons.org/licenses/by/4.0/).
Share and Cite
Shanableh, A.; Al-Ruzouq, R.; Yilmaz, A.G.; Siddique, M.; Merabtene, T.; Imteaz, M.A. Effects of Land Cover Change on Urban Floods and Rainwater Harvesting: A Case Study in Sharjah, UAE. Water 2018, 10, 631. https://doi.org/10.3390/w10050631
Shanableh A, Al-Ruzouq R, Yilmaz AG, Siddique M, Merabtene T, Imteaz MA. Effects of Land Cover Change on Urban Floods and Rainwater Harvesting: A Case Study in Sharjah, UAE. Water. 2018; 10(5):631. https://doi.org/10.3390/w10050631
Chicago/Turabian StyleShanableh, Abdallah, Rami Al-Ruzouq, Abdullah Gokhan Yilmaz, Mohsin Siddique, Tarek Merabtene, and Monzur Alam Imteaz. 2018. "Effects of Land Cover Change on Urban Floods and Rainwater Harvesting: A Case Study in Sharjah, UAE" Water 10, no. 5: 631. https://doi.org/10.3390/w10050631