Article

Prediction of Typhoon-Induced Flood Flows at Ungauged Catchments Using Simple Regression and Generalized Estimating Equation Approaches

1
School of Civil Engineering, Chungbuk National University, Cheongju 28644, Korea
2
Centre for Water in the Minerals Industry, University of Queensland, Brisbane 4072, Australia
3
Department of Information & Statistics, Chungbuk National University, Cheongju 28644, Korea
*
Author to whom correspondence should be addressed.
Water 2018, 10(5), 647; https://doi.org/10.3390/w10050647
Submission received: 29 March 2018 / Revised: 3 May 2018 / Accepted: 14 May 2018 / Published: 16 May 2018
(This article belongs to the Section Hydrology)

Abstract

:
Typhoons are the main type of natural disaster in Korea, and accurately predicting typhoon-induced flood flows at gauged and ungauged locations remains an important challenge. Flood flows caused by six typhoons since 2002 (typhoons Rusa, Maemi, Nari, Dienmu, Kompasu and Bolaven) are modeled at the outlets of 24 Geum River catchments using the Probability Distributed Moisture model. The Monte Carlo Analysis Toolbox is applied with the Nash Sutcliffe Efficiency as the criterion for model parameter estimation. Linear regression relationships between the parameters of the Probability Distributed Moisture model and catchment characteristics are developed for the purpose of generalizing the parameter estimates to ungauged locations. These generalized parameter estimates are tested in terms of ability to predict the flood hydrographs over the 24 catchments using a leave-one-out validation approach. We then test the hypothesis that a more complex generalization approach, the Generalized Estimating Equation, which includes properties of the typhoons as well as catchment characteristics as predictors of PDM model parameters, will provide more accurate predictions. The results show that the predictions of Generalized Estimating Equation are comparable to those of the simpler, conventional regression. The simpler approach is therefore recommended for practical applications; however, further refinements of the Generalized Estimating Equation approach may be explored.

1. Introduction

Typhoons are the main natural disaster in Korea. In recent years, Korea has experienced an increased frequency and strength of typhoons and an increase in the resulting damage [1,2]. The maximum annual flood peak historically is often caused by heavy rainfall in the wet season (“Changma”) as well as typhoons; however, since 2002, typhoons are perceived to have become the main source of flood risk, while the Changma has become less influential in Korea. Estimation of typhoon-induced flood hydrographs and associated flood peaks is therefore considered to be increasingly important for engineering applications, such as design of civil engineering structures, stabilization of river banks and flood warning and management.
Gauged flood hydrographs are not available for most of the medium to small-sized catchments in Korea. The need to predict flows at locations where observed flows do not exist for model calibration and validation, i.e., the ungauged catchment problem, is common [3]. The common approach to this problem is selection of a preferred rainfall-runoff model followed by spatial generalization (regionalization) of its parameters. The regionalization methods depend on nature of the selected rainfall-runoff model and the catchments. Blöschl et al. [3] grouped the methods into three main categories: (a) a-priori estimation of model parameters from catchment characteristics (e.g., [4]); (b) transfer of calibrated model parameters from gauged catchments (e.g., [5]); (c) constraining model parameters by regionalized runoff characteristics and proxy data (e.g., [6]).
The literature on the topic of flood hydrograph regionalization is very well developed. Salinas et al. [7] summarize a comparative assessment of 20 flood prediction studies involving 3023 catchments, concluding that flood flow predictions in ungauged catchments are more accurate in humid than in arid catchments. However, in this and the broader literature, flood studies in Asian monsoon areas are not well represented compared to other humid areas. Although a number of studies have analyzed typhoon rainfall [8,9,10,11], there are particularly few studies focusing specifically on flood hydrology associated with East Asian typhoons combined with mountainous environments. One significant study was by [12], who analyzed how flood events in Korea are controlled by the mean, standard deviation, maximum rainfall intensity of the hourly rainfall time series. The typhoons’ maximum rainfall intensity was found to be an important factor affecting the flood responses.
Classic statistical regionalization studies are based on the premise that there are predictable differences in rainfall-runoff model parameters between catchments, and that there are no changes in parameters between flood events. This means that the estimated model parameters are averaged over flood events to one representative parameter set per catchment [13,14]. This may underestimate uncertainty especially when large differences in rainfall properties between events, such as in typhoons, create response differences that cannot be captured by a simple rainfall-runoff model. This problem can be addressed empirically, by extending the classical regionalization to include inter-event variations in model parameters. One formal approach to do this is the Generalized Estimating Equation (GEE) method. GEE was proposed by [15] as an extension of the Generalized Linear Model (GLM) to longitudinal data analysis using quasi-likelihood estimation. GEE is widely used in biomedical studies to analyze the repeated measurements from a subject or correlated observation from a cluster [16,17]; however, the GEE method has not previously been applied in the rainfall-runoff regionalization context.
The aim of this study is to develop a method for prediction of typhoon-induced flood hydrographs for ungauged catchments, using a case study of six typhoon flood events in 24 Geum River catchments, Korea. The relationship between typhoon properties and flood hydrograph properties is explored empirically, as well as the ability to regionalize a simple rainfall runoff model across the catchments by using conventional regression and the GEE method.

2. Case Study Data and Preliminary Data Analysis

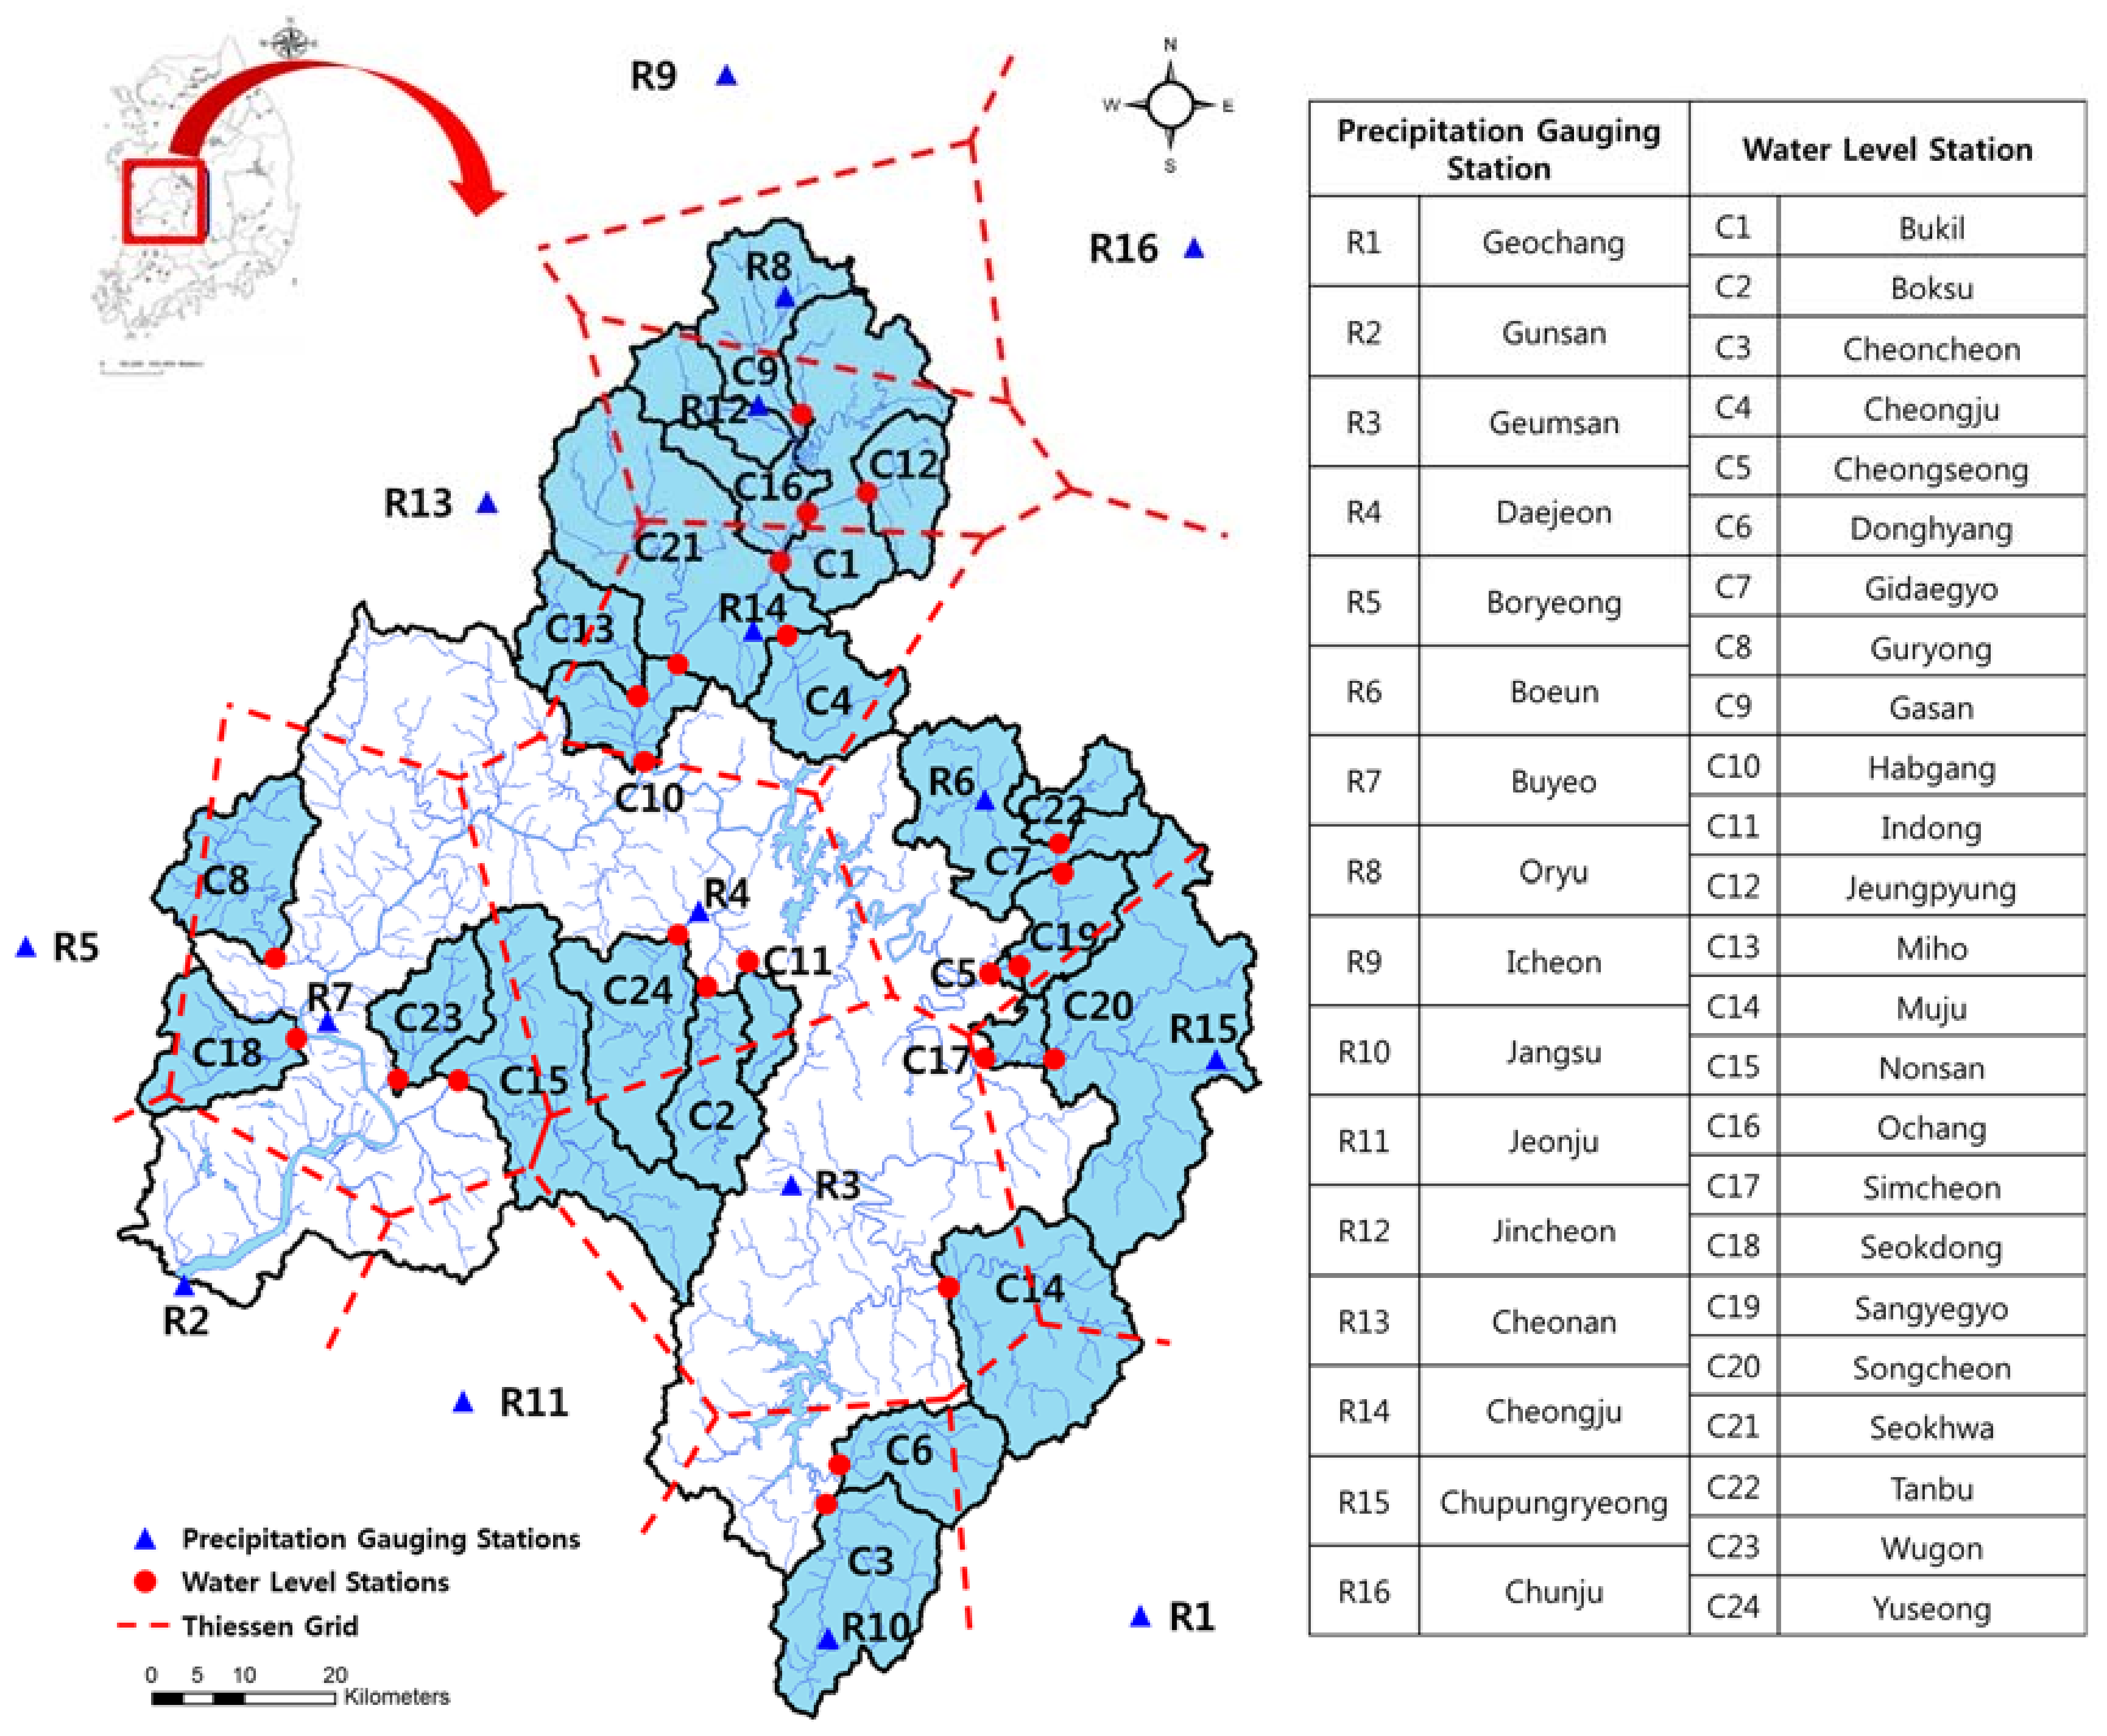
2.1. Geum River Region

The Geum River is one of the major rivers in Korea, draining the mid-western region of the Korean peninsula (Figure 1). Korea has a temperate climate with four distinct seasons, and the average annual temperature and rainfall in this region are 11.5 °C and 1285 mm, respectively [18]. The Geum River region experiences heavy rainfall in the summer from June through September including typhoons and tends to be cold and drier in the winter, although heavy snowfalls are common [19]. The region has a complex climate, influenced by both oceanic and continental climates.
The 24 gauged catchments used in the case study are shown in Figure 1. These catchments are relatively natural with the main land uses being agriculture and natural woodland. The catchments shown in white in Figure 1, although they include some water level stations, are not included in the analysis because their flood flows are heavily influenced by flood control effects of Daechung Multipurpose Dam and Geum River estuary barrier.
Catchment Characteristics (CCs) are the basic descriptors that support understanding of differences between catchments. In this study, eight CCs were selected from a previous study of hydrological similarity [14]. The values of the selected CCs are given in Table 1.
-
Area is size of the catchment, which affects flood volumes;
-
ALTBAR is the mean altitude of catchment above sea level;
-
DPS is the mean of the catchment slope, which affects surface runoff response times;
-
DD is the Drainage Density, a measure of the total length of all the rivers in a catchment area divided by the total area of the catchment, which affects how efficiently a catchment is drained;
-
FF is the Form Factor, the ratio of the catchment area to the squared value of the total catchment drainage length. It varies from zero (in a highly elongated area) to 1 (in a perfectly circular area), affecting runoff response times. DD and FF are calculated based on equations provided by National Water Resources Management Information System (WAMIS) in Korea;
-
Curve Number (CN) is an empirical parameter for predicting direct runoff, developed by the US Soil Conservation System, and affects the volume of runoff during a storm [20];
-
FARL is Flood Attenuation Factor by Reservoir and Lakes, estimated based on the reservoir data and the catchment terrain database in WAMIS, affecting flood attenuation [21];
-
SAAR is Standard Annual Average Rainfall in the period 1981 to 2010, which represents effects of long-term catchment wetness.
Hydrological data (rainfall, flow and climatic data) were obtained from the Water Resources Management Information System [22] and the Hydrological Investigation Report of Korea [19]. The rainfall data were provided by the Korea Meteorological Agency (KMA). As shown in Figure 1, 16 rain gauges operated by the KMA are used to produce catchment average rainfall on an hourly time-step with the Thiessen polygon method. The potential evapotranspiration data were estimated by using the metrological data of the nearest weather station to study catchment with the FAO Penman-Monteith method, developed by the Food and Agriculture Organization of the United Nations [21,23].

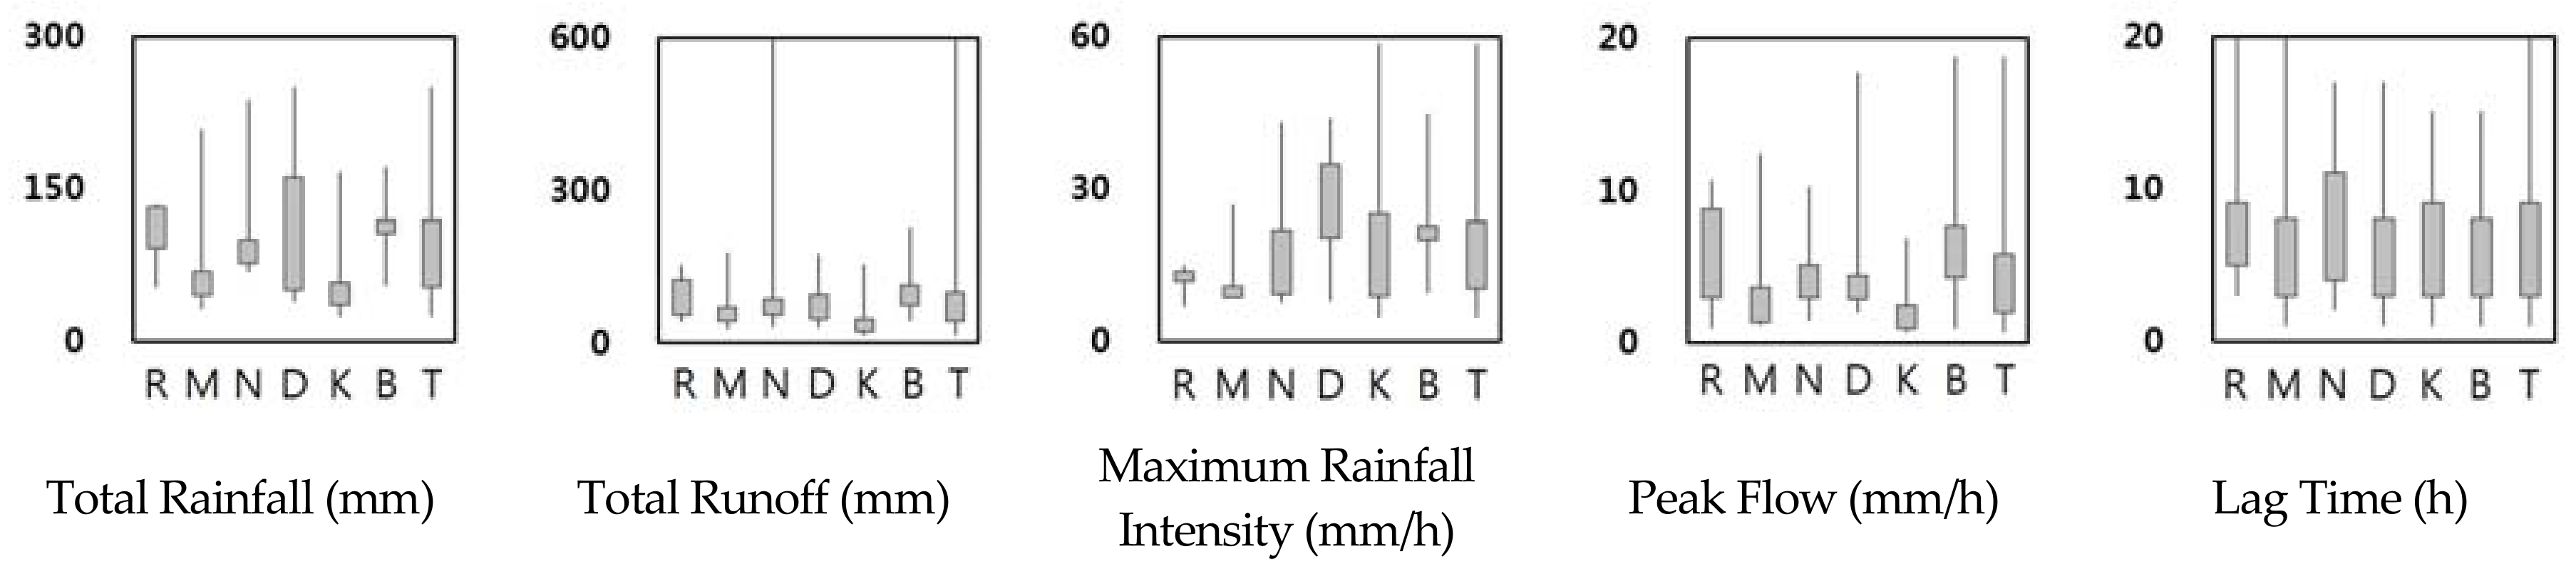
2.2. Typhoons in the Geum River Region

Typhoons in Korea have increased in strength after 2002 [24]. Table 2 lists the periods over which these six typhoons are analyzed in this paper.
Observed data from the six typhoons were prepared for the 24 Geum River catchments. Only three catchments have sufficient data for every typhoon—C1 (Bukil), C4 (Cheongju) and C11 (Indong)—however, all catchments have suitable data for two or more flood events, giving a total of 113 observed flood events and at least 8 events for each typhoon. Most of the events are from June to September, and most have single-peak flood hydrographs. The data quality is examined by looking at the runoff ratio (the total runoff divided by the total rainfall during an event, it should be less than one), the timing of peak rainfall and peak runoff (they should not be counter-intuitive), missing data and outliers.
The characteristics of each typhoon flood event are summarized as: total amounts of rainfall and runoff; maximum rainfall intensity; peak flow; lag time between rainfall and runoff peaks; rainfall duration; and antecedent rainfall over the 5 days preceding the event. Figure 2 shows box plots of the first 5 of these characteristics, showing the maxima and minima, and 25% and 75% quantiles. As shown in Figure 2, the flood characteristics vary widely within each typhoon (i.e., between catchments).
Table 3 shows selected data to further illustrate the nature of the hydrological responses. Table 3 shows that the rainfall duration ranges from 2 to 17 h, and total amount of rainfall ranges from 41 mm to 129 mm. Most of the events have maximum rainfall intensity greater than 10 mm/h. The flood events of Rusa, Mamie and Nari have runoff ratios (total flow/total rainfall) greater than 0.85. However, the runoff ratio for Kompasu is only 0.38, presumably related to the lower total rainfall of 40 mm in that typhoon. The wind rather than rainfall was the dominant source of damage in that typhoon event.
Figure 3 gives some further insight into the variations between flood events and to what degree these are explained by the total rainfall, maximum intensity and P5 (the total amount of rainfall in previous 5 days). This exhibits the expected trends that peak flow and total flow tend to increase with increased rainfall and peak intensity. However, runoff ratio and lag time have no significant linear relationship with the rainfall properties; and none of the flow indices are related to P5. The high runoff ratios and the apparent lack of sensitivity to P5 may be due to the generally wet antecedent conditions (e.g., average P5 for C4 = 62 mm). The wide variation of responses for any given set of rainfall and P5 values is likely to be associated with the variation in responses between catchments. The runoff ratios greater than 1 in Figure 3 may be due to rainfall or flow estimation errors and/or due to presence of baseflow. Understanding and modeling the variations in responses is the focus of the rest of this paper.

3. Method

The rainfall and flow data (both hourly) from six typhoon periods are prepared and model parameters (MPs) are calibrated for each. The MPs are regionalized by regressing the calibrated values against CCs. The conventional regression equations are developed using MP values that are averaged across the events, aiming solely to model the differences in response between catchments. The GEE regression model is developed using the MPs for each typhoon event, aiming to include the differences in responses between typhoons as well as between catchments. Descriptions of the PDM rainfall runoff model, the calibration and validation methods, and the regression and GEE methods are given below.

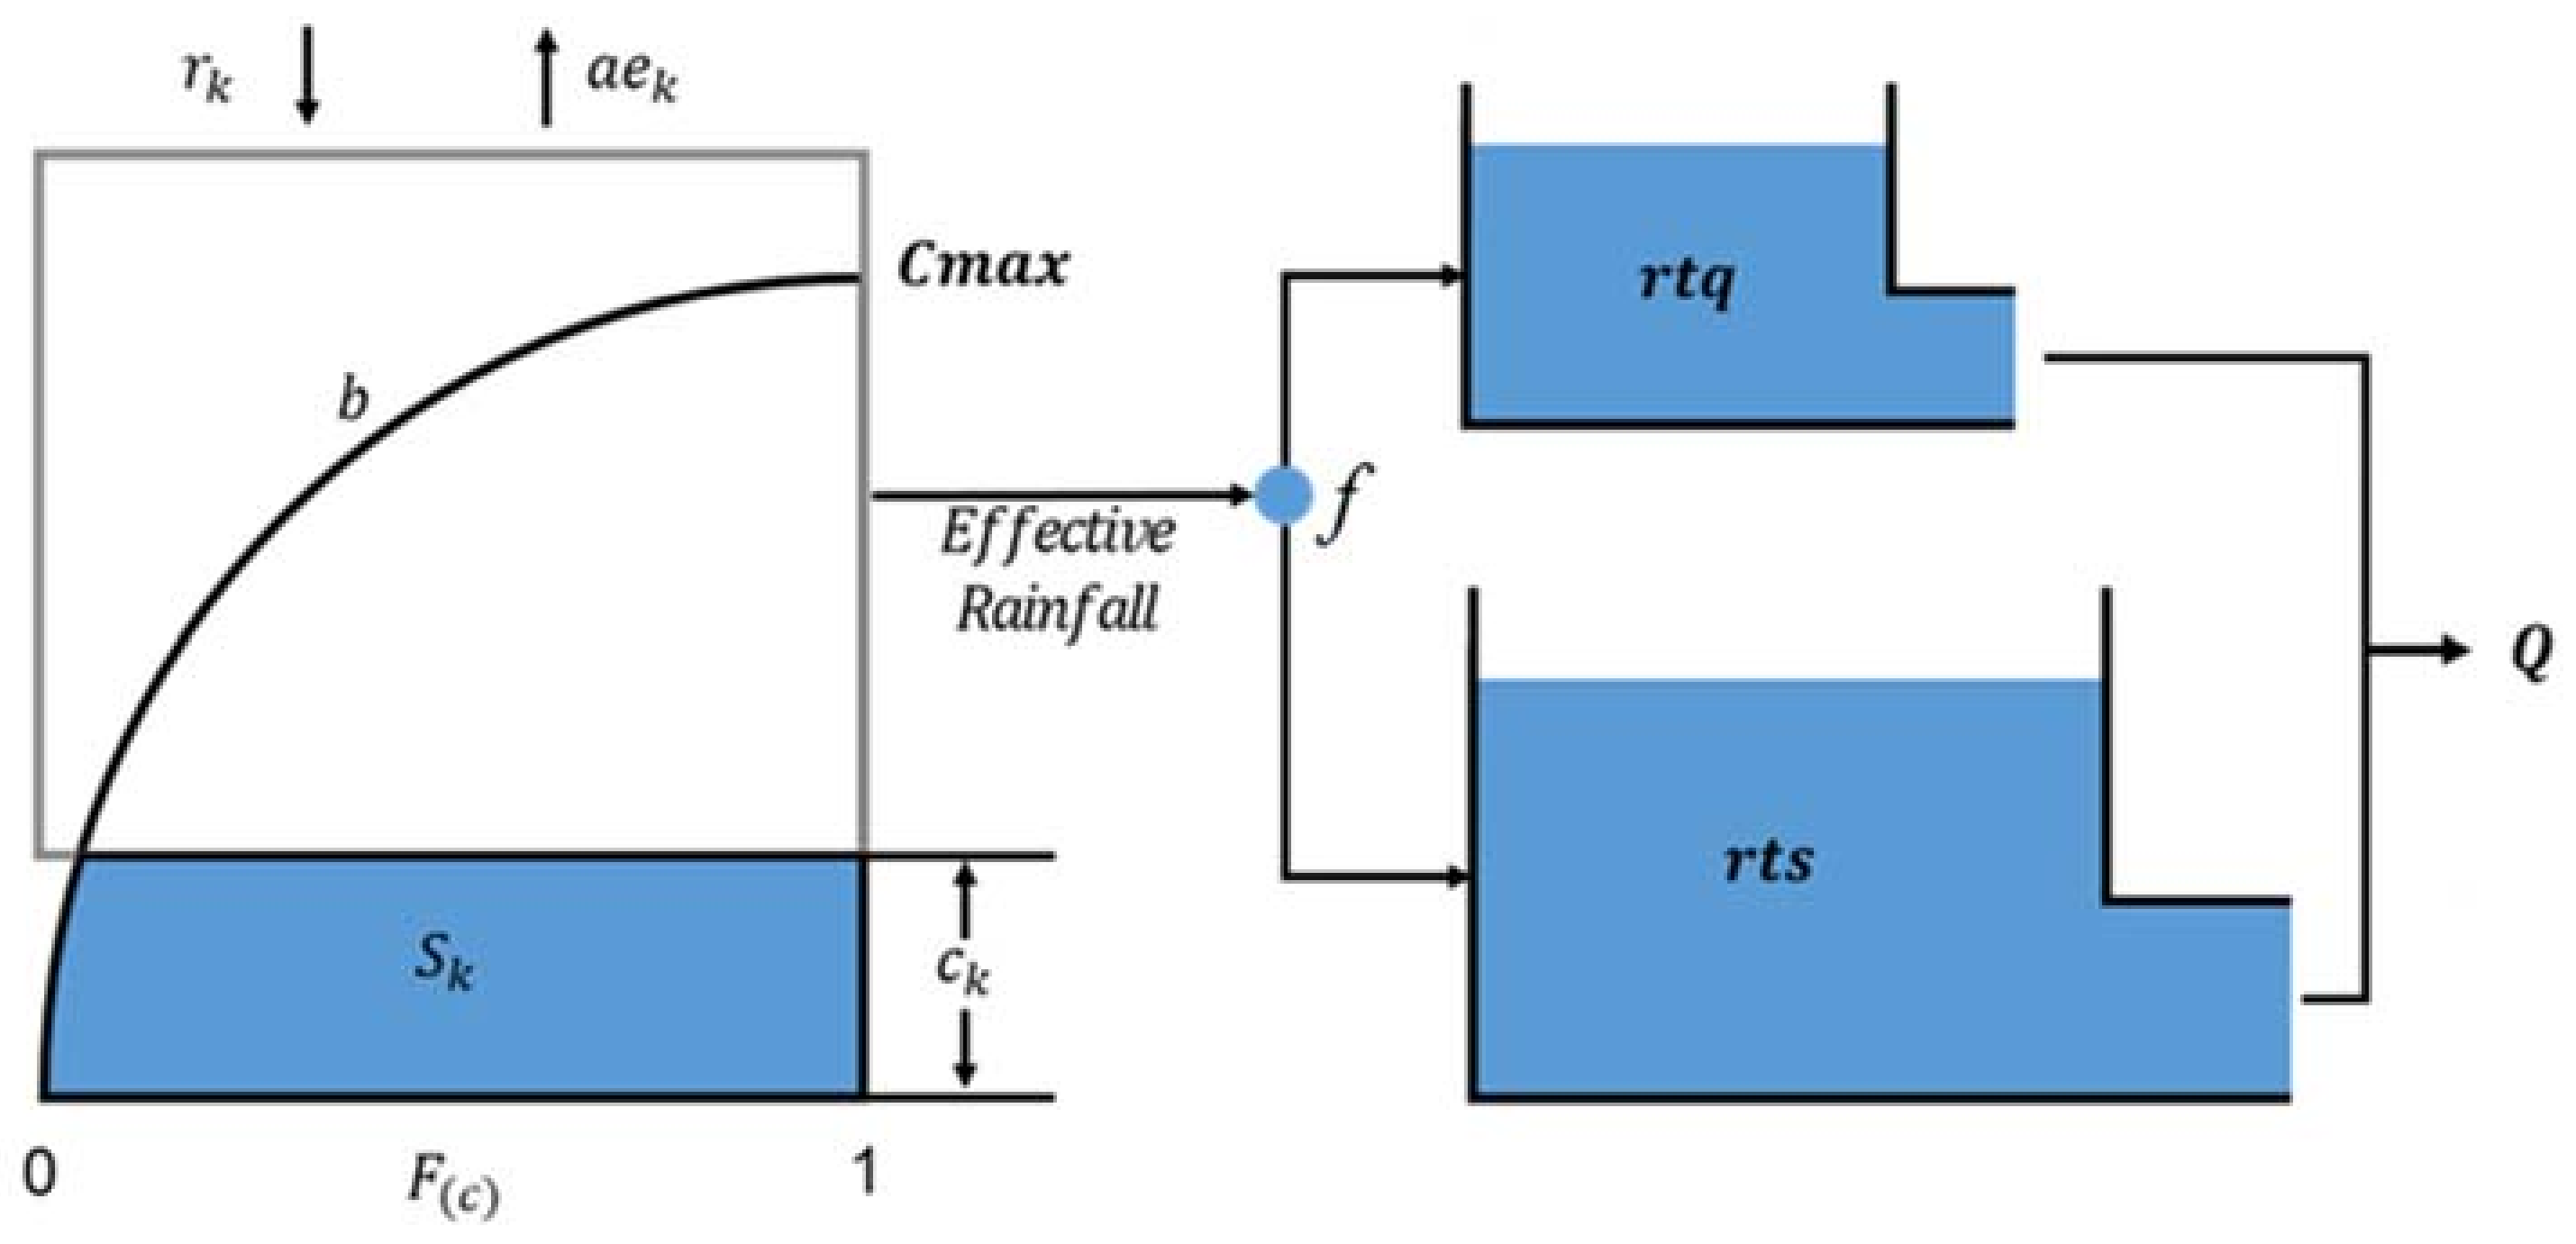
3.1. PDM Rainfall Runoff Model

The PDM (Probability Distributed Moisture) model is a lumped conceptual rainfall runoff model, which has been used as the main rainfall-runoff model in UK flood estimation procedures [25] and has been proposed as suitable for Korean flood estimation [26,27]. The version of the PDM developed by [25], illustrate schematically in Figure 4, is used here. The details of the PDM model structure are described in [28] and only a summary is provided here.
The PDM is composed of a soil moisture accounting model for estimating the effective rainfall and a routing model for converting effective rainfall into runoff at a define point in the river system. The soil moisture accounting model represents the spatial distribution of soil moisture storage as a Pareto distribution function as specified in Equation (1).
F ( c ) = 1 ( 1 C C m a x ) b ,   0 C C m a x
rk is the rainfall, aek is the actual evapotranspiration, Sk is the soil moisture storage, Q is the runoff, ck is the soil moisture storage capacity, Cmax is the maximum soil moisture storage capacity of the catchment, and b is a parameter that defines the strength of spatial variation of c. c is distributed uniformly between values of 0 and Cmax if b is equal to 1; and tends towards a single value, Cmax, as b tends towards 0.
The routing model consists of two parallel reservoirs that represent quick and slow responses of catchment runoff. The parameters of the PDM model are summarized in Table 4, along with the ranges of values assumed feasible prior to model calibration [29].

3.2. Calibration

For calibration of the MPs in Table 4, a Uniform Random Search was implemented using the Monte-Carlo Analysis Toolbox (MCAT) [28]. 10,000 MP sets were randomly sampled from the prior ranges in Table 4, and objective functions were calculated for each sample. This approach to calibration achieves calibration performances that are sufficient approximations to the optimal performances. The initial soil moisture condition of each case is adopted from the results of preliminary, daily continuous-time modelling [26]. The first 10% of the calibration period was used as a warm-up period during which the errors were neglected in calculation of the objective function in order to reduce sensitivity to initial conditions.
The calibration objective function is the Nash Sutcliffe Efficiency (NSE), which measures all-round model fit, although, is often observed to have a bias towards fitting high flows [25,30].
N S E = 1.0 i = 1 n ( O i S i ( θ ) ) 2 i = 1 n ( O i O ¯ ) 2
where ,   O i is observed flow at time i,   O ¯ is the mean of observed flows, S i ( θ ) is simulated flow at time time i with parameter set θ, 1 of NSE indicates a perfect match of the simulated and observed flow.

3.3. Statistical Regression

In this study, we use the following notations. y i j is defined as a calibrated MP value of the j-th flood event from the i-th catchment. x i = ( x i 1 , ,   x i p ) is the set of CCs for the i-th catchment and z i j = ( z i j 1 ,   , z i j q ) is the set of rainfall characteristics for the j-th flood event at the i-th catchment. For each i-th catchment, let y i · = j = 1 n i y i j / n i and z i · = ( z i · 1 ,   ,   z i · q ) = ( j = 1 n i z i j 1 n i ,     ,   j = 1 n i z i j q n i ) where n i denotes the number of flood events in the catchment.

3.3.1. Conventional Regression

In the conventional regression analysis, for each catchment, the PDM MPs are calibrated for each event and the values averaged over all events [9]. A linear least-squares regression equation is developed for each of the five averaged model MPs as follows:
E ( y i · ) = β 0 + β 1 x i 1 + + β p x i p + e i
E ( · ) is an expectation and e i represents all random errors in the estimation approach, including randomness between catchments and non-convergence of the optimization of the MPs during calibration. The significant CCs are identified using forward selection with a significance level (p value) of 0.05. That is, we added the CC with the smallest p-value from a wald test and stop adding CCs when no variable has a p-value less than 0.05.

3.3.2. Generalized Estimating Equations (GEEs)

Multiple flood events in a catchment can be considered as repeated measurements from a subject, which corresponds to a catchment in this study [20,31,32]. Therefore, using event-aggregated MPs in (3) leads to loss of information about variability of MPs between events and is likely to underestimate the standard error of the MP estimate for any event. One possible solution to this is to consider a subject-specific random effect in the model fitting using a generalized linear mixed model; however, this would involve specifying the error distribution of y i j . Instead, a GEE approach is adopted that avoids the need to fully account for the error distributions while still potentially achieving robust results [16]. For our flood event data, the following GEE model can be considered:
E ( y i j ) = β 0 + β 1 x i 1 + + β p x i p + β p + 1 z i j 1 + + β p + q z i j q
Note that, while a non-linear transformation of y is generally present in a GEE, here the identity link function is used. Equation (4) is separately estimated for each MP. Then, E ( y i j )   corresponds to the mean value of an MP for the j-th flood event from the i-th catchment.
The estimation of the parameters β requires the within–subject covariance, that is “Exchangeable” structure assuming that flood events over time have the same correlation, to be specified [33] and See Appendix A. The estimation is based on iteratively reweighted least squares with quasi-likelihood, incorporating the forward selection method and p < 0.05 as the significance criterion. All the statistical analysis was performed using Statistical Analysis Systems (SAS) version 9.4.

3.4. Validation

Leave-one-out cross validation is applied. One catchment is kept as a target catchment for validation, and the regression models are developed with the remaining 23 catchments. The simulated hydrographs are visualized and the NSE is evaluated to represent the applicability of the approach for ungauged catchment prediction.

4. Results

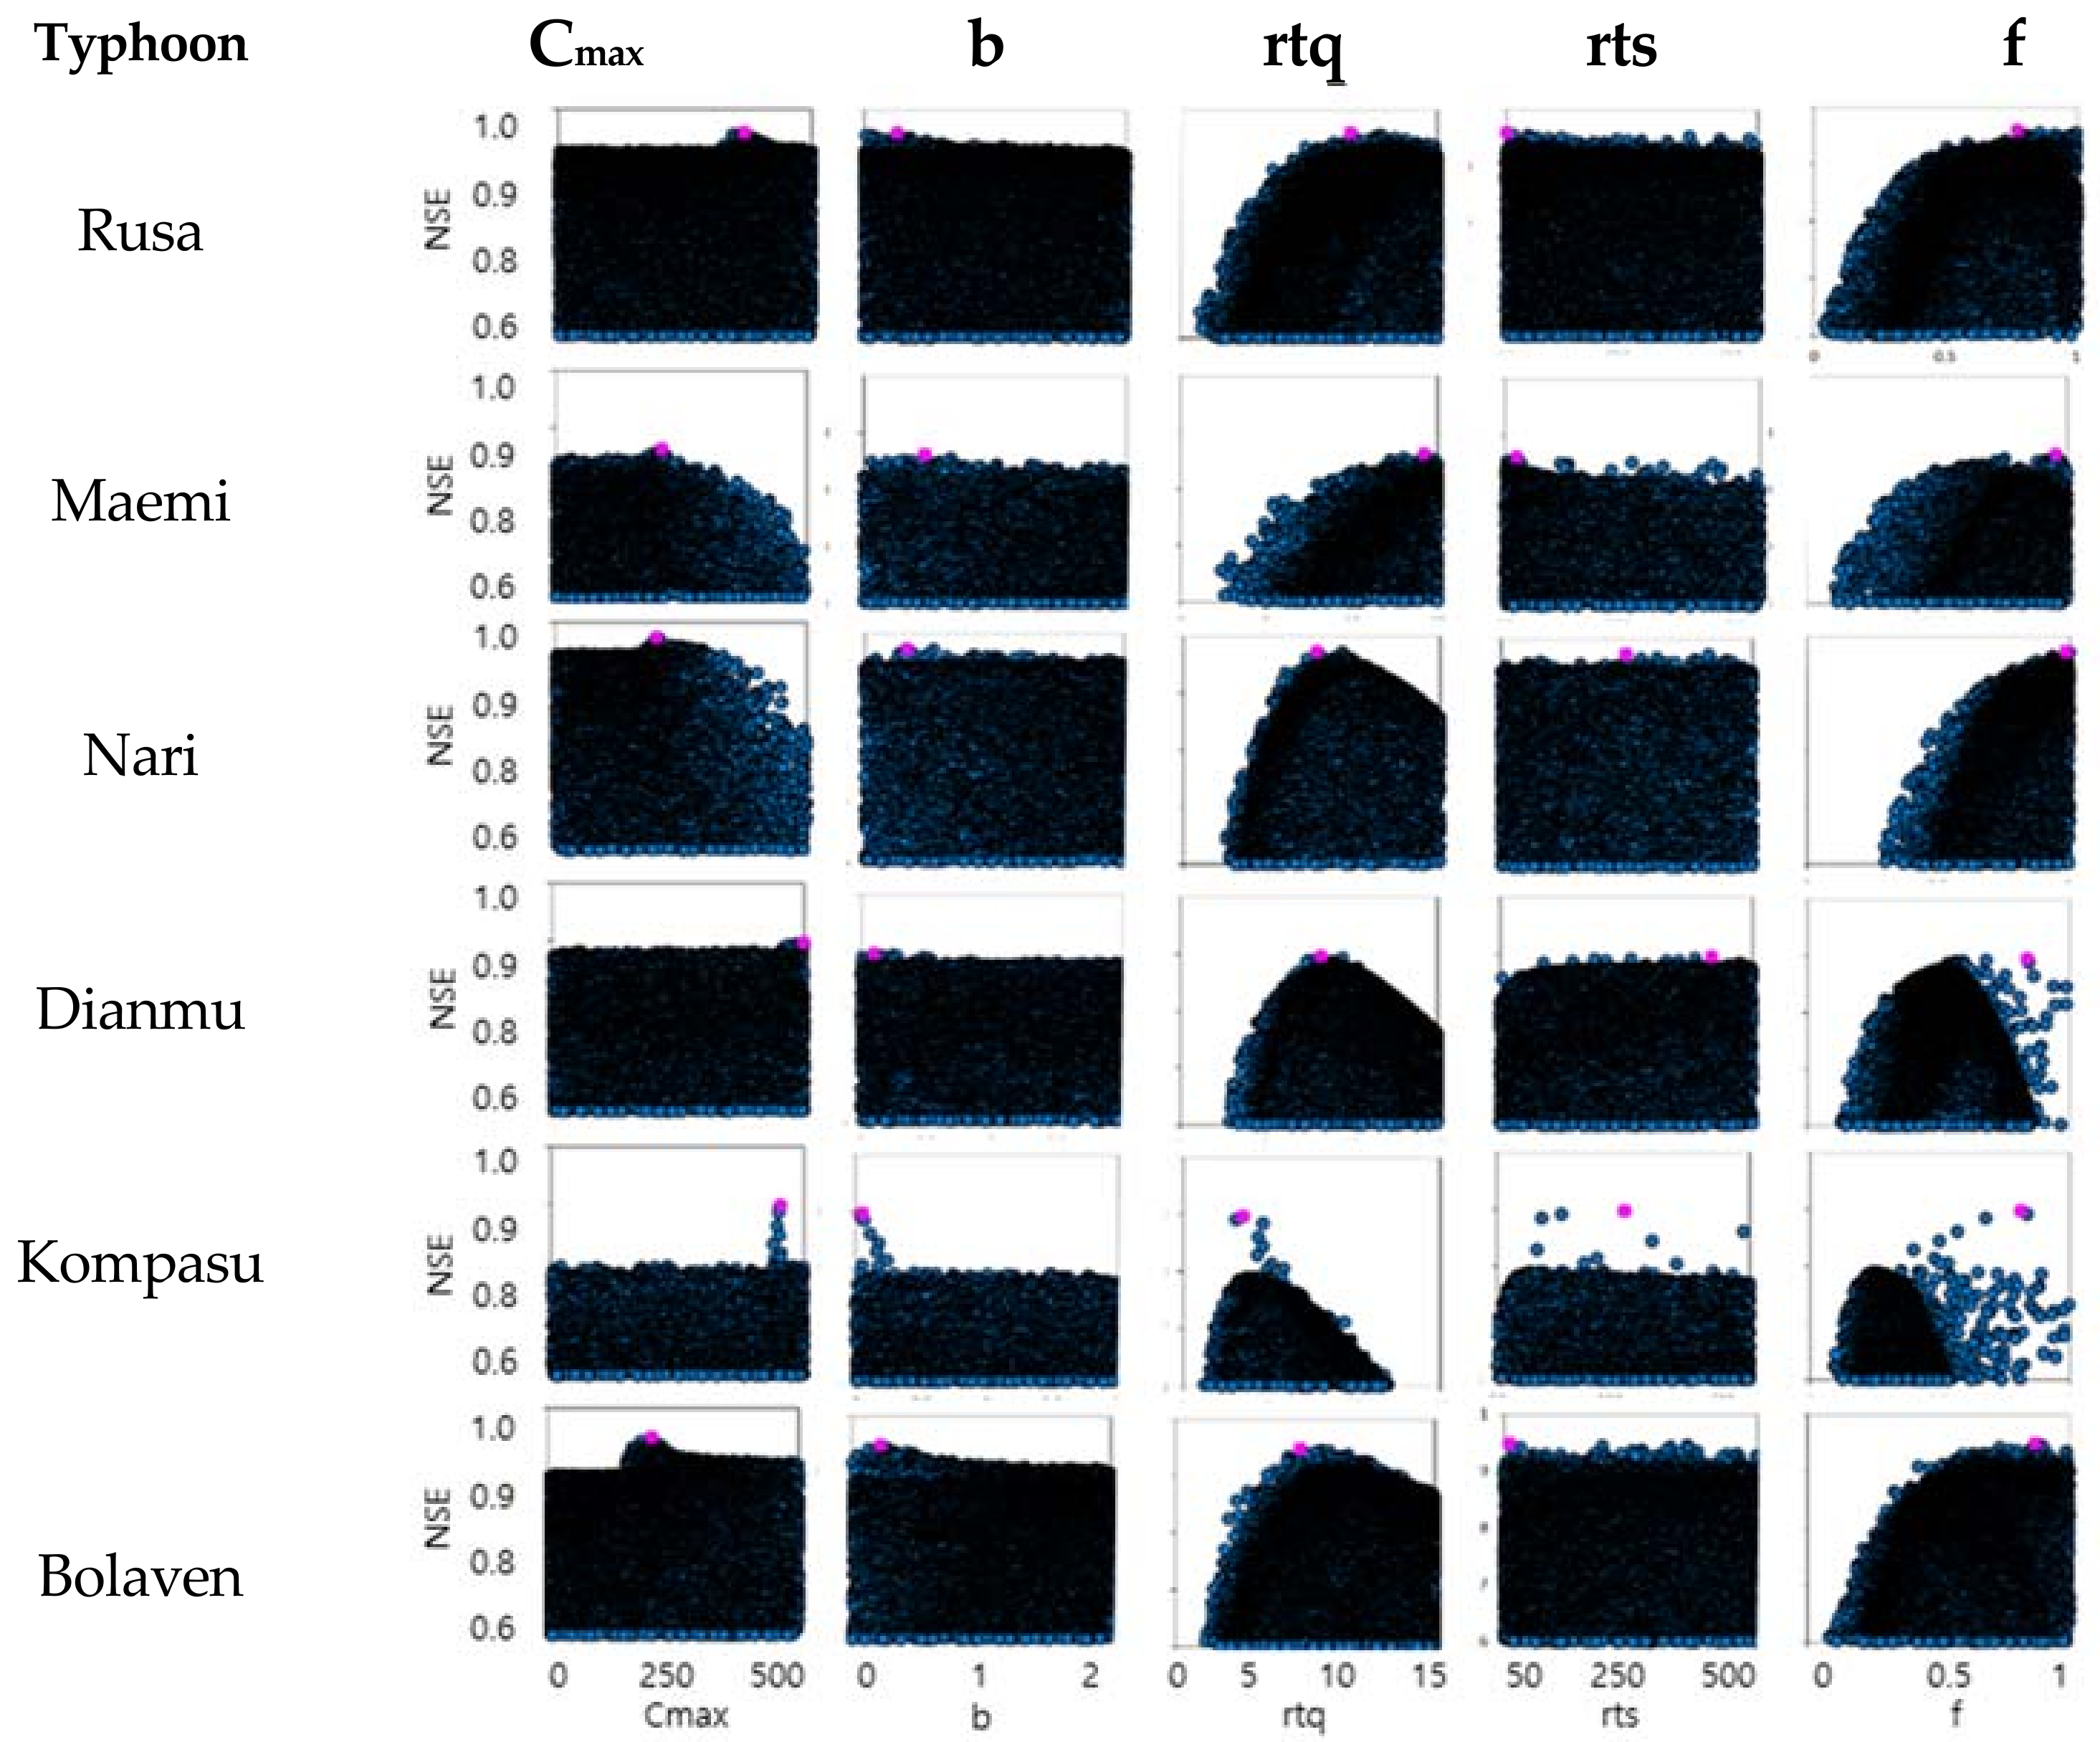
4.1. Calibration of the PDM Model

A separate PDM MP set was calibrated for all 113 events with sufficient observed data, in order to examine differences between them. The results for the 6 flood events at the C4 (Cheongju) catchment are presented here as an example. Figure 5 shows the scatter plots of MP value versus NSE obtained from the Uniform Random Search. Optimal values of rtq and f are relatively identifiable, whereas optimal values for rts are relatively non-identifiable, with c and b having intermediate identifiability. Figure 5 shows that, even for the more identifiable MPs, the optimum values are different across typhoons. A similar result is observed for the other gauges.
Table 5 shows the MP and NSE values for C4, and Figure 6 shows the corresponding modeled and observed hydrographs. Table 6 shows the NSE values representing calibration performance of the model applied to the 113 events.
In rainfall runoff modelling, the estimated MPs are generally assumed to be the same over all flood events; however, there are wide variations in optimum model parameters in Table 5 and Figure 5. This could be due to a data quality problem, a limitation of model structures or different hydrological responses to flood events. We suppose that these variations in MP values may be partly due to the changes in hydrological response between events, i.e., the MP value must change to allow the PDM model to capture that changed response. Thus, the flood characteristics of each typhoon event are included in the GEE.
There is a wide variation in results across flood events. For typhoon Kompasu period, the range of NSE values across 18 catchments is −13.5 to 0.9; and for typhoon Bolaven the range across 23 catchments is −0.02 to 0.96. 68 of the 113 events have NSE values greater than 0.5. C18 and C23 have consistently low calibration performances with none of the modelled events having NSE > 0.5. This may be because these catchments have comparatively large data errors or have controls on flow, such as out-of-bank flood storage, which the simple PDM model cannot represent. The calibration results for typhoon Dianmu and Kompasu are poor in 12 and 13 of the catchments. This result is due to the inability of the model to simulate the low runoff ratios observed in many of the catchments (e.g., Table 3). It is likely that in these cases the observed rainfall was overestimated. Only the MP sets giving calibration NSE values greater than 0.5 are used for the statistical regression.

4.2. Statistical Regression

Table 7 shows conventional regression equations based on the set of calibrated, event-averaged MPs (excluding C4, which will be used for validation of these equations). The R2 of these equations varies between 0.1 (Cmax) to 0.79 (f).
The regression equations in Table 7 are applied to catchment C4 as an example. The estimated MPs are shown in Table 8, and Figure 7 shows the predicted hydrographs. The hydrographs at Kompasu and Bolaven are not considered acceptable in terms of volumes and peaks, indicating that MP estimates are not applicable to all flood events. The result at Dianmu is better than the calibrated model in terms of peak flow, at the expense of volume performance.
Table 9 shows the developed GEEs. In the GEE model of parameter b, the total amount of rainfall (TR) in a typhoon event was selected as an explanatory variable. The b parameter represents the degree of spatial variability of storage capacity in the catchment, therefore a possible explanation for the model of b is as follows: As total rainfall increases, the effect of variability of the soil moisture storage capacity is expected to reduce and hence the value of b is expected to reduce. However, this effect should be implicit in the PDM model, and so the reason b is related to TR is more complex. For the other MPs, only CCs are selected. The R2 values in Table 9 are low compared to those in Table 7. This is expected because of the much lower variance of the MPs when they are averaged over the typhoons so that only 23 data points are used, as was done to obtain the results in Table 7, compared to the 107 data points used to obtain the results in Table 9 (107 points rather than 113 because the 6 points from C4 are kept back for model validation). In particular, the non-identifiable MPs would increase variance of the errors more if they are not averaged over events. The results in Table 9 may also be influenced by the covariance of the MP values between flood events in each catchment, whereby if the matrix R Equation (6) could be more accurately specified it may improve the GEE result.
In Figure 7, the GEE results (shown in solid lines) are generally better performance in the peak flow than the conventional linear regression results (shown in dotted lines) for typhoons Rusa, Maemi, Bolaven and Kompasu. For typhoon Kompasu, the GEE matches closely the peak of the hydrograph, although it has over-predicted the recession flows. For typhoon Nari, the hydrographs simulated using GEE are slightly worse than those simulated using the conventional regression model. However, overall, the GEE gave slightly better performances compared to the conventional regression model.
The results of cross validation are shown in Figure 8. The selected CCs for each MP are the same CCs shown in Table 7 and Table 9. The results for the conventional regression and GEEs are compared with the locally calibrated model results for each typhoon flood event. In Figure 8a,b, if the points are located on the 45-degree line, the performances using regionalization are the same as those of calibration; whereas if the points are located above the 45-degree line, the performances using regionalization are better than those using the calibrated model. The calibration results are better than both regionalization approaches. The results of the two regionalization methods are compared in Figure 8c). The performances using the two methods are similar. This indicates that there is no practical benefit adopting the more complex GEE method, although there may be scope for refining its specification, in particular the link function and correlation structure. Furthermore, in this study we did not incorporate error models in order to estimate confidence intervals on predictions, and these may be more successful using the GEE approach.

5. Conclusions

This study analyses six typhoon flood events (Rusa, Maemi, Nari, Dienmu, Kompasu and Bolaven) at 24 Geum River catchments and applies the Probability Distributed Moisture (PDM) rainfall-runoff model to predict river flows. Two alternative statistical models, conventional regression and Generalized Estimating Equations (GEEs), are used to regionalize the PDM model parameters, so that typhoon-induced flows can be simulated at ungauged locations within the same region. The main outcomes are:
-
The application of a calibrated PDM model to modelling flood event flows in Geum River catchments shows, overall, an acceptable model performance. This supports the use of the PDM model or comparable rainfall-runoff models for simulating extreme flood events in Korea.
-
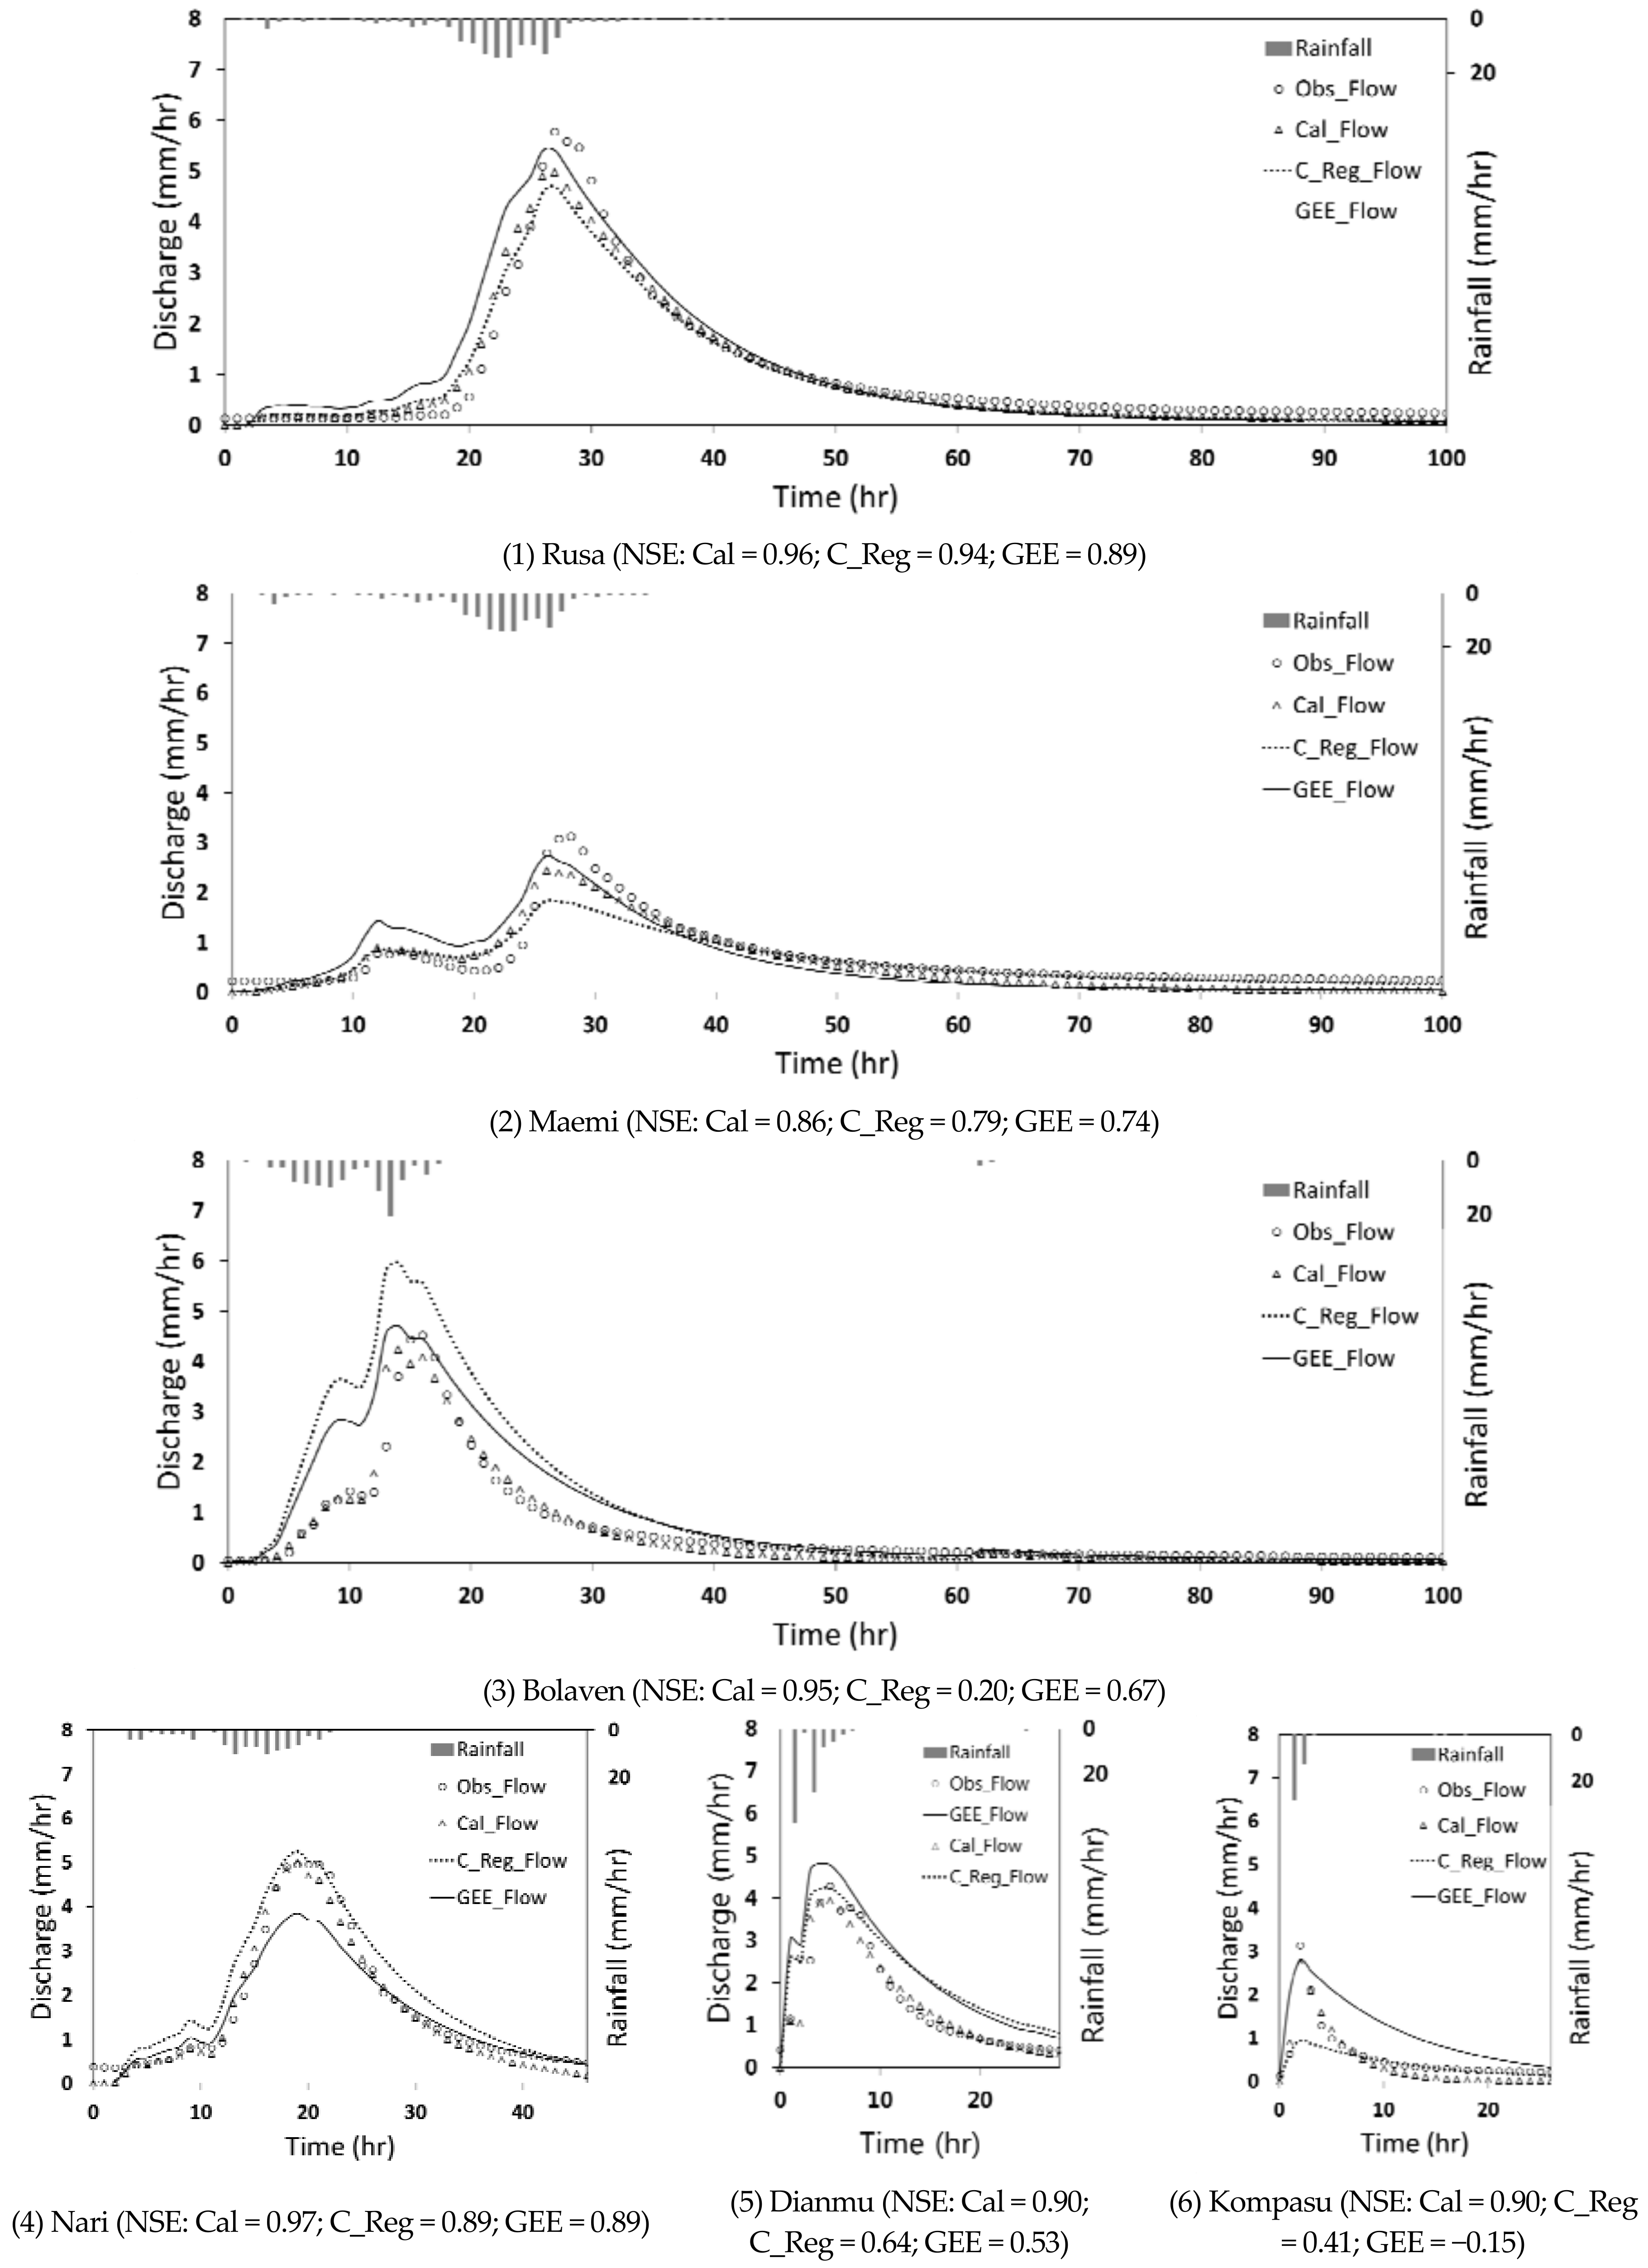
Using conventional regression equations to regionalize model parameters to ungauged catchments showed mixed success, for example when treating the C4 catchment as ungauged, there were good results for two flood events (typhoons Nari and Dianmu) and underestimated peaks for two events (typhoons Rusa and Kompasu).
-
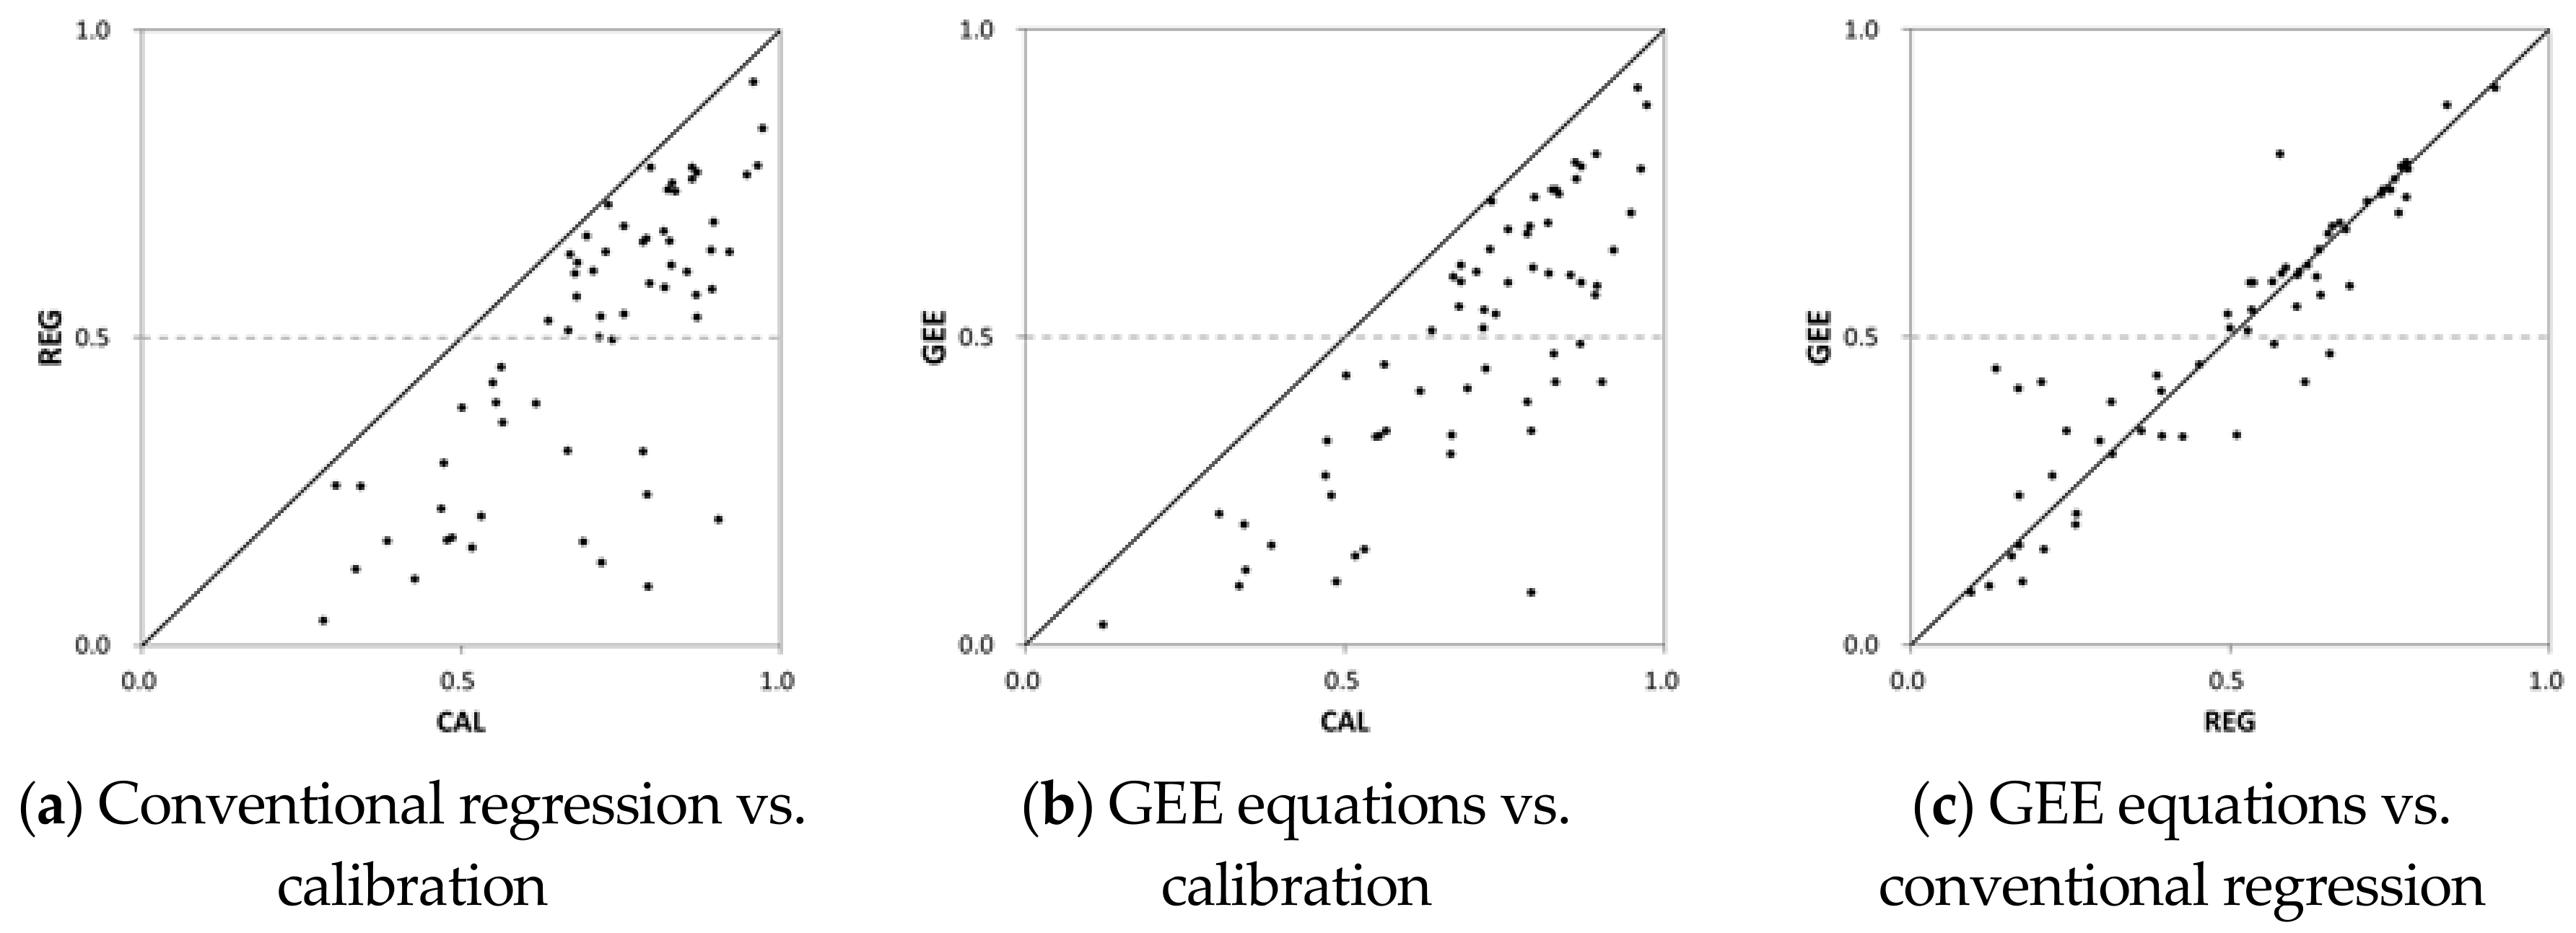
The GEE model extends the conventional regression by including the inter-event variability in PDM model parameters as well as the inter-catchment variability. However only the model parameter b was found to be related to event properties; and validation results showed only slight improvement on the simpler regression approach. While for practical applications we would therefore recommend the simpler regression approach, refinements to the GEE approach may be explored, in particular its potential advantage for estimating an error model and confidence limits on predictions.
Future research should also increase the number of extreme flood events and study catchments to increase the statistical significance of the analysis and increase confidence in the comparison between the two approaches.

Author Contributions

Ho.L. designed the study; N.M. and Hy.L. conducted the majority of the data analysis and wrote the majority of the paper; S.K. provided the data from the models. J.K. contributed to the statistical analysis and interpretation.

Acknowledgments

This research was supported by a grant (11-TI-C06) from Advanced Water Management Research Program funded by Ministry of Land, Infrastructure and Transport of Korean government and 2015 International Hydrological Program (IHP) funded by the Ministry of Land, Infrastructure and Transport. The statistical analysis was supported by the Statistical Analysis and Consulting Center in Chungbuk National University. Joungyoun Kim’s work was supported by the National Research Foundation of Korea (NRF) grant funded by the Korea government (MSIP) (No. 2017R1C1B5015192).

Conflicts of Interest

The authors declare no conflict of interest.

Appendix A. GEE for Regionalization of Rainfall Runoff Model

GEE is a semi-parametric method which uses moment assumptions, instead of assuming a certain distribution as in a Generalized Linear Mixed Model. Besides, GEE is instead of attempting to model the within-subject covariance structure, to treat it as a nuisance and simply model the mean response. Sandwich estimator [32,34,35] enables to be robust against to the mis-specified within-subject covariance structure. The estimation is based on iteratively reweighted least squares (IRLS) with quasi-likelihood. For our flood event data, the following GEE model can be considered:
g ( E ( y i j ) ) = β 0 + β 1 x i 1 + + β p x i p + β p + 1 z i j 1 + + β p + q z i j q
Note that g ( · ) represents a link function, which can be identity, logit and log functions depending on if response y i j is normally distributed, binary or a Poisson process. In this paper, we assume our predicted variables of interest (i.e., PDM MPs) are continuous, hence, we consider the identity link function only and Equation (A1) can be rewritten as:
E ( y i j ) = μ i j = β 0 + β 1 x i 1 + + β p x i p + β p + 1 z i j 1 + + β p + q z i j q
Based on the CCs and flood characteristics, the GEE model is
E ( y i j ) = μ i j = β 0 + β 1 A r e a i + β 2 A L T B A R i + β 3 F F i + β 4 D D i + β 5 S A A R i + β 6 F A R L i + β 7 C N i + β 8 D P S i + β 9 T R i j + β 10 M R I i j + β 11 P 5 i j
Equation (A3) is separately estimated for each PDM MP. Then, μ i j corresponds to the mean value of an MP for the j-th flood event from the i-th catchment.
In GEE, within–subject covariance has some structure and this is called “working covariance”. For estimation, we need to specify the correlation structure (denoted as R i ). For example, if there are three modeled flood events in the i-th catchment, we can consider R i as the following structure:
R i = ( 1 ρ 12 ρ 13 ρ 12 1 ρ 23 ρ 13 ρ 23 1 )
The matrix in (A4) is the most general case and is called “unspecified” or “unstructured”. In addition, there exist other structures such as (i) independent ( ρ i j = 0 for all i and j); (ii) Exchangeable ( ρ i j = ρ for all i and j) and (iii) AR (1) ( ρ i j = ρ | i j | ). In this paper, we use the “Exchangeable” structure assuming that flood events over time have the same correlation.

References

  1. Altman, J.; Doležal, J.; Cerný, T.; Song, J.S. Forest response to increasing typhoon activity on the Korean peninsula: Evidence from oak tree-rings. Glob. Chang. Biol. 2013, 19, 498–504. [Google Scholar] [CrossRef] [PubMed]
  2. National Disaster Safety Portal. Available online: http://safekorea.go.kr (accessed on 1 April 2018).
  3. Blöschl, G.; Sivapalan, M.; Wagener, T.; Viglione, A.; Savenije, H. Runoff Prediction in Ungauged Basins—Synthesis across Processes, Places and Scales; Cambridge University Press: Cambridge, UK, 2013. [Google Scholar]
  4. Vieux, B.E. Distributed Hydrologic Modeling Using GIS. In Distributed Hydrologic Modeling Using GIS. Water Science and Technology Library; Springer: Dordrecht, The Nederlands, 2001; Volume 38, pp. 1–17. [Google Scholar]
  5. Perrin, C.; Oudin, L.; Andreassian, V.; Rojas-Serna, C.; Michel, C.; Mathevet, T. Impact of limited streamflow data on the efficiency and the parameters of rainfall-runoff models. Hydrol. Sci. J. 2007, 52, 131–151. [Google Scholar] [CrossRef]
  6. Boughton, W.; Chiew, F. Estimating runoff in ungauged catchments from rainfall, PET and the AWBM model. Environ. Model. Softw. 2007, 22, 943–956. [Google Scholar] [CrossRef]
  7. Salinas, J.L.; Laaha, G.; Rogger, M.; Parajka, J.; Viglione, A.; Sivapalan, M.; Blöschl, G. Comparative assessment of predictions in ungauged basins—Part 2: Flood and low flow studies. Hydrol. Earth Syst. Sci. 2013, 15, 2421–2435. [Google Scholar]
  8. Choi, C.; Han, D.; Kim, J.; Jung, J.; Kim, D.; Kim, H. Mega flood simulation assuming successive extreme rainfall events. J. Wetlands Res. 2016, 18, 76–83. [Google Scholar] [CrossRef]
  9. Kim, K. A Study on Precipitation and Runoff Analysis of Gangneung Area of Korea by the Typhoon Lusa in 2002. Master’s Thesis, University of Seoul, Seoul, Korea, 2005. [Google Scholar]
  10. Kim, T.; Maeng, S.; Choi, H.; Kim, D.; Jang, I. Analysis of runoff characteristic using rainfall-runoff model. J. Saf. Crisis Manag. 2014, 10, 119–134. [Google Scholar]
  11. Oh, T.; Moon, Y.; Ahn, J. A Study on special quality of hourly precipitation of typhoon happened in Korea. J. Korea Water Resour. Assoc. 2007, 40, 709–722. [Google Scholar] [CrossRef]
  12. Oh, K. A Study on the Evaluation of the Extreme Rainfall Using Climatic Indices in Korea. Ph.D. Thesis, University Of Seoul, Seoul, Korea, 2009. [Google Scholar]
  13. Joo, J.; Kjeldsen, T.; Kim, H.J.; Lee, H. A comparison of two event-based flood models (ReFH-rainfall runoff model and HEC-HMS) at two Korean catchments, Bukil and Jeungpyeong. KSCE J. Civ. Eng. 2014, 18, 330–343. [Google Scholar] [CrossRef]
  14. Kjeldsen, T.R.; Kim, H.; Jang, C.H.; Lee, H. Evidence and implications of nonlinear flood response in a small mountainous watershed. J. Hydrol. Eng. 2016, 21, 04016024. [Google Scholar] [CrossRef]
  15. Liang, K.-Y.; Zeger, S.L. Longitudinal data analysis using generalized linear models. Biometrika 1986, 73, 13–22. [Google Scholar] [CrossRef]
  16. Potthoff, R.F.; Roy, S.N. A generalized multivariate analysis of variance model useful especially for growth curve problems. Biometrika 1964, 51, 313–326. [Google Scholar] [CrossRef]
  17. Wang, M. Generalized Estimating Equations in Longitudinal Data Analysis: A Review and Recent Developments. Adv. Stat. 2014, 2014, 11p. [Google Scholar] [CrossRef] [PubMed]
  18. Korea Meteorological Administration. Available online: http://www.kma.go.kr/info_open/public_data/guidepage.jsp (accessed on 1 June 2016).
  19. Ministry of Land, Transportation and Maritime Affairs. Statistical Yearbook of Ministry of Land, Transportation and Maritime Affairs 2012; MLTM: Sejong, Korea, 2012.
  20. Donner, A. Linear regression analysis with repeated measurements. J. Chronic Dis. 1984, 37, 441–448. [Google Scholar] [CrossRef]
  21. Rim, C. Comparison of evapotranspiration estimation approaches considering grass reference crop. J. Korean Water Resour. Assoc. 2008, 41, 212–228. [Google Scholar] [CrossRef]
  22. Water Resources Management Information System. Available online: www.wamis.go.kr (accessed on 1 June 2016).
  23. Chapter 4—Determination of ETo. Available online: www.fao.org/docrep/X0490E/x0490e08.htm (accessed on 1 June 2016).
  24. National Emergency Management Agency. Natural Disaster Year Book of 2010; NEMA: Seoul, South Korea, 2010. [Google Scholar]
  25. Moore, R.J. The PDM rainfall-runoff model. Hydrol. Earth Syst. Sci. 2007, 11, 483–499. [Google Scholar] [CrossRef]
  26. Chang, H.; Lee, H. Assessment of continuous simulations of rainfall runoff models based on soil moisture accounting models at Geum River catchments, Korea. J. Korean Soc. Hazard Mitig. 2015, 15, 231–242. [Google Scholar] [CrossRef]
  27. Choi, H.H.; Lee, H.S. Assessment of conceptual rainfall runoff models for regionalization at Miho catchment. Korean Soc. Hazard Mitig. 2012, 12, 193–203. [Google Scholar] [CrossRef]
  28. Korea Meteorological Administration. Available online: http://www.imperial.ac.uk/environmental-and-water-resource-engineering/research/software/ (accessed on 1 June 2016).
  29. Wagener, T.; Wheater, H.S. Parameter estimation and regionalization for continuous rainfall-runoff models including uncertainty. J. Hydrol. 2006, 320, 132–154. [Google Scholar] [CrossRef]
  30. Nash, J.E.; Sutcliffe, J.V. River flow forecasting through conceptual models part I—A discussion of principles. J. Hydrol. 1970, 10, 282–290. [Google Scholar] [CrossRef]
  31. Ugrinowitsch, C.; Fellingham, G.; Ricard, M. Limitations of ordinary least squares models in analyzing repeated measures data. Med. Sci. Sports Exerc. 2004, 36, 2144–2148. [Google Scholar] [CrossRef] [PubMed]
  32. Ware, J. Linear Models for the Analysis of Longitudinal Studies. J. Am. Stat. Assoc. 1985, 39, 95–101. [Google Scholar]
  33. White, H. A Heteroskedasticity—Consistent Covariance Matrix Estimator and a Direct Test for Heteroskedasticity. J. Econom. Soc. 1980, 48, 817–838. [Google Scholar] [CrossRef]
  34. Lee, H.; McIntyre, N.R.; Wheater, H.S.; Young, A.R. Selection of conceptual models for regionalisation of rainfall runoff relationships. J. Hydrol. 2005, 312, 125–147. [Google Scholar] [CrossRef]
  35. Hong, Y.; Adler, R.F. Estimation of global SCS curve numbers using satellite remote sensing and geospatial data. Int. J. Remote Sens. 2008, 29, 471–477. [Google Scholar] [CrossRef]
Figure 1. Study catchments; Geum River region, Korea.
Water 10 00647 g001
Figure 2. Box plot of the flood characteristics of the 113 flood events (Boxes are 25% and 75% quantiles, R = Rusa, M = Maemi, N = Nari, D = Dianmu, K = Kompasu, B = Bolaven, T = Total).
Water 10 00647 g002
Figure 3. Scatterplots of the flood characteristics of the 113 events.
Water 10 00647 g003
Figure 4. Schematic description of the PDM model [28].
Water 10 00647 g004
Figure 5. Scatter plots of calibration NSE against MP for each Typhoon flood events at C4.
Water 10 00647 g005
Figure 6. Observed and calibrated hydrographs for the six events at C4.
Water 10 00647 g006
Figure 7. Modelled and observed hydrographs at catchment C4.
Water 10 00647 g007
Figure 8. Comparison between the NSE values obtained using calibration, conventional regression and GEEs.
Water 10 00647 g008
Table 1. Catchment characteristics of the 24 catchments.
CatchmentsArea (km2)ALTBAR (m)FF ()DD ()SAAR (mm)FARL ()CN ()DPS (°)PG ()
BukilC1907.11510.32.112220.9267.49.74
BoksuC2162.52290.141274170.815.22
CheoncheonC3291.25550.33.310930.9665.414.61
CheongjuC4166.31590.22.411920.9871.79.72
CheongseongC54912700.13.111980.9565.612.92
DonghyangC6165.46470.21.712310.966016.23
GideagyoC7353.12840.33.111810.9765.412.91
GuryongC8208.21730.1312580.9972.312.32
GasangyoC9183.91410.31.711990.9568.86.32
HabgangC1018531360.22.412250.9569.18.46
IndongC1158.72170.13.41244164.614.72
JuengpyungC12124.11500.42.412060.9669.38.62
MihogyoC1315961370.32.411920.98639.72
MujuC14390.26150.11.511540.995918.94
NonsanC15467.71480.22.313180.9162.511.44
OchangC165641540.21.912210.91669.82
SimcheonC17664.33720.22.29680.986114.72
SeokdongC18162.4780.22.712710.9666.28.13
SangyegyoC19464.92720.23.111950.9665.612.92
SongcheonC20623.43850.22.29690.9760.614.82
SeokhwaC211594.11430.32.312230.9468.69.75
TanbugyoC2281.73630.22.510900.9354.2171
WoogonC23131.8450.32.812350.9868.951
YuseongC24251.11890.13.513150.9962.812.12
PG: Number of precipitation gauges used in the Thiessen polygon method for calculating catchment average rainfall.
Table 2. Selected six typhoons.
TyphoonPeriod
Rusa23 August 2002~6 September 2002
Maemi6 September 2003~19 September 2003
Nari13 September 2007~22 September 2007
Dianmu8 August 2010~17 August 2010
Kompasu29 August 2010~8 September 2010
Bolaven20 August 2012~3 September 2012
Table 3. Characteristics of the events at C4 (Cheongju).
TyphoonRusaMaemiNariDianmuKompasuBolaven
TR (Total Rainfall, (mm))12972929041107
TD (Total Discharge, (mm))1147079461666
MRI (Maximum Rainfall Intensity, (mm/h))141010422821
PF (Peak Flood, (mm/h))635435
RD (Rainfall Duration, (h))179117215
LT (Lag Time, (h))436413
PE (Potential Evapotranspiration, (mm))211253315
RR (Runoff Ratio to rainfall, ())0.880.980.850.520.380.62
P5 (mm/5 days)3143911534410
Table 4. Parameters of the PDM model.
MPsDescriptionRange (Units)
CmaxMaximum storage capacity of the catchment1~500 (mm)
bDegree of spatial variability of storage capacity in the catchment0~2 ()
rtqResidence time of the quick flow reservoir0~15 (h)
rtsResidence time of the slow flow reservoir50~500 (h)
fFraction of effective rainfall that enters the quick flow reservoir and 1-f of effective rainfall that enters the slow flow reservoir0~1 ()
Table 5. Calibrated model parameters for the six typhoon floods at C4.
TyphoonCmax
(mm)
b
()
rtq
(h)
rts
(h)
f
()
NSE
Rusa367.60.259.951.00.770.96
Maemi211.40.4714.269.90.960.86
Nari201.00.327.8273.10.990.97
Dianmu497.80.108.2427.30.840.90
Kompasu453.00.053.5276.00.810.90
Bolaven206.50.227.259.30.870.95
Averaged322.90.238.5192.80.870.80
Table 6. Calibration Results (NSE) for the six typhoon flood events for all 24 catchments
CatchmentRusaMaemiNariDianmuKompasuBolavenNo. > 0.5 NSENo. Events%
C10.870.790.790.480.770.835683
C20.92--0.530.760.723475
C3--0.760.890.900.9644100
C40.960.860.970.900.900.9566100
C5-0.240.27−0.43−0.440.871520
C6--0.750.690.80.8944100
C7--0.80.550.550.8344100
C80.730.420.740.350.28−0.022633
C9---0.730.740.8633100
C10--0.260.040.660.71333
C110.850.790.960.40.620.675683
C120.830.83-0.670.550.8455100
C13---0.12−13.50.51333
C14--0.430.680.340.31425
C150.56−0.640.28−0.920.280.712633
C160.760.250.640.68−0.32-3560
C17--0.490.770.240.792450
C18--−1.5−0.560.490.39040
C19--0.57−0.14−0.600.712450
C20-0.820.730.830.470.473475
C210.790.720.430.67−1.120.683650
C22--0.9−0.37−0.140.031425
C230.12−0.320.34−0.230.440.47060
C240.72-0.820.520.730.8755100
Max0.920.860.970.890.90.96Missing values in observed data
Min0.12−0.64−1.5−0.92−13.5−0.02
No. > 0.5 NSE10612131217
No. Cat.111120242423
%915560545074
Table 7. The conventional regression equations for PDM model parameters when using C4 as the validation catchment.
Model ParameterRegression EquationR2p-Value
Cmax248.3 − 0.04 Area0.100.16
b2.35 − 0.0238 CN0.100.17
rtq32.05 + 0.003 Area − 0.01 ALTBAR − 0.3 CN0.520.00
rts−728.56 − 0.06 Area − 77.16 DD + 1211.31 FARL0.550.00
f−0.6 − 0.0002 Area − 0.12 DD + 1.84 FARL0.790.00
Table 8. Estimated PDM model parameters for catchment C4 using conventional regression.
Model ParameterCmaxbrtqrtsf
Value2420.649.862640.88
Table 9. The GEEs for PDM model parameters when using C4 as the validation catchment.
Model ParameterGEER2
Cmax232.33 − 0.03 Area0.01
b1.29 − 0.004 TR0.11
rtq22.75 + 0.003 Area − 0.007 ALTBAR − 0.15 CN0.24
rts678.12 − 0.09 Area − 50.46DD − 0.26 SAAR0.13
f1.70 − 0.0002 Area − 0.06 DD − 0.0006 SAAR0.08

