Removal of Pb2+ from Water by Synthesized Tannin Resins from Invasive South African Trees


1
Institute of Chemical and Biotechnology, Vaal University of Technology, Southern Gauteng Science and Technology Park, Private Bag X021, Vanderbijlpark 1911, South Africa
2
Department of Biochemistry, Bingham University, Karu P.M.B 005, Nigeria
*
Author to whom correspondence should be addressed.
Water 2018, 10(5), 648; https://doi.org/10.3390/w10050648
Submission received: 18 March 2018
/
Revised: 19 April 2018
/
Accepted: 20 April 2018
/
Published: 17 May 2018
(This article belongs to the Section Water Quality and Contamination)
Abstract
:Contamination of water by and the threat of invasive vegetation affects the quality and quantity of water accessible to all life forms and has become a primary concern to South Africa and the world at large. This paper synthesized, characterized, and evaluated the resins from tannin-rich invasive Acacia species as an environmentally benign adsorbent. The analysis of the pore volume and surface area of the resins reveals a small pore dimension of 9 10−3 cc/g and large surface area (2.31–8.65 m2/g), presenting suitable physical parameters for adsorption of . Langmuir model offers the best correlation data at pH 6 with maximum monolayer coverage capacity of 189.30, 105.70 and 98.82 mg/g for silver, black and green wattle tannin resins in aqueous solutions, respectively. The kinetic data suitably fits into a pseudo-second-order model, with the Dubinin–Radushkevich adsorption energy (E) 7.07 KJ/mol and intra-particle diffusion model confirming an associated physisorption process within the bio-sorption system. The thermogravimetric analysis (TGA) and Fourier-transform infrared (FT-IR) data of the resins were informative of the high thermal stability and chelating functionality such as -OH and -NH2 responsible for the removal of . All the resins showed good adsorption characteristics while silver wattle tannin resin has the best adsorption capacity compared to black and green wattle tannin resins. This study provides a prototype adsorbent from invasive plants for the removal of in water.
1. Introduction
The quality of water can be affected by several anthropogenic activities [1]. In South Africa, is the primary source of water pollution resulting from mining, textile, battery, leather, and electro coatings industries. contamination is considered a priority pollutant because it is highly toxic to humans and aquatic organisms even at low concentrations [2]. It is also able to bio-accumulate and bio-persist in the environment [3]. In South Africa, the availability of water is a significant concern due to changing rainfall patterns. South Africa is now considered to be a water-scarce country [4]. Improving water conservation, water quality and water-use efficiency is a key national priority [5]. The availability of water is threatened by the encroachment of a considerable number of non-native species. This is because of the high biomass and evapotranspiration rates associated with invasive alien plants that arise because of their greater height, root depth and senescence, compared to the native species that they replace [6], consequently causing a decrease in both surface runoff water and groundwater recharge [7]. For example, tannin-rich Acacia species have been classified as a noxious “category 2 invasive weed”, because of its impacts on the surface and groundwater reserves [8,9]. Hence, a prevention strategy has been considered and established, which includes regular survey, management, and prevention of alien vegetation. However, there may be a use for some alien tree species such as Acacia that are rich in tannins.
Adsorption studies have shown that materials such as activated carbon, phosphate and natural phosphate have been applied for the removal of heavy metals from wastewater on a commercial scale, but these adsorbents have been certified to have limited application for the removal of , asbestos, cysts, and coliform [10,11,12], hence the non-application of these adsorbents as a primary filter in water treatment. Recent studies have shown that heavy metals can be removed from water and wastewater by efficient, low-cost remediation plant materials and natural tannin adsorbent [13,14,15]. Zhao et al. [16] and Binaeian et al. [17] reported that fabricated tannin-based dithiocarbamate and hexagonal mesoporous silicate biosorbents are efficient in the removal of and anionic dye from aqueous solutions, respectively. Other studies have supported the influence of tannin-rich plants on the biological availability of metal ions by chelation [18,19], but the high solubility of tannin in aqueous solution has limited its direct application as a biosorbent, although several methods such as impregnation of tannin on chitin [20], binding of tannin to aminohexyl cellulose and collagen-fiber [21,22] have been reported for the immobilization of tannin in aqueous solutions with suitable adsorption capacity for toxic metals.
This work focuses on the preparation of a green, cost-effective and environmentally benign immobilized tannin resin adsorbent with enhanced functionality and thermal stability for the remediation of water contaminated by . The choice of the Acacia species in this study was based on our findings [23], which indicate that the stem barks of this species can hyper-accumulate heavy metals due to the significantly large tannin content.
2. Experimental
2.1. Collection, Authentication and Pre-Extraction Treatment
Stem bark of Acacia mearnsii (Black wattle), A. decurrens (Green wattle) and A. dealbata (Silver wattle) were collected in summer from Ratanda (26.5535° S, 28.3199° E), Hindenburg, South Africa. Voucher specimen number: 17,062, 17,063 and 17,065 were deposited for A. mearnsii, A. decurrens, and A. dealbata, respectively, at the National Biodiversity Institute, Pretoria, South Africa. The stem bark was air dried at ambient temperature for three months.
2.2. Sequential Extraction of Tannin
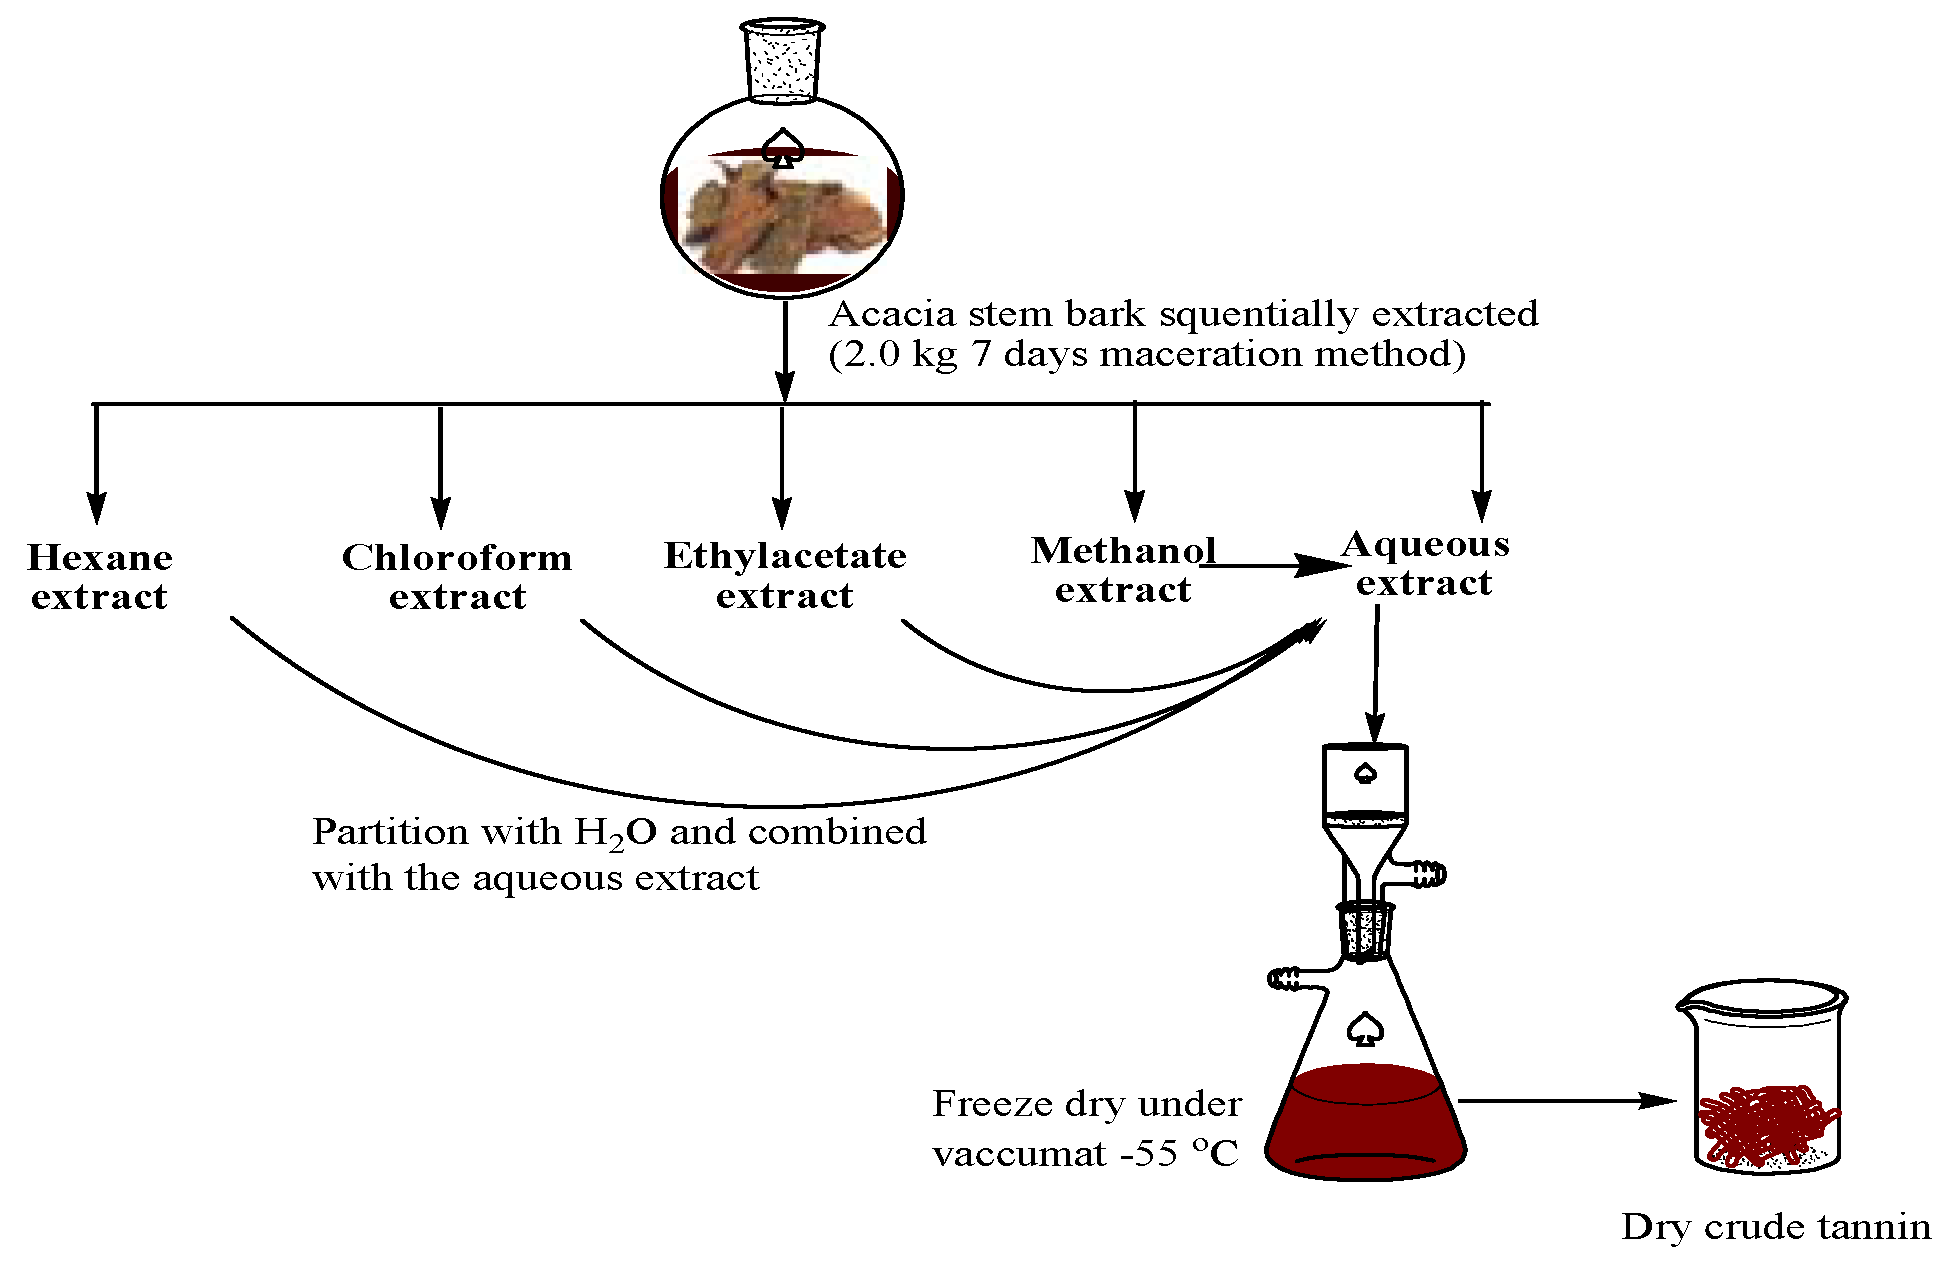
The dried stem bark of each of the three Acacia species were pulverized using an S4 hammer mill (Drotsky, South Africa) and sequentially macerated with hexane, chloroform, ethyl acetate, methanol, and water at room temperature for a week. The water-soluble fractions of hexane, chloroform and ethyl acetate were combined with the aqueous extract and then freeze-dried at 218 K under vacuum (Figure 1). The solid tannins were finally stored in a desiccator containing anhydrous sodium sulfate.
2.3. Estimation of Tannin in the Aqueous Fraction
The presence of tannin was confirmed by adding 3 drops of 0.1% FeCl3 to 1 mL of the aqueous fraction [24]. The Folin-Ciocalteu method was used to quantify the total tannin content [25], by preparing a 100 mg/mL stock solution of tannic acid and making serial dilutions. The amount of tannin in 0.5 mL aliquot of the water fraction was estimated by measuring the absorbance at 700 nm for both standard and test samples on a Cary 60 UV-Vis Spectrophotometer (Agilent, Santa Clara, CA, USA). The tannin content was expressed in mg/g of extract.
2.4. Synthesis of Tannin-Resin
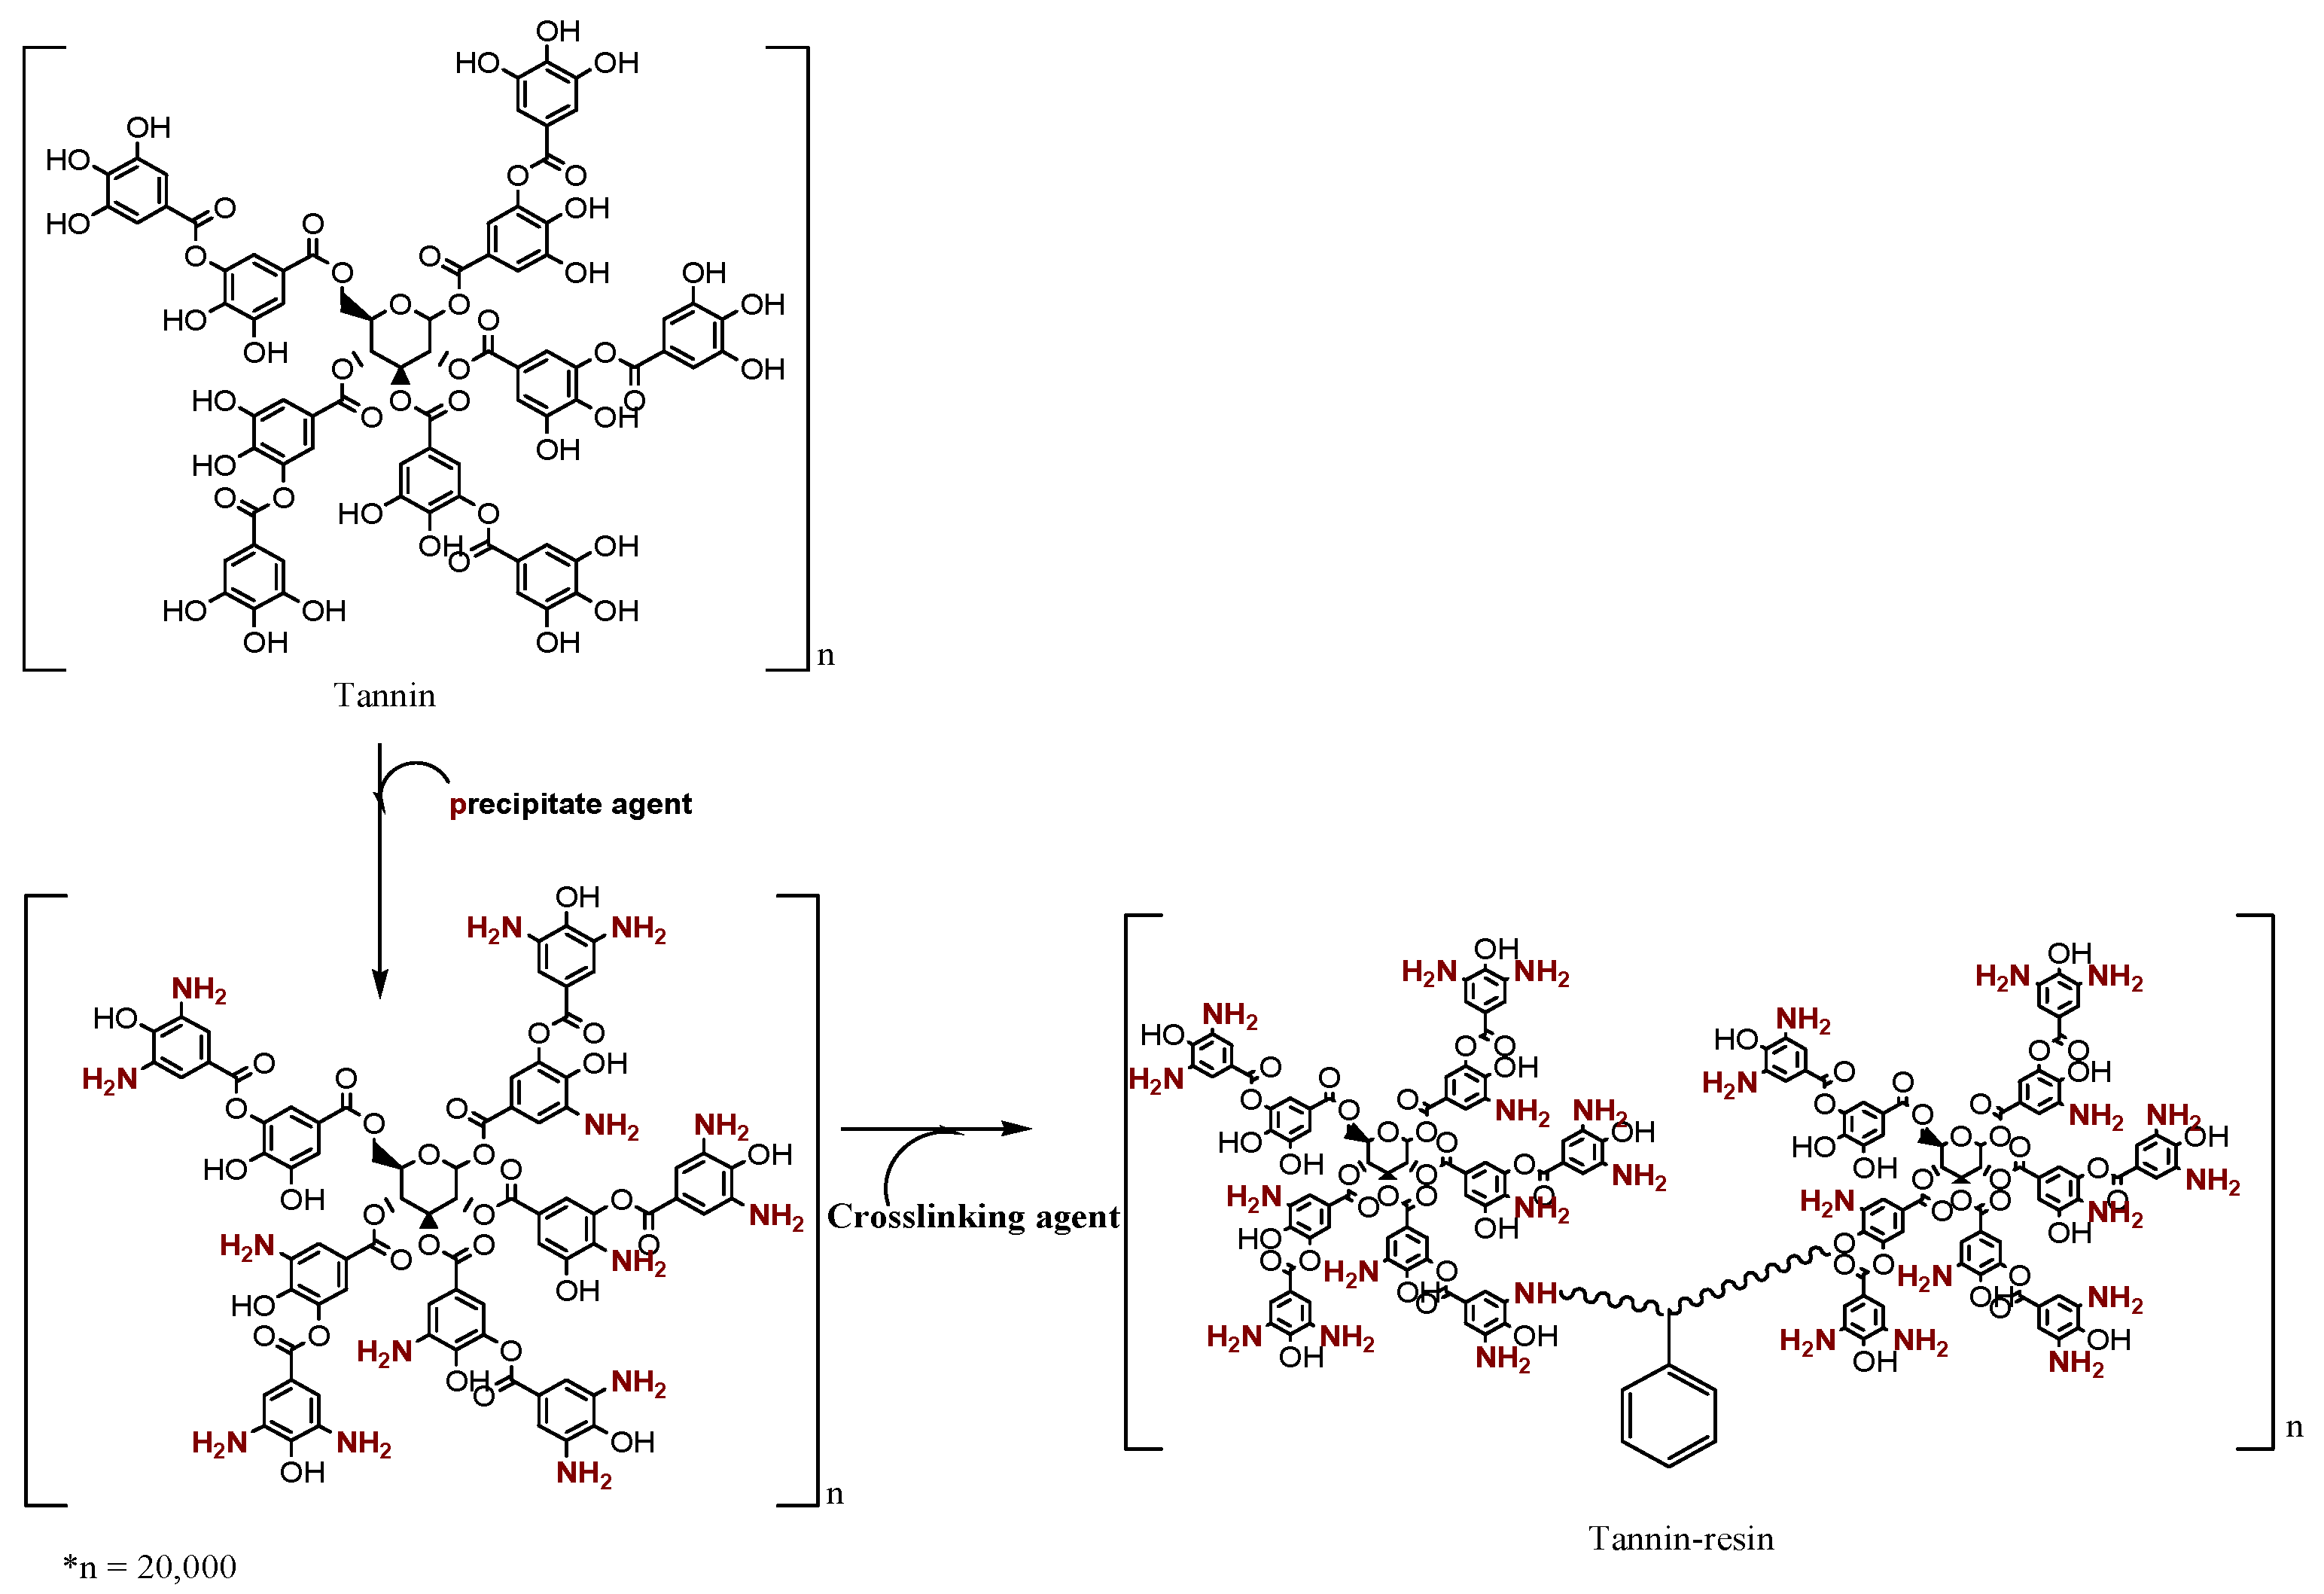
About 25 g of dry extracted tannin powder was dissolved in ammonia solution (13.3 N, 156.25 mL) at room temperature, and cross-linked with benzaldehyde (37 wt %, 201.13 mL). The mixture was stirred at room temperature for 5 min, filtered through filter paper (No. 2) and the residue collected as a dark material (Figure 2).
To the dark material, 150 mL of deionized water was added, heated at 343 K for 3 h, filtered using a vacuum pump, and 100 mL of 0.1 mol/dm3 nitric acid was added to the residue while stirring for 30 min. Finally, the water-insoluble material was allowed to cure at 353 K [26], dried, pulverized and sieved to obtain molecular size fraction of +100 µm using the American Society for Testing and Materials (ASTM) standard sieve.
2.5. Characterisation of Tannins and Resins
The thermal properties were monitored on a thermogravimetric analyzer (Perkin Elmer, Waltham, MA, USA) operated at a temperature range of 303–1173 K at a heating rate of 283 K/min under a nitrogen atmosphere. The functional group composition of the resins was determined on FT-IR (PerkinElmer Spectrum 400, Waltham, MA, USA) scanned between 4000 and 500 cm−1. The resin topography recorded by an X-Ray diffractometer (ZEISS Sigma 300, Oberkochen, Germany), while the surface morphology was scanned with an emission electron microscope (JSM-7500F, Waltham, MA, USA). The pore volume and surface area were estimated using a Brunauer–Emmett–Teller analyzer (Nova 3200e, Boynton Beach, FL, USA).
2.6. Batch Adsorption Study
The sorption isotherms and kinetics were studied using batch adsorption method. A 1000 ppm stock solution of was prepared by dissolving 1.6 g of Pb(NO3)2 in 1000 mL of deionized water. The effect of pH on the adsorption pattern of the resins was investigated by adding about 0.05 g resin into 100 ppm Pb(NO3)2 solution in a 100 mL volumetric flask. A solution of 0.1 mol/L HNO3 and NaOH was added in drop for pH adjustment. The temperature of the solution was adjusted at an interval of 10 K between (283–360 K) to evaluate the effect of temperature on the adsorption behaviour of the resins. After centrifuging with an OHAUS centrifuge (Frontier 5816R, Greifensee, Switzerland), the concentration was analysed using an inductively coupled plasma spectrometer (ICP-OES PerkinElmer, Billerica, MA, USA). The adsorption capacity qt (mg/g) of the resins was computed as shown in Equation (1):
where V: volume of sorbent (L), m: the mass of resin (g), Ci and Ct are Pb2+ concentrations (mg/L) at the initial and time, respectively.
Batch equilibrium tests were also conducted to determine the adsorption of onto the resins at equilibrium. The equilibrium concentration was determined using the following formula Equation (2):
where is the quantity of adsorbed at equilibrium (mg/g), and (mg/L) is the equilibrium concentration of . All analysis was conducted in triplicate and values are expressed as mean ± SD.
2.7. Kinetic Models
To determine the absorption kinetics, 100 mL of aqueous solution containing 100 ppm of was taken in each of eighteen conical flasks. 0.05 g of resin was added in each flask. The conical flasks were shaken on wrist shaker (Burrell Scientific, Pittsburgh, PA, USA) for different time intervals at 303 K. The samples thus obtained were centrifuged at 3000 rpm for 15 min, filtered and analyzed using ICP-OES to get the residual concentration of in aqueous solution. All analysis was conducted in triplicate and values are expressed as mean ± SD.
2.7.1. Pseudo-First-Order Kinetic Equation
The pseudo-first-order kinetic Equation (3), describes the adsorption of a from the aqueous solution [27]:
where qt is the amounts of adsorbed (mmol/g) at time t, qe,1 is the amounts of adsorbed at equilibrium (mmol/g), and is the rate constant of pseudo-first-order adsorption process (min−1). The linear form of Equation (3) is obtained after integration and application of the boundary conditions, and a plot of versus t was used to compute the equilibrium adsorption capacity (), and adsorption rate constant ().
2.7.2. Pseudo-Second-Order Kinetic Model
The pseudo-second-order kinetic model is based on the assumption that the rate of adsorption is proportional to the square of the difference in the equilibrium concentration of , mathematically expressed in Equation (4) [28]:
where (g/mg·min) is the equilibrium rate constant of pseudo-second-order adsorption. After applying the boundary conditions on Equation (4), a plot of the versus t was used to compute the equilibrium adsorption capacity () and adsorption rate constant ().
2.7.3. Elovich Equation
Elovich’s equation (Equation (5)) describes activated adsorption, which is compatible to with heterogeneous system [29].
where α is the initial sorption rate [mmol/(g min)], and the parameter β is related to the extent of surface coverage and activation energy for chemisorption (g/mmol). After applying boundary conditions and integrating, the constants () and (α) can be obtained from the slope and intercept of the linear plot of versus respectively.
2.7.4. Intra-Particle Diffusion Equation
According to Weber and Morris [30], the intraparticle-diffusion kinetic model was employed to confirm particle diffusion within the bio-sorption system (Equation (6)):
where is the intra-particle diffusion constant (mg/g min1/2). A linear plot of versus was used to compute the constants C and .
2.8. Adsorption Isotherms
The sorption isotherms were determined by adding 0.5 g of resin into a 250 mL volumetric flask containing ion (100 mL,100 mg/L), with constant agitation at 120 rpm on a wrist shaker for 180 min at a controlled temperature. At the end of the sorption process, 5 mL of the sample was centrifuged at 3000 rpm for 15 min, and the concentration was determined using ICP-OES.
2.8.1. Langmuir Adsorption Isotherm
The Langmuir adsorption isotherm is based on the assumption that there are fixed numbers of equal size and shaped adsorption sites and dynamic equilibrium exists between the adsorbed and the free on the surface of the resin [31] Equation (7):
where is the maximum monolayer coverage capacity (mg/g) and is the Langmuir isotherm constant (L/mg). The values of the constants, and can be estimated from the intercept and gradient from the plot of Ce/qe versus Ce.
2.8.2. Dubinin-Radushkevich (D-R) Adsorption Isotherm
The Dubinin–Radushkevich isotherm describes the adsorption mechanism with a Gaussian energy distribution onto the resin surface [32] as expressed in Equation (8):
where is monolayer adsorption capacity of Dubinin–Radushkevich (mg/g), β is adsorption energy E, R is the gas constant (8.314 J/mol K), and T is the absolute temperature. The constant β is computed from the relationship in Equation (9) [33]:
The linear isotherm plot of against RT of Equation (9) gives qm, as the intercept.
2.8.3. Temkin Adsorption Isotherm
Temkin isotherm considers the indirect Pb2+—Pb2+ interactions on adsorption isotherms, as expressed by the generalized form, Equation (10) [34]:
where is the Temkin isotherm equilibrium binding constant (L/g), is the Temkin isotherm constant. Therefore, the plot of versus In Ce gives an intercept and a straight line of slope .
2.8.4. Freundlich Adsorption Isotherm
Freundlich isotherm gives the empirical relationship between the concentration of on the surface of the resin to the concentration of in the aqueous solution, mathematically expressed as in Equation (11) [35]:
where KF is the Freundlich constant (mg/g), and n is the Freundlich exponent. The values of the constants, and can be estimated from the intercept and gradient from the plot of versus .
3. Results and Discussion
3.1. Yield of Extracted Tannins and Resins per Gram of the Aqueous Fraction
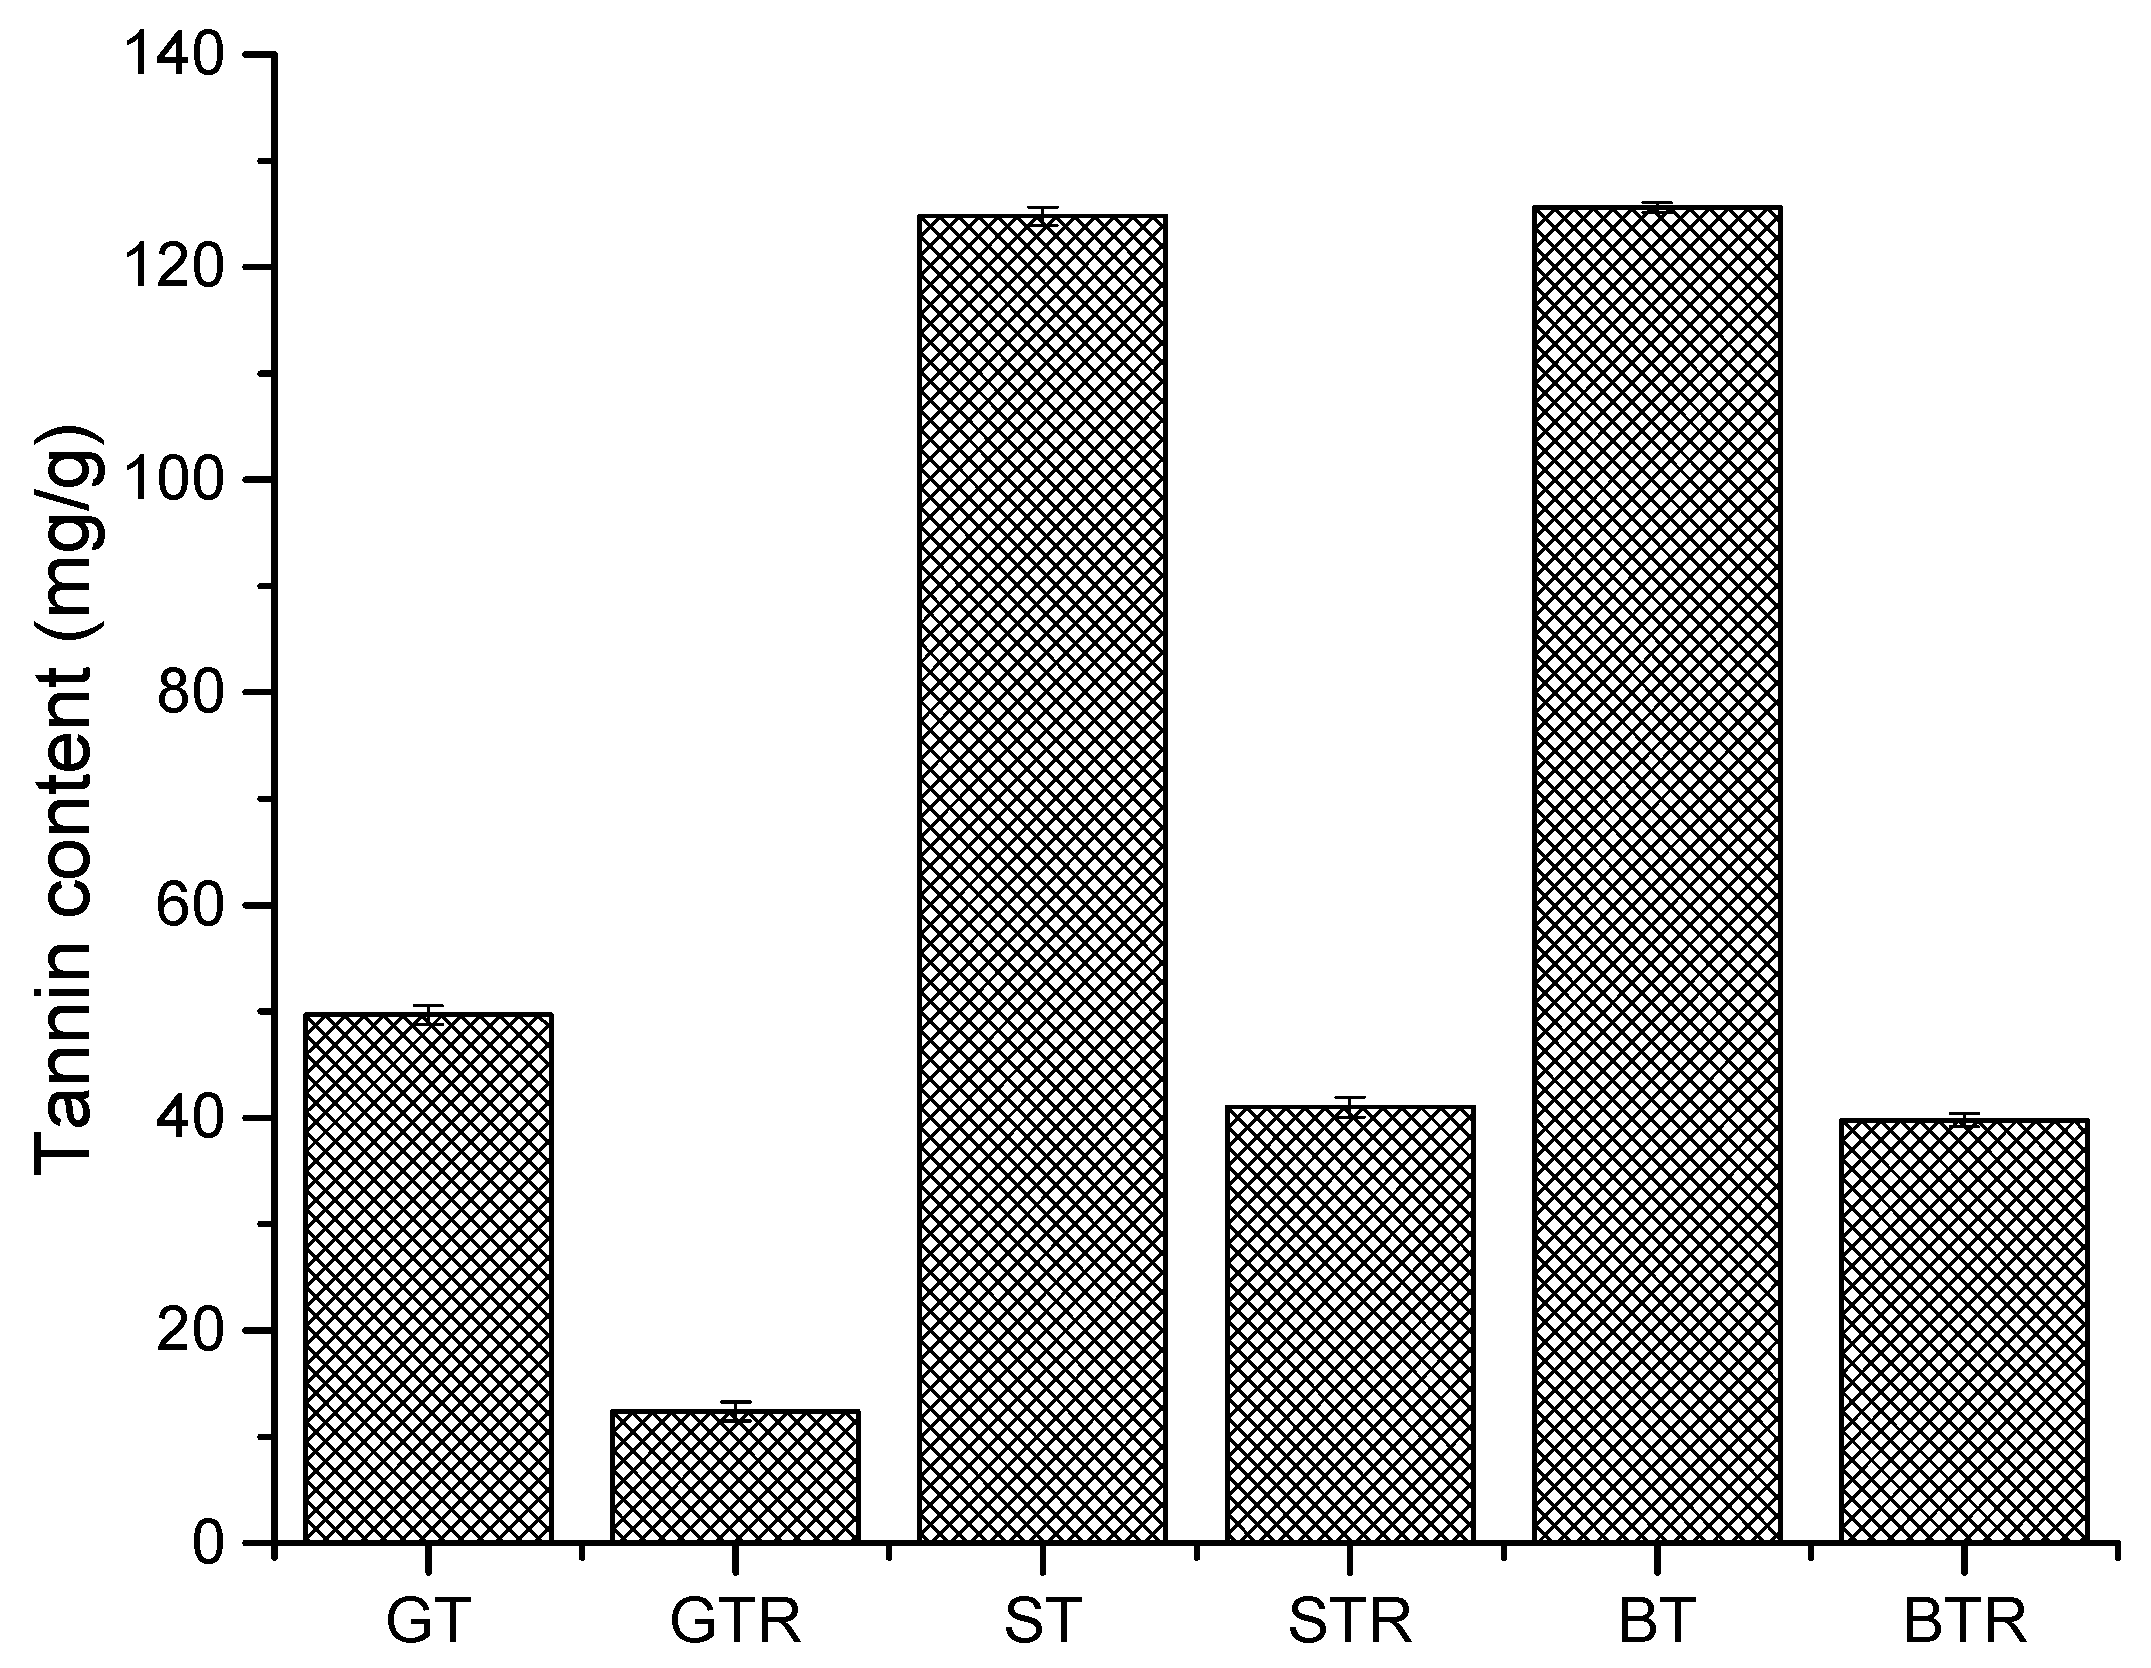
The quantitative evaluation of the tannins and resins showed a significant variation (p ≤ 0.05) in the content of the three different Acacia species, with ST and BT comparatively higher in tannin contents (Figure 3).
There is a significant difference (p ≤ 0.05) in the amount of cross-linkable tannin and extractable tannin; this indicates a difference in the tannin chemistry resulting in the observed variation. Depending on the Acacia species, about 25–40% of the total tannin can be modified into a resin while the uncross-linkable tannin can still find application in the tanning industry [36,37].
3.2. Thermal and Functional Group Properties of the Tannins and Resins
The thermogravimetric plots of the tannins and resins are provided as Supplementary Materials (Figures S1–S3). The first weight loss of the extracted tannins and resins is attributed to the loss of moisture in a single step around 303–328 K and 380–384 K, with the highest loss being observed in GT (7%) and GTR (11%), respectively. According to Sepe [38], almost every resin contains some degree of absorbed atmospheric moisture which may influence the mechanical performance [39], and also the rate of absorption of the material [40].
There was a significant weight loss for all the extracted tannins at 328–384 K whereas the resins were thermally stable at 375–1020 K. This is an indication that the resins are more resilient to heat because of the inter- and intra-crosslinked functional groups which agrees with the observed differences in the FT-IR spectra of the tannins and corresponding resins (Figures S4–S6, Supplementary Materials).
The FT-IR spectra of the tannins and resins indicate the presence of O-H vibrations at 3248–3266 cm−1. In addition, N-H vibration peaks at 3661–3669 cm−1, C = C of aromatic and overtone patterns at 690–900 cm−1 were observed in spectra of the resins only. These vibrational frequencies confirm a successfully crosslinked and aromatic bridged resin [41,42]. After adsorption of , there was a shift in the vibrational peak positions, justifying the feasibility of the adsorption process.
3.3. Crystalline and Amorphous Profiling of the Tannins and Resins
The XRD patterns of the extracted tannins were used as references to changes in the pattern or peak position of resins (Figures S7–S9, Supplementary Materials). The diffractograms of GTR, BTR, and STR, revealed sharp diffraction peaks, corresponding to the crystalline region of tannins [43,44]. Crystalline peaks were observed to superimpose the broad amorphous background in all the diffractograms obtained in this study. Hence, the cross-linked resins have an improved crystalline character compared to their corresponding tannins. Additionally, peaks (2θ angle [intensity]) were observed on the diffractograms of the resins at 90.8 [446] for GTR, 90.9 [699], 108.3 [260], 114.1° [281] for STR and 88.9° [470] 100.9° [1891], 107.9° [127] for BTR. These variations in the XRD peaks may play an influential role in the sorption potential of the resins due to the creation of additional active sites [45].
3.4. Surface Morphology, Area and Pore Volume Analysis of the Resins
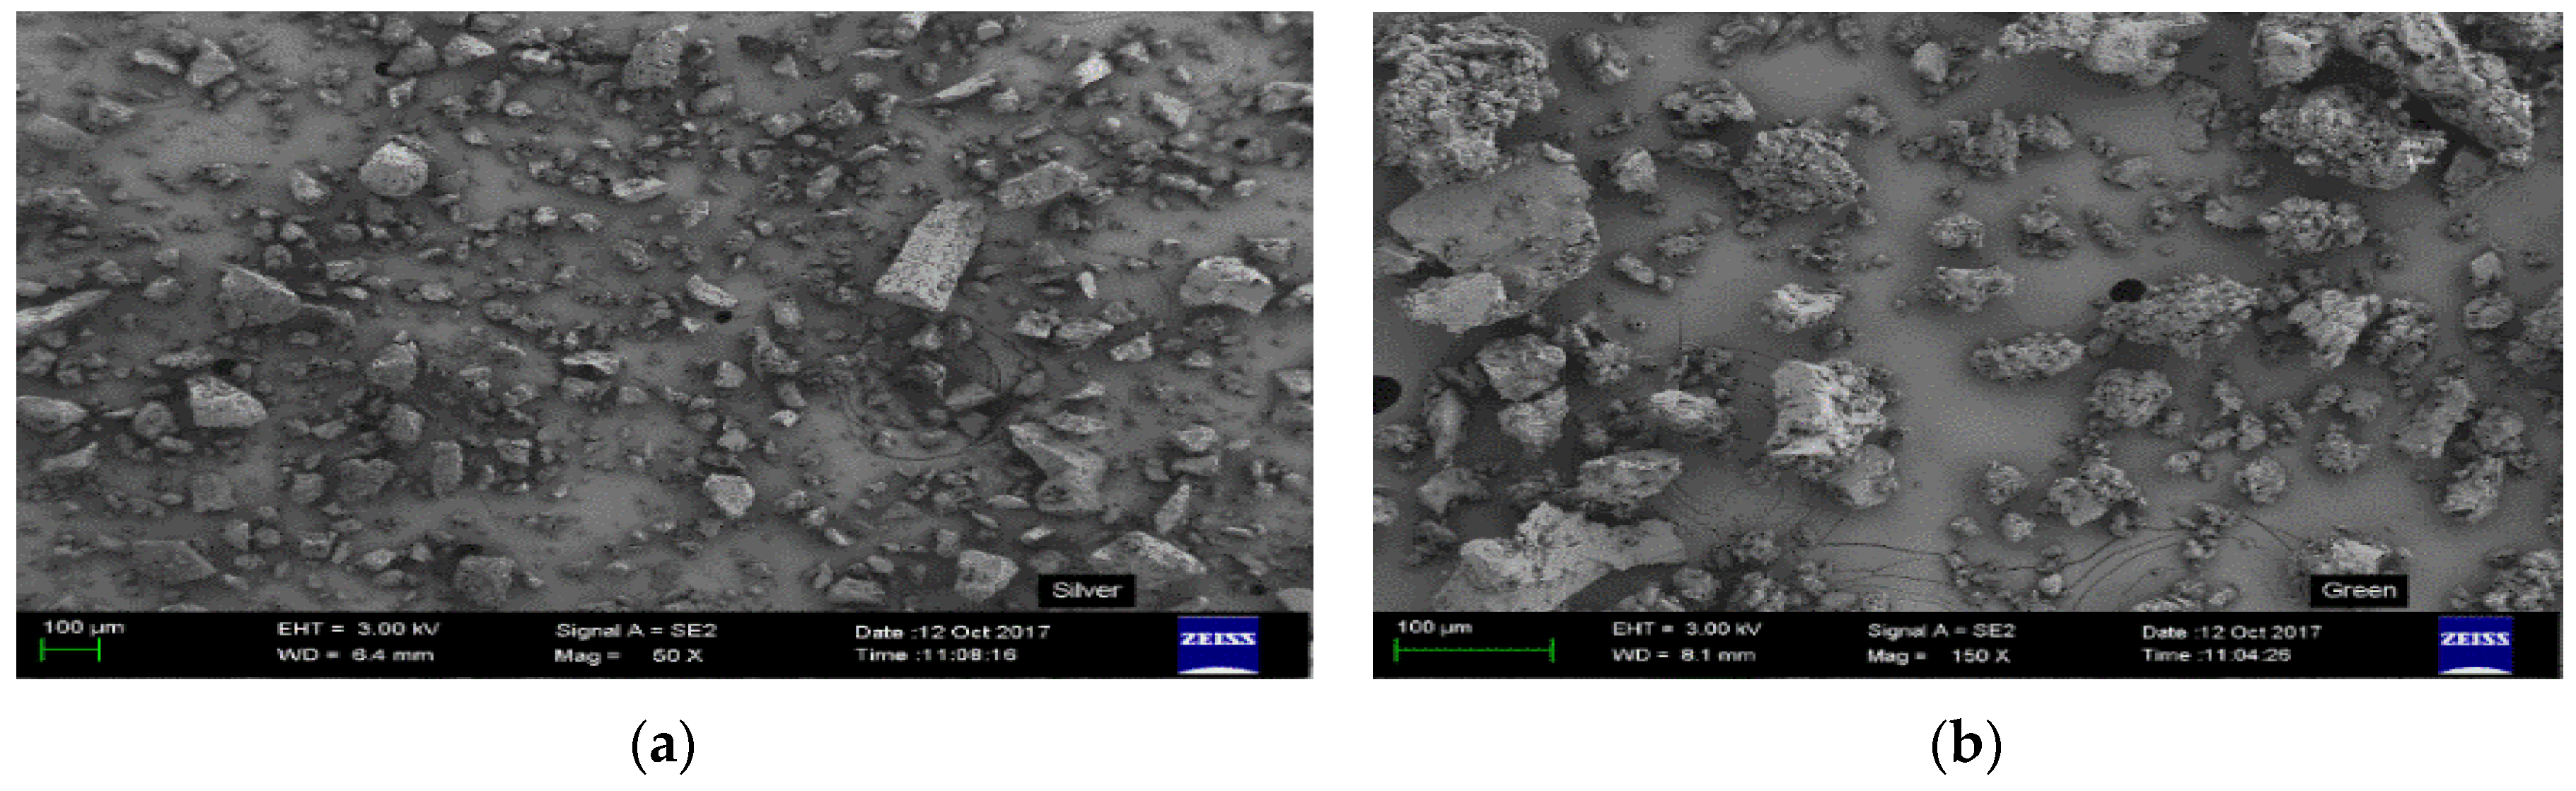
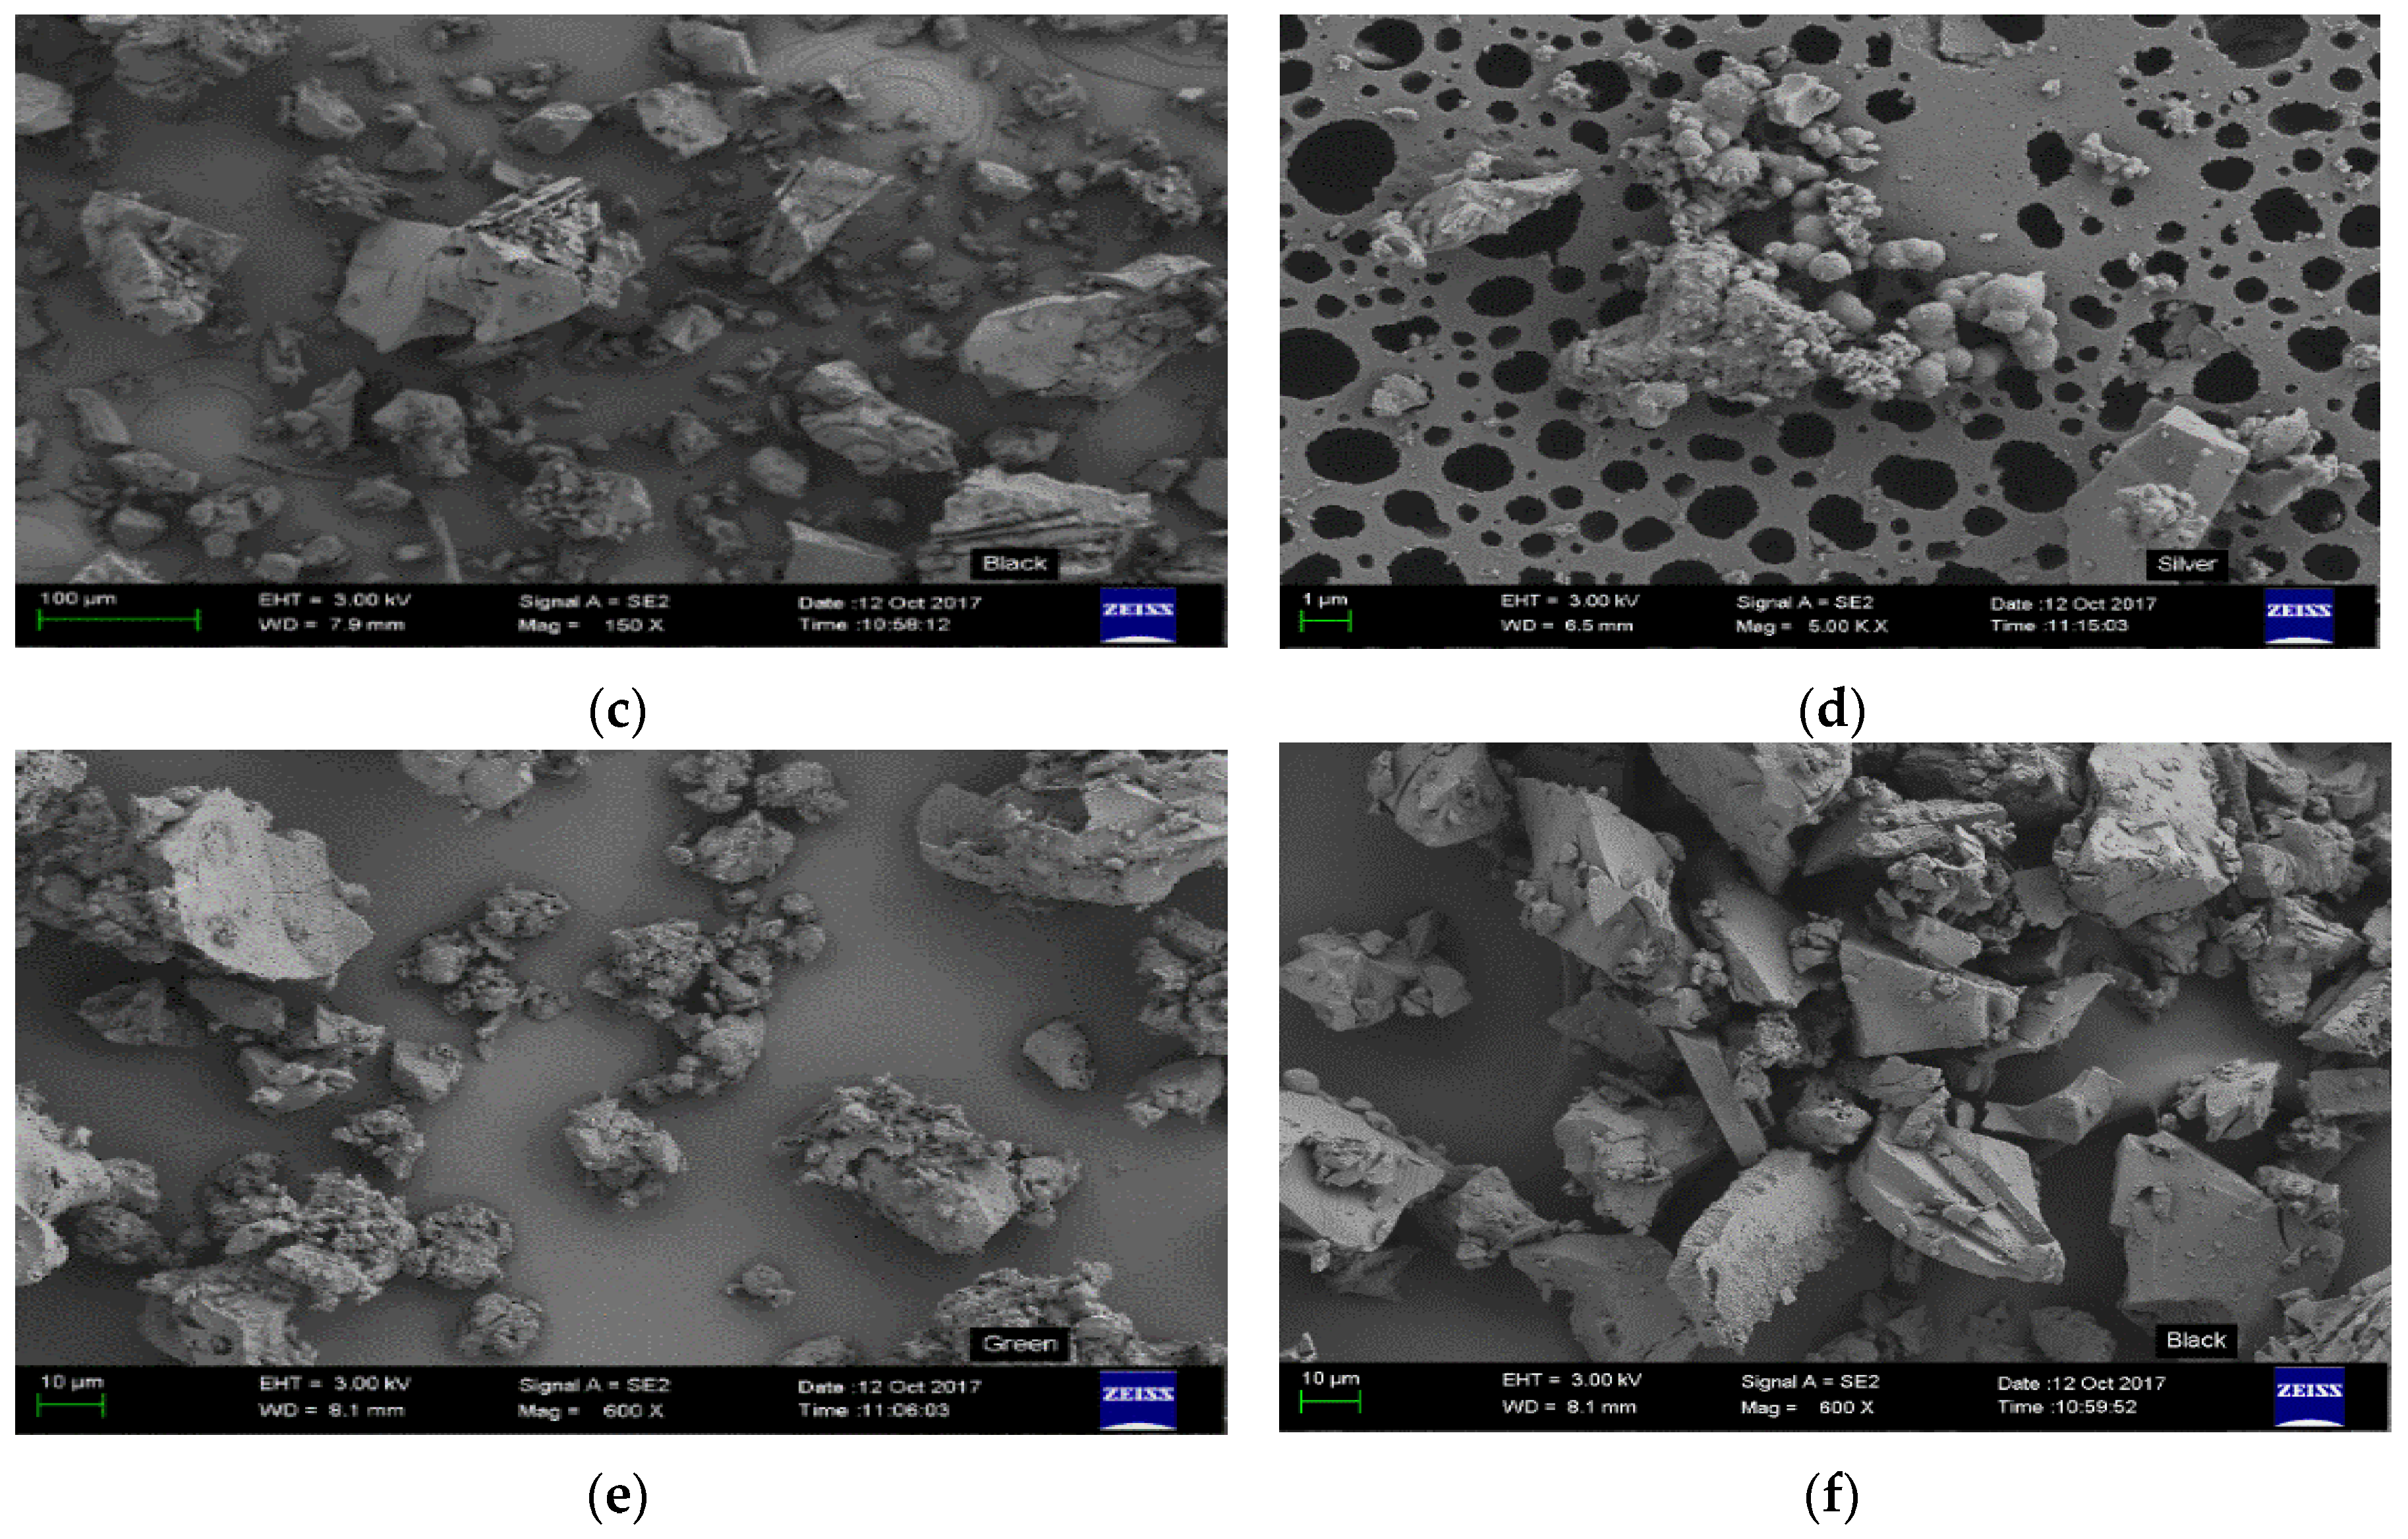
The surface morphology of the resins was examined using SEM-SE (JSM-7500F, Waltham, MA, USA) at a working distance of 8.1 mm at a thickness of 10 µm taken at different magnifications (Figure 4a–f). The micrographs of GTR and BTR have a porous, homogeneous, and crystallite morphology different from the broad heterogeneous surface of STR (Table 1).
There were no observable differences in the surface area as well as the pore volume of BTR and GTR (Table 1). The surface area is by no means the only physical property which determines the extent of adsorption. Of equal importance is the pore volume of the material. Mangun et al. [46] emphasized the importance of pore volume and area on the adsorption capacity of materials with heterogeneous surface compared to adsorbents with homogeneous surfaces.
3.5. pH and Temperature Dependence of the Resins on Pb2+ Uptake
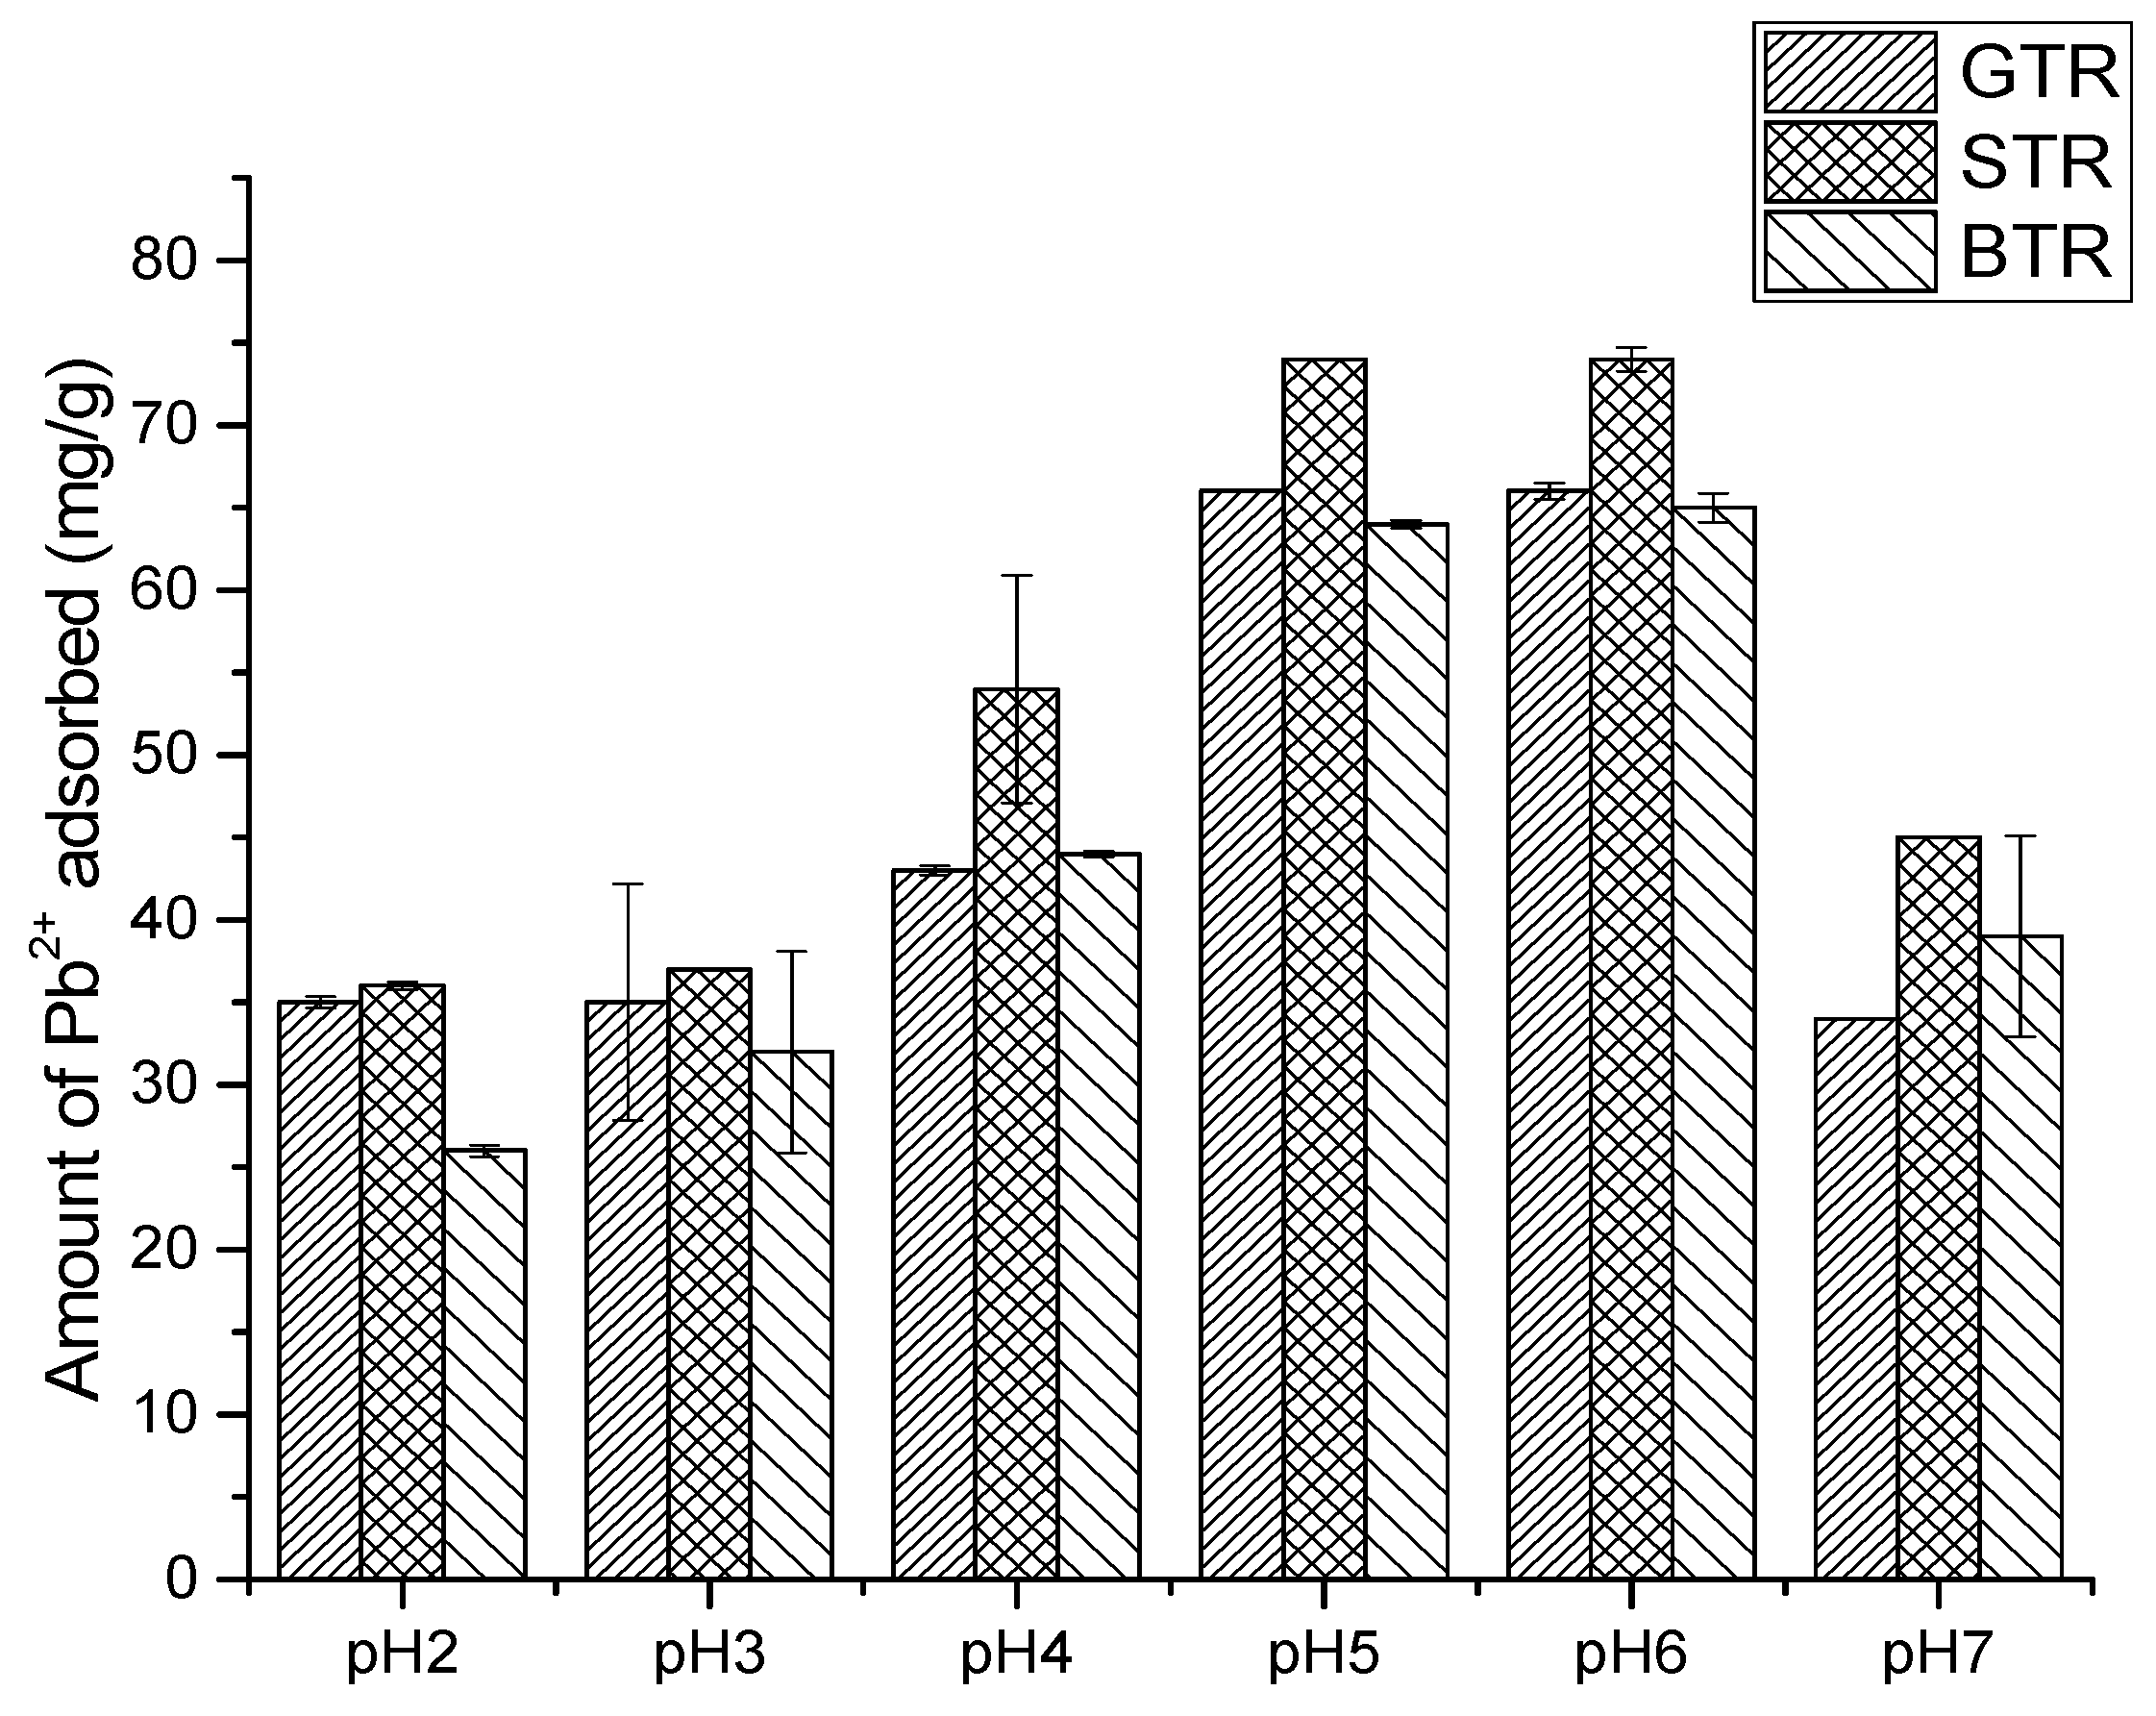
The uptake of by the resins was affected by variation in pH (Figure 5). STR has the best potential to accommodate the , efficiently removing over 74% of the ion from aqueous solutions at pH 6. There was a rapid increase in the adsorption of at pH 3.0, which peaks between pH 5 and 6 but drops off at pH 7. The adsorption of at pH 2–3 is low due to the competition between and for the free poly-hydroxyl and amine groups on the resin, resulting in the limited number of binding sites available for the adsorption of .
The is precipitated at pH greater than 7, because of the high concentration of hydroxide ion and the ease of oxidizing the free poly-hydroxyl groups of the resins; hence the difficulty in evaluating the sorption capacity at higher pH. A similar observation has been reported by Liao et al. [47], where the adsorption could not be evaluated at pH ≥ 8.0.
The influence of temperature on the adsorption of by the resins was significant (p ≤ 0.05) (Table 2). As the temperature increases, the adsorption of gradually rises to a maximum at 294–328 K and drops off sharply at higher temperatures.
The electrostatic and exothermic nature of interaction with the resins was altered at a temperature > 328 , despite the thermal stability of the resins above this temperature as shown on the thermograms (Figures S1–S3, Supplementary Materials). The observed decrease in the quantity of adsorbed at temperature is evidence of the exothermic interaction of with the resin surface [48] and also the validity of the thermodynamic constant of at 288–300 resulting in process reversal as reported in the studies of Seward [49] and Luo and Yanxin [50].
3.6. Evaluation of Kinetics Results
In Figure 6, the uptake by the three resins with time responded linearly with a maximum removal at 180 min. To investigate the optimal rate-controlling step, kinetic experiments were performed at pH 6 for 180 min. Several kinetic models such as the pseudo-first-order, pseudo-second-order, Elovich model and inter-particle diffusion model were evaluated with their constants K1 (), K2 (g/mg min) Kint (mg/g min1/2), and α (mg/g min) computed from the graphs of the kinetic models. The kinetic plots of the resins are provided as Supplementary Materials (Figure S10a–d).
As seen in Table 3, the correlation coefficients obtained for the pseudo-second-order kinetic model has the highest r2 value and was >0.95 of all resin interactions with Pb2+. The theoretical values of the pseudo-second-order model is closest to the experimental , even though its observed that the K1 > K2 at 303 K as a result of the exothermic nature of the interaction of with the resin causing a slight shift in equilibrium towards desorption. Similar kinetic behaviors using Mimosa tannin, carbon nanotubes and ethylenediamine-N,N′-disuccinic acid for the removal of were reported in the studies of Luzardo et al. [51] and Fabbricino et al. [52].
A suitable tool in evaluating the mechanistic evidence on a highly heterogeneous adsorbent is the Elovich equation. However, the observation in this study is contrary to the report of Aharoni and Ungarish [53], which stated that the Elovich equation should provide an excellent description of the sorption of a divalent adsorbate provided it is entirely a chemisorption process. This implies that the sorption process in this study is not entirely an electrostatic process, as the computed value of the Dubinin–Radushkevich adsorption energy (E) 7.07 KJ/mol with a correlation coefficient > 0.9832 [54].
In addition, the correlation coefficients obtained from the intra-particle diffusion model has a r2 ≤ 0.98 and an intercept at the origin for all the resins confirming diffusion within the system. This implies an increase in the boundary thickness for all resins [55], resulting in a decrease in the diffusion rate with time at a pH 6 due to limited active sites left on the resins at equilibrium.
3.7. Evaluation of the Isotherm Results
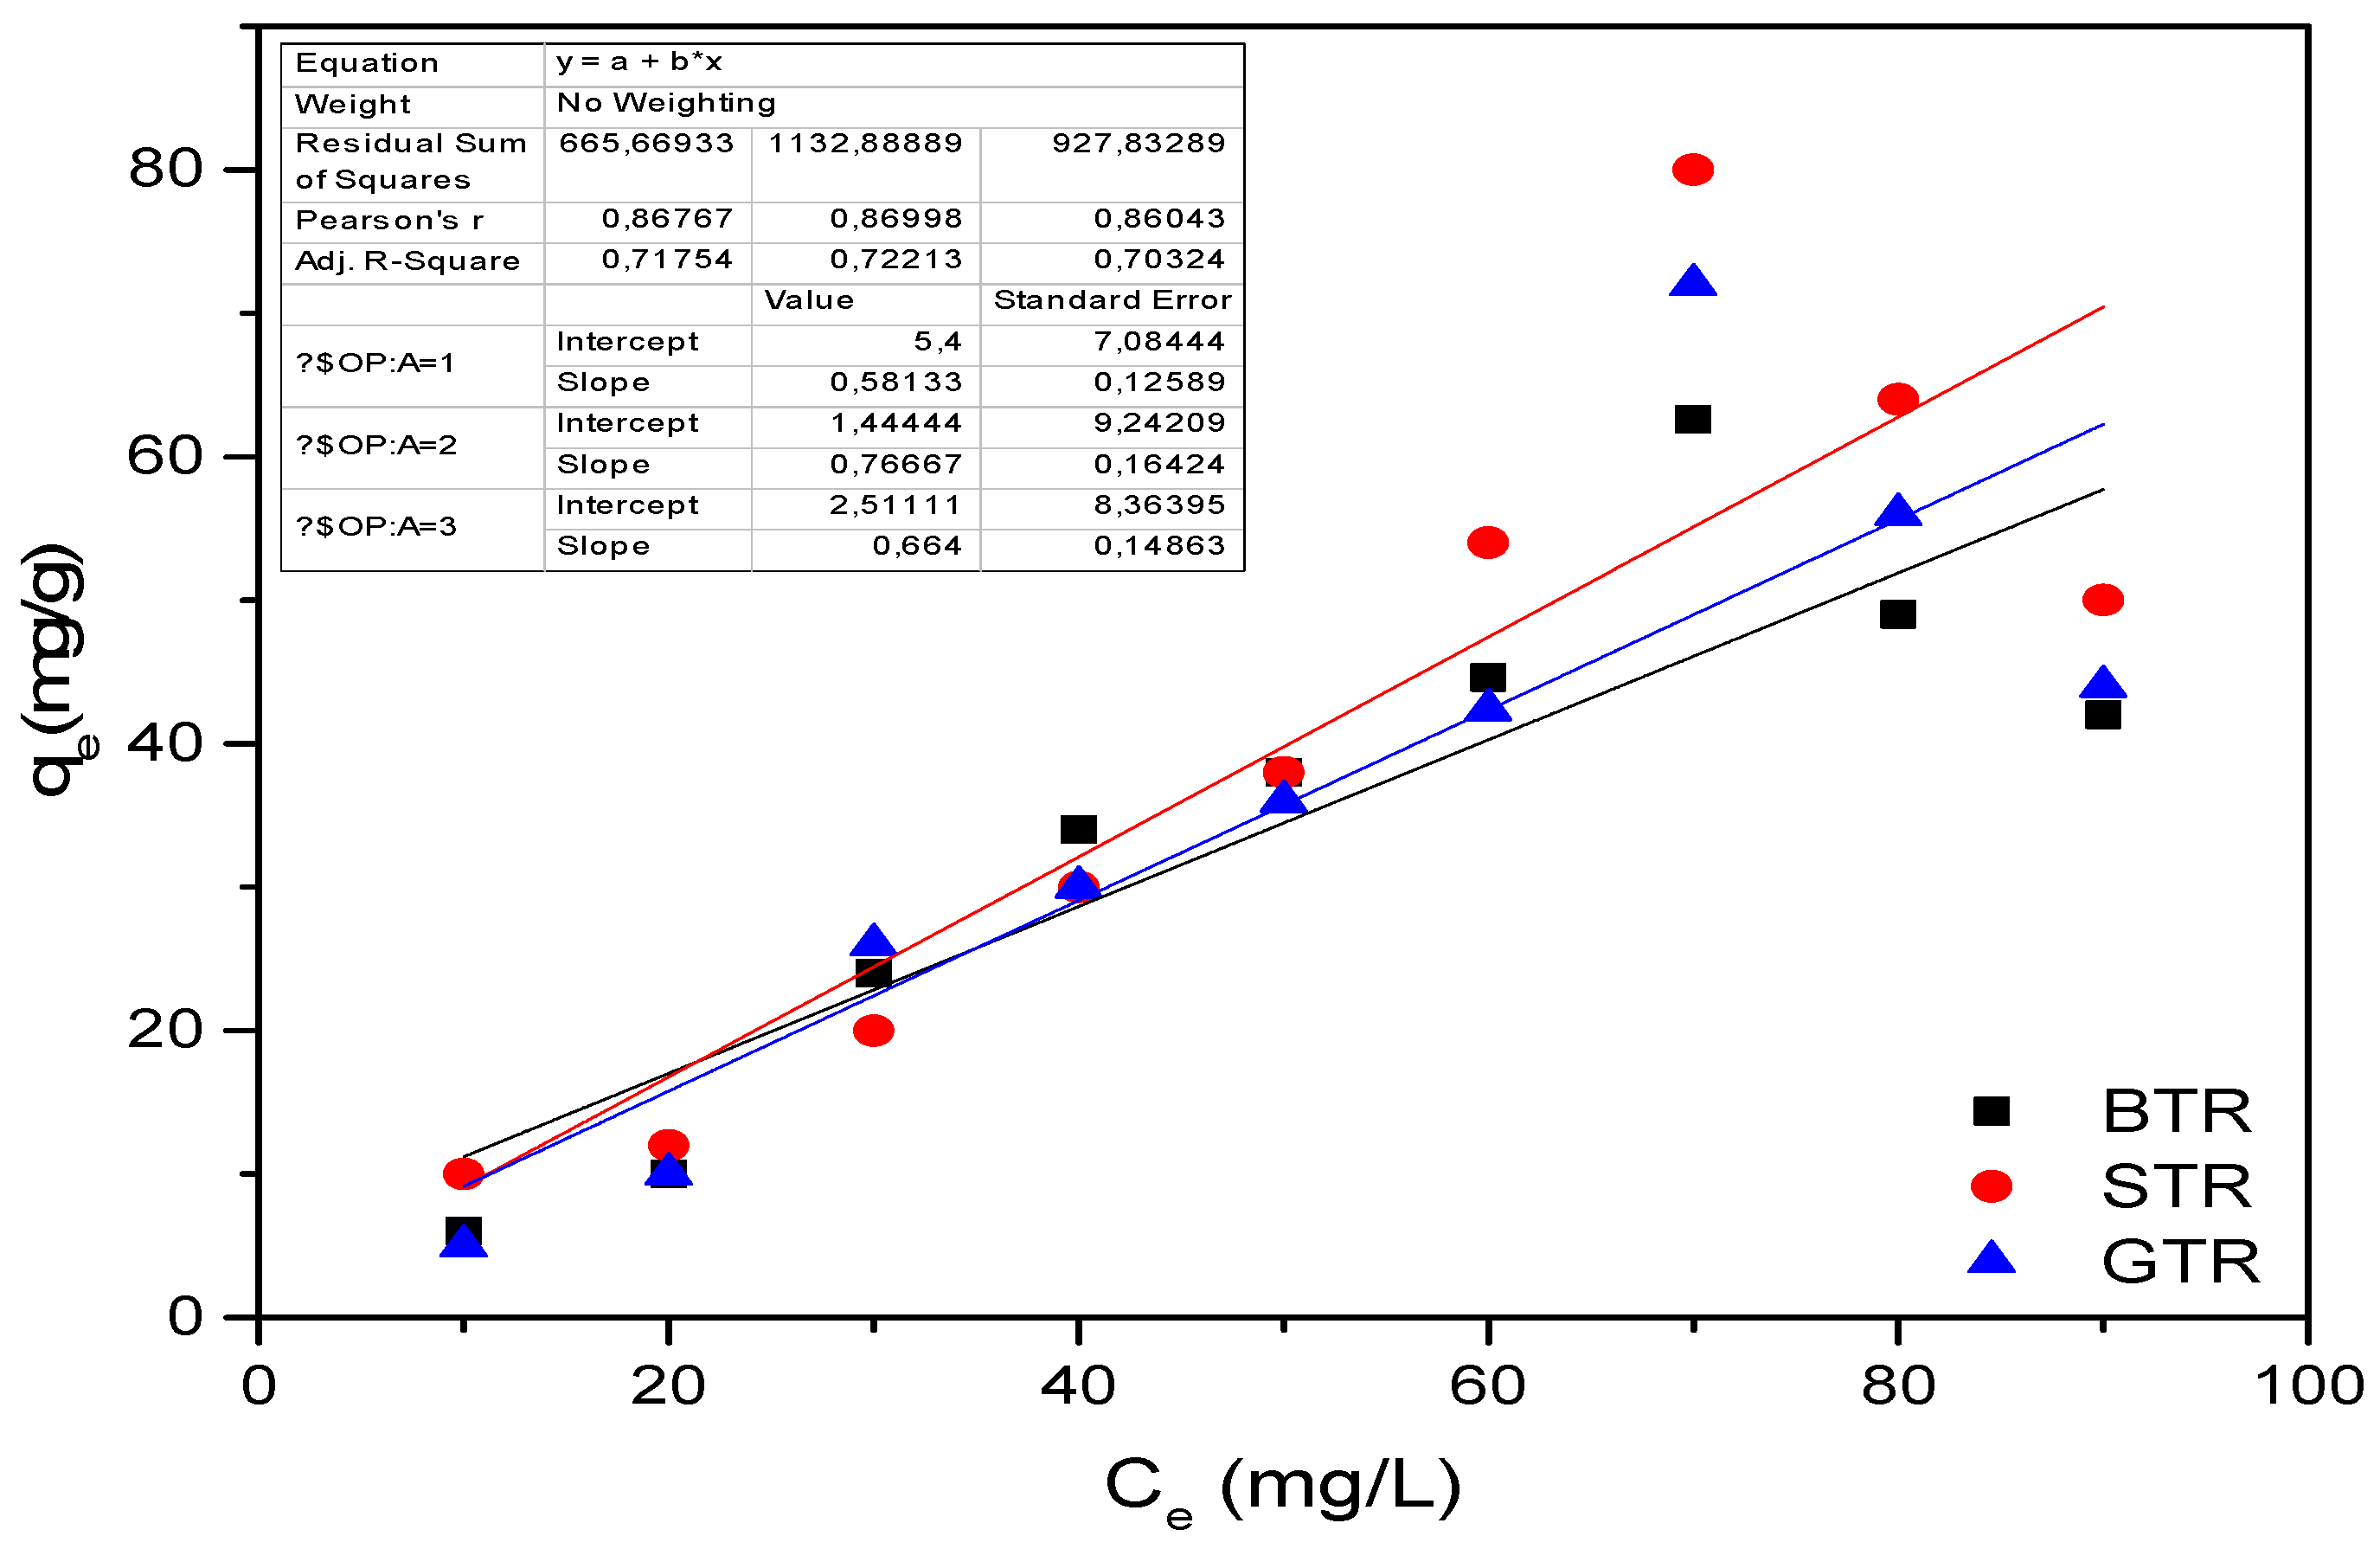
The equilibrium amount of effectively removed in 180 min by BTR was highest compared to STR and GTR (Figure 7). Hence, it is mandatory to determine the most suitable correlation model for the equilibrium data, to optimize the removal of from aqueous solutions. To accomplish the optimization requirements, we evaluated four isotherm models, determined the constants from the linear plots and the correlation coefficients (Table 4 and Figure S11a–d, Supplementary Materials).
As seen in Table 4, high values were obtained from all isotherms, whereas the highest and lowest values were shown by Langmuir and Freundlich isotherms with 0.9966 and 0.7865, respectively. The Freundlich exponent (n) are all 1, an indication that the biosorption processes on all the resins are spontaneous [56]. Hence, it can be inferred that the resins are suitable for the removal of from aqueous solutions.
The adsorption mean-free energy () computed from the Dubinin-Radushkevich equation for the transfer of from the aqueous solution to the surface of the resin was found to be 7.07 KJ/mol. Consequentially, the mechanism of the adsorption of to the surface of the resin is partly a physical process as the mean-free energy is 8 kJ/mol, as reported by Onyang et al. [54].
The Temkin isotherm () indicates that the adsorption fits the electrostatic model of — interaction at the resin interface. As the low Temkin constant ( values are 2.83–14.74 gJ/mg·mol for the indirect Pb2+—Pb2+ interactions with resin interface, this indicates an exothermic adsorption process leading to a decrease in the amount of adsorbed as temperature increases [57].
4. Conclusions
This study showed that the removal of from aqueous solutions in a batch system using resins from invasive Acacia species is an effective and feasible method. The resins were found to have improved crystalline property, high thermal stability, additional chemical functionality, and pronounced immobilization properties. In addition to these features, the uniquely small pore volume of 7–9 10−3 cc/g, with large surface area, enhanced the adsorption capacity of the resins. Temperature and pH strongly influenced the adsorption capacity of by the resins. Adsorption equilibrium data revealed that there are two sorption processes taking place on the surface of the resins with the dominant driving force being chemisorption. From a thorough literature survey as well as the result from this study, the resins may be used as an effective adsorbent for the removal of in aqueous solutions. They are less expensive, more easily synthesized and do not require any form of activation as in the case of some commercial absorbents. The resins are attractive not only from an economic point of view but also for the environmental impact of reducing and recovering invasive plant material. Therefore, the properties of this resin must be considered when making a valuable group of novel commercial adsorbents.
Supporting Information
Including thermograms, micrographs, diffractograms and FT-IR spectra of STR, BTR and GTR are available as supplementary material.
Supplementary Materials
The following are available online at https://www.mdpi.com/2073-4441/10/5/648/s1.
Author Contributions
Conceptualization, Johannes S. Modise and Bamidele J. Okoli; Methodology, Bamidele J. Okoli and Gabriel O. Anyanwu; Software, Bamidele J. Okoli and Johannes S. Modise; Validation, Bamidele J. Okoli and Gabriel O. Anyanwu and Johannes S. Modise; Formal Analysis, Johannes S. Modise; Investigation, Patience M. Shilowa and Bamidele J. Okoli; Resources, Johannes S. Modise; Data Curation, Gabriel O. Anyanwu and Bamidele J. Okoli; Writing-Original Draft Preparation, Patience M. Shilowa and Bamidele J. Okoli; Writing-Review & Editing, Bamidele J. Okoli and Gabriel O. Anyanwu; Visualization, Gabriel O. Anyanwu.; Supervision, Johannes S. Modise; Project Administration, Johannes S. Modise; Funding Acquisition, Johannes S. Modise.
Funding
This research received no external funding.
Acknowledgments
We appreciate the Institute of Chemical and Biotechnology, Faculty of Applied and Computer Science Research, Vaal University of Technology, South Africa, for supporting the research.
Conflicts of Interest
The authors have declared that there is no conflict of interest.
Abbreviations
| XRD | X-ray Diffractometer |
| BET | Brunauer–Emmett–Teller |
| TGA | Thermogravimetric analyzer |
| SEM | Scanning electron microscopy |
| FT-IR | Fourier transform infrared spectroscopy |
| ST | Silver Wattle Tannin |
| BT | Black Wattle Tannin |
| GT | Green Wattle Tannin |
| STR | Silver Wattle Tannin Resin |
| GTR | Green Wattle Tannin Resin |
| BTR | Black Wattle Tannin Resin |
| ICP-OES | Inductively coupled plasma optical emission spectrometer |
| * | After adsorption |
References
- Bharti, N.; Katyal, D. Water quality indices used for surface water vulnerability assessment. J. Environ. Sci. 2011, 2, 154–173. [Google Scholar] [CrossRef]
- Manara, A. Plants and heavy metals. Signal Transduct. 2012, 27–54. [Google Scholar] [CrossRef]
- Agência Nacional das Águas (ANA). Cuidando das águas: Soluções para melhorar a qualidade dos recursos hídricos; Agência Nacional das Águas (ANA): Brasília, Brazil, 2011; ISBN 978-85-8210-018-9. (In Portuguese) [Google Scholar]
- Duse, A.G.; Da Silva, M.P.; Zietsman, I. Coping with hygiene in South Africa, a water scarce country. Int. J. Environ. Health Res. 2003, 13 (Suppl. 1), S95–S105. [Google Scholar] [CrossRef] [PubMed]
- Chamier, J.; Schachtschneider, K.; le Maitre, D.C.; Ashton, P.J.; van Wilgen, B.W. Impacts of invasive alien plants on water quality, with particular emphasis on South Africa. Water SA 2012, 38, 345–356. [Google Scholar] [CrossRef]
- Calder, I.R.; Dye, P. Hydrological impacts of invasive alien plants. Land Use Water Resour. Res. 2001, 1, 1–8. [Google Scholar]
- Görgens, A.H.M.; Van Wilgen, B.W. Invasive alien plants and water resources in South Africa: Current understanding, predictive ability and research challenges. S. Afr. J. Sci. 2004, 100, 27–33. [Google Scholar]
- Wells, M.J.; Balsinhas, A.A.; Joffe, H.; Engelbrecht, V.M.; Harding, G.; Stirton, C.H. Acatalogue of problem plants in Southern Africa. In Catalogue of Problem Plants in Southern Africa; Botanical Research Institute: Lucknow, India, 1986. [Google Scholar]
- Dogra, K.; Sood, S.; Dobhal, P.; Seema, S. Alien plant invasion and their impact on indigenous species diversity at global scale: A review. J. Ecol. Nat. Environ. 2010, 2, 175–186. [Google Scholar]
- Anoop Krishnan, A.; Anirudhan, T.S. Removal of lead(II) in the presence of organic ligand from aqueous solution using activated carbon. Indian J. Environ. Prot. 2002, 22, 52–59. [Google Scholar]
- Issabayeva, G.; Aroua, M.K.; Sulaiman, N.M.N. Removal of lead from aqueous solutions on palm shell activated carbon. Bioresour. Technol. 2006, 97, 2350–2355. [Google Scholar] [CrossRef] [PubMed]
- Nriagu, J.O. Lead orthophosphates. I. Solubility and hydrolysis of secondary lead orthophosphate. Inorg. Chem. 1972, 11, 2499–2503. [Google Scholar] [CrossRef]
- Can, M.; Bulut, E.; örnek, A.; özacar, M. Synthesis and characterization of Valonea tannin resin and its interaction with palladium (II), rhodium (III) chloro complexes. Chem. Eng. J. 2013, 221, 146–158. [Google Scholar] [CrossRef]
- Bin, Z.; Shawon, Z. Synthesis and characterization of janus magnetic nanoparticles and its application as an adsorbent. J. Chem. Eng. 2012, 27, 64–68. [Google Scholar]
- Peres, R.S.; Armelin, E.; Alemán, C.; Ferreira, C.A. Modified tannin extracted from black wattle tree as an environmentally friendly antifouling pigment. Ind. Crops Prod. 2015, 65, 506–514. [Google Scholar] [CrossRef] [Green Version]
- Zhao, C.; Zheng, H.; Sun, Y.; Liu, B.; Zhou, Y.; Liu, Y.; Zheng, X. Fabrication of tannin-based dithiocarbamate biosorbent and its application for Ni(II) Ion removal. Water. Air Soil Pollut. 2016, 228. [Google Scholar] [CrossRef]
- Binaeian, E.; Seghatoleslami, N.; Chaichi, M.J. Synthesis of oak gall tannin-immobilized hexagonal mesoporous silicate (OGT-HMS) as a new super adsorbent for the removal of anionic dye from aqueous solution. Desalin. Water Treat. 2016, 57, 8420–8436. [Google Scholar] [CrossRef]
- Karamać, M. Fe(II), Cu(II) and Zn(II) chelating activity of buckwheat and buckwheat tannin groats tannin fractions. Polish J. Food Nutr. Sci. 2007, 57, 357–362. [Google Scholar]
- Karamać, M. Chelation of Cu(II), Zn(II), and Fe(II) by tannin constituents of selected edible nuts. Int. J. Mol. Sci. 2009, 10, 5485–5497. [Google Scholar] [CrossRef] [PubMed]
- Santana Romero, J.L.; Martínez Luzardo, F.; Codorniú Hernández, E.; Vargas Guerra, L.; Melo Cala, P.; García Guillén, M.; Isaac Olivé, K.; Estevez, P.; Roque Córdoba, A.; Benítez, M. Radioisotope method for characterization of vegetable tannins, extracted from waste of forestry production in Cuba. J. Radioanal. Nucl. Chem. 2002, 253, 101–106. [Google Scholar] [CrossRef]
- Liao, X.; Zhang, M.; Shi, B. Collagen-fiber-immobilized tannins and their adsorption of Au(III). Ind. Eng. Chem. Res. 2004, 43, 2222–2227. [Google Scholar] [CrossRef]
- Chibata, I.; Tosa, T.; Mori, T.; Watanabe, T.; Sakata, N. Immobilized tannin—A novel adsorbent for protein and metal ion. Enzym. Microb. Technol. 1986, 8, 130–136. [Google Scholar] [CrossRef]
- Bamidele, O.; Nnana, M.; Imelda, L.; Sekomeng, M. Acacia decurrens (wild) an invasive South Africa tree: Chemical profile, antibacterial and antioxidant activities. Org. Med. Chem IJ 2017, 3. [Google Scholar] [CrossRef]
- Guillemaud, T.; Ciosi, M.; Lombaert, É.; Estoup, A. Biological invasions in agricultural settings: Insights from evolutionary biology and population genetics. C.R. Biol. 2011, 334, 237–246. [Google Scholar] [CrossRef] [PubMed]
- Kaur, C.; Kapoor, H.C. Anti-oxidant activity and total phenolic content of some Asian vegetables. Int. J. Food Sci. Technol. 2002, 37, 153–161. [Google Scholar] [CrossRef]
- Shirato, W. Method of Preparing Insoluble Hydrolysable Tannin and Method of Treating Waste Liquid with the Tannin. U.S. Patent 5,274,169, 28 September 1993. [Google Scholar]
- Ho, Y.S.; Mckay, G. A Comparison of chemisorption kinetic models applied to pollutant removal on various sorbents. Process Saf. Environ. Prot. 1998, 76, 332–340. [Google Scholar] [CrossRef]
- Ho, Y.-S. Removal of copper ions from aqueous solution by tree fern. Water Res. 2003, 37, 2323–2330. [Google Scholar] [CrossRef]
- Cheung, C.W.; Porter, J.F.; Mckay, G. Sorption kinetic analysis for the removal of cadmium ions from effluents using bone char. Water Res. 2001, 35, 605–612. [Google Scholar] [CrossRef]
- Weber, W.J.; Morris, J.C. Kinetics of adsorption on carbon from solution. J. Sanit. Eng. Div. 1963, 89, 31–60. [Google Scholar]
- Langmuir, I. Adsorption of gases on plain surface of glass mica platinum. J. Am. Chem. Soc. 1918, 40, 1361–1403. [Google Scholar] [CrossRef]
- Dubinin, M.M.; Radushkevich, L.V. The equation of the characteristic curve of activated charcoal. Proc. Acad. Sci. Phys. Chem. Sect. 1947, 55, 331. [Google Scholar] [CrossRef]
- Namasivayam, C.; Sureshkumar, M.V. Removal of chromium(VI) from water and wastewater using surfactant modified coconut coir pith as a biosorbent. Bioresour. Technol. 2008, 99, 2218–2225. [Google Scholar] [CrossRef] [PubMed]
- Ho, Y.S.; Ng, J.C.Y.; McKay, G. Removal of lead(II) from effluents by sorption on peat using second-order kinetics. Sep. Sci. Technol. 2001, 36, 241–261. [Google Scholar] [CrossRef]
- Freundlich, H. Über die adsorption in Lösungen. Z. Phys. Chem. 1907, 57, 385–470. [Google Scholar] [CrossRef]
- Sieniawska, E.; Baj, T. Tannins. In Pharmacognosy: Fundamentals, Applications and Strategy; Elsevier: New York, NY, USA, 2016; pp. 199–232. ISBN 9780128020999. [Google Scholar]
- Swanson, B.G. Tannins and polyphenols. In Encyclopedia of Food Sciences and Nutrition; Elsevier: New York, NY, USA, 2003; pp. 5729–5733. ISBN 9780122270550. [Google Scholar]
- Sepe, M. Why (And What) You Need to Dry. Plast. Technol. 2014. Available online: https://www.ptonline.com/articles/why-and-what-you-need-to-dry (accessed on 23 April 2018).
- Baschek, G.; Hartwig, G.; Zahradnik, F. Effect of water absorption in polymers at low and high temperatures. Polymer 1999, 40, 3433–3441. [Google Scholar] [CrossRef]
- Ye, Z.B.; Cheng, L.; Xiang, W.T.; Liu, Y.G.; Li, J.H. Characterization of resins and the adsorption of resins on asphaltene particles. Xinan Shiyou Daxue Xuebao/J. Southwest Pet. Univ. 2010, 32, 147–154. [Google Scholar] [CrossRef]
- Grabowska, B.; Holtzer, M. Structural examination of the cross-linking reaction mechanism of polyacrylate binding agents. Arch. Metall. Mater. 2009, 54, 427–437. [Google Scholar]
- González-González, M.; Cabanelas, J.C.; Baselga, J. Applications of FTIR on epoxy resins – identification, monitoring the curing process, phase separation and water uptake. In Infrared Spectroscopy-Materials Science, Engineering and Technology; Theophile, T., Ed.; InTech: Rijeka, Croatia, 2012; Volume 2, pp. 261–284. [Google Scholar]
- Almeida, E. Surface treatments and coatings for metals. A general overview. 1. Surface treatments, surface preparation, and the nature of coatings. Ind. Eng. Chem. Res. 2001, 40, 3–14. [Google Scholar] [CrossRef]
- Narayanan, T.S.N. Surface pretreatment by phospahte conversion coatings—A review. History 2005, 9, 130–177. [Google Scholar]
- Peres, R.S.; Cassel, E.; Ferreira, C.A.; Azambuja, D.S. Grain refiner effect of black wattle tannin in iron and zinc phosphate coatings. Ind. Eng. Chem. Res. 2014, 53, 2706–2712. [Google Scholar] [CrossRef]
- Mangun, C.L.; Daley, M.A.; Braatz, R.D.; Economy, J. Effect of pore size on adsorption of hydrocarbons in phenolic-based activated carbon fibers. Carbon 1998, 36, 123–129. [Google Scholar] [CrossRef]
- Liao, X.; Li, L.; Shi, B. Adsorption recovery of thorium(IV) by Myrica rubra tannin and larch tannin immobilized onto collagen fibres. J. Radioanal. Nucl. Chem. 2004, 260, 619–625. [Google Scholar] [CrossRef]
- Dho, N.Y.; Lee, S.R. Effect of temperature on single and competitive adsorptions of {Cu} ({II}) and {Zn} ({II}) onto natural clays. Environ. Monit. Assess. 2003, 83, 177–203. [Google Scholar] [CrossRef] [PubMed]
- Seward, T.M. The formation of lead (II) chloride complexes to 300 C: A spectrophotometric study. Geochim. Cosmochim. Acta 1984, 48, 121–134. [Google Scholar] [CrossRef]
- Luo, Y.; Millero, F.J. Stability constants for the formation of lead chloride complexes as a function of temperature and ionic strength. Geochim. Cosmochim. Acta 2007, 71, 326–334. [Google Scholar] [CrossRef] [PubMed]
- Luzardo, F.H.M.; Velasco, F.G.; Correia, I.K.S.; Silva, P.M.S.; Salay, L.C. Removal of lead ions from water using a resin of Mimosa tannin and carbon nanotubes. Environ. Technol. Innov. 2017, 7, 219–228. [Google Scholar] [CrossRef]
- Fabbricino, M.; Ferraro, A.; Luongo, V.; Pontoni, L.; Race, M. Soil washing optimization, recycling of the solution, and ecotoxicity assessment for the remediation of Pb-contaminated sites using EDDS. Sustainability 2018, 10, 636. [Google Scholar] [CrossRef]
- Aharoni, C.; Ungarish, M. Kinetics of activated chemisorptions. Part I: The non-elovichian part of the isotherm. J. Chem. Soc. Faraday Trans. 1976, 72, 265–268. [Google Scholar] [CrossRef]
- Onyang, M.S.; Kojima, Y.; Aoyi, O.; Bernardo, E.C.; Matsuda, H. Adsorption equilibrium modeling and solution chemistry dependence of fluoride removal from water by trivalent-cation-exchanged zeolite F-9. J. Interface Sci. 2004, 279, 341–350. [Google Scholar] [CrossRef] [PubMed]
- Hameed, B.H. Equilibrium and kinetic studies of metil violet sorption by agricultural waste. J. Hazard. Mater. 2008, 154, 204–212. [Google Scholar] [CrossRef] [PubMed]
- Hameed, B.H.; Mahmoud, D.K.; Ahmad, A.L. Equilibrium modeling and kinetic studies on the adsorption of basic dye by a low-cost adsorbent: Coconut (Cocos nucifera) bunch waste. J. Hazard. Mater. 2008, 158, 65–72. [Google Scholar] [CrossRef] [PubMed]
- Sekar, M.; Sakthi, V.; Rengaraj, S. Kinetics and equilibrium adsorption study of lead(II) onto activated carbon prepared from coconut shell. J. Colloid Interface Sci. 2004, 279, 307–313. [Google Scholar] [CrossRef] [PubMed]
Figure 1.
Sequential Extraction of Tannin from the Acacia Stem Bark.

Figure 2.
Preparation of Resin.

Figure 3.
Comparative Yields of Extracted Tannins and Resins Expressed as Mean ± SD. Key: silver wattle tannin (ST), silver wattle tannin resin (STR), black wattle tannin (BT), black wattle tannin resin (BTR), green wattle tannin (GT) and green wattle tannin resin (GTR).
Figure 3.
Comparative Yields of Extracted Tannins and Resins Expressed as Mean ± SD. Key: silver wattle tannin (ST), silver wattle tannin resin (STR), black wattle tannin (BT), black wattle tannin resin (BTR), green wattle tannin (GT) and green wattle tannin resin (GTR).

Figure 4.
(a–f) Micrographs taken in SE mode at a magnification of 50× for (a) STR (b) GTR and (c) BTR samples. Magnification of 600× for (d) STR (e) GTR and (f) BTR samples.
Figure 4.
(a–f) Micrographs taken in SE mode at a magnification of 50× for (a) STR (b) GTR and (c) BTR samples. Magnification of 600× for (d) STR (e) GTR and (f) BTR samples.


Figure 5.
Effects of pH on the Pb2+ adsorption on the resins at an initial concentration of 100 ppm and powder resin concentration of 0.5 g/L (particle size + 100 µm; agitation rate: 120 rpm; contact time: 180 min). Values are expressed as mean ± SD.
Figure 5.
Effects of pH on the Pb2+ adsorption on the resins at an initial concentration of 100 ppm and powder resin concentration of 0.5 g/L (particle size + 100 µm; agitation rate: 120 rpm; contact time: 180 min). Values are expressed as mean ± SD.

Figure 6.
Plot of the equilibrium quantity of adsorbed with response to time by the three resins.

Figure 7.
Plot of the equilibrium quantity of adsorbed with response to concentration by the three resins.
Figure 7.
Plot of the equilibrium quantity of adsorbed with response to concentration by the three resins.


Table 1.
BET specific surface areas and pore volume for the resins.
| Synthesized Resin | Surface Area (m²/g) | Pore Volume (cc/g) |
|---|---|---|
| GTR | 2.38 | 9 × 10⁻³ |
| STR | 8.65 | 7 × 10⁻³ |
| BTR | 2.31 | 9 × 10⁻³ |
Table 2.
Effects of temperature on the Pb2+ adsorption on the resins at an initial concentration of 100 ppm (Resin: 0.5 g/L; particle size + 100 µm; agitation rate: 120 rpm; contact time: 180 min).
Table 2.
Effects of temperature on the Pb2+ adsorption on the resins at an initial concentration of 100 ppm (Resin: 0.5 g/L; particle size + 100 µm; agitation rate: 120 rpm; contact time: 180 min).
| Resins | Optimal Temperature (K) | Amount of Pb2+ Absorbed (mg/g) |
|---|---|---|
| STR | 328 | 81.65 |
| BTR | 294 | 69.96 |
| GTR | 294 | 66.18 |
Table 3.
The kinetics constants for the adsorption of Pb2+ (Resin: 0.5 g/L; Ci: 100 ppm; particle size + 100 µm; temperature: 303 K; agitation rate: 120 rpm; contact time: 180 min; pH 6.
Table 3.
The kinetics constants for the adsorption of Pb2+ (Resin: 0.5 g/L; Ci: 100 ppm; particle size + 100 µm; temperature: 303 K; agitation rate: 120 rpm; contact time: 180 min; pH 6.
| Resins | (mg/g) | Pseudo-First-Order Equation | Pseudo-Second-Order Equation | ||||
| K1 () | (mg/g) | r2 | K2 (g/mg min) | (mg/g) | r2 | ||
| STR | 93.37 | 0.067 | 10.63 | 0.966 | 0.055 | 93.87 | 0.953 |
| BTR | 83.43 | 0.073 | 68.36 | 0.853 | 0.042 | 84.64 | 0.958 |
| GTR | 63.74 | 0.063 | 52.27 | 0.912 | 0.074 | 64.83 | 0.983 |
| Resins | (mg/g) | Elovich Equation | Intraparticle-Diffusion Equation | ||||
| α (mg/g min) | β (g/min) | r2 | Kint (mg/g min1/2) | r2 | |||
| STR | 73.37 | 5.363 | 6.323 | 0.993 | 0.367 | 0.983 | |
| BTR | 65.34 | 6473 | 3.345 | 0.835 | 0.647 | 0.783 | |
| GTR | 53.62 | 356.7 | 2.566 | 0.543 | 0.326 | 0.823 | |
Table 4.
Comparison of four isotherm equations for equilibrium uptake studies of Pb2+ by the three resins.
Table 4.
Comparison of four isotherm equations for equilibrium uptake studies of Pb2+ by the three resins.
| Resins | Langmuir | Dubinin–Radushkevich | ||||||
| (L/g) | (L/mg) | (mg/g) | (mmol/g) | (mmol2/J2) | (KJ/mol) | |||
| STR | 37.84 | 0.326 | 189.30 | 0.9966 | 465.40 | 1 10-4 | 2.24 | 0.9744 |
| BTR | 13.98 | 0.363 | 105.70 | 0.9937 | 746.50 | 1 10-4 | 2.24 | 0.9367 |
| GTR | 11.83 | 0.464 | 98.82 | 0.9832 | 582.30 | 1 10-5 | 7.07 | 0.9543 |
| Resins | Temkin | Freundlich | ||||||
| (L/g) | ||||||||
| STR | 14.74 | 127.60 | 0.9655 | 87.38 | 7.773 | 0.7865 | ||
| BTR | 10.73 | 32.32 | 0.9561 | 64.88 | 6.237 | 0.8853 | ||
| GTR | 2.83 | 45.37 | 0.9533 | 53.73 | 7.467 | 0.8335 | ||
© 2018 by the authors. Licensee MDPI, Basel, Switzerland. This article is an open access article distributed under the terms and conditions of the Creative Commons Attribution (CC BY) license (http://creativecommons.org/licenses/by/4.0/).
Share and Cite
MDPI and ACS Style
Okoli, B.J.; Shilowa, P.M.; Anyanwu, G.O.; Modise, J.S. Removal of Pb2+ from Water by Synthesized Tannin Resins from Invasive South African Trees. Water 2018, 10, 648. https://doi.org/10.3390/w10050648
AMA Style
Okoli BJ, Shilowa PM, Anyanwu GO, Modise JS. Removal of Pb2+ from Water by Synthesized Tannin Resins from Invasive South African Trees. Water. 2018; 10(5):648. https://doi.org/10.3390/w10050648
Chicago/Turabian StyleOkoli, Bamidele J., Patience M. Shilowa, Gabriel O. Anyanwu, and Johannes S. Modise. 2018. "Removal of Pb2+ from Water by Synthesized Tannin Resins from Invasive South African Trees" Water 10, no. 5: 648. https://doi.org/10.3390/w10050648
Note that from the first issue of 2016, this journal uses article numbers instead of page numbers. See further details here.