


Abstract
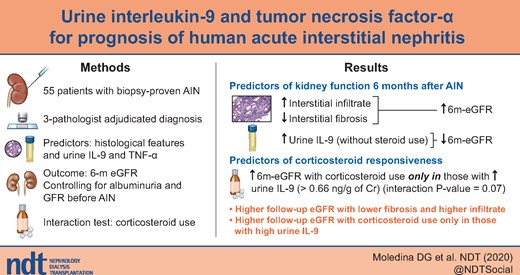
We previously demonstrated that urine interleukin (IL)-9 and tumor necrosis factor (TNF)-α can distinguish acute interstitial nephritis (AIN) from other causes of acute kidney injury. Here we evaluated the role of these biomarkers to prognosticate kidney function in patients with AIN.
In a cohort of participants with biopsy-proven, adjudicated AIN, we tested the association of histological features and urine biomarkers (IL-9 and TNF-α) with estimated glomerular filtration rate measured 6 months after diagnosis (6 m-eGFR) controlling for eGFR before AIN and albuminuria. We also evaluated subgroups in whom corticosteroid use was associated with 6 m-eGFR.
In the 51 (93%) of the 55 participants with complete data, median (interquartile range) eGFR before and 6 m after AIN were 41 (27–69) and 28 (13–47) mL/min/1.73 m2, respectively. Patients with higher severity of interstitial fibrosis had lower 6 m-eGFR, whereas those with higher tubulointerstitial infiltrate had higher 6 m-eGFR. IL-9 levels were associated with lower 6 m-eGFR only in the subset of patients who did not receive corticosteroids [6m-eGFR per doubling of IL-9, −6.0 (−9.4 to −2.6) mL/min/1.73 m2]. Corticosteroid use was associated with higher 6 m-eGFR [20.9 (0.2, 41.6) mL/min/1.73 m2] only in those with urine IL-9 above the median (>0.66 ng/g) but not in others.
Urine IL-9 was associated with lower 6 m-eGFR only in participants not treated with corticosteroids. Corticosteroid use was associated with higher 6 m-eGFR in those with high urine IL-9. These findings provide a framework for IL-9-guided clinical trials to test efficacy of immunosuppressive therapy in patients with AIN.
What is already known about this subject?
Urine interleukin (IL)-9 and tumor necrosis factor (TNF)-α can distinguish acute interstitial nephritis (AIN) from other causes of acute kidney injury.
Whether these biomarkers can prognosticate kidney function in patients with AIN is unknown.
What this study adds?
IL-9 levels were associated with lower 6 m-eGFR only in the subset of patients who did not receive corticosteroids.
Corticosteroid use was associated with higher 6 m-eGFR only in those with urine IL-9 above the median (>0.66 ng/g) but not in others.
What impact this may have on practice or policy?
Immunosuppressive therapy may lead to improvement in kidney function only in patients with AIN who have high urine IL-9. This biomarker could be used to enroll patients in a clinical trial of immunosuppressive therapy in patients with AIN.
INTRODUCTION
Acute interstitial nephritis (AIN) accounts for ∼10–20% of acute kidney injury (AKI) cases that undergo a biopsy [1–4]. While kidney function loss in AIN is reversible if timely diagnosis and management are initiated, ongoing inflammation often causes fibrosis and permanent kidney damage. Around 40–60% of patients develop chronic kidney disease (CKD) after an episode of AIN [5–10].
A precise understanding of factors contributing to recovery of kidney function after AIN can guide clinicians and patients in making informed management decisions and help researchers enroll appropriate patients in therapeutic trials for AIN. Several studies have evaluated prognostic factors in drug-induced AIN and have identified degree of interstitial fibrosis, delay in starting corticosteroid therapy and duration of exposure to culprit drugs as potential factors associated with poor prognosis [11–13]. However, these studies did not evaluate blood or urine biomarkers to determine kidney prognosis after AIN. Moreover, while corticosteroid therapy is often used in the treatment of AIN, the subgroups in which this is effective are unknown. Expert recommendations suggest corticosteroid use in those without high degree of fibrosis [14, 15]. Nonetheless, no biomarkers at diagnosis are clinically available to predict response to corticosteroid therapy. Such biomarker information could be helpful in order to avoid unnecessary complications of corticosteroid therapy in those who would not derive benefit.
In a cohort of participants prospectively enrolled before a clinically indicated kidney biopsy, we previously demonstrated that urine cytokines tumor necrosis factor (TNF)-α and interleukin (IL)-9 differentiated between AIN and other causes of AKI [16], as well as between AIN and acute tubular injury [17]. We hypothesized that prognosis after AIN is determined by a combination of reversible factors such as active inflammation (reflected by biomarkers TNF-α and IL-9) and administration of immunosuppressive therapy to treat those with inflammation, as well as irreversible factors such as kidney fibrosis and baseline estimated glomerular filtration (eGFR). Here we evaluate the ability of these factors to prognosticate kidney function 6 months after AIN diagnosis in a sub-study from the above cohort.
MATERIALS AND METHODS
Participants and settings
We prospectively enrolled participants scheduled to undergo a clinically indicated kidney biopsy at two Yale University-affiliated hospitals from January 2015 to June 2018 [17–19]. We approached all participants meeting the Kidney Disease Improving Global Outcomes (KDIGO) AKD criteria [20]. The KDIGO AKD criteria include AKI and allow for a less abrupt loss of renal function >3 months. We excluded kidney transplant recipients and participants who were undergoing a kidney biopsy to evaluate a renal malignancy. Three pathologists evaluated the biopsies to determine presence or absence of AIN and rated interstitial histological features on a previously published ordinal scale [19]. The pathologists were blinded to clinical history and official biopsy report. We included participants in whom a majority of pathologists (at least two out of three) diagnosed AIN. This study was approved by the Yale Human Investigation Committee (New Haven, CT, USA) under approval number 11110009286. All participants provided written informed consent.
Estimated GFR rate at 6 months after diagnosis
The primary outcome was 6-month estimated GFR (6 m-eGFR) after kidney biopsy diagnosis of AIN. The secondary outcome was changed in eGFR from biopsy to 6 months after biopsy. We collected clinically obtained creatinine values measured 3–9 months after biopsy and used the median value if more than one creatinine value was available. We selected this window for follow-up since most of the kidney function recovery after AIN is known to occur within 3 months after diagnosis [12, 21]. We estimated GFR using the CKD-epidemiology equation [22]. For participants on dialysis, we imputed an eGFR of 5 mL/min/1.73 m2. For those participants who had died within 6 months of diagnosis (n = 2), we used the last known creatinine to calculate eGFR (n = 1) or imputed eGFR of 5 mL/min/1.73 m2 if the participant was on dialysis before death (n = 1).
Data sources
Clinical characteristics.
We collected demographics, clinical history, laboratory results, medications (start and stop dates, dose) and nephrologists’ pre- and post-biopsy diagnosis through chart review of the Epic electronic health record (Epic Inc., Verona, WI, USA), through the Yale Joint Data Analytics Team’s HELIX data repository, and cross-referenced with patient interviews. Duration of corticosteroid therapy was calculated from the date of diagnosis (biopsy) to end date of therapy or date of 6-month creatinine measurement (whichever was earlier). Date of loss of renal function was ascertained from first evidence of loss of renal function before biopsy. Etiology of AIN (drug versus other) and culprit drug in cases of drug-induced AIN was determined through chart review by two nephrologists (M.A.P., R.L.). We also checked scanned laboratory records and called physicians’ offices if the above data were not available from the electronic health record. Any patient who received at least 20 mg/day of prednisone started within 2 weeks of biopsy was classified as having received steroids.
Urine biomarkers.
Details of sample collection, storage and biomarker measurement have been previously published [16]. Briefly, we measured biomarkers from urine samples stored at −80°C after a single-controlled thaw. Urine samples were collected a median [interquartile range (IQR)] of 3.9 (17, −1.6) hours before the biopsy. We used the Mesoscale Discovery platform to measure urine TNF-α and IL-9. Urine TNF-α and IL-9 assays showed an inter-assay coefficient of variation (CV) of 8.5 and 7.1%, respectively, and lower limit of detection of 0.10 pg/mL and 0.03 pg/mL, respectively. We performed urine albumin and creatinine measurements using a Randox RX Daytona instrument and urine dipstick analysis using Clinitek Status analyzer (Siemens Healthcare Diagnostics Inc., Tarrytown, NY, USA). We normalized urine biomarkers to urine creatinine (ng/g) to account for urine concentration differences. The personnel measuring biomarkers were blinded to the case status.
Statistical analysis
We present data as median (IQR) or count (percentage). We performed univariable comparisons using Kruskal–Wallis test, χ2 test or Fisher’s exact test as appropriate. To test the association of various parameters with kidney function, we fit three sequential linear regression models for outcome of 6 m-eGFR and predictors as various histological features, biomarkers (log-transformed and divided at median) and post-biopsy corticosteroid use (yes/no, dose, route and duration). Model 1 was univariable analysis; Models 2 and 3 were multivariable analyses controlling for variables known to be prognostic of kidney function. Model 2 controlled for baseline eGFR and albuminuria, whereas Model 3 additionally controlled for interstitial fibrosis/tubular atrophy on biopsy. For categorical variables, we replaced missing values with a separate term in analyses and for continuous variables we replaced the missing term with the median. To identify subgroups in whom corticosteroid use may be effective, we tested the interaction between corticosteroid use and various histological features and biomarkers for outcome of 6 m-eGFR after controlling for baseline eGFR and albuminuria. We present predicted eGFR in four subgroups (biomarker above versus below median and steroid use yes versus no) as the prediction of eGFR in each subgroup controlling for pre-biopsy eGFR, albuminuria and interstitial fibrosis and estimated from linear regression model using margins post-estimation command. We used Stata Statistical Software: Release 14 (StataCorp LP, College Station, TX, USA) for all analyses. All statistical tests were two-sided with a significance level of 0.05.
RESULTS
Baseline characteristics
Of the 265 participants enrolled in the Yale Biopsy cohort, we included 55 (21%) who had AIN diagnosed by at least two out of three adjudicating pathologists (Supplementary data, Figure S1). Of these, we were able to collect information on 6 m-eGFR in 51 (93%) of participants. At 6 months after AIN diagnosis, median (IQR) eGFR was 28 (13–47) mL/min/1.73 m2, 7 (14%) participants were on dialysis and 2 (4%) had died. Baseline eGFR measured 62 (47–115) days before the biopsy was 41 (27–69) mL/min/1.73 m2 and eGFR at biopsy was 12 (8–21) mL/min/1.73 m2 (Figure 1). 6 m-eGFR was 11 (4–34) mL/min/1.73 m2 lower than baseline eGFR and 22 (67%) participants had 6 m-eGFR that was at least 25% lower than baseline eGFR. Baseline characteristics of these participants are presented in Table 1. The participants had a median age of 58 (43–68) years, 28 (55%) were female and 12 (24%) were African-American. Most (61%) had AKI at diagnosis and 3 (6%) were on dialysis. Forty-three (84%) of the participants received corticosteroid therapy after AIN diagnosis; duration from loss of kidney function to corticosteroid initiation was 7 (4–32) days and corticosteroid therapy was continued for 40 (17–66) days.
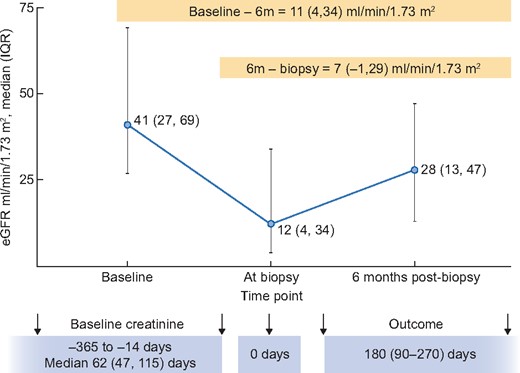
eGFR at various time-points around AIN diagnosis. Baseline eGFR was obtained 62 (47–115) days before biopsy. At biopsy eGFR is based on last measured creatinine before biopsy and after biopsy eGFR is calculated from serum creatinine 3–6 months after biopsy or imputed as last known eGFR in those who died or as 5 ml/min for those who were on dialysis.
Patient characteristics by 6 m-eGFR
| Characteristic | All (n = 51) |
|---|---|
| Demographics | |
| Age, years | 58 (43–68) |
| Female (%) | 28 (55) |
| Black race (%) | 12 (24) |
| Diabetes (%) | 15 (29) |
| Hypertension (%) | 39 (76) |
| Chronic kidney disease (%) | 34 (74) |
| Features at biopsy | |
| Location | |
| Floor (%) | 35 (69) |
| Intensive care unit (%) | 3 (6) |
| Outpatient (%) | 13 (25) |
| Acute kidney disease (excluding AKI) (%) | 20 (39) |
| AKI (%) | 31 (61) |
| Stage 1 (%) | 24 (77) |
| Stage 2 or higher (%) | 7 (23) |
| Dialysis (%) | 3 (6) |
| Urine output, mL | 1200 (350–1700) |
| Baseline laboratory features | |
| Serum creatinine, mg/dL | 1.6 (1.0–3.0) |
| eGFR, mL/min/1.73 m2 | 41 (29–66) |
| Urine protein to creatinine ratio, mg/mg | 0.9 (0.4–3.5) |
| Laboratory values at biopsy | |
| Serum creatinine, mg/dL | 3.8 (2.4–6.1) |
| eGFR, mL/min/1.73 m2 | 14.7 (8.9–25.1) |
| Blood urea nitrogen, mg/dL | 40 (30–78) |
| Hemoglobin level, g/dL | 9.8 (8.4–10.9) |
| Platelets (a1000/mm3) | 254 (192–323) |
| Blood eosinophil count/mm3 | 224 (126–432) |
| Urine albumin to creatinine ratio, mg/mg | 0.2 (0.1–1.8) |
| Medication use | |
| Proton pump inhibitor use (%) | 20 (39) |
| Non-steroidal anti-inflammatory drug use (%) | 12 (24) |
| Antibiotic use (%) | 20 (39) |
| Management characteristics | |
| Drug-induced AIN (%) | 28 (55) |
| Days of drug exposurea | 61 (21–269) |
| Days from AKI to drug withdrawala | 0 (−4 to 14) |
| Days from biopsy to drug withdrawala | −2 (−10 to 7) |
| Corticosteroid therapy (%) | 43 (84) |
| Days from loss of kidney function to steroid therapyb | 9 (4–35) |
| Days from biopsy to steroid therapyb | 1 (0–5) |
| Number of days of steroid therapyb | 40 (17–66) |
| Route of first steroid dose (IV)b (%) | 10 (23) |
| Days from loss of kidney function to biopsy | 7 (4–32) |
Only includes those with drug-induced AIN. bOnly includes those who received corticosteroids.
Association of clinical characteristics, histological features and corticosteroid therapy with 6 m-eGFR
Lower baseline eGFR and higher albuminuria were associated with lower 6 m-eGFR (Table 2). In a model controlling for baseline eGFR and albuminuria, serum creatinine, eGFR and blood urea nitrogen at the time of biopsy were not associated with 6 m-eGFR. We also noted that those with drug-induced AIN had higher 6 m-eGFR. Among participants with drug-induced AIN, those with longer duration of exposure to culprit drug had lower 6 m-eGFR. Corticosteroid therapy, dose of corticosteroids and initial route of therapy were not associated with 6 m-eGFR. Among histological features, we noted that higher interstitial fibrosis was associated with lower 6 m-eGFR whereas acute tubular injury was associated with higher 6 m-eGFR (Table 3). Degree of interstitial infiltrate was associated with higher eGFR only after controlling for interstitial fibrosis (Table 3, Model 3). Glomerulosclerosis was not associated with eGFR after controlling for degree of albuminuria.
Association of baseline and management characteristics with 6 m-eGFR in participants with biopsy-proven AIN
| 6 m-eGFR, mL/min/1.73 m2 | ||
|---|---|---|
| Characteristic | Model 1 | Model 2 |
| Age, per year | 2.7 (−2.0 to 7.5) | 1.1 (−3.3 to 5.5) |
| Female | −2.0 (−16.2 to 12.3) | 4.5 (−7.3 to 16.3) |
| Black race | −8.8 (−25.3 to 7.8) | 0.2 (−13.9 to 14.2) |
| Diabetes | −17.6 (−32.4 to −2.9) | −12.8 (−25.2 to −0.5) |
| Hypertension | −21.0 (−36.6 to −5.4) | −18.2 (−32.7 to −3.7) |
| CKD | −14.5 (−30.8 to 1.8) | 18.8 (−2.6 to 40.2) |
| Inpatient | 1.7 (−14.6 to 18.0) | −0.7 (−14.0 to 12.6) |
| AKI stage | 3.5 (−7.2 to 14.2) | 0.0 (−8.9 to 8.9) |
| Dialysis | 12.8 (−17.5 to 43.1) | 11.1 (−13.3 to 35.5) |
| Baseline features (pre-biopsy) | ||
| Serum creatinine, per mg/dL change | −4.9 (−8.9 to −0.8) | −0.3 (−4.8 to 4.3) |
| Estimated GFR/mL/min change | 0.5 (0.2 to 0.7) | 0.4 (0.2 to 0.6) |
| Albuminuria/mg/mg change | −7.4 (−11.8 to −3.1) | −5.4 (−9.4 to −1.4) |
| Features at biopsy | ||
| Serum creatinine/mg/dL change | −2.8 (−5.2 to −0.3) | −0.8 (−3.0 to 1.5) |
| Estimated GFR/mL/min change | 0.8 (0.2 to 1.3) | 0.3 (−0.2 to 0.8) |
| Blood urea nitrogen/mg/dL | −0.3 (−0.5 to −0.1) | −0.2 (−0.4 to 0.0) |
| Hemoglobin/g/dL | −0.6 (−4.4 to 3.2) | 0.5 (−2.6 to 3.6) |
| Platelet count/1000/mm3 | 0.0 (−0.1 to 0.1) | 0.0 (0.0 to 0.1) |
| Eosinophil count/100/mm3 | 1.2 (0.0 to 2.3) | 1.0 (0.1 to 1.9) |
| AIN management | ||
| Drug-induced AIN | 18.9 (5.7 to 32.1) | 13.0 (1.1 to 25.0) |
| Days of drug exposurea | −8.0 (−14.8 to −1.2) | −7.3 (−13.3 to −1.4) |
| Days from AKI to drug withdrawala | −3.9 (−11.5 to 3.7) | −6.0 (−12.3 to 0.2) |
| Days from biopsy to drug withdrawala | −4.6 (−14.9 to 5.7) | −1.3 (−11.4 to 8.8) |
| Corticosteroid therapy | 10.6 (−8.7 to 29.9) | 9.9 (−5.9 to 25.6) |
| Days from loss of kidney function to steroid therapyb | −2.9 (−8.8 to 3.0) | −1.3 (−5.6 to 3.0) |
| Days from biopsy to steroid therapy, per doublingb | −2.4 (−10.7 to 5.9) | −2.2 (−8.2 to 3.7) |
| Number of days of steroid therapy, per doublingb | 3.5 (−2.9 to 9.9) | 4.9 (−0.1 to 9.9) |
| Route of first steroid dose (IV versus PO)b | 15.4 (−3.3 to 34.1) | 9.5 (−6.2 to 25.2) |
| Corticosteroid dose, per doubling | 0.0 (−0.3 to 0.4) | 0.1 (−0.2 to 0.4) |
| Days from AKI to biopsy | −2.5 (−7.6 to 2.6) | −2.5 (−6.9 to 1.9) |
Model 1: Univariable. Model 2: Controls for baseline eGFR and albuminuria. P<0.05 are shown in bold.
Only includes those with drug-induced AIN. bOnly includes those who received corticosteroids. Beta-coefficient indicates 6 m-eGFR per doubling (per log2 change) or presence of predictor (present versus absent).
Association of histological features in patients with AIN
| 6m-eGFR, mL/min/1.73 m2 (95% CI ) | ||||
|---|---|---|---|---|
| Histological feature | Severity | Model 1 | Model 2 | Model 3 |
| Infiltrate | <25% | Ref. | Ref. | Ref. |
| 26–50% | 9.4 (−8.5 to 27.2) | 10.3 (−4.2 to 24.7) | 7.8 (−5.3 to 20.9) | |
| >50% | 13.4 (−4.3 to 31.0) | 10.7 (−3.8 to 25.2) | 14.4 (1.2 to 27.6) | |
| Eosinophils | None | Ref. | Ref. | Ref. |
| 0–5/HPF | −6.3 (−27.1 to 14.6) | −1.6 (−18.9 to 15.7) | −4.6 (−19.9 to 10.8) | |
| >5/HPF | −4.3 (−24.3 to 15.6) | −1.6 (−17.9 to 14.7) | −8.2 (−23.3 to 6.8) | |
| IFTA | <25% | Ref. | Ref. | Ref. |
| 26–50% | −24.1 (−38.3 to −9.9) | −14.9 (−29.8 to −0.1) | −14.6 (−29.3 to 0.0) | |
| >50% | −40.3 (−54.8 to −25.8) | −27.6 (−44.0 to −11.2) | −29.8 (−46.3 to −13.3) | |
| Tubulitis | 1-5 cells/HPF | Ref. | Ref. | Ref. |
| >5 cells/HPF | 5.4 (−14.0 to 24.9) | −1.3 (−17.3 to 14.7) | −6.7 (−21.7 to 8.4) | |
| ATI | <25% | Ref. | Ref. | Ref. |
| 26–50% | 16.2 (−2.8 to 35.2) | 16.8 (1.8 to 31.8) | 10.4 (−4.2 to 25.0) | |
| >50% | 13.9 (−4.4 to 32.2) | 19.4 (4.6 to 34.1) | 11.5 (−3.7 to 26.7) | |
| Glomerulosclerosis | Per 10% | −4.1 (−6.2 to −2.1) | −1.4 (−3.9 to 1.0) | −0.7 (−3.0 to 1.7) |
Histological features determined upon adjudication by three pathologists except glomerulosclerosis which was collected from official biopsy reports. Model 1: Univariable. Model 2: Controls for baseline eGFR and albuminuria. Model 3: Model 2 + interstitial fibrosis and infiltrate. P<0.05 are shown in bold. HPF, high power field; Ref., reference group.
Biomarkers and 6 m-eGFR
Median (IQR) urine IL-9 and TNF-α levels among the AIN participants were 0.66 (0.22–2.69) ng/g and 1.82 (0.41–14.49) ng/g, respectively. Urine IL-9 and TNF-α were not associated with 6 m-eGFR after AIN (Supplementary data, Table S1). However, we noted an interaction between urine biomarkers and corticosteroid therapy on the outcome of 6 m-eGFR such that higher urine IL-9 was associated with lower 6 m-eGFR in those who did not receive corticosteroid therapy but not in those who received this therapy (Table 4 and Figure 2). We did not note similar results for association of urine TNF-α and 6 m-eGFR.
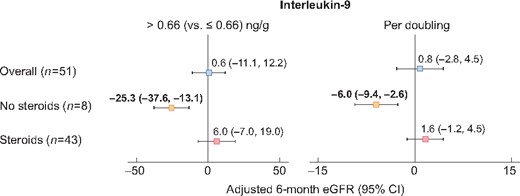
Association of urine IL-9 with 6 m-eGFR in patients with AIN stratified by corticosteroid use after diagnosis. Linear regression analysis for outcome of 6 m-eGFR controlling for baseline eGFR and albuminuria predictors as urine IL-9 by median and per-log change. Interaction P-values 0.07 and 0.11, respectively.
Association of biomarkers of inflammation and 6 m-eGFR by steroid use after biopsy
| Above versus below median | Per doubling | |||||
|---|---|---|---|---|---|---|
| Biomarker | 6m-eGFR, mL/min/1.73 m2 (95% CI) | P-value | Interact P-value | 6m-eGFR, mL/min/1.73 m2 (95% CI) | P-value | Interact P-value |
| Urine IL-9 | ||||||
| Overall | 0.6 (−11.1 to 12.2) | 0.92 | 0.8 (−2.8 to 4.5) | 0.66 | ||
| No steroids | −25.3 (−37.6 to −13.1) | 0.005 | 0.07 | −6.0 (−9.4 to −2.6) | 0.01 | 0.11 |
| Steroids | 6.0 (−7.0 to 19.0) | 0.36 | 1.6 (−1.2 to 4.5) | 0.25 | ||
| Urine TNF-α | ||||||
| Above median | −2.0 (−13.9 to 9.8) | 0.73 | 0.0 (−2.7 to 2.6) | 0.98 | ||
| No steroids | −17.7 (−48.7 to 13.3) | 0.19 | 0.50 | −3.6 (−9.8 to 2.6) | 0.16 | 0.42 |
| Steroids | −0.1 (−13.4 to 13.2) | 0.99 | 0.3 (−1.7 to 2.4) | 0.74 | ||
Linear regression analysis for outcome of 6 m-eGFR controlling for pre-biopsy eGFR and albuminuria. P<0.05 are shown in bold.
To test if biomarkers could guide corticosteroid therapy, we tested the effect of corticosteroid therapy use on 6 m-eGFR stratified by urine biomarker level. We noted that corticosteroid therapy use was associated with higher 6 m-eGFR in those with urine IL-9 above median value (0.66 ng/g of urine creatinine) but not those with lower biomarker values (Figure 3). However, we did not observe a similar effect for urine TNF-α or other baseline characteristics (Supplementary data, Table S2).
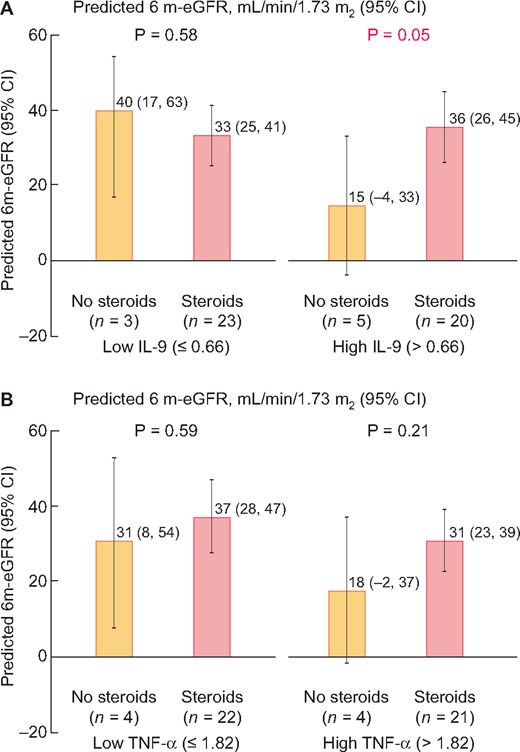
Predicted 6 m-eGFR rate in groups with or without corticosteroid use stratified by urine biomarker level. Predicted 6 month eGFR in subgroup of patients with or without corticosteroid use by biomarker level above or below median (A, IL-9 and B, TNF-α) controlling for baseline eGFR and albuminuria.
Predictors of kidney function recovery after AIN
Median kidney function recovery defined as change in eGFR from diagnosis to 6 months after diagnosis was 7 (−1 to 29) mL/min/1.73 m2 and 28 (55%) had 6 m-eGFR that was at least 25% higher than eGFR at biopsy. In a model controlling for baseline eGFR and albuminuria, history of hypertension, higher albuminuria and higher number of days on culprit drug were associated with lower recovery in eGFR (Supplementary data, Table S3). Among the histological features, higher infiltrate and lower fibrosis were associated with higher recovery of kidney function. Steroid therapy was associated with higher recovery in eGFR [Steroids versus no steroids, 16.2 (1.0–31.4) mL/min], whereas delay in initiation of steroids was associated with lower eGFR recovery. IL-9 and TNF-α were not associated with change in eGFR. We noted a trend toward higher eGFR increase with steroid use in those with high urine IL-9 but not in others (Supplementary data, Figure S2).
DISCUSSION
In a prospective cohort of participants with biopsy-proven, adjudicated AIN, we evaluated the association of urine IL-9 and TNF-α with 6 m-eGFR after biopsy. We found that higher urine IL-9 levels were associated with lower 6 m-eGFR only in those who did not receive corticosteroid therapy. Treatment with corticosteroids was associated with higher 6 m-eGFR in those with higher IL-9 and higher baseline eGFR.
An episode of AIN usually leads to permanent kidney damage and loss of kidney function [13] and only a minority of patients achieve complete recovery of kidney function [11, 12, 23, 24]. Epidemiological studies noted a higher risk of CKD and end stage kidney disease (ESKD) in users of proton pump inhibitors, a known cause of AIN [25–33]. Similar to prior studies, we noted that higher fibrosis was associated with lower kidney function 6 months after AIN diagnosis [5, 11, 12]. This is expected since fibrosis is believed to be irreversible and is associated with kidney disease prognosis in various other kidney diseases [34, 35]. We also found that higher interstitial infiltrate was associated with better kidney function. Such association of interstitial infiltrate with higher eGFR on follow-up was also noted in the Boston Kidney Biopsy Cohort, which included a broad group of kidney pathology diagnoses [36] and in a recent study of 49 patients with AIN [37]. Presence of interstitial infiltrate is a potentially treatable pathology; it could represent responsiveness to immunosuppressive therapy and thus be associated with higher kidney function. However, both of these prognostic factors require performance of a kidney biopsy and none of the aforementioned studies evaluated biomarkers to determine prognosis in patients with AIN.
In this study, we examine the association of urinary biomarkers IL-9 and TNF-α with 6 m-eGFR after AIN diagnosis. We previously demonstrated that IL-9 and TNF-α are associated with AIN diagnosis and can distinguish AIN from other causes of AKI [16]. IL-9, which is produced by a sub-type of CD4+ T-helper cells termed TH9 cells, leads to mast cell infiltration and degranulation, and has a pathogenic role in allergic diseases such as food allergy, atopic dermatitis and asthma [38]. TNF-α is an inflammatory cytokine produced by a variety of cells including, in allergic diseases, by mast cells, from which it is released during degranulation. We find that while these biomarkers were not associated with 6 m-eGFR in the overall cohort, IL-9 level was associated with lower 6 m-eGFR in those who did not receive corticosteroid therapy. A possible explanation for this finding is that higher inflammation is associated with kidney damage only if it is not treated with corticosteroid therapy. These findings provide novel insights into recovery of kidney function in patients with AIN.
Management of patients with AIN often involves use of corticosteroid therapy in addition to discontinuation of the offending medication. Corticosteroid therapy is associated with risks and may not be appropriate for all patients with AIN. We noted that corticosteroid therapy was not associated with higher 6 m-eGFR in the overall cohort. However, we found that those with more severe inflammation indicated by higher level of urine IL-9 had higher 6 m-eGFR with corticosteroid use. In a sensitivity analysis, we noted that corticosteroid therapy was associated with a greater increase in eGFR from biopsy to 6 months after biopsy and this increase was more pronounced in those with high urine IL-9 levels.
If validated, these findings and results from our prior study on diagnosis of AIN can help clinicians avoid kidney biopsy in a subset of patients. Our prior study showed that a high urine IL-9 level (>2.53 ng/g; specificity, 90%) indicates diagnosis of AIN, a low IL-9 level (<0.41 ng/g; sensitivity, 87%) indicates a diagnosis other than AIN, whereas those with urine IL-9 value between 0.41 and 2.53 would still need a biopsy (representing ∼35% of all participants) [16]. Findings presented here could help guide researchers to select the most appropriate patients with AIN to treat with corticosteroid or other immunosuppressive therapy in clinical trials; those with high urine IL-9 levels (>0.66 ng/g; representing 50% of patients with AIN) are most likely to respond to corticosteroid therapy.
Our study had several strengths. First, the prospective enrollment allowed for standardized patient recruitment and data collection. Second, three pathologists adjudicated histological slides to determine AIN diagnosis and rated interstitial histological features on an ordinal scale. Third, we attained higher level of ascertainment of outcome than prior studies and very few patients were lost to follow-up. Our study also had some limitations. First, these results are from two affiliated medical centers where practice patterns may be different than other centers, which limit generalizability to the overall population with AIN. Second, a high percentage of patients in our study were prescribed corticosteroids by their physicians. As a result, despite controlling for confounders, there is a possibility of residual confounding which can only be overcome in a randomized controlled trial. Third, we did not have a replication cohort and our findings should be considered hypothesis-generating and will need confirmation in a larger external validation cohort before widespread application. Fourth, the outcome (serum creatinine level) was not assessed specifically for the purposes of this study and participants with missing outcome data may be significantly different from those on whom we have available data. However, serum creatinine measurement is standardized across the country minimizing inter-laboratory variability and only 4 (8%) participants had missing outcome data. We also did not collect information on presence of granulomas on histology and were unable to assess the association of this feature on outcomes. We did not measure conventional biomarkers of inflammation such as C-reactive protein or erythrocyte sedimentation rate and thus could not evaluate these as predictors of outcomes in AIN.
In conclusion, we found that higher urine IL-9 levels were associated with lower kidney function only in patients who did not receive corticosteroid therapy. We also noted that corticosteroid use was most beneficial in the subgroup with higher urine IL-9 and higher kidney function before onset of AIN. Our findings could help researchers to select appropriate patients for corticosteroid therapy in clinical trials and could also assist clinicians in providing more accurate estimate of prognosis to patients with AIN.
SUPPLEMENTARY DATA
Supplementary data are available at ndt online.
ACKNOWLEDGEMENTS
We wish to thank the participants of the Yale biopsy study without whom this study would not have been possible. We also wish to thank Bettina Cheung, BS, Selin Isguven, BS and Keith Rentfro, MBA for their assistance with patient recruitment.
FUNDING
This study was supported by National Institutes of Health awards K23DK117065 (D.G.M.), T32DK007276 (L.G.C. and DGM), K24DK090203 (C.R.P.), R01DK113191 (F.P.W.), UG3DK114866 (C.R.P. and F.P.W.), P30DK079310 (C.R.P., L.G.C., F.P.W. and D.G.M.). The content is the responsibility of the authors alone and does not necessarily reflect the views or policies of the Department of Health and Human Services, nor does mention of trade names, commercial products, or organizations imply endorsement by the US Government. These organizations were not involved in study design, analysis, interpretation or manuscript creation.
AUTHORS’ CONTRIBUTIONS
D.G.M., F.P.W., R.L., M.A.P., L.G.C. and C.R.P were involved in designing research studies. D.G.M. and W.O conducted the experiments. The data was acquired by D.G.M., L.K., W.O., G.M., M.K., M.K., R.L. and M.A.P. D.G.M.; F.P.W. and C.R.P analyzed the data. All authors were involved in the writing of the manuscript.
CONFLICT OF INTEREST STATEMENT
C.R.P. and D.G.M. are named inventors in a provisional patent number 62/716,465 titled ‘System and methods for diagnosing acute interstitial nephritis’. Dr Parikh is on the Advisory Board of RenalytixAI, and owns equity in the same. Dr Parikh is on the Data Safety and Monitoring Board of Genfit. No other author has any conflict of interest relevant to this publication.


Comments