The COVID-19 pandemic has had a significant impact on trade between the United States and China so far. As workers became sick or were quarantined, factories temporarily closed, disrupting international supply chains. At the same time, the trade relationship between the United States and China has been characterized by rising protectionism and heightened trade policy uncertainty over the last few years. Against this background, this post examines how the recent period of economic disruptions in China has affected U.S. imports and discusses how this episode might impact firms’ supply chains going forward.
Based on data for the first four months of 2020, this post shows that U.S. imports from China declined sharply in February and March, before bouncing back in April. The decline was partially offset by growing imports from countries outside of China, such as Vietnam, India, and Bangladesh. As perhaps could have been expected, firms with established supply chain relationships in these countries benefited the most from the disruptions in China. Those reliant on China were largely unable to find suppliers in other countries on such short notice. Additionally, large U.S. importers were more likely to continue relationships with their Chinese suppliers during the shutdown than small importers were.
A Snapshot of U.S. Trade
The analysis presented here is based on transaction-level data of U.S. imports from Descartes Datamyne, a commercial vendor that obtains all customs records for import transactions made by vessel from U.S. Customs and Border Protection via a daily electronic feed. (Note that the data were purchased by the Federal Reserve Bank of New York—the vendor has no involvement with this study). Shipments by vessel account for about 60 percent of total U.S. imports. The data for each transaction generally contain the 6-digit HS code of the product shipped, country of origin, the weight of the shipment, the name of the U.S. consignee (the buyer) and the name of the foreign shipper (the seller). The information on firm names makes it possible to study the evolution of firms’ networks of trading partners. Datamyne also estimates the value of a shipment based on the reported product, its weight, and other information.
The Disruption of Trade as China Copes with the Coronavirus
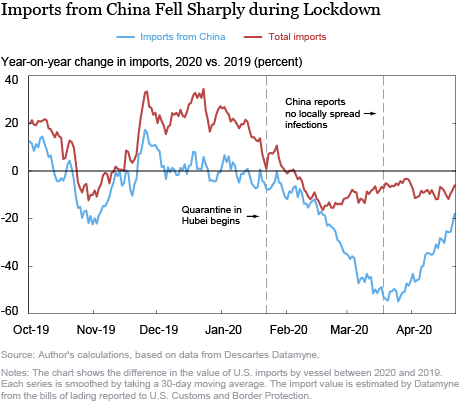
Imports from China declined sharply in the first quarter while U.S. imports overall decreased to a lesser extent. The chart below shows the percentage difference in the 30-day moving average of imports by vessel over the last six months compared to one year ago, for imports from China and for total U.S. imports. While imports from China were on average at or below their level one year prior even before the COVID-19 outbreak —due to higher U.S. tariffs and increased trade uncertainty—imports dropped sharply in February and March. This drop is consistent with the widespread quarantine measures in China starting in late January. At the trough, daily imports from China were around 50 percent lower in 2020 than one year earlier, before bouncing back toward the end of March as quarantine measures were lifted. Total U.S. imports were about 10 percent below their level one year earlier over this period.
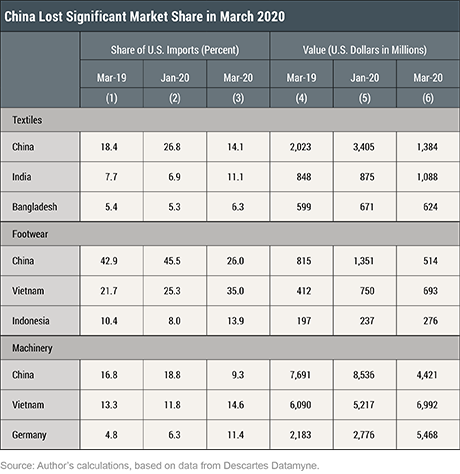
The drop in imports from China led to a significant shift in sourcing toward other countries for several product categories. The first three columns of the table below show the share of U.S. imports accounted for by different countries at three points in time: March 2019, January 2020, and March 2020. March 2019 is included here since some products display seasonality. China’s market share in textiles, footwear, and machinery declined significantly in March 2020, both when compared to March 2019 and when compared to January. At the same time, India’s and Bangladesh’s market share for textiles increased strongly, and Vietnam gained in footwear and machinery. Columns 4 to 6 highlight that these gains are not only in relative terms but also in absolute trade values. Although there is some volatility, sales by countries outside of China to the U.S. rose markedly, especially when compared to one year ago.
Supply Chain Adjustments
To what extent is the shift in aggregate imports driven by firms switching sellers? The evidence suggests that U.S. importers have not been able to fully replace their Chinese suppliers. Firms that sourced from China in January 2020 imported about 50 percent less from China in March. If these firms had been able to replace their Chinese suppliers with sellers from other countries, then their total imports in March should have been similar to those in the same month in earlier years. However, that is not the case. Consider a firm sourcing a given six-digit Harmonized System (HS6) product code from China in January and March 2020 (the “exposed” firm). Compared to a firm purchasing the same product in the same two months from a different country, the exposed firm’s total imports fell by 15 percent more between January and March than the non-exposed firm’s—after controlling for seasonal factors that were also present in earlier years. This finding suggests that exposed firms were not able to fully replace their affected suppliers with alternate sources.
Who benefited from the drop in imports from China? The analysis highlights that importers that already had relationships with non-Chinese suppliers were able to expand their import volume over this period. For example, the average firm that already sourced a given HS6 product from Vietnam in January increased its imports of that HS6 from Vietnam by 7 percent in March after controlling for seasonal factors. Similarly, a firm that already sourced from Bangladesh in January expanded its imports from that country by 16 percent. This finding is consistent with prior work suggesting that finding new suppliers and building up relationships takes time. As Chinese suppliers were no longer able to deliver, firms with established relationships in other countries stepped in and gained market share.
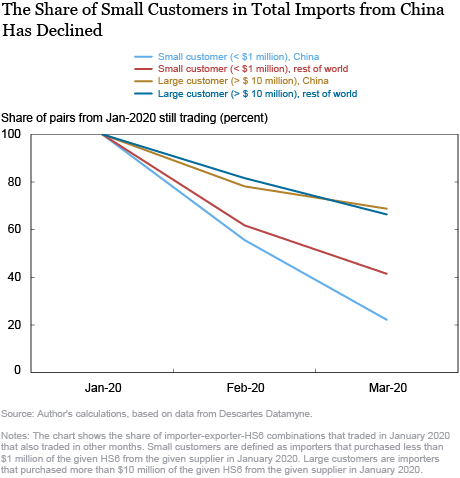
Although firms’ relationships with Chinese suppliers were severely impacted by COVID-19, not all firms were equally affected. The disruption of Chinese production disproportionately affected smaller U.S. importers. To illustrate this point, take all importer-exporter pairs trading some HS6 product in January. The chart below records the fraction of all of these importer-exporter-product combinations that traded again in February or March, where I distinguish between combinations involving a Chinese supplier and those that do not. Additionally, I define importer-exporter-HS6 combinations that transacted less than $1 million in January as involving “small customers,” and combinations trading more than $10 million in January as involving “large customers.” Note that the lines are declining, that is, not all importers buy the same product from the same exporter again after the initial January purchase. The declining share of repeat customers results for example from importers switching to a different supplier. The decline is particularly pronounced for small customers, which do not trade as often as large customers.
The key takeaway from the chart is that only relatively few small customers of Chinese suppliers made purchases in March. While 41 percent of the small customers of non-Chinese suppliers completed another purchase in March following the one in January, only 22 percent of small customers of Chinese suppliers did. At the same time, there was no such difference for large customers. In fact, large customers of Chinese suppliers were even slightly more likely to trade again in March than large customers of non-Chinese suppliers. Regression results not displayed here show that these patterns hold even for trade of the same HS6 product. The finding suggests that the orders of large customers were more likely to be fulfilled during the supply chain disruption in China than those of small ones were. One interpretation of this result could be that Chinese suppliers prioritized large customers as they became more capacity constrained due to COVID-19.
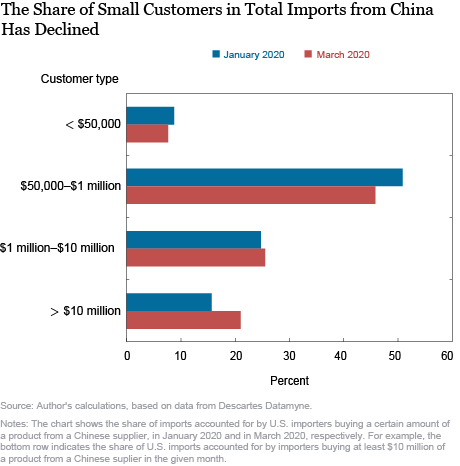
This shift toward large customers is also apparent by looking at the distribution of transactions involving Chinese suppliers. The chart below presents the fraction of imports from China, by size of the customer’s order, in January and in March 2020. The share of imports accounted for by large customers purchasing at least $10 million of a given HS6 increased by about 5 percentage points. On the other hand, the share of importer-supplier-HS6 combinations trading less than $1 million fell from 60 percent to 53 percent.
Outlook
This post has illustrated that the disruptions in China due to COVID-19 had significant effects on U.S. supply chains. Imports from China fell by about 50 percent in March relative to January. The disruption led to a shift of U.S. importers to other Asian countries, driven in particular by firms with already established relationships in these countries. While most large U.S. customers continued trading with their Chinese suppliers, smaller U.S. customers appear to have had more difficulty continuing their relationships during the COVID-19 related shutdown.
Going forward, COVID-19 is likely to give further impetus to trends that already began in previous years. It is likely to lead firms to consider bringing some critical activities back to the United States or to set up backup suppliers to reduce the firms’ exposure to any single supplier or country. While introducing such additional safeguards is going to reduce the efficiency of supply chains in normal times, it may well improve performance in the longer run by mitigating the high costs of supply chain disruptions.
 Sebastian Heise is an economist in the Federal Reserve Bank of New York’s Research and Statistics Group.
How to cite this post:
Sebastian Heise, “How Did China’s COVID-19 Shutdown Affect U.S. Supply Chains?,” Federal Reserve Bank of New York Liberty Street Economics, May 12, 2020, https://libertystreeteconomics.newyorkfed.org/2020/05/how-did-chinas-covid-19-shutdown-affect-us-supply-chains.html.
Disclaimer
The views expressed in this post are those of the author and do not necessarily reflect the position of the Federal Reserve Bank of New York or the Federal Reserve System. Any errors or omissions are the responsibility of the author.


 RSS Feed
 Follow Liberty Street Economics
Risk MGMT – many companies failed with proper Risk MGMT in which they should have had back up plans ready to go if something happened to their key/main suppliers. They also should have spread the risk, in which they could have more suppliers spread around and be able to shift production to another supplier(s). Also, they could have negotiated key supplier Insurance, with their Insurance Carriers or with Specialty Insurers, such as Lloyds of London or Bermuda Insurance Companies, to include coverage for Pandemics. The large companies or groups of companies could have created their own Insurance Captive to cover such losses.