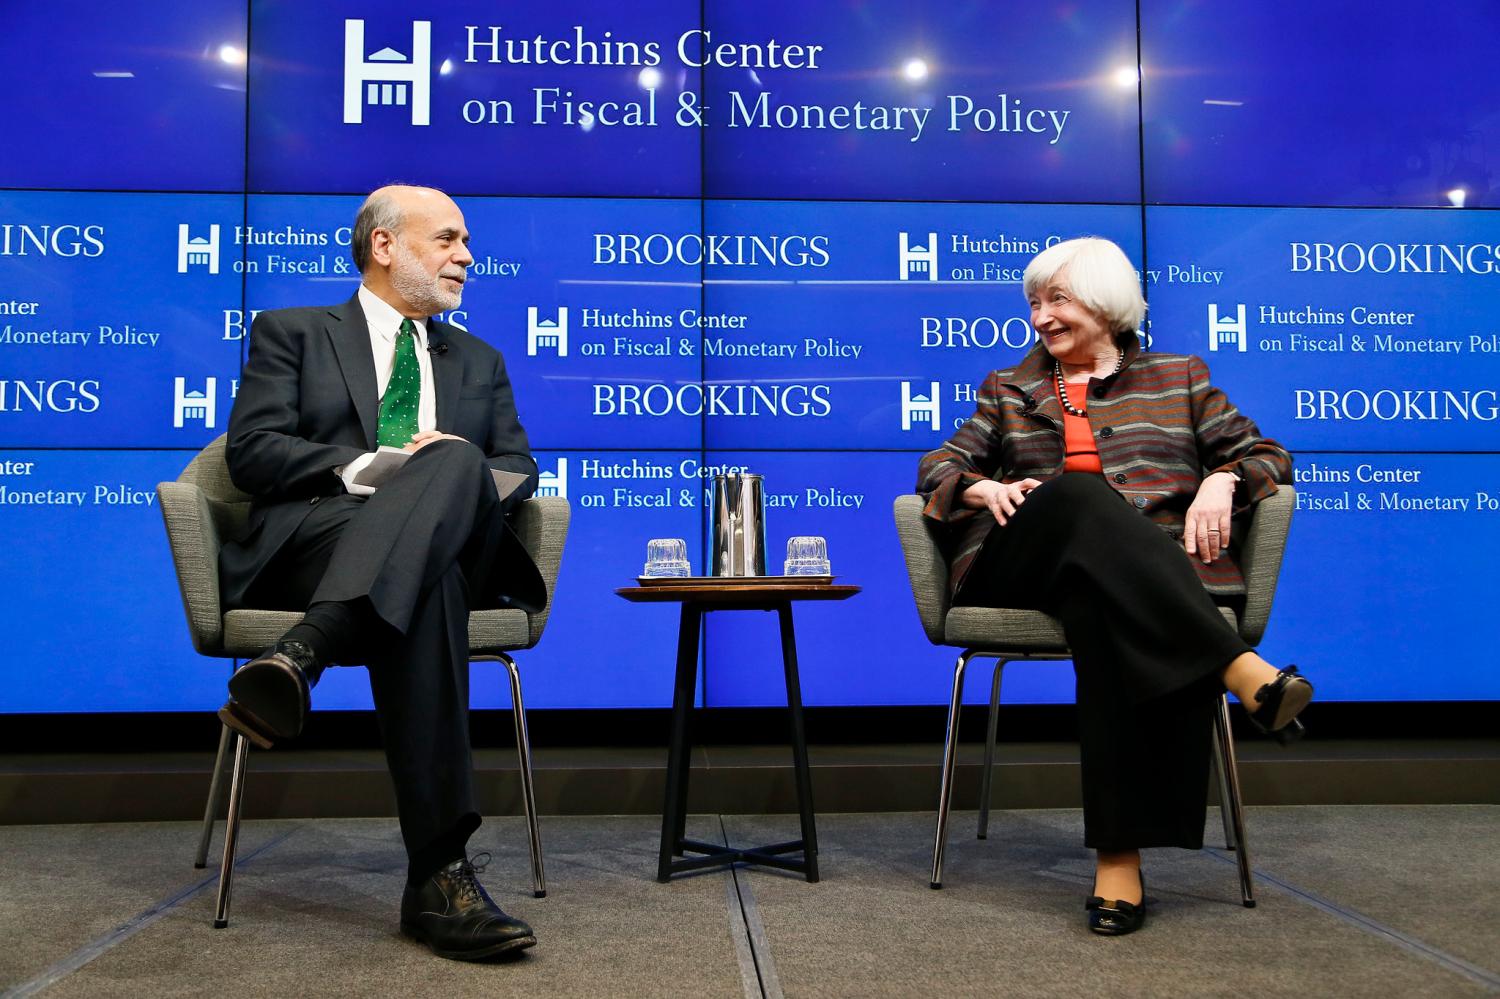
This remark was delivered at a public event, “What’s (not) up with inflation?” hosted by the Hutchins Center on Fiscal & Monetary Policy at Brookings on October 3, 2019.
It’s my pleasure to join Glenn in welcoming you to the Hutchins Center Conference on Inflation. My objective is to prepare the ground for today’s presenters by describing the puzzle we’ll be discussing and highlighting why the answer matters for policymakers and for economic performance.
The main puzzle pertaining to inflation is aptly summed up by the title of this conference: “What’s (not) up with inflation?” Inflation hasn’t moved up through an expansion that now ranks as the nation’s longest on record. Unemployment declined from about 10 percent in 2009 to 3.7 percent today—a 50 year low. Yet headline inflation over the last year, according to the Federal Reserve’s Preferred Personal Consumption Expenditures (or PCE) measure, stood at only 1.4 percent in August. Core inflation, which excludes volatile food and energy prices, came in a bit higher at 1.8 percent. The current pace is close to that in 2009. Contrast this experience with that during the long expansion of the 1960s. Unemployment declined from 6.7 percent in 1961 to 3.6 percent in 1969. Over the same period, headline PCE inflation rose from just under 1 percent to roughly 5 percent and core inflation increased by a similar amount.
The comparison…concerning the behavior of inflation…during the current expansion and that of the 1960s illustrates two robust empirical findings. First…the Phillips curve appears to have become quite flat. And second…[i]nflation expectations… have become well-anchored.
The Phillips curve has long served as the “workhorse” model of inflation and it’s used by most economists, including Federal Reserve staff, to analyze and forecast inflation trends. It posits that current inflation depends on the degree of labor market slack, on lagged inflation, and on a variety of supply shocks, including those affecting the prices of food, energy and other commodities, and the value of the dollar, which affects import prices. Various transitory factors or noise also affect inflation readings. The comparison I just described concerning the behavior of inflation as unemployment declined during the current expansion and that of the 1960s illustrates two robust empirical findings. First, the slope of the Phillips curve—a measure of the responsiveness of inflation to a decline in labor market slack—has diminished very significantly since the 1960s. In other words, the Phillips curve appears to have become quite flat. And second, inflation has become much less persistent, because the impact of lagged inflation on current inflation has declined considerably. This likely reflects the fact that inflation expectations, which affect wage and price setting, now appear to be quite stable and unresponsive to variations in actual inflation. Inflation expectations, in other words, have become well-anchored. During the 1960s and 1970s, in contrast, a rise in actual inflation appeared to boost inflation expectations considerably. High responsiveness of inflation expectations to actual inflation works to boost the longer-term response of inflation to changes in labor market slack considerably. In fact, it creates the possibility that a temporary decline in unemployment below the natural rate, or a transitory supply shock, results in a permanent increase in the rate of inflation—a so-called accelerationist Phillips curve.
An important question is just why the relationship between inflation and unemployment has become so attenuated—in the view of some observers, almost nonexistent—and our presenters today will consider some possibilities. One possibility is that labor market slack is not appropriately measured by the civilian unemployment rate. Perhaps broader measures of slack including, for example, individuals involuntarily working part-time or some who are considered to be out of the labor force entirely are relevant to wage and price inflation. The willingness of individuals considered to be out of the labor force to enter in response to strong opportunities may also restrain inflation. Prime age labor force participation has declined considerably in the United States. It moved up during the expansion but, even now, remains roughly half a percent below its level just prior to the Great Recession. Another possibility is that the flatness of the Phillips curve reflects downward rigidity of nominal wages: firms are generally reluctant to impose wage cuts on their employees and, during the early years of the Great Recession, wage inflation fell very little. Perhaps for this reason, both wage and price inflation were restrained during the recovery. The flatness of the Phillips curve might also reflect global influences with increased trade, slack in foreign economies, and the prevalence of global supply chains attenuating the influence of domestic factors on inflation. Conceivably, the flattening of the Phillips curve reflects technological or market structure factors, such as the ease of price comparisons over the internet, resulting in declining price power for domestic firms. It’s also possible that the flatness is a statistical mirage: the success of policymakers in achieving low and stable inflation, in part by accepting higher unemployment when supply shocks are pushing inflation up, could be masking a true relationship between inflation and unemployment that is stronger than it appears to econometricians. Finally, the success of policymakers in holding inflation low and stable in recent decades could explain the decline in the persistence of inflation which, in effect, flattens the slope of the longer-run Phillips curve. Longer-term inflation expectations, as measured for example by the Survey of Professional Forecasters, have been remarkably stable in the vicinity of 2 percent. Such well-anchored inflation expectations may have been fostered by the Fed’s adoption of a numerical inflation objective of 2 percent in 2012, preceded by a long period during which the Fed was committed to first bringing inflation down from unacceptably high levels and then maintaining inflation in the general vicinity of 2 percent.
[I]t may be necessary to have a hot labor market for inflation to move back to 2 percent on a stable basis. Allowing the labor market to run hot could bring substantial benefits.
What difference does it make, from a policy perspective, if the Phillips curve has flattened and if inflation has become less persistent? If the Phillips curve is very flat, and if inflation expectations are insensitive to fluctuations in actual inflation, the Federal Reserve may be able to run the economy hot, yielding significant benefits to workers, while imposing only minimal costs on society in terms of the higher inflation. Indeed, given that inflation has been so very low for so long—it’s averaged on 1.5 percent over the last decade—it may be necessary to have a hot labor market for inflation to move back to 2 percent on a stable basis. Allowing the labor market to run hot could bring substantial benefits. As Brookings economist Arthur Okun observed in 1973, in an early volume of Brookings Papers on Economic Activity, a high-pressure economy improves upward mobility. We’re seeing that in the current expansion. Those who are least advantaged in the labor market—those with less education and minorities—are experiencing the largest gains in wages and declines in unemployment. Moreover, when firms find it hard to hire they tend to lower qualifications and provide more training. We’re seeing more partnerships with community colleges and local governments to develop job market programs with promised employment to those who successfully complete them. In slack labor markets, those who “check the box” indicating a criminal record, have little chance to find work: their resumes end up quickly in the circular file. In today’s strong labor market that’s changed and such individuals are getting a chance to turn around their lives. It’s possible, albeit uncertain, that the skills and experiences these individuals are acquiring in today’s tight labor market will yield long-run benefits—enabling them to do better even if the economy experiences another downturn.
A significant benefit of better anchored inflation expectations is that they enable the Federal Reserve to all but ignore the inflationary impact of supply shocks in their conduct of monetary policy, mitigating the need for monetary policy to tighten, with negative impacts on employment, following adverse supply shocks. Well-anchored inflation expectations, in effect mitigate what might otherwise be painful conflicts between the Fed’s inflation and employment objectives. Indeed, over the last decade, US monetary policy has barely responded to movements in inflation driven by oil prices, the dollar, and other supply factors. For example, after a multiyear sequence of unanticipated oil price increases between 2004 and 2008, inflation reverted to its previous trend once oil prices stabilized. Similarly, inflation moved back up to 2 percent in 2018 after several years in which declines in oil prices and a marked appreciation of the dollar pushed inflation below the Fed’s target. In contrast, in 1973 and again in 1979, oil prices jumped markedly, producing sharp inflation spikes. In those episodes, inflation appeared to move permanently higher even after oil prices settled down.
It’s important to point out, however, that a flat Phillips curve has a downside, which is that it raises the so-called “sacrifice ratio.”
It’s important to point out, however, that a flat Phillips curve has a downside, which is that it raises the so-called “sacrifice ratio.” The sacrifice ratio measures the cost in terms of higher unemployment to lower inflation should it rise too high. With a flat Phillips curve, it’s necessary for monetary policy to create a good deal of slack in the labor market to return inflation to levels consistent with price stability. And if the flatness of the Phillips curve is a statistical mirage rather than a true change in the economy’s structure, an attempt by policymakers to exploit it could push up inflation much more than they expect. Finally, even if the Phillips curve is quite flat over some range, it’s conceivable that it could become a lot steeper if unemployment is pushed to very low levels: that is, it may be nonlinear at very low unemployment. There is some evidence of such nonlinearity, so it’s a significant policy concern.
Another policy consideration pertains to inflation persistence. Can we count on such low persistence going forward? Or might inflation revert to its earlier behavior if policymakers attempt to exploit the current benign inflation dynamics to keep unemployment low or push it yet lower? If the decline in inflation persistence reflects increased credibility of monetary policy, this valuable asset could be squandered if monetary policy persistently allows inflation to deviate from its 2 percent objective. As in the 1970s, a willingness of the Fed to tolerate inflation persistently above 2 percent could ultimately de-anchor and boost inflation expectations. Alternatively, and arguably the more relevant consideration today, a chronic failure of the Fed to stably achieve its 2 percent target could de-anchor inflation expectations on the downside, exacerbating the problems associated with the zero lower bound on policy rates and creating significant deflationary risks.
To conclude, our panelists will address questions that are vitally important for economic policy and economic performance in the years ahead and I look forward to today’s discussions.


